
Potential of Alkali–Silica Reactivity of Unexplored Local Aggregates as per ASTM C1260


 , , ,
, , , 
Abstract
:1. Introduction
2. Materials and Specimen Preparation
3. Experimental Procedures
4. Results and Discussion
4.1. Binder and Aggregates Characteristics
4.2. Petrographic Examination of Aggregate Samples
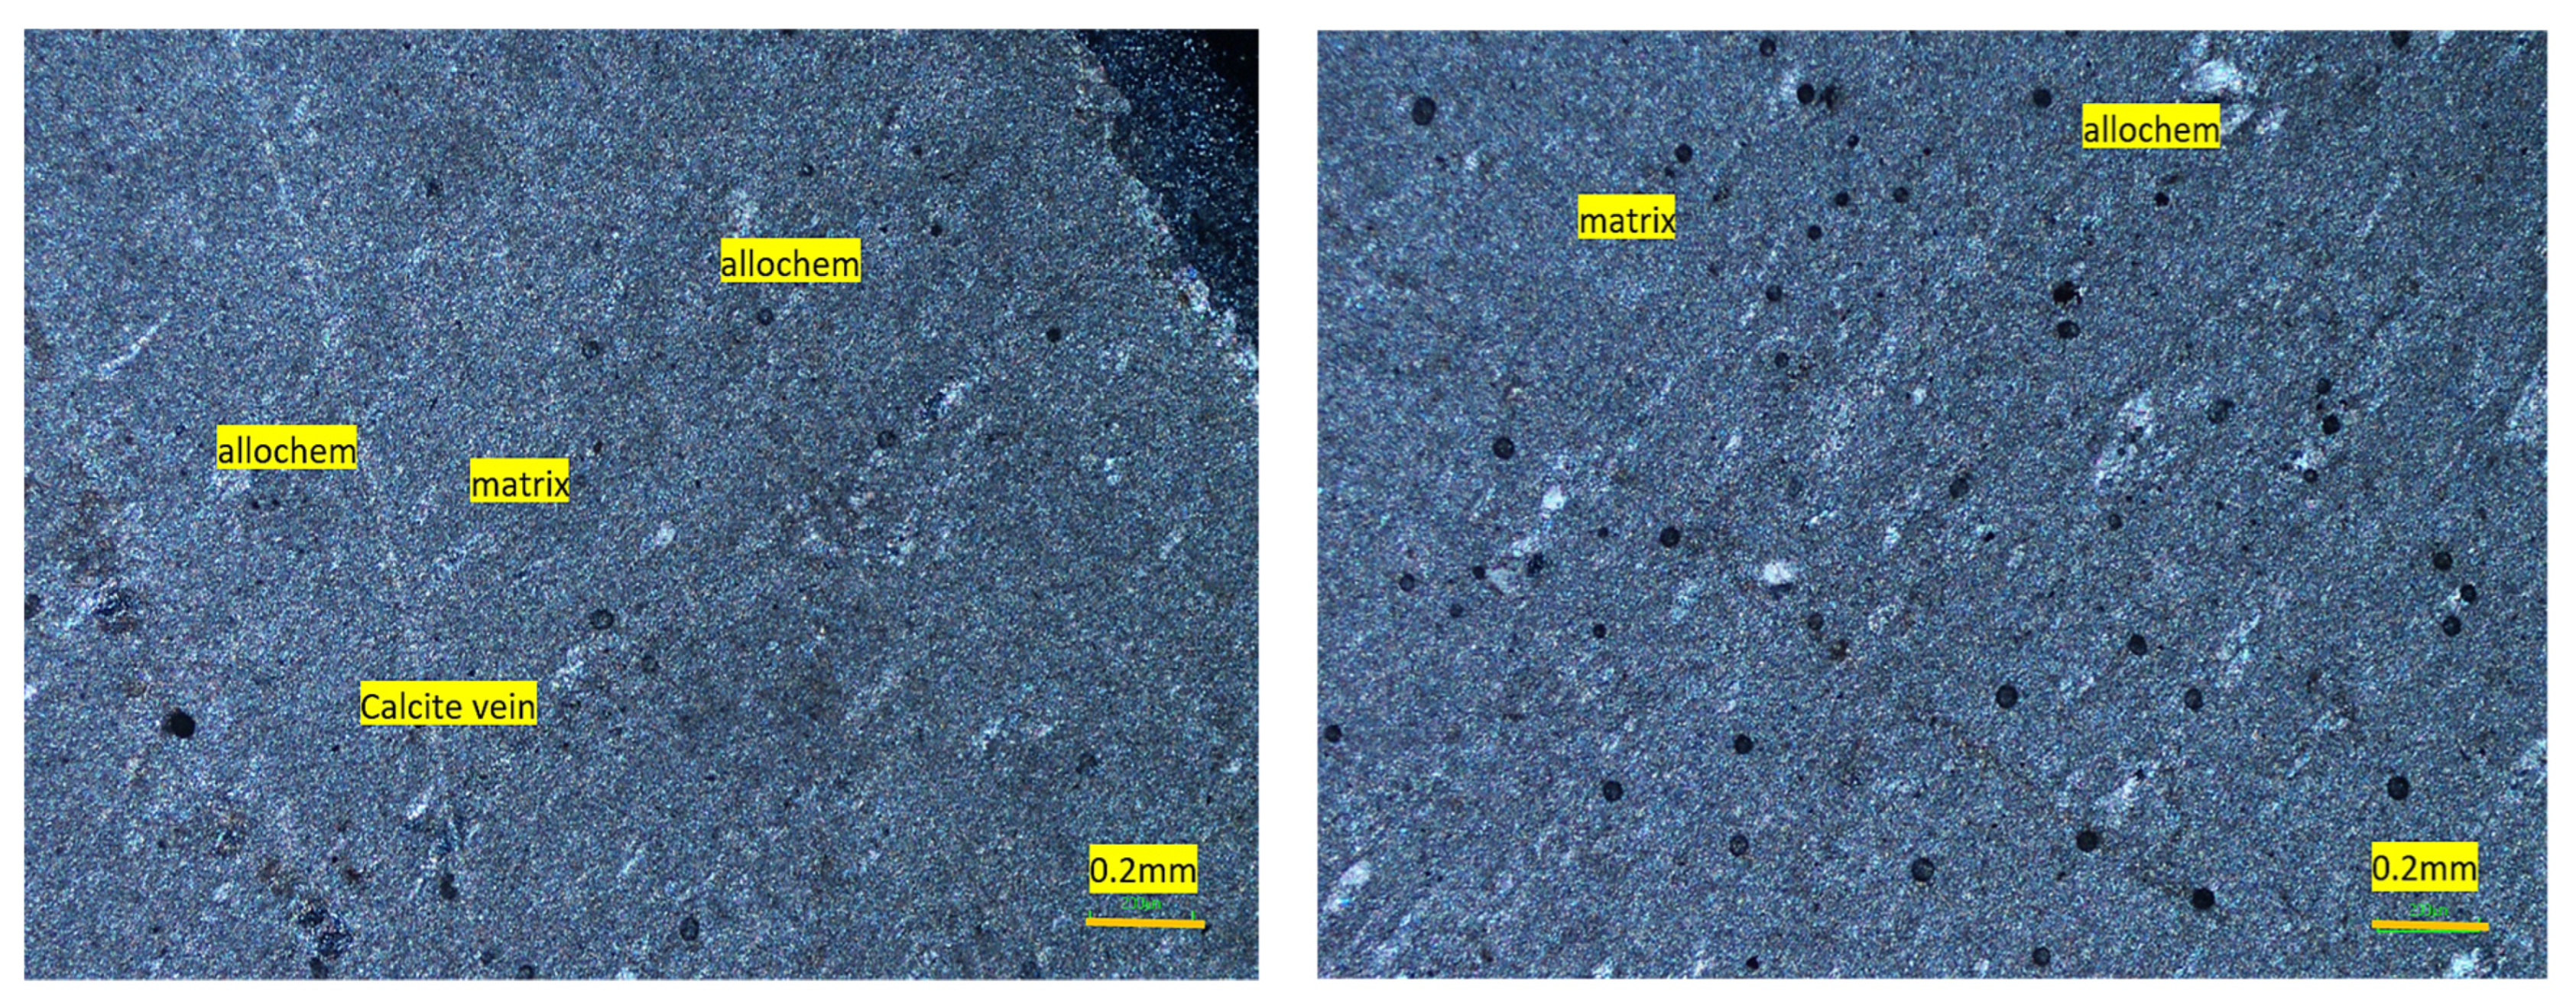
4.2.1. Shalozan Aggregate
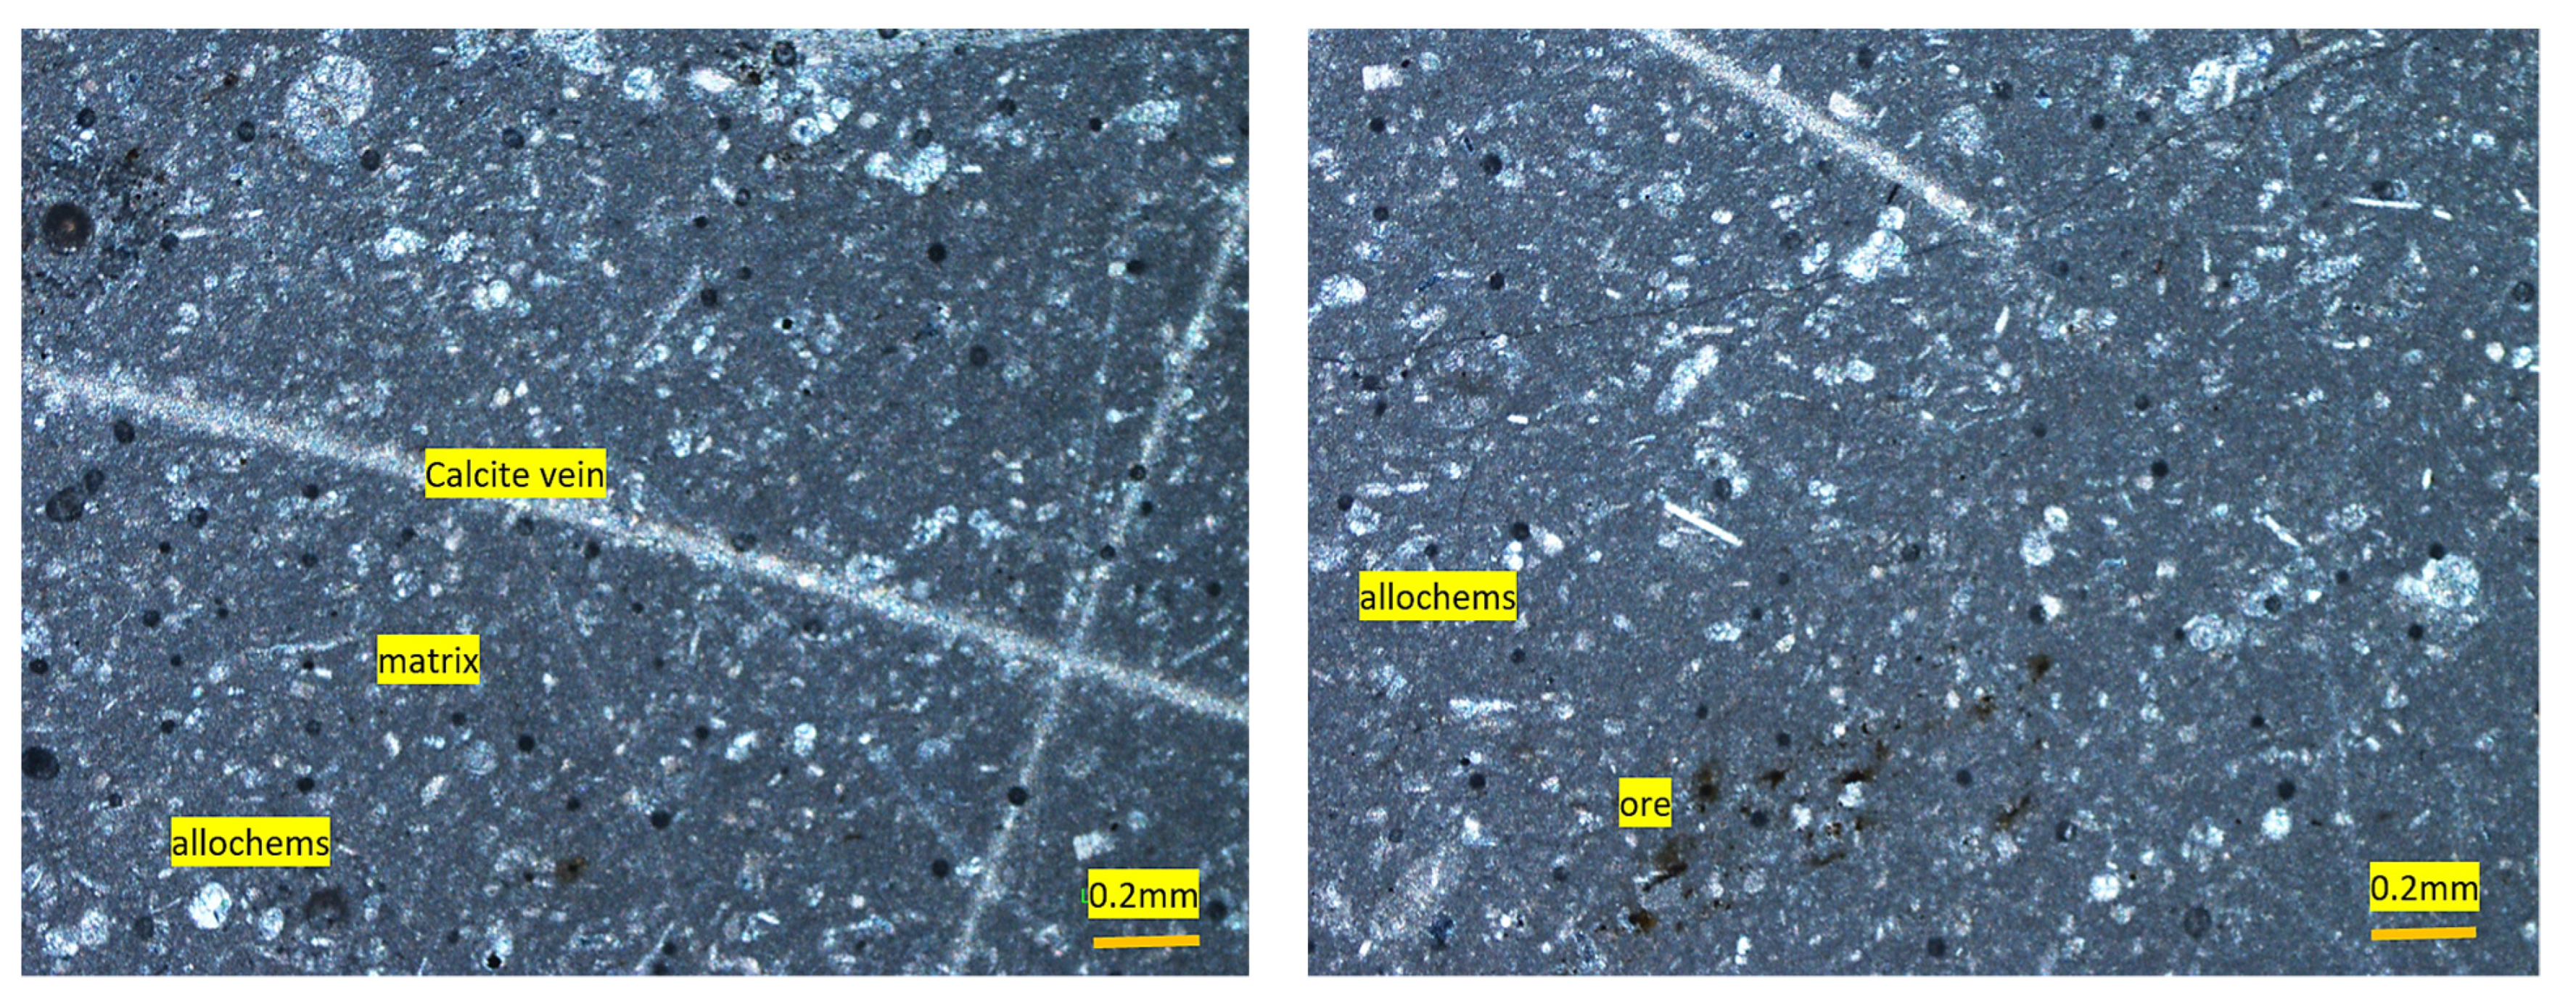
4.2.2. Abbottabad Aggregate
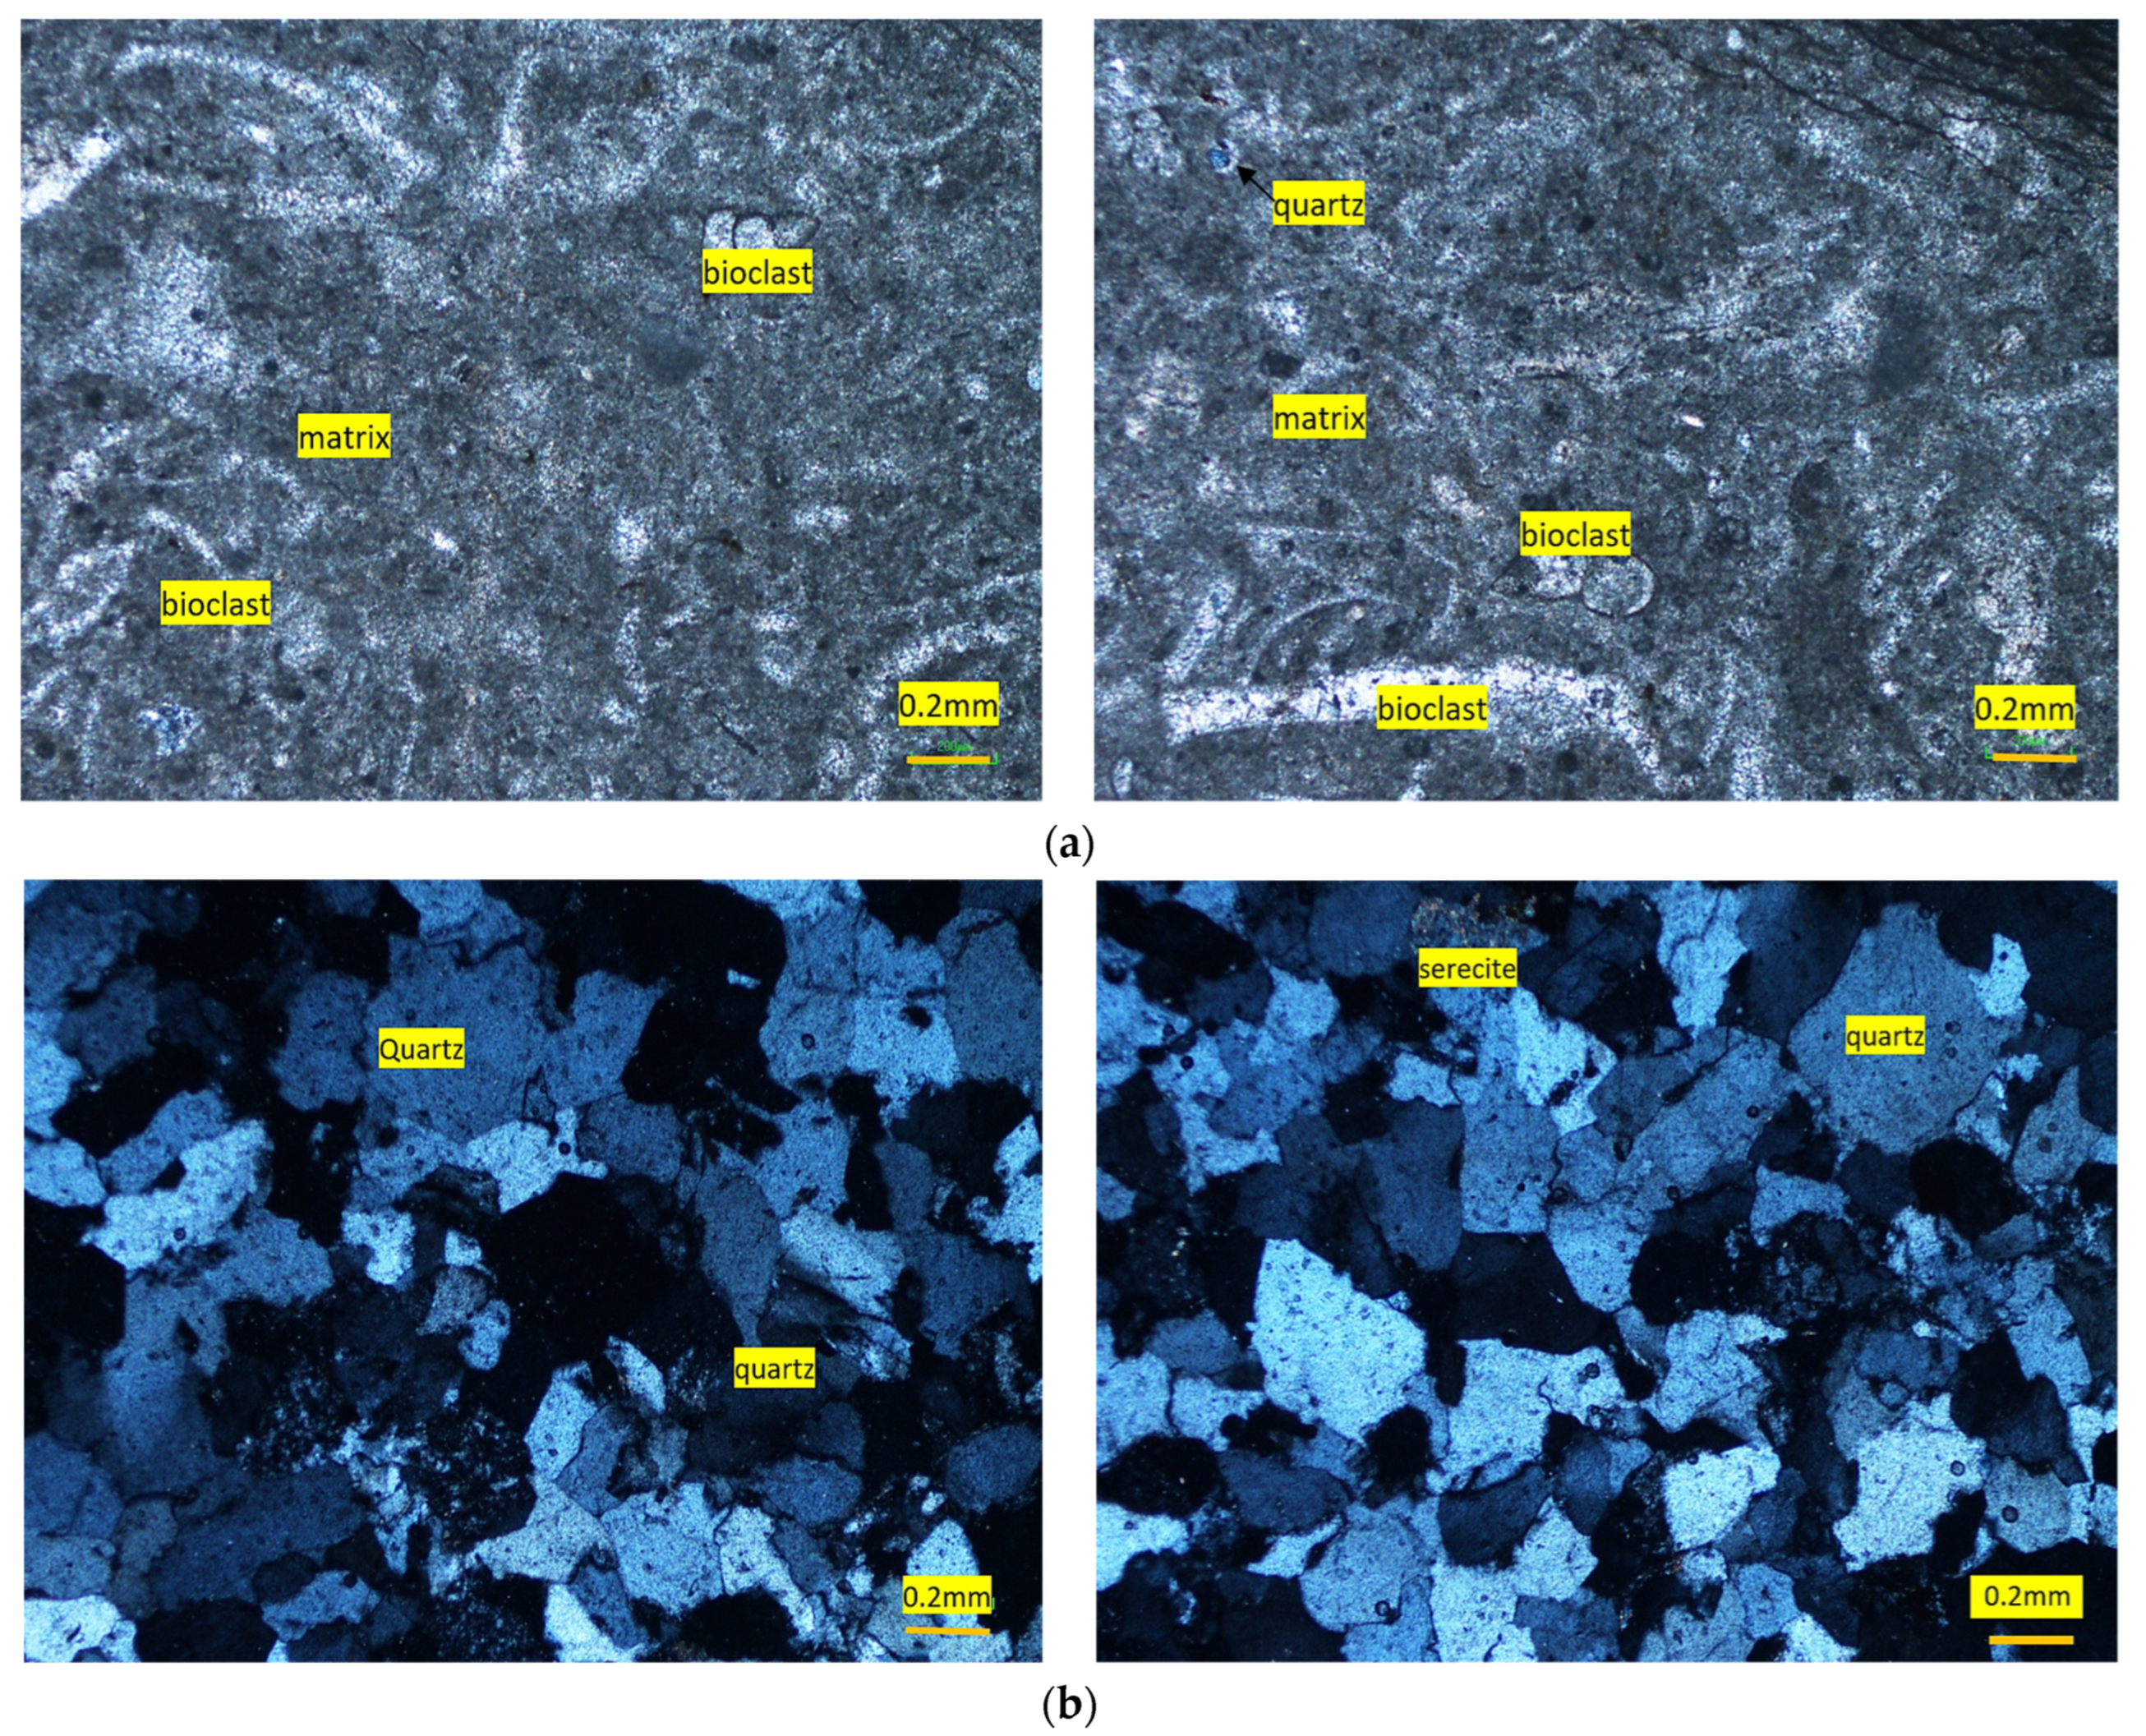
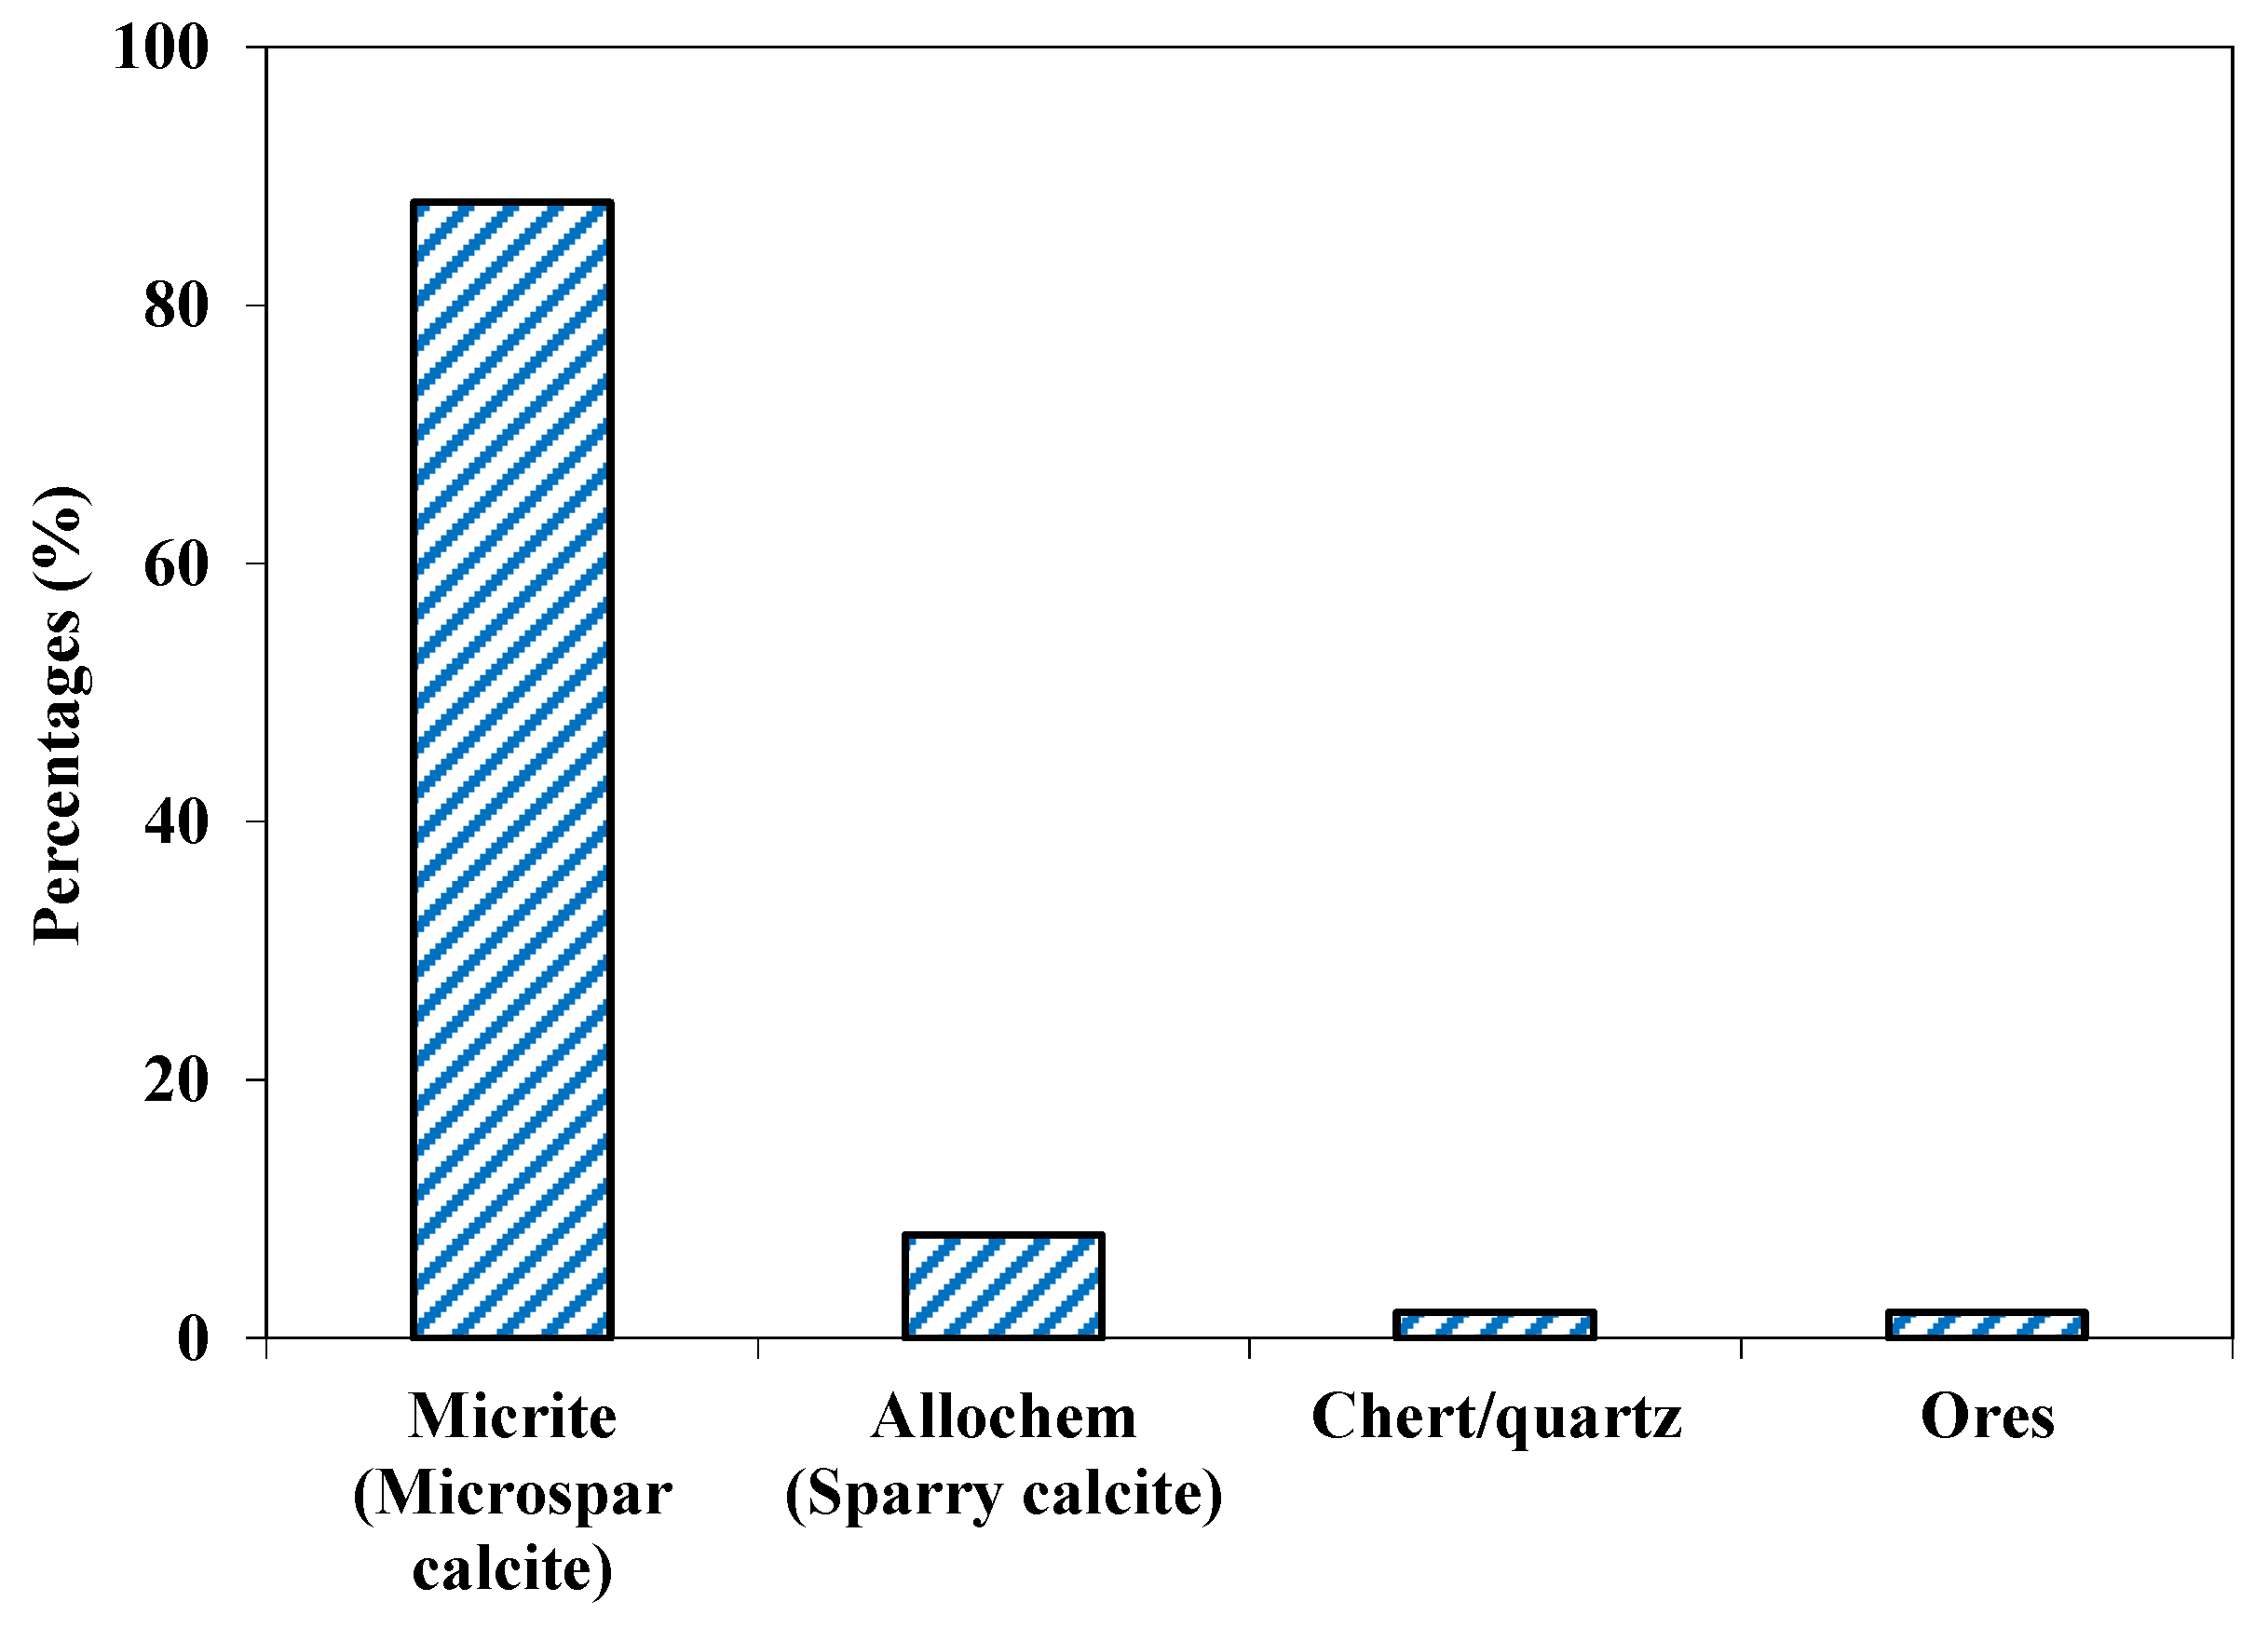
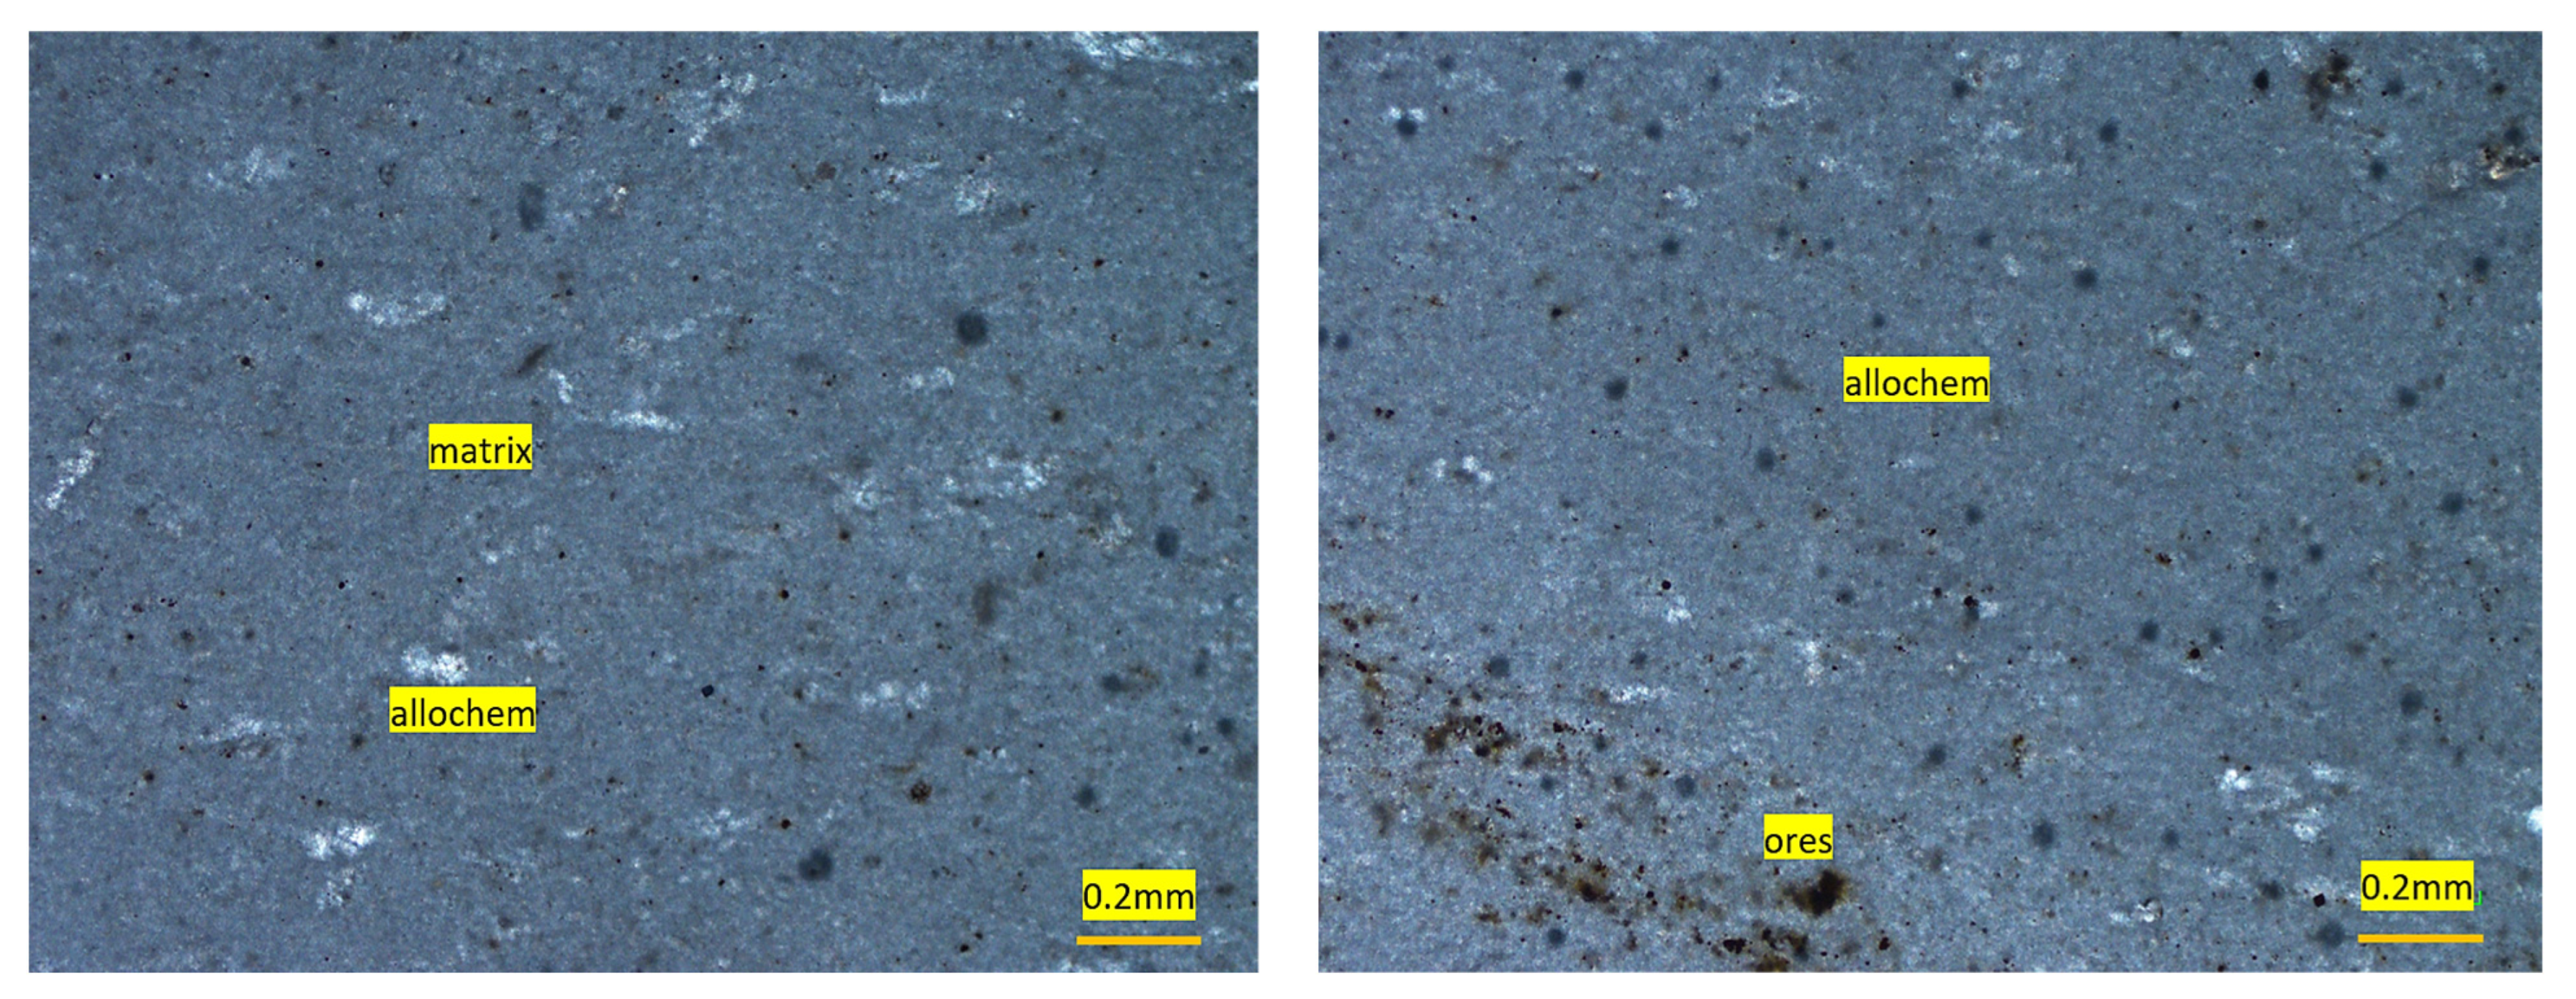
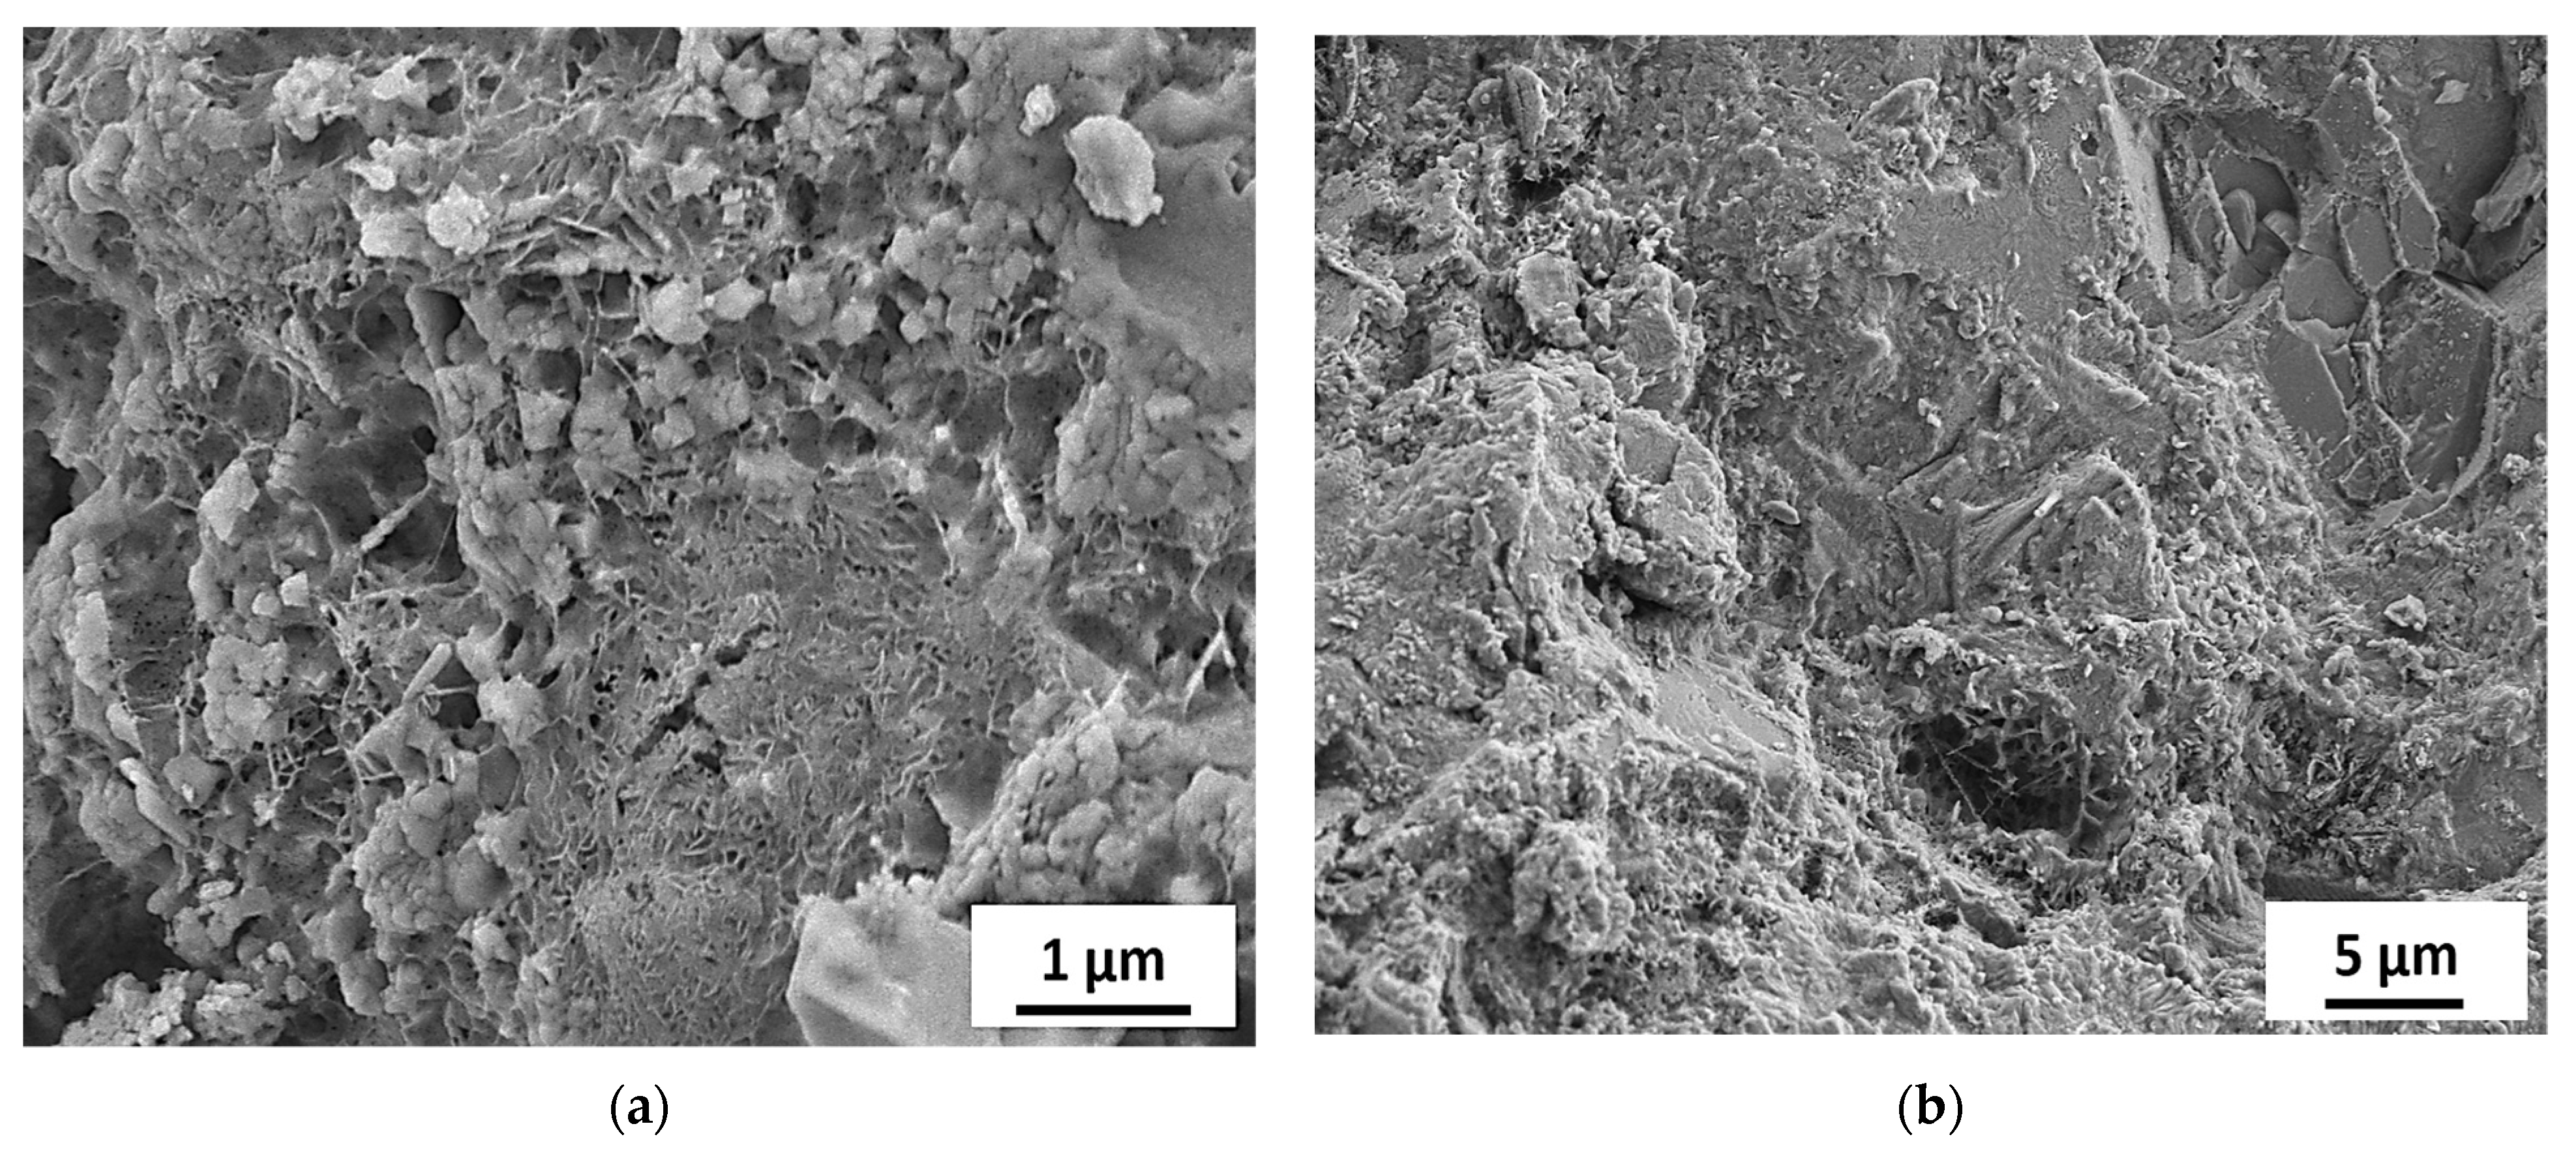
4.2.3. Orakzai Aggregate
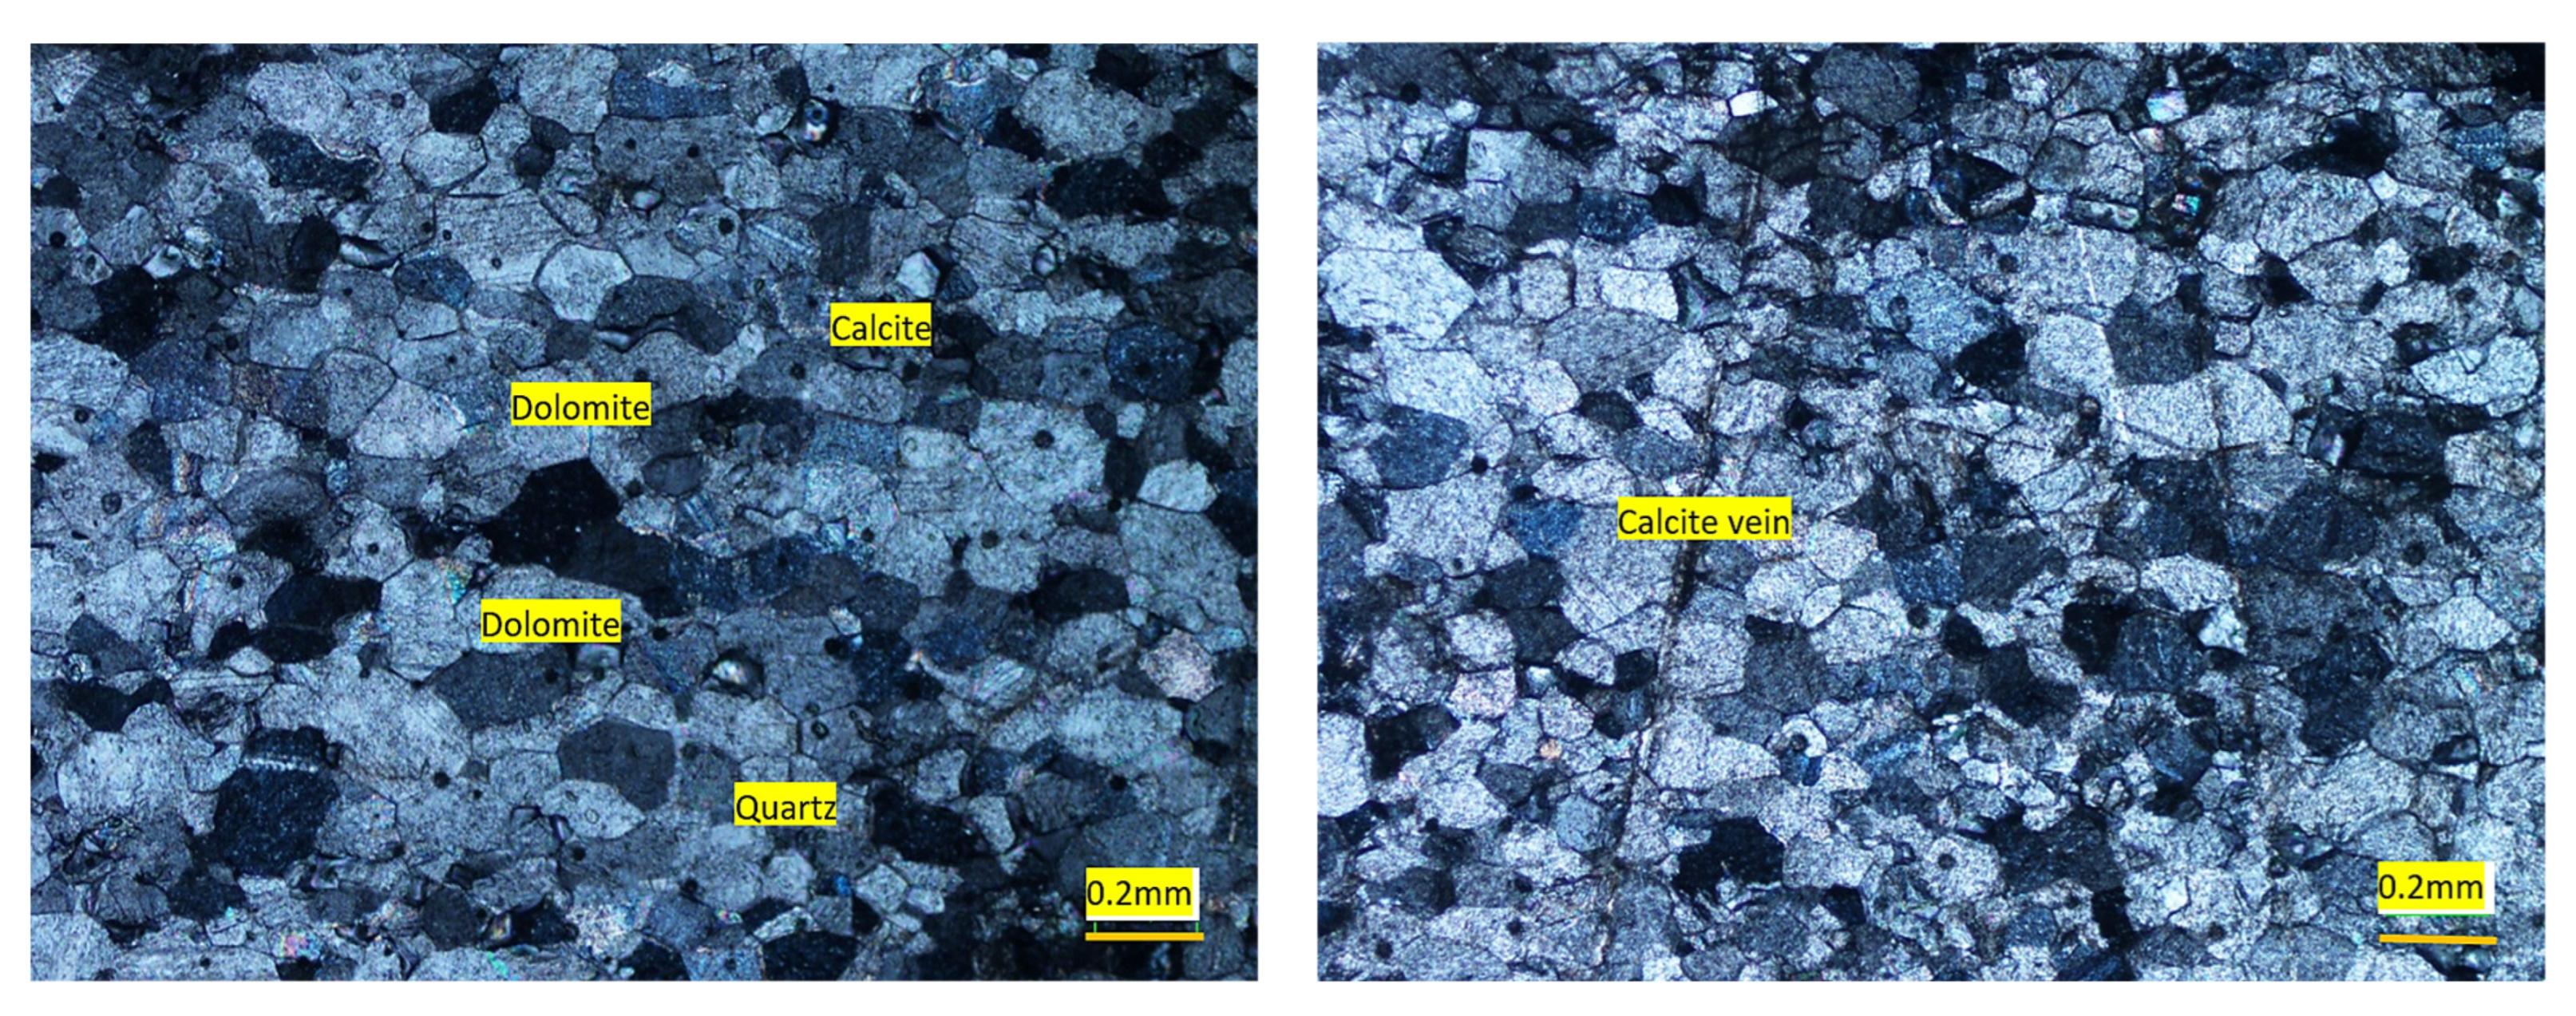
4.2.4. Swabi Aggregate
4.2.5. Sada Aggregate
4.3. Accelerated Mortar Bar Expansion Results
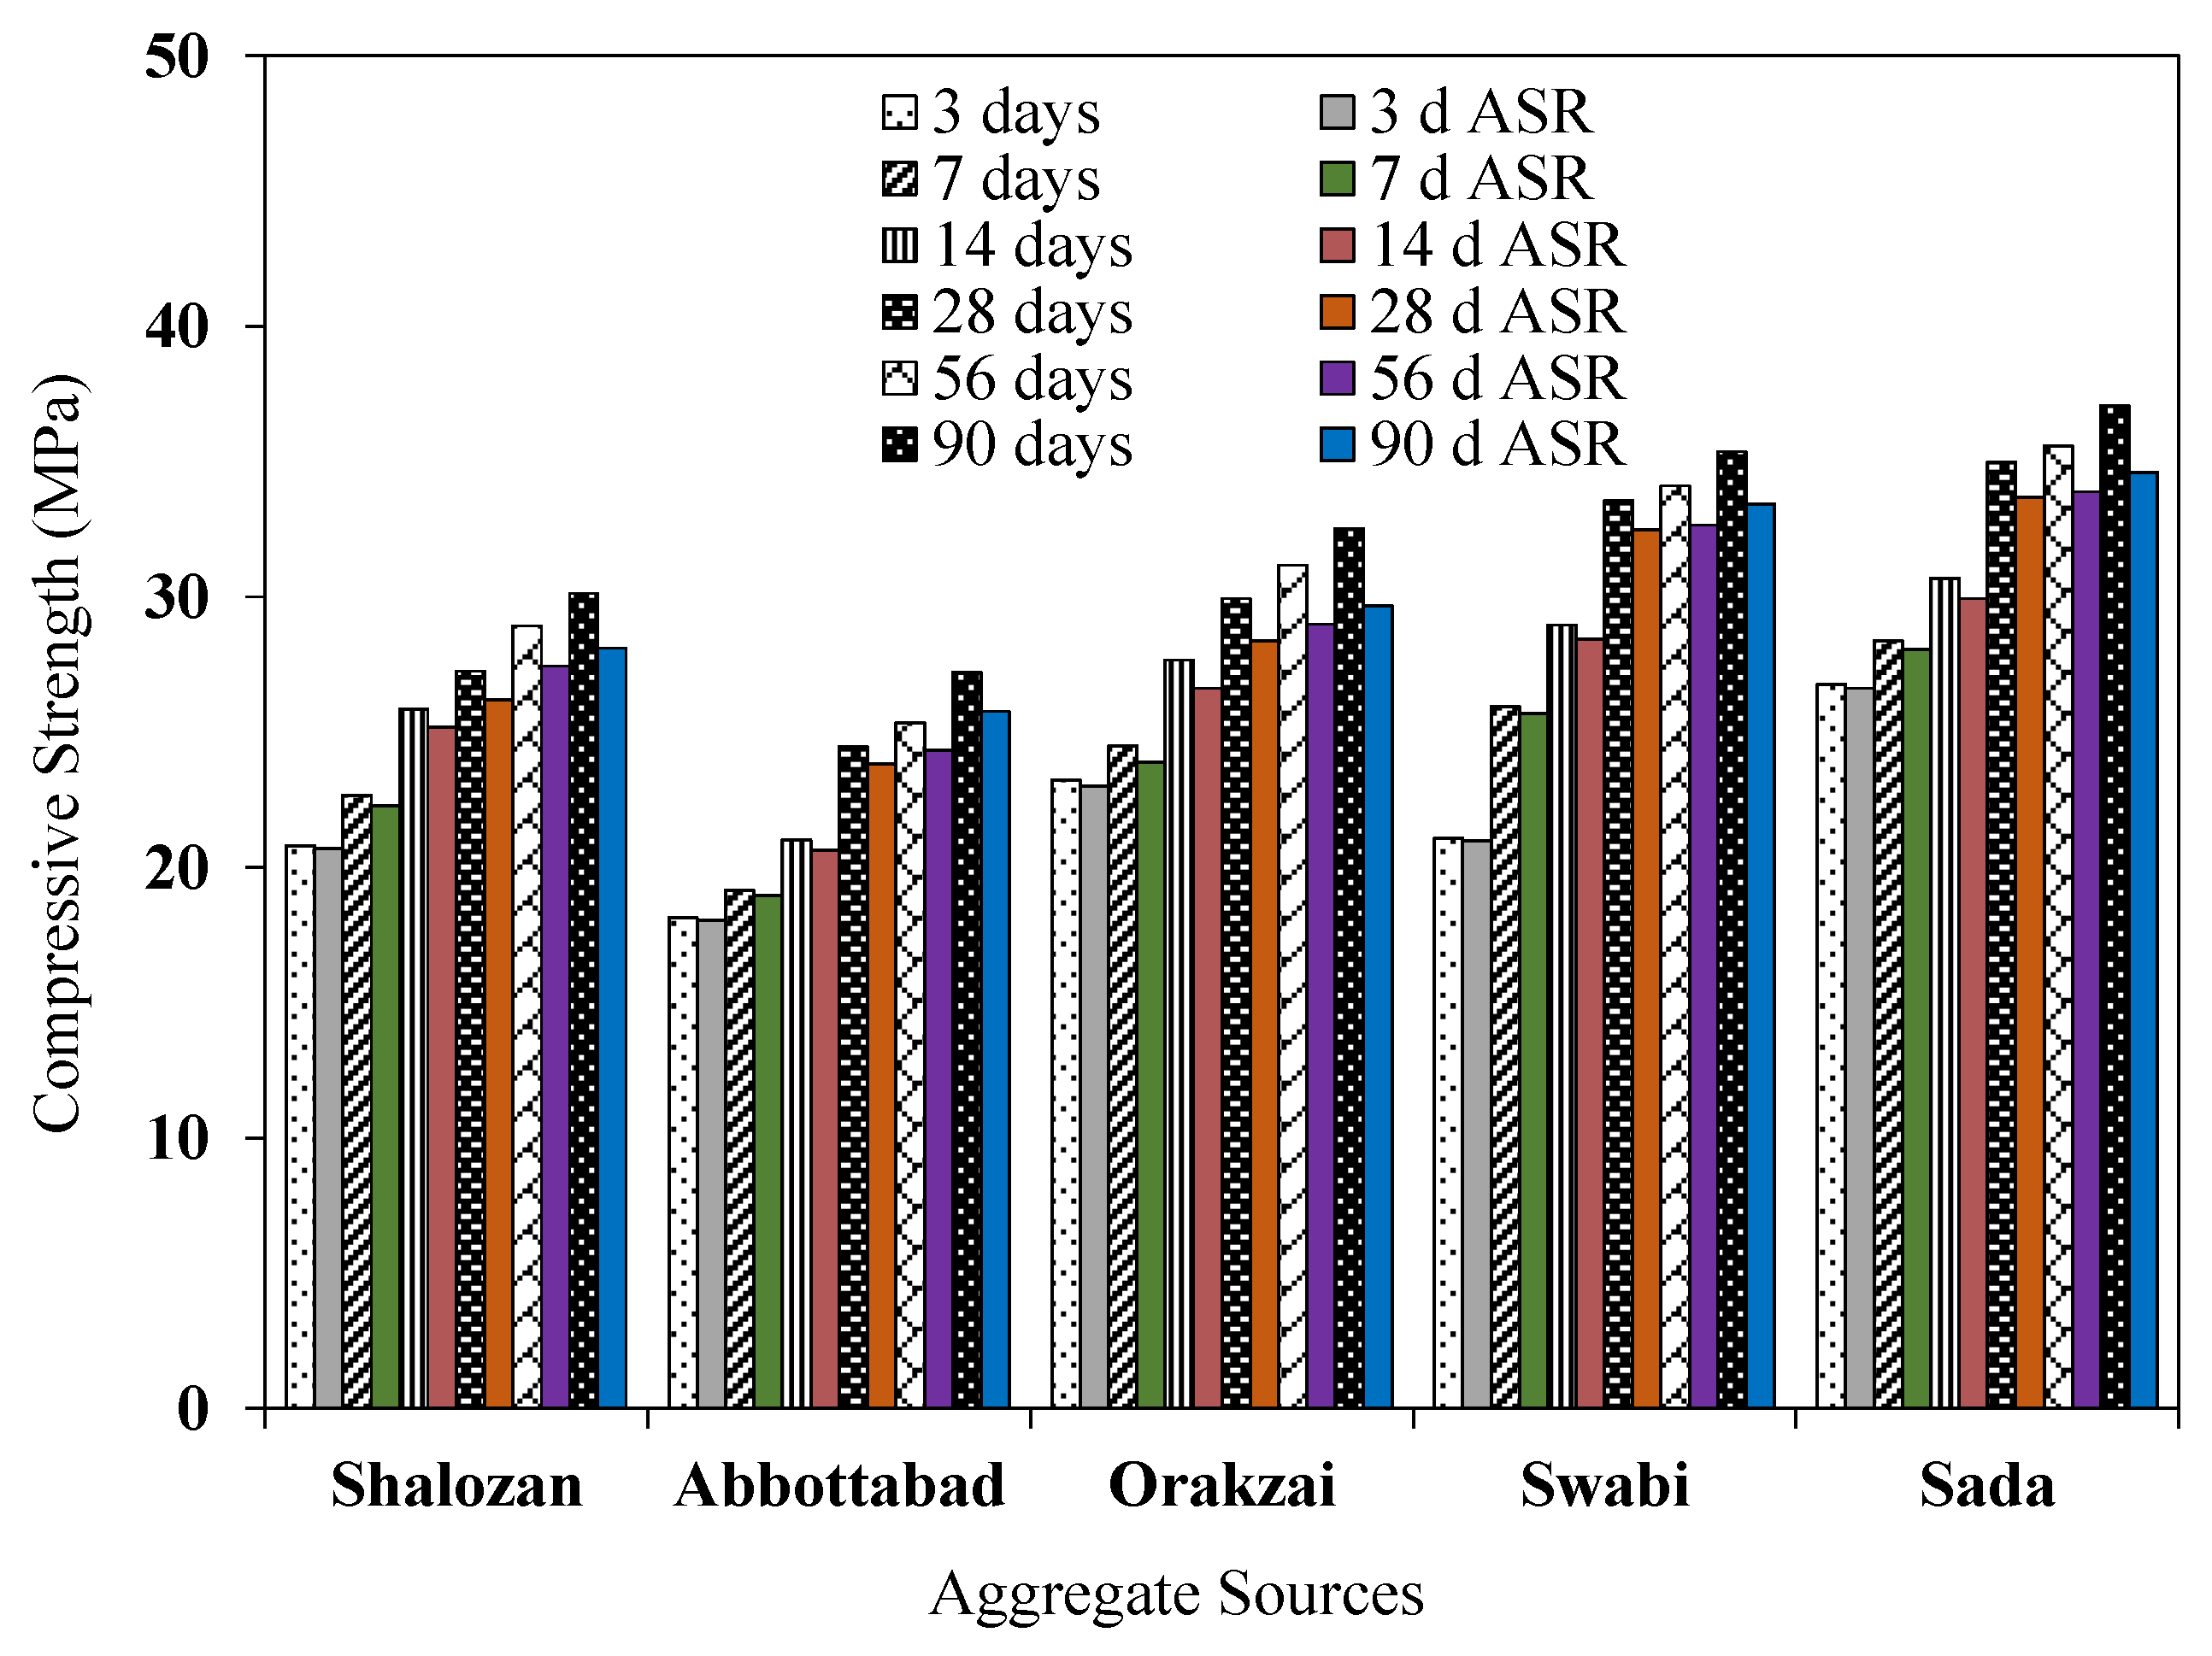
4.4. Effect of ASR on Compressive Strength
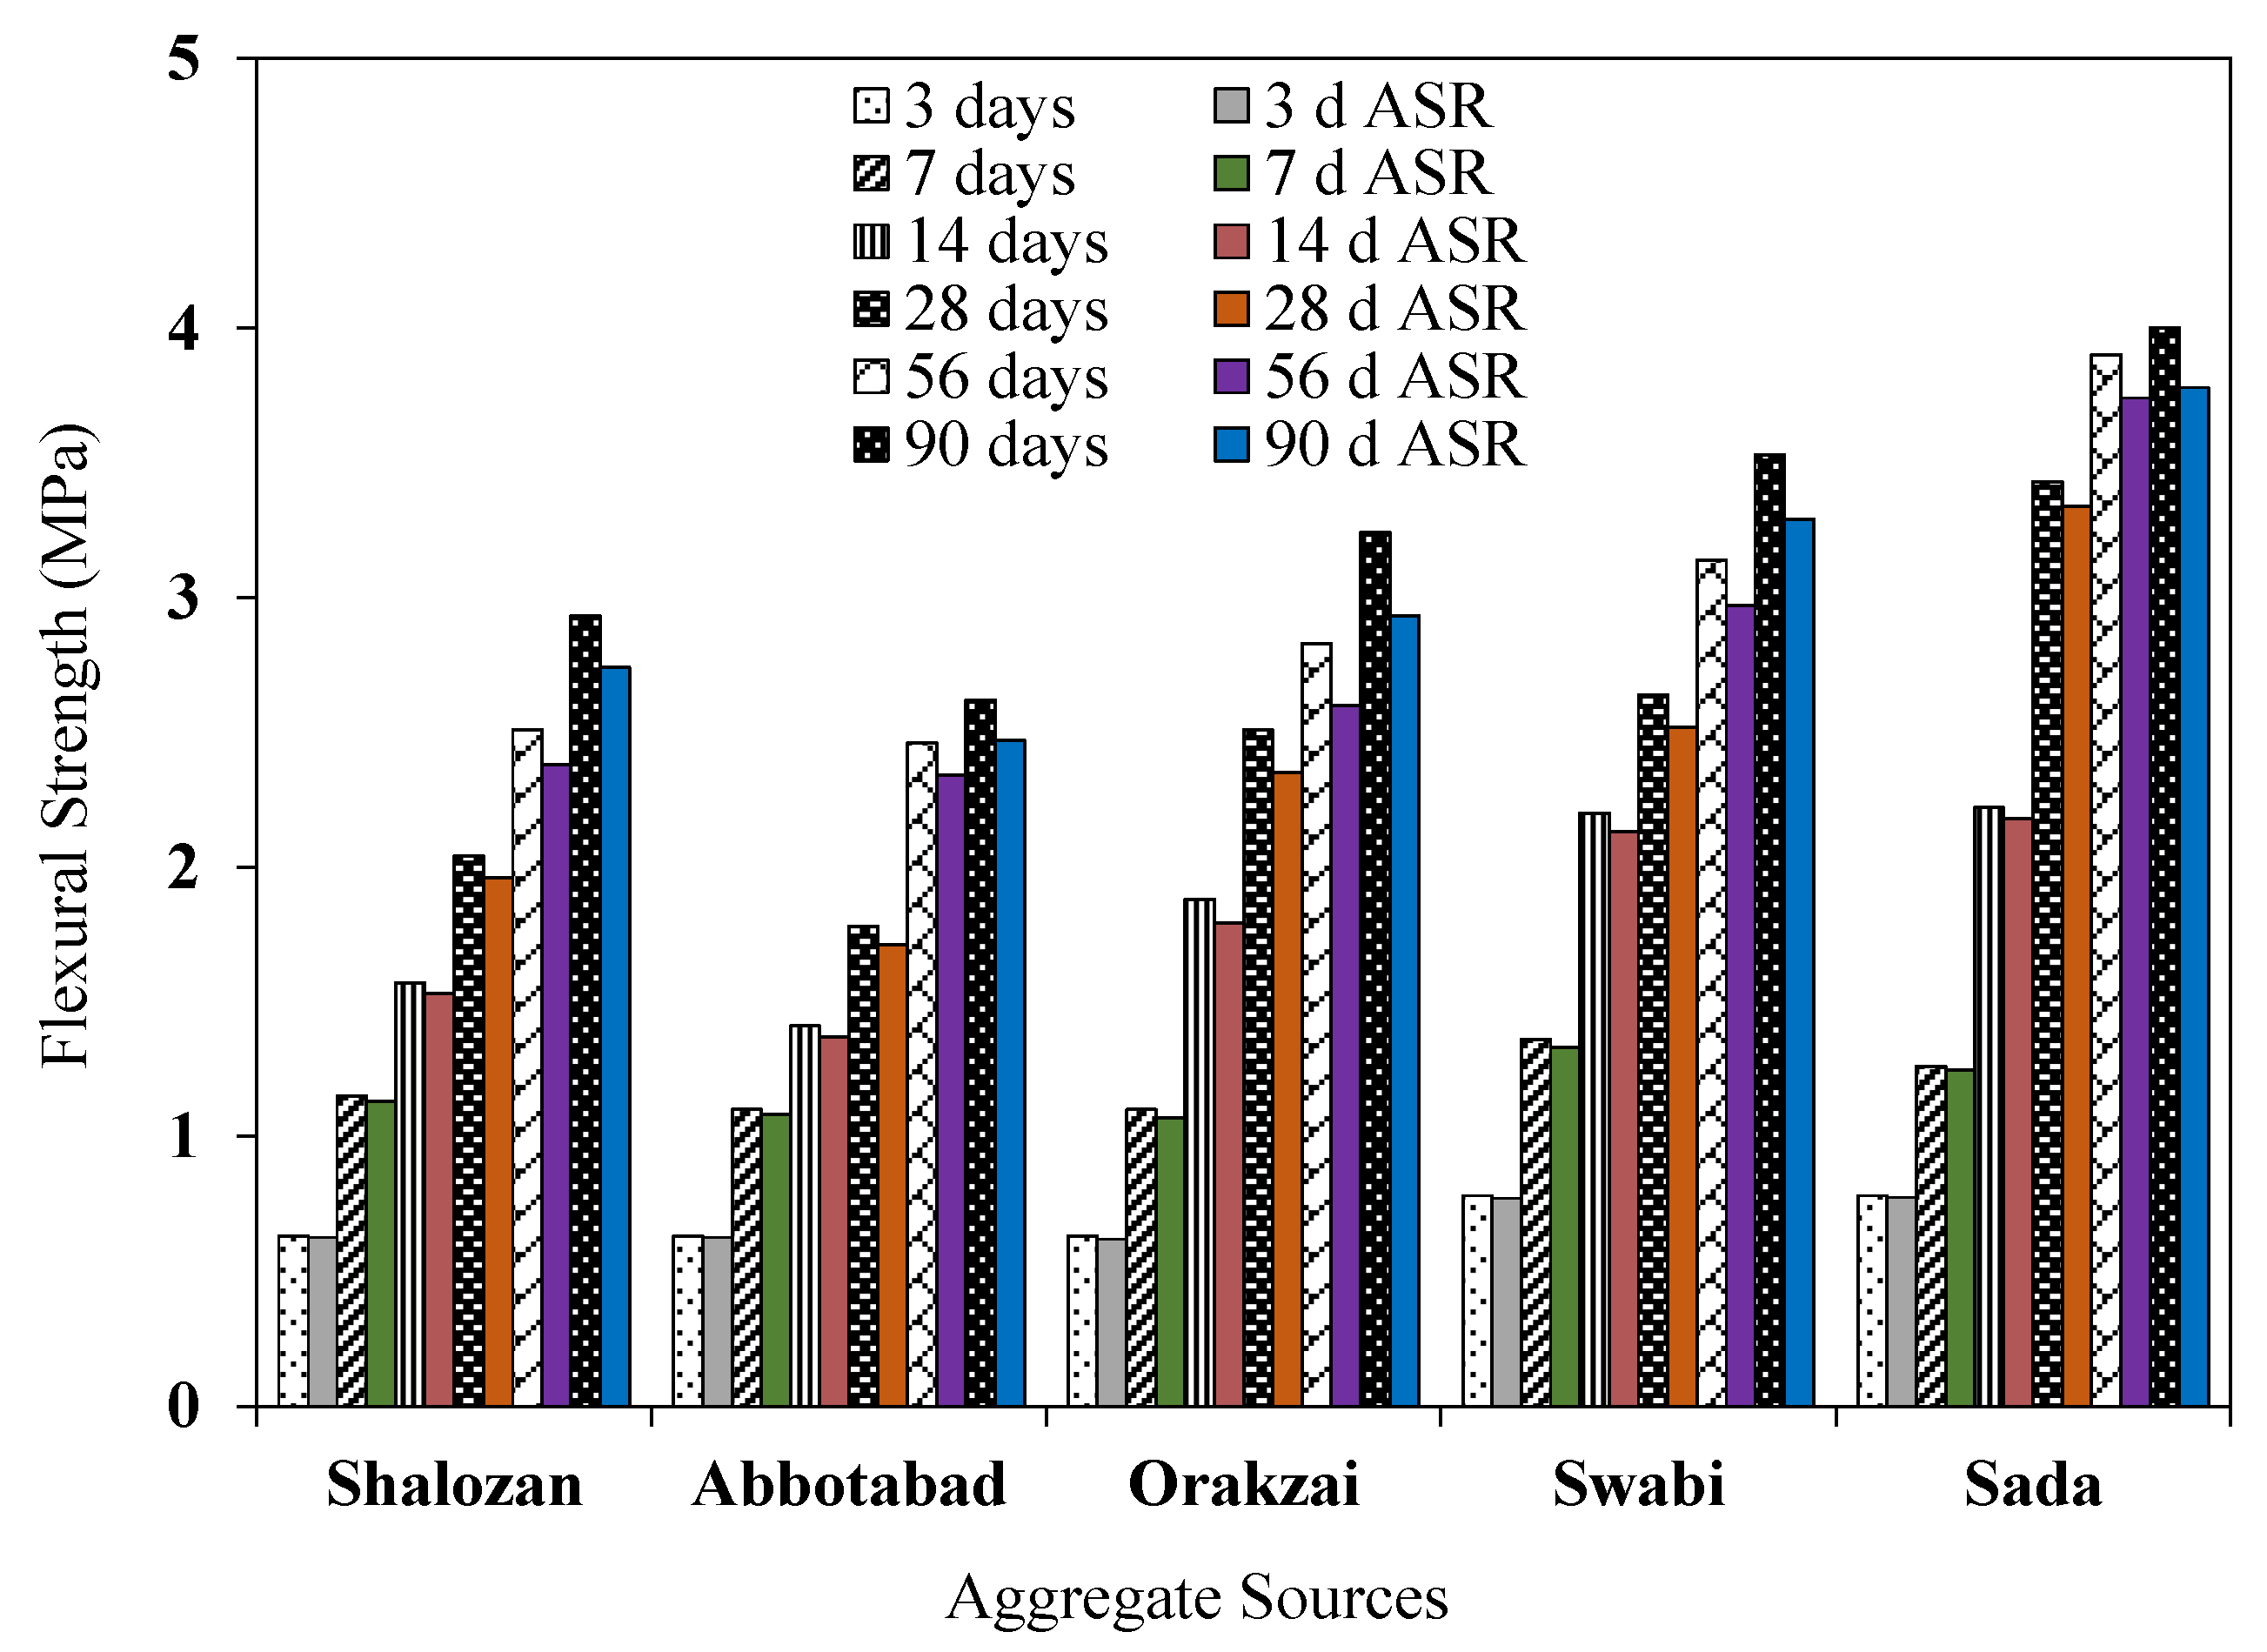
4.5. Effect of ASR on Modulus of Rupture
5. Conclusions
- The physical properties of the used cement were within the ASTM and European (EN) criteria. The fineness and surface area of used cement were 96.4% and 2867 cm2/gm, respectively, which was greater than 90% and 2250 cm2/gm (within ASTM limits). The autoclave expansion of cement was considerably lower than 0.8 percent, according to ASTM C151. Moreover, the physical properties of aggregates sources were within the specified ranges of ATSM standards. Swabi aggregates demonstrated the highest resistance to crushing, abrasion and impact, while Abbottabad aggregates had the lowest impact value. Sada aggregates, on the other hand, showed significant resistance to crushing and abrasion.
- The presence of all chemical constituents was reported to be within the limits specified in ASTM C114. Orakzai aggregates and Shalozan aggregates have greater silica contents of about 64.5% and 37%, respectively, whereas Abbottabad source has a lower silica content of around 1.55%. Petrographic examination of local aggregates confirmed the presence of reactive minerals—as much as 40% in case of Orakzai aggregate—while other tested sources have minerals in the normal range.
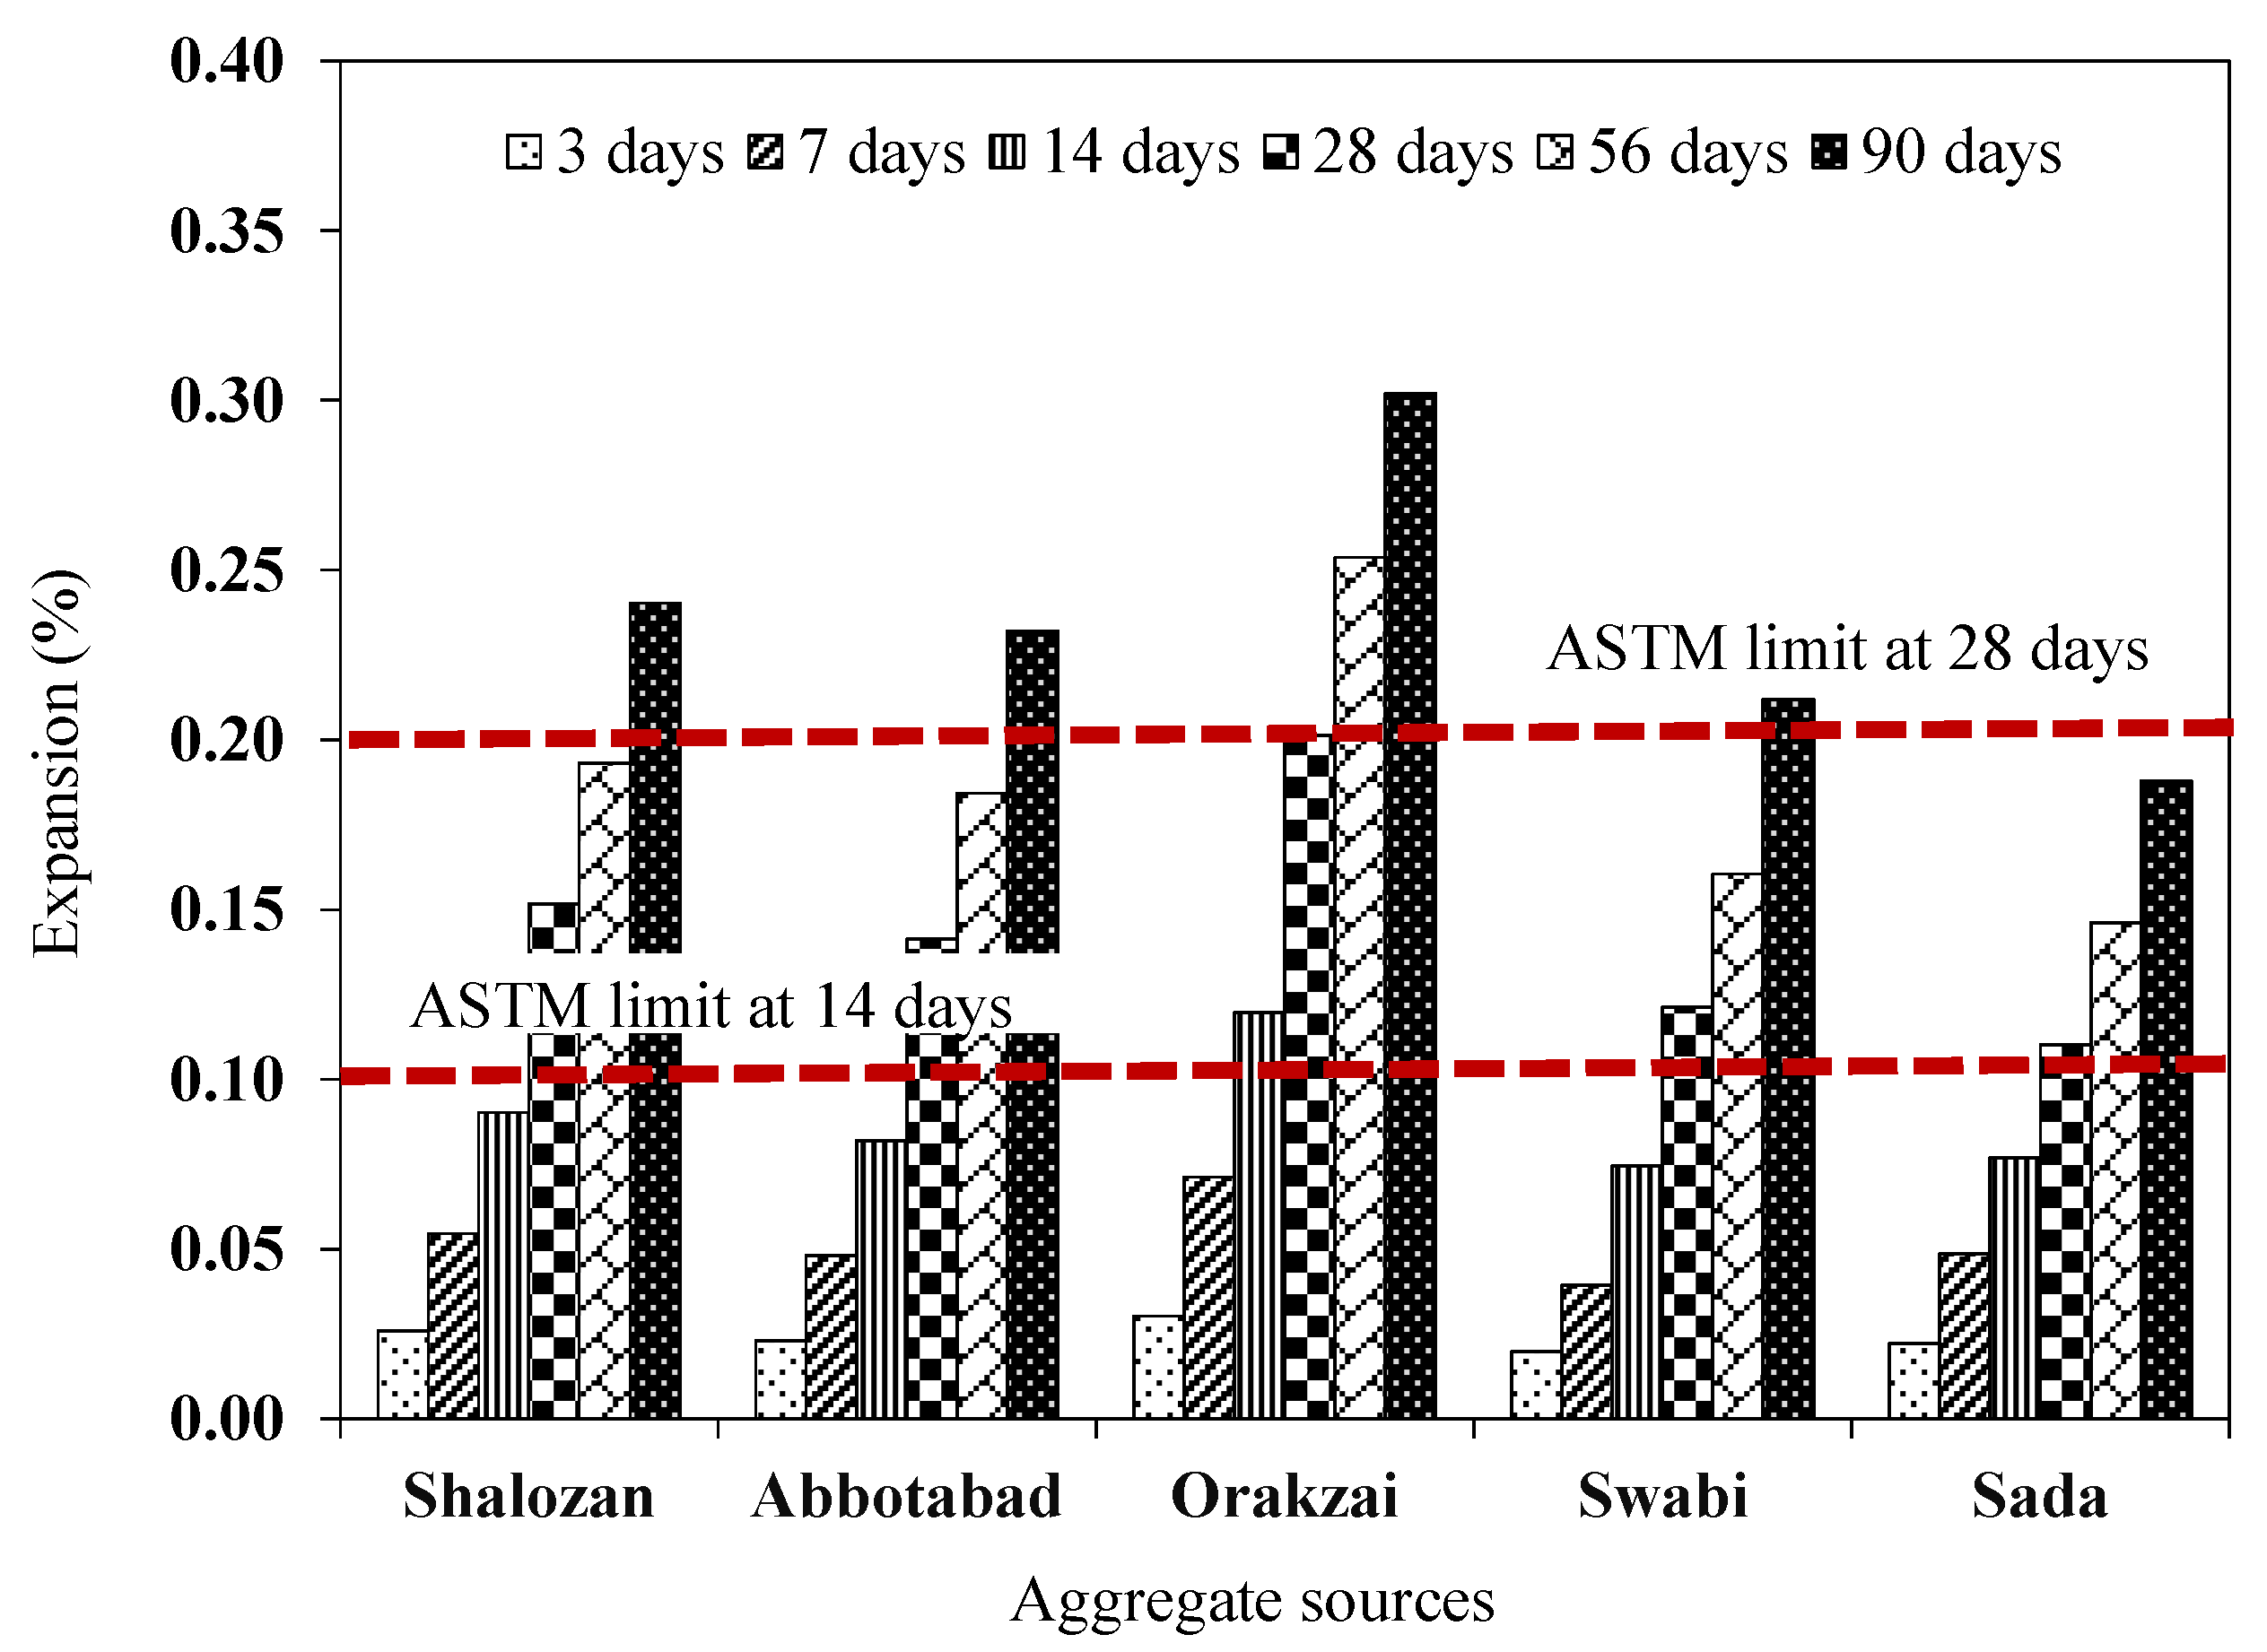
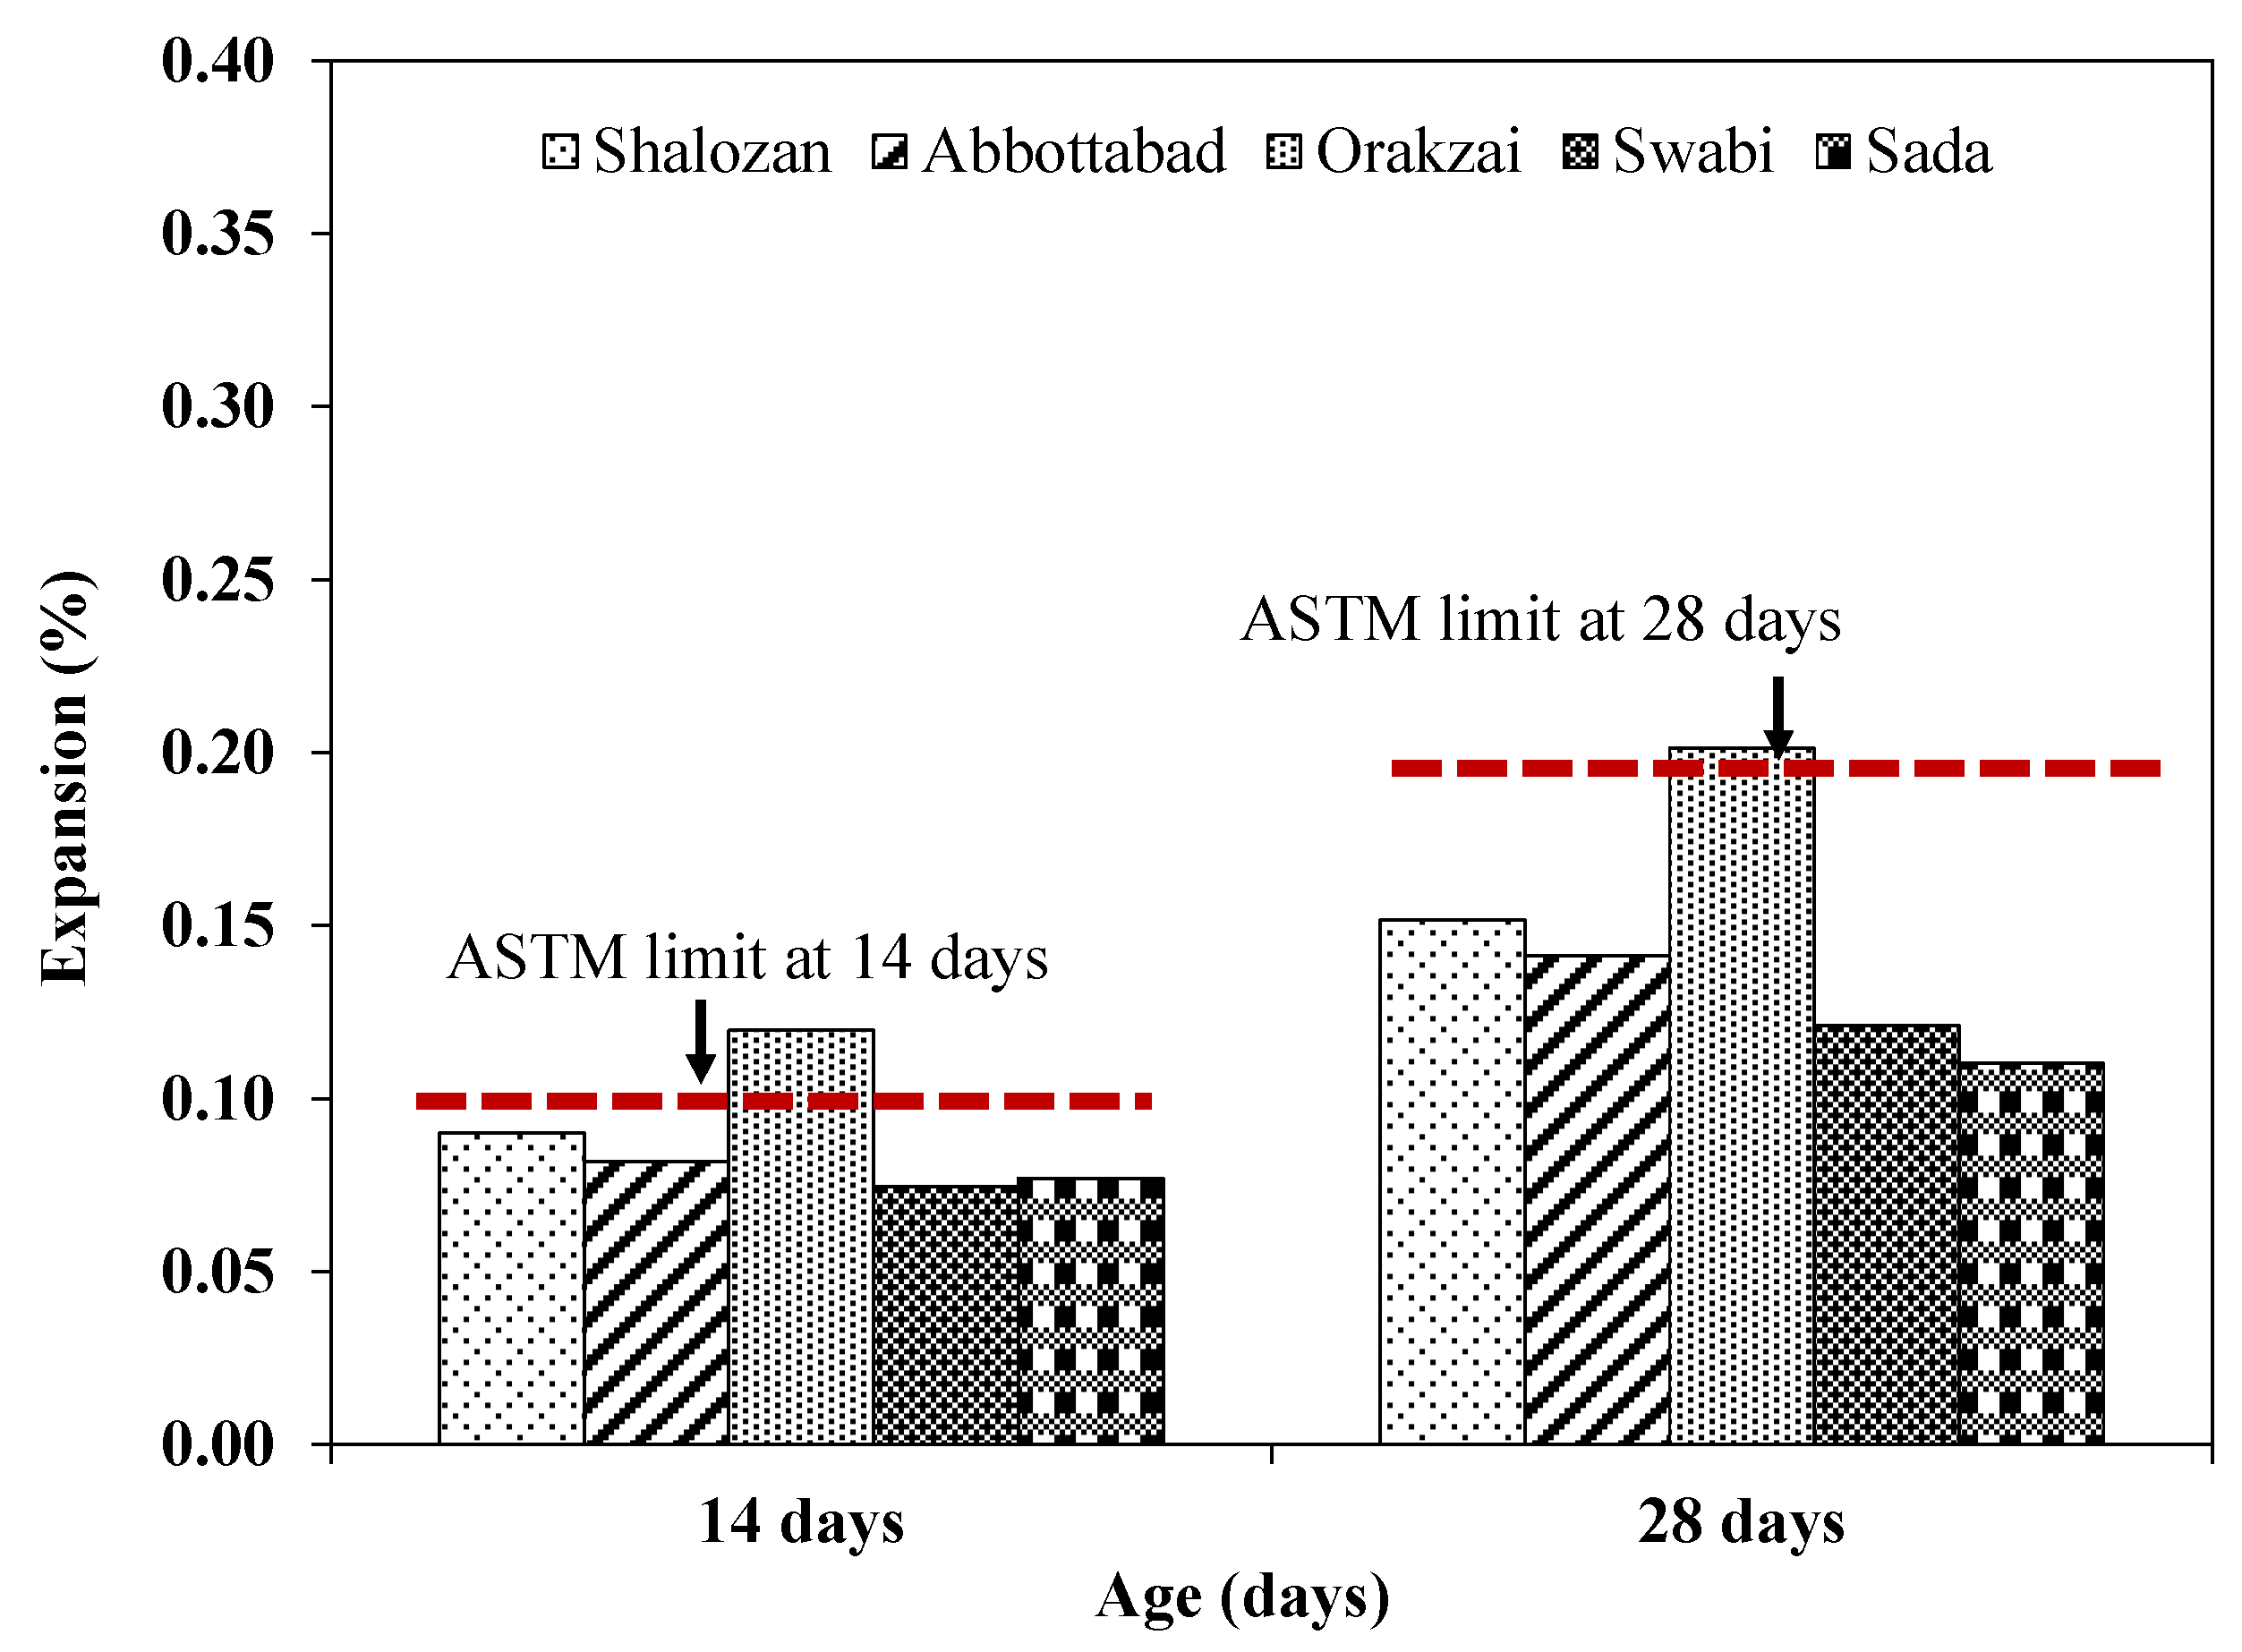
- Expansion results showed that the specimens made with Orakzai aggregate source exhibited expansion of 0.119% and 0.201% at 14 and 28 days, respectively, indicating its reactive nature as per ASTM C1260, while other tested sources showed less than 0.20% expansion at 28 days. Maximum expansion of 0.302% was observed for specimens incorporating Orakzai aggregate source at 90 days.
- A decrease in compressive and flexural strengths under ASR exposure was observed. For example, at 90 days, specimens with Sada source aggregates showed a reduction of around 5% in compressive strength under ASR conditions compared to that of the identical specimen placed in water curing. A maximum decrease in flexural strength under ASR exposure of around 9% was observed for specimens made with Orakzai aggregate source at 90 days.
Author Contributions
Funding
Institutional Review Board Statement
Informed Consent Statement
Data Availability Statement
Acknowledgments
Conflicts of Interest
References
- Fanijo, B.O.; Kolawole, J.T.; Almakrab, A. Alkali-silica reaction (ASR) in concrete structures: Mechanisms, effects and evaluation test methods adopted in the United States. Case Stud. Constr. Mater. 2021, 15, e00563. [Google Scholar]
- Mo, K.H.; Ling, T.C.; Tan, T.H.; Leong, G.W.; Yuen, C.W.; Shah, S.N. Alkali-silica reactivity of lightweight aggregate: A brief overview. Constr. Build. Mater. 2021, 270, 121444. [Google Scholar]
- Ichikawa, T.; Miura, M. Modified model of alkali-silica reaction. Cem. Concr. Res. 2007, 37, 1291–1297. [Google Scholar]
- Stanton, T.E. Expansion of Concrete through Reaction between Cement and Aggregate. Am. Soc. Civil Eng. 1940, 66, 1–10. [Google Scholar]
- Wood, J.G.M.; Waldron, P.; Chrisp, T.M. Development of a non-destructive test to quantify damage in deteriorated concrete. Mag. Concr. Res. 1993, 45, 247–256. [Google Scholar]
- Godart, B.; Rooij, M.D.; Wood, J.G.M. Alkali-Silica reaction. In Guide to Diagnosis and Appraisal of AAR Damage to Concrete in Structures, 13th ed.; Wood, J.G.M., Ed.; Sringer: London, UK, 2013; Volume 12, pp. 1–89. [Google Scholar]
- Munir, M.J.; Qazi, A.; Abbas, S.; Nehdi, M.L.; Kazmi, S.M.S. A Role of test method in detection of alkali–silica reactivity of concrete aggregates. Constr. Mater. 2018, 5, 203–221. [Google Scholar]
- ASTM C1260; Standard Test Method for Potential Alkali Reactivity of Aggregates (Mortar-Bar Method). ASTM International: West Conshohocken, PA, USA, 2014.
- Marzouk, H.; Langdon, S. The effect of alkali-aggregate reactivity on the mechanical properties of high and normal strength concrete. Cem. Concr. Compos. 2003, 25, 549–556. [Google Scholar]
- Ghafoori, N.; Islam, M. Relation of ASR-induced expansion and compressive strength of concrete. Mater. Struct. 2014, 48, 4055–4066. [Google Scholar]
- Na, O.; Xi, Y.; Ou, E.; Saouma, V.E. The effects of alkali-silica reaction on the mechanical properties of concretes with three different types of reactive aggregate. Struct. Concr. 2014, 17, 74–83. [Google Scholar]
- Oberholster, R.E.; Davies, G. An Accelerated Method for Testing the Potential Alkali Reactivity of Siliceous Aggregates. Cem. Concr. Res. 1986, 16, 181–189. [Google Scholar]
- ASTM C227; Standard Test Method for Potential Alkali Reactivity of Cement-Aggregate Combinations (Mortar-Bar Method). ASTM International: West Conshohocken, PA, USA, 2010.
- Hassan, E.U.; Hannan, A.; Rashid, M.U.; Ahmed, W.; Zeb, M.J.; Khan, S.; Abbas, S.A.; Ahmad, A. Resource assessment of Sakesar limestone as aggregate from salt range Pakistan based on geotechnical properties. Int. J. Hydrol. 2020, 4, 62–65. [Google Scholar]
- Hakim, R.; Mehmood, K.; Ahad, M.Z.; Hakim, I. Engineering Characterization Of course Aggregate Used in Cement Concrete from Local Quarries in Dir (Lower), KP, Pakistan. Int. J. Sci. Eng. Res. 2018, 9, 1–6. [Google Scholar]
- Pathan, M.A.; Lashari, R.A.; Maira, M. A Study on Types and Quality of Aggregates Produced in LONI KOT Karachi-Hyderabad Motorway Used in Building Construction. Int. J. Sci. Eng. Res. 2018, 9, 1–12. [Google Scholar]
- Munir, M.J.; Kazmi, S.M.S.; Wu, Y.F. Efficiency of waste marble powder in controlling alkali-silica reaction of concrete: A sustainable approach. Constr. Build. Mater. 2017, 154, 590–599. [Google Scholar]
- Abbas, S.; Munir, M.J.; Minhaj, S.; Kazmi, S.; Khitab, A.; Ashiq, S.Z.; Arshad, M.T. Engineering Characteristics of widely used Coarse Aggregates in Pakistan: A Comparative Study. Pak. J. Eng. Appl. Sci. 2017, 20, 1–9. [Google Scholar]
- Naseem, S.; Hussain, K.; Shahab, B.; Bashir, E.; Bilal, M.; Hamza, S. Investigation of Carbonate Rocks of Malikhore Formation as Coarse Aggregate and Dimension Stone, SE Balochistan, Pakistan. Br. J. Appl. Sci. Technol. 2016, 12, 1–11. [Google Scholar]
- Qureshi, M.A.; Aslam, M.; Shah, A.N.R.; Otho, S.H. Influence of Aggregate Characteristics on the Compressive Strength of Normal Weight Concrete. Tech. J. 2015, 20, 1–10. [Google Scholar]
- Naeem, M.; Khalid, P.; Sanaullah, M.; ud Din, Z. Physio-mechanical and aggregate properties of limestones from Pakistan. Acta Geod. Geophys. 2014, 49, 369–380. [Google Scholar]
- Siddiqi, Z.A.; Hameed, R.; Saleem, M.; Khan, Q.S. Performance study of locally available coarse aggregates of azad kashmir. Pak. J. Sci. 2013, 65, 90–94. [Google Scholar]
- Ayub, M.; Ali, Q.; Shahzada, K.; Naseer, A.; Shoaib, M.; Ayub, U. Engineering assessment of coarse aggregates used in Peshawar. Int. J. Adv. Struct. Geotech. Eng. 2012, 1, 61–64. [Google Scholar]
- Gondal, M.M.I.; Ahsan, N.; Javid, A.Z. Engineering properties of potential aggregate resources from eastern and central salt range, Pakistan. Geol. Bull. Punjab Univ. 2009, 44, 97–103. [Google Scholar]
- Ahsan, N.; Chaudhry, M.N.; Gondal, M.M.I.; Khan, Z.K. Allai aggregate for rehibilitation and reconstruction of october 8, 2005 earthquake affected allai-banan area, nwfp, Pakistan. Geol. Bull. Punjab Univ. 2009, 44, 1–12. [Google Scholar]
- Gondal, M.M.I.; Ahsan, N.; Javid, A.Z. Evaluation of shaki sarwar and rajan pur aggregates for construction in southern punjab province, Pakistan. Geol. Bull. Punjab Univ. 2008, 43, 101–107. [Google Scholar]
- Kamal, M.A.; Sulehri, M.A.; Hughes, D.A.B. Engineering characteristics of road aggregates from northern Pakistan and the development of a toughness index. Geotech. Geol. Eng. 2006, 24, 819–831. [Google Scholar]
- ASTM C187; Standard Test Method for Amount of Water Required for Normal Consistency of Hydraulic Cement Paste. ASTM International: West Conshohocken, PA, USA, 2016.
- ASTM C191; Standard Test Methods for Time of Setting of Hydraulic Cement by Vicat Needle. ASTM International: West Conshohocken, PA, USA, 2018.
- ASTM C184; Standard Test Method for Fineness of Hydraulic Cement by the 150-μm (No. 100) and 75-μm (No. 200) Sieve. ASTM International: West Conshohocken, PA, USA, 2000.
- ASTM C204; Standard Test Methods for Fineness of Hydraulic Cement by Air-Permeability Apparatus. ASTM International: West Conshohocken, PA, USA, 2018.
- EN 196-3; Methods of Testing Cement—Part 3: Determination of Setting Time and Soundness. European Committee for Standardization: Brussels, Belgium, 2008.
- ASTM C29; Standard Test Method for Bulk Density (“Unit Weight”) and Voids in Aggregate. ASTM International: West Conshohocken, PA, USA, 2016.
- ASTM C127; Standard Test Method for Relative Density (Specific Gravity) and Absorption of Coarse Aggregate. ASTM International: West Conshohocken, PA, USA, 2015.
- BSI 812–112; Testing Aggregates. Method for Determination of Aggregate Impact Value (AIV). BSI: London, UK, 2014.
- BSI 812–110; Testing Aggregates. Methods for Determination of Aggregate Crushing Value (ACV). BSI: London, UK, 2014.
- ASTM C535; Standard Test Method for Resistance to Degradation of Large-Size Coarse Aggregate by Abrasion and Impact in the Los Angeles Machine. ASTM International: West Conshohocken, PA, USA, 2010.
- ASTM C114; Standard Test Methods for Chemical Analysis of Hydraulic Cement. ASTM International: West Conshohocken, PA, USA, 2020.
- ASTM C295; Standard Guide for Petrographic Examination of Aggregates for Concrete. ASTM International: West Conshohocken, PA, USA, 2015.
- ASTM C109; Standard Test Method for Compressive Strength of Hydraulic Cement Mortars (Using 2-in. or [50-mm] Cube Specimens). ASTM International: West Conshohocken, PA, USA, 2010.
- ASTM C348; Standard Test Method for Flexural Strength of Hydraulic-Cement Mortar. ASTM International: West Conshohocken, PA, USA, 2020.
- ASTM C490; Standard Practice for Use of Apparatus for the Determination of Length Change of Hardened Cement Paste, Mortar, and Concrete. American Society for Testing Materials: West Conshohocken, PA, USA, 2017.
- ASTM C151; Standard Test Method for Autoclave Expansion of Hydraulic Cement. ASTM International: West Conshohocken, PA, USA, 2015.
- Broekmans, M.A.T.M. Classification of the Alkali-Silica Reaction in Geochemical Terms of Silica Dissolution. In Proceedings of the 7th Euro-Seminar on Microscopy Applied to 346 Building Materials, Delft, The Netherland, 29 June–2 July 1999; pp. 155–170. [Google Scholar]
- Islam, M.S. Performance of Nevada’s Aggregates in Alkali-Aggregate Reactivity of Portland Cement Concrete. Ph.D. Thesis, University of Nevada, Las Vegas, NV, USA, 2010; p. 243. [Google Scholar] [CrossRef]
- Leming, M.L.; Mitchell, J.F.; Johnson, J.K.; Ahmad, S.H. Investigation of Alkali-Silica Reactivity in North Carolina Highway Structures; Department of Civil Engineering, North Carolina State University: Raleigh, NC, USA, 1996. [Google Scholar]
- Dunham, R.J. Classification of carbonate rocks according to depositional texture. In: Classification of Carbonate Rocks (Ed. W.E. Ham). Am. Assoc. Pet. Geol. Mem. 1962, 1, 108–121. [Google Scholar]
- ACI 221.1R-98; State-of-the-Art Report on Alkali Aggregate Reactivity, ACI Manual of Concrete Practice—Part 1. American Concrete Institute: Farmington Hills, MI, USA, 1998.
- Stark, D.; Morgan, B.; Okamoto, P.; Diamond, S. Eliminating or Minimizing Alkali—Silica Reactivity; SHRP-P-343; Strategic Highway Research Program: Washington, DC, USA, 1993; p. 49. [Google Scholar]


| Sr # | Studied Aggregates/Rock Formation | Test Performed | Results and Findings | References |
|---|---|---|---|---|
| 1 | Sakesar limestone, Pail Padhrar, Tobar valley, Dhak pass. | Los Angeles abrasion value, aggregate impact value, aggregate crushing value, soundness test, specific gravity, unit weight. | It was reported that the Dhak pass and Pail Padhar sources exhibited lowest abrasion values. Due to higher crushing value and soundness test value, Tobar valley and Pail Padhar sources were recommended for surface course in pavements. Water absorption, specific gravity and unit weight of all aggregates were satisfactory. | Hassan et al. [14] |
| 2 | Chakdara quarry, Katkala quarry, Gulabad Khwar, Pajkor River at Rani. | Specific gravity, water absorption, bulk density, flakiness index, elongation index, soundness, crushing value, impact value, Los Angeles abrasion and concrete cylinder strength. | The specific gravity and bulk density of the four quarried ranged from 2.67 to 2.72 and 99 lb/ft3 to 101 lb/ft3, respectively, while the water absorption ranged from 1.58% to 1.92%. The flakiness index and elongation index ranged from 21.1% to 25.1% and 14.7% to 24.2%, respectively. The soundness test values ranged from 3.35% to 5.04%. The aggregate crushing value and aggregate impact value tests showed that aggregates from Gulabad quarry were better, with lowest values of 13.23% and 16.56%, respectively. The concrete cylinder strength of Gulabad aggregate was also highest (2376 psi) among the tested sources. | Hakim et al. [15] |
| 3 | Loni Kot area (Karachi-Hyderabad Motorway). | Particle density, water absorption, bulk density, soundness, organic impurities, clay lumps and friable particles, flakiness and elongation index, Los Angeles abrasion test, crushing value and impact value. | It was reported that 77% of fine particles were free from organic impurities. The aggregates soundness value was also within limits specified. The water absorption of fine aggregates was between 0.40 to 2.20% while, that of coarse aggregates was between 0.20 to 0.60%. The specific gravity of fine and coarse aggregates was between 2.42 and 2.72 and 1.95 and 2.87, respectively. The flaky and elongated particles in coarse aggregates were 25% and 27%, respectively. The aggregate crushing value and impact value were reported to be 25% and 28%, respectively. It was reported that the tested aggregates were sound and possessed good resistance against fragmentation and crushing. | Pathan et al. [16] |
| 4 | Sheikh hills, Tuguwali hills and Mach hills from the Sargodha region, the Jhelum River at the Lehri Mangla and the Kamser Mountains from Muzaffarabad in Kashmir. | Petrographic analysis, expansion test. | The ASTM C227 was followed to determine mortar bar expansion. The values for aggregates from Sargodha region ranged from 0.05 to 0.07%. However, for aggregates from Jhelum and Kamser sources, the expansion values were less than 0.04%. Using the ASTM C1260, all tested sources of aggregates from the Sargodha region were found to be reactive, with expansion > 0.20%. Petrographic examination also confirmed the reactivity of Sargodha aggregates. | Munir et al. [17] |
| 5 | Margalla crush, Sargodha crush, Mangla crush and Barnalla crush. | Specific gravity, water absorption, bulk density, crushing value, impact value, concrete cylinder strength, splitting tensile strength and flexural strength. | The water absorption of Sargodha and Barnala crush was less than the Margalla and Mangla crush, while the specific gravity of Margalla crush was the highest. However, the bulk density of Margalla crush was the lowest of them all. Sargodha crush exhibited least values of impact value (11.6%) and crushing value (17.9%). Out of all four, Margalla crush exhibited the highest compressive strength (26.3 MPa) and flexural strength (4.90 MPa). The splitting tensile strength of Barnala crush was found to be highest. | Munir et al. [18] |
| 6 | Malikhore formation (Lasbela and Khuzdar districts). | Bulk density, water absorption, Los Angeles abrasion, compressive strength, alkali–silica reactivity, flakiness and elongation index and petrographic analysis. | The specific gravity and water absorption were found to be 2.74 and 0.28%, respectively. The Los Angeles abrasion test value was 23% and compressive strength was 6179 psi. The petrographic analysis showed that these aggregates might be considered suitable for use in concrete production. | Naseem et al. [19] |
| 7 | Obhan Shah quarry (OSQ), Chattan Shah quarry (CSQ), Goal Pahari quarry (GPQ), Darak quarry (DQ) and Jara Takar quarry (JTQ). | Specific gravity, bulk density, flakiness and elongation index, water absorption, crushing value, impact value, abrasion value and compressive strength. | The specific gravity values of all sources were within allowable limits; however, the bulk density of all sources was below 2400 kg/m3. The flakiness index of all sources was above the limit (15%); however, the elongation index was below the maximum limit of 25%. The water absorption, crushing value, impact value and abrasion value of all sources was within standard limits. CSQ exhibited highest 28-day compressive strength (38.2 MPa), while JTQ exhibited lowest compressive strength (20.8 MPa). | Qureshi et al. [20] |
| 8 | Margala hill limestone (MH), Lockhart limestone (LT), Kawagarh (KW), Sammana Suk (SM) and Shekhai (SH). | Impact value, flakiness index, elongation index, Los Angeles abrasion, density, water absorption and petrographic analysis | It was reported that all the physical and mechanical properties were within the limits set by BS and ASTM standards. KW showed the highest value for specific gravity. KW and SM showed the lowest impact value and Los Angeles abrasion values. | Naeem et al. [21] |
| 9 | Hajra, Kamser, Arja, Margalla and Sargodha crush. | Specific gravity, water absorption, unit weight, flakiness and elongation index, impact value, crushing value, compressive strength and tensile strength. | The specific gravity of Kashmir sources (Hajra, Kamser and Arja) ranged between the values exhibited by Margalla and Sargodha crush, while the water absorption of Hajra and Arja was the highest and for Kamser, it was the lowest. The flakiness index and elongation index of all Kashmir sources were below the BS limits. The impact value and crushing value of Kashmir sources ranged between 10 and 15% and 15 and 23%, respectively. Kamser aggregates showed the lowest compressive and tensile strength values. Arja aggregates showed the highest compressive and tensile strength values. | Siddiqi et al. [22] |
| 10 | Bara River, Basi, LoyeKhawar, Zangali/JaniKhawar. | Bulk density, soundness, Los Angeles abrasion, ASR, petrographic examination. | The bulk density of all four aggregates was within the range from 2.3 to 3.1. The soundness test values for Bara river aggregates, Basi, Zangali and Loye Khawar were 13.05, 6.61, 8.94 and 17.69, respectively. The abrasion values of Bara river aggregates, Basi, Zangali and LoyeKhawar were 21.2, 18.5, 24 and 20, respectively. Samples from all four quarries were found to be innocuous and no expansion was found. Petrographic examination showed no signs of unstable silica and reactive carbonates. | Ayub et al. [23] |
| 11 | Jurana formation, Sakesar limestone. | Specific gravity, water absorption, soundness test, Los Angeles abrasion, moisture content. | The specific gravity of aggregates sources ranged between 2.62 and 2.70, while the water absorption was from 0.44% to 1.30%. Soundness test ranged between 2.15 to 8.47% after 5 cycles of immersion. The abrasion value ranged between 18.6% and 29.4%. The maximum dry density ranged from 143 lb/ft3 to 144.8 lb/ft3. The optimum moisture content was found to be between 5.4% and 5.6%. The tested aggregates were recommended for road construction. | Gondal et al. [24] |
| 12 | Allai aggregate | Bulk density, specific gravity, water absorption and ASR. | Although all engineering properties were found to be as per standard limits, the aggregates were found to possess alkali–silica potential. It has been recommended that these aggregates can be used along with low alkali cement, fly ash and slag in concrete or other mitigating strategy. | Ahsan et al. [25] |
| 13 | Girdue limestone, Sakhi Sarwar, Pitok quarry, Uzman quarry at Nullah Zungi, Khalgeri Mullah quarry. | Specific gravity, water absorption, soundness test, Los Angeles abrasion, moisture content, CBR value. | The specific gravity of aggregates sources ranged between 2.61 and 2.69, while the water absorption ranged from 0.57% to 1.65%. Soundness test ranged between 1.80 to 3.77%. The abrasion value ranged between 17.9% to 30.6%. The maximum dry density ranged from 143.7 lb/ft3 to 144.9 lb/ft3. The optimum moisture content was found to be between 5.2% and 5.4%. California bearing ratio was found to be between 84.4% to 99.2%. The sources from Girdu formation were reported to be excellent for surface treatment and concrete work. | Gondal et al. [26] |
| 14 | Chiniot, Margala, Sikhanwali, Takial and Khairabad. | Crushing value, abrasion value, specific gravity, porosity and particle shape index. | The crushing value of all samples ranged between 21.78 to 29.20%. Los Angeles abrasion value ranged between 16.3 and 25.46%. The impact value ranged between 12.73 and 18.65%. Margala and Chiniott sources exhibited the lowest values for porosity, crushing value and impact value tests and the highest values for specific gravity. However, the percentage of flaky and elongated particles was the highest in case of Margalla source aggregate. | Kamal et al. [27] |
| Sr. No. | Aggregate Source | Latitude | Longitude |
|---|---|---|---|
| 1 | Shalozan Parachinar | 33°56′7″ N | 70°1′15″ E |
| 2 | Sada Lower Kurram | 33°40′2″ N | 70°19′28″ E |
| 3 | Orakzai Agency | 33°42′26″ N | 70°50′1″ E |
| 4 | Abbottabad Aggregate | 34°08′49″ N | 73°12′52″ E |
| 5 | Swabi Aggregate | 34°06′60″ N | 72°27′60″ E |
| Aggregate Sources | Crusher Site | Aggregate Sample |
|---|---|---|
| Shalozan Parachinar | 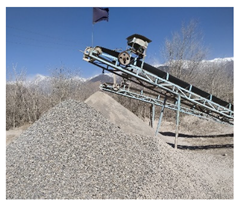 |  |
| Sada Lower Kurram | 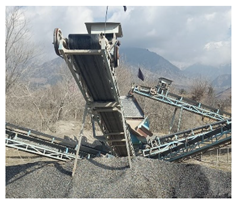 | 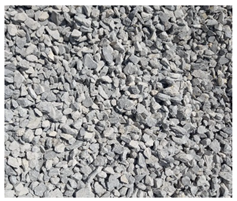 |
| Orakzai Agency | 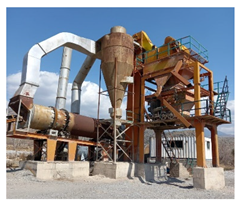 | 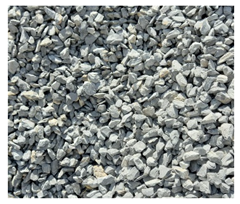 |
| Abbottabad | 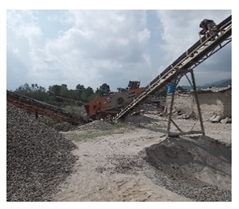 | 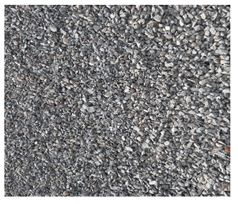 |
| Swabi | 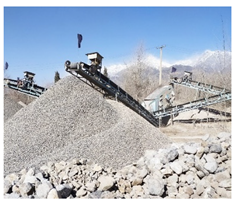 |  |
| Properties | Standards | Values | Limits |
|---|---|---|---|
| Standard consistency | ASTM C187 [28] | 22% | - |
| Initial setting time | ASTM C191 [29] | 95 min | Greater than 45 min |
| Final setting time | ASTM C191 [29] | 175 min | Less than 375 min |
| Fineness (passing No. #200) | ASTM C184 [30] | 96.4% | Minimum 90% |
| Fineness (Blaine air Permeability) | ASTM C204 [31] | 2867 cm2/g | Minimum 2250 cm2/g |
| Soundness | EN 196-3 [32] | 0.7 mm | Maximum 10 mm |
| Autoclave expansion | ASTM C151 [43] | 0.072% | Maximum 0.8% |
| Aggregates | Bulk Density (kg/m3) | Specific Gravity | Water Absorption | Impact Value | Crushing Value | Abrasion Test |
|---|---|---|---|---|---|---|
| Shalozan | 1430 | 2.62 | 0.58 | 25.28 | 22.14 | 29.8 |
| Abbottabad | 1470 | 2.63 | 0.37 | 26.95 | 14.07 | 24.8 |
| Orakzai | 1450 | 2.67 | 0.35 | 20.12 | 13.11 | 24.8 |
| Swabi | 1500 | 2.81 | 0.54 | 18.53 | 19.22 | 21.9 |
| Sada | 1410 | 2.70 | 0.22 | 23.19 | 8.15 | 31.2 |
| Constituents | Shalozan | Abbottabad | Orakzai | Swabi | Sada |
|---|---|---|---|---|---|
| CaO (%) | 9.4 | 14.9 | 7.6 | 17.02 | 11.1 |
| MgO (%) | 0.2 | 1.3 | 1.5 | 1.1 | 1.8 |
| SiO2 (%) | 37 | 1.55 | 64.50 | 3.20 | 1.64 |
| SO3 (%) | 0.29 | 0.16 | 0.41 | 0.20 | 0.23 |
| Al2O3 (%) | 1.60 | 1.40 | 0.85 | 5.65 | 0.52 |
| Fe2O3 (%) | 0.50 | 0.74 | 0.25 | 2.34 | 0.28 |
| L.O.I (%) | 27 | 42.62 | 14.82 | 44.34 | 36.05 |
| Aggregates | a | b |
|---|---|---|
| Shalozan Parachinar | 3.20 | 100 |
| Sada Lower Kurram | 2.90 | 125 |
| Orakzai Agency | 2.65 | 70 |
| Abbottabad Aggregate | 3.10 | 150 |
| Swabi Aggregate | 3.70 | 140 |
Publisher’s Note: MDPI stays neutral with regard to jurisdictional claims in published maps and institutional affiliations. |
© 2022 by the authors. Licensee MDPI, Basel, Switzerland. This article is an open access article distributed under the terms and conditions of the Creative Commons Attribution (CC BY) license (https://creativecommons.org/licenses/by/4.0/).
Share and Cite
Abbas, S.; Hussain, I.; Aslam, F.; Ahmed, A.; Gillani, S.A.A.; Shabbir, A.; Deifalla, A.F. Potential of Alkali–Silica Reactivity of Unexplored Local Aggregates as per ASTM C1260. Materials 2022, 15, 6627. https://doi.org/10.3390/ma15196627
Abbas S, Hussain I, Aslam F, Ahmed A, Gillani SAA, Shabbir A, Deifalla AF. Potential of Alkali–Silica Reactivity of Unexplored Local Aggregates as per ASTM C1260. Materials. 2022; 15(19):6627. https://doi.org/10.3390/ma15196627
Chicago/Turabian StyleAbbas, Safeer, Iqtidar Hussain, Fahid Aslam, Ali Ahmed, Syed Asad Ali Gillani, Aqsa Shabbir, and Ahmed Farouk Deifalla. 2022. "Potential of Alkali–Silica Reactivity of Unexplored Local Aggregates as per ASTM C1260" Materials 15, no. 19: 6627. https://doi.org/10.3390/ma15196627
APA StyleAbbas, S., Hussain, I., Aslam, F., Ahmed, A., Gillani, S. A. A., Shabbir, A., & Deifalla, A. F. (2022). Potential of Alkali–Silica Reactivity of Unexplored Local Aggregates as per ASTM C1260. Materials, 15(19), 6627. https://doi.org/10.3390/ma15196627