
Morphology, Microstructure, and Mechanical Properties of S32101 Duplex Stainless-Steel Joints in K-TIG Welding


Abstract
:1. Introduction
2. Materials and Methods
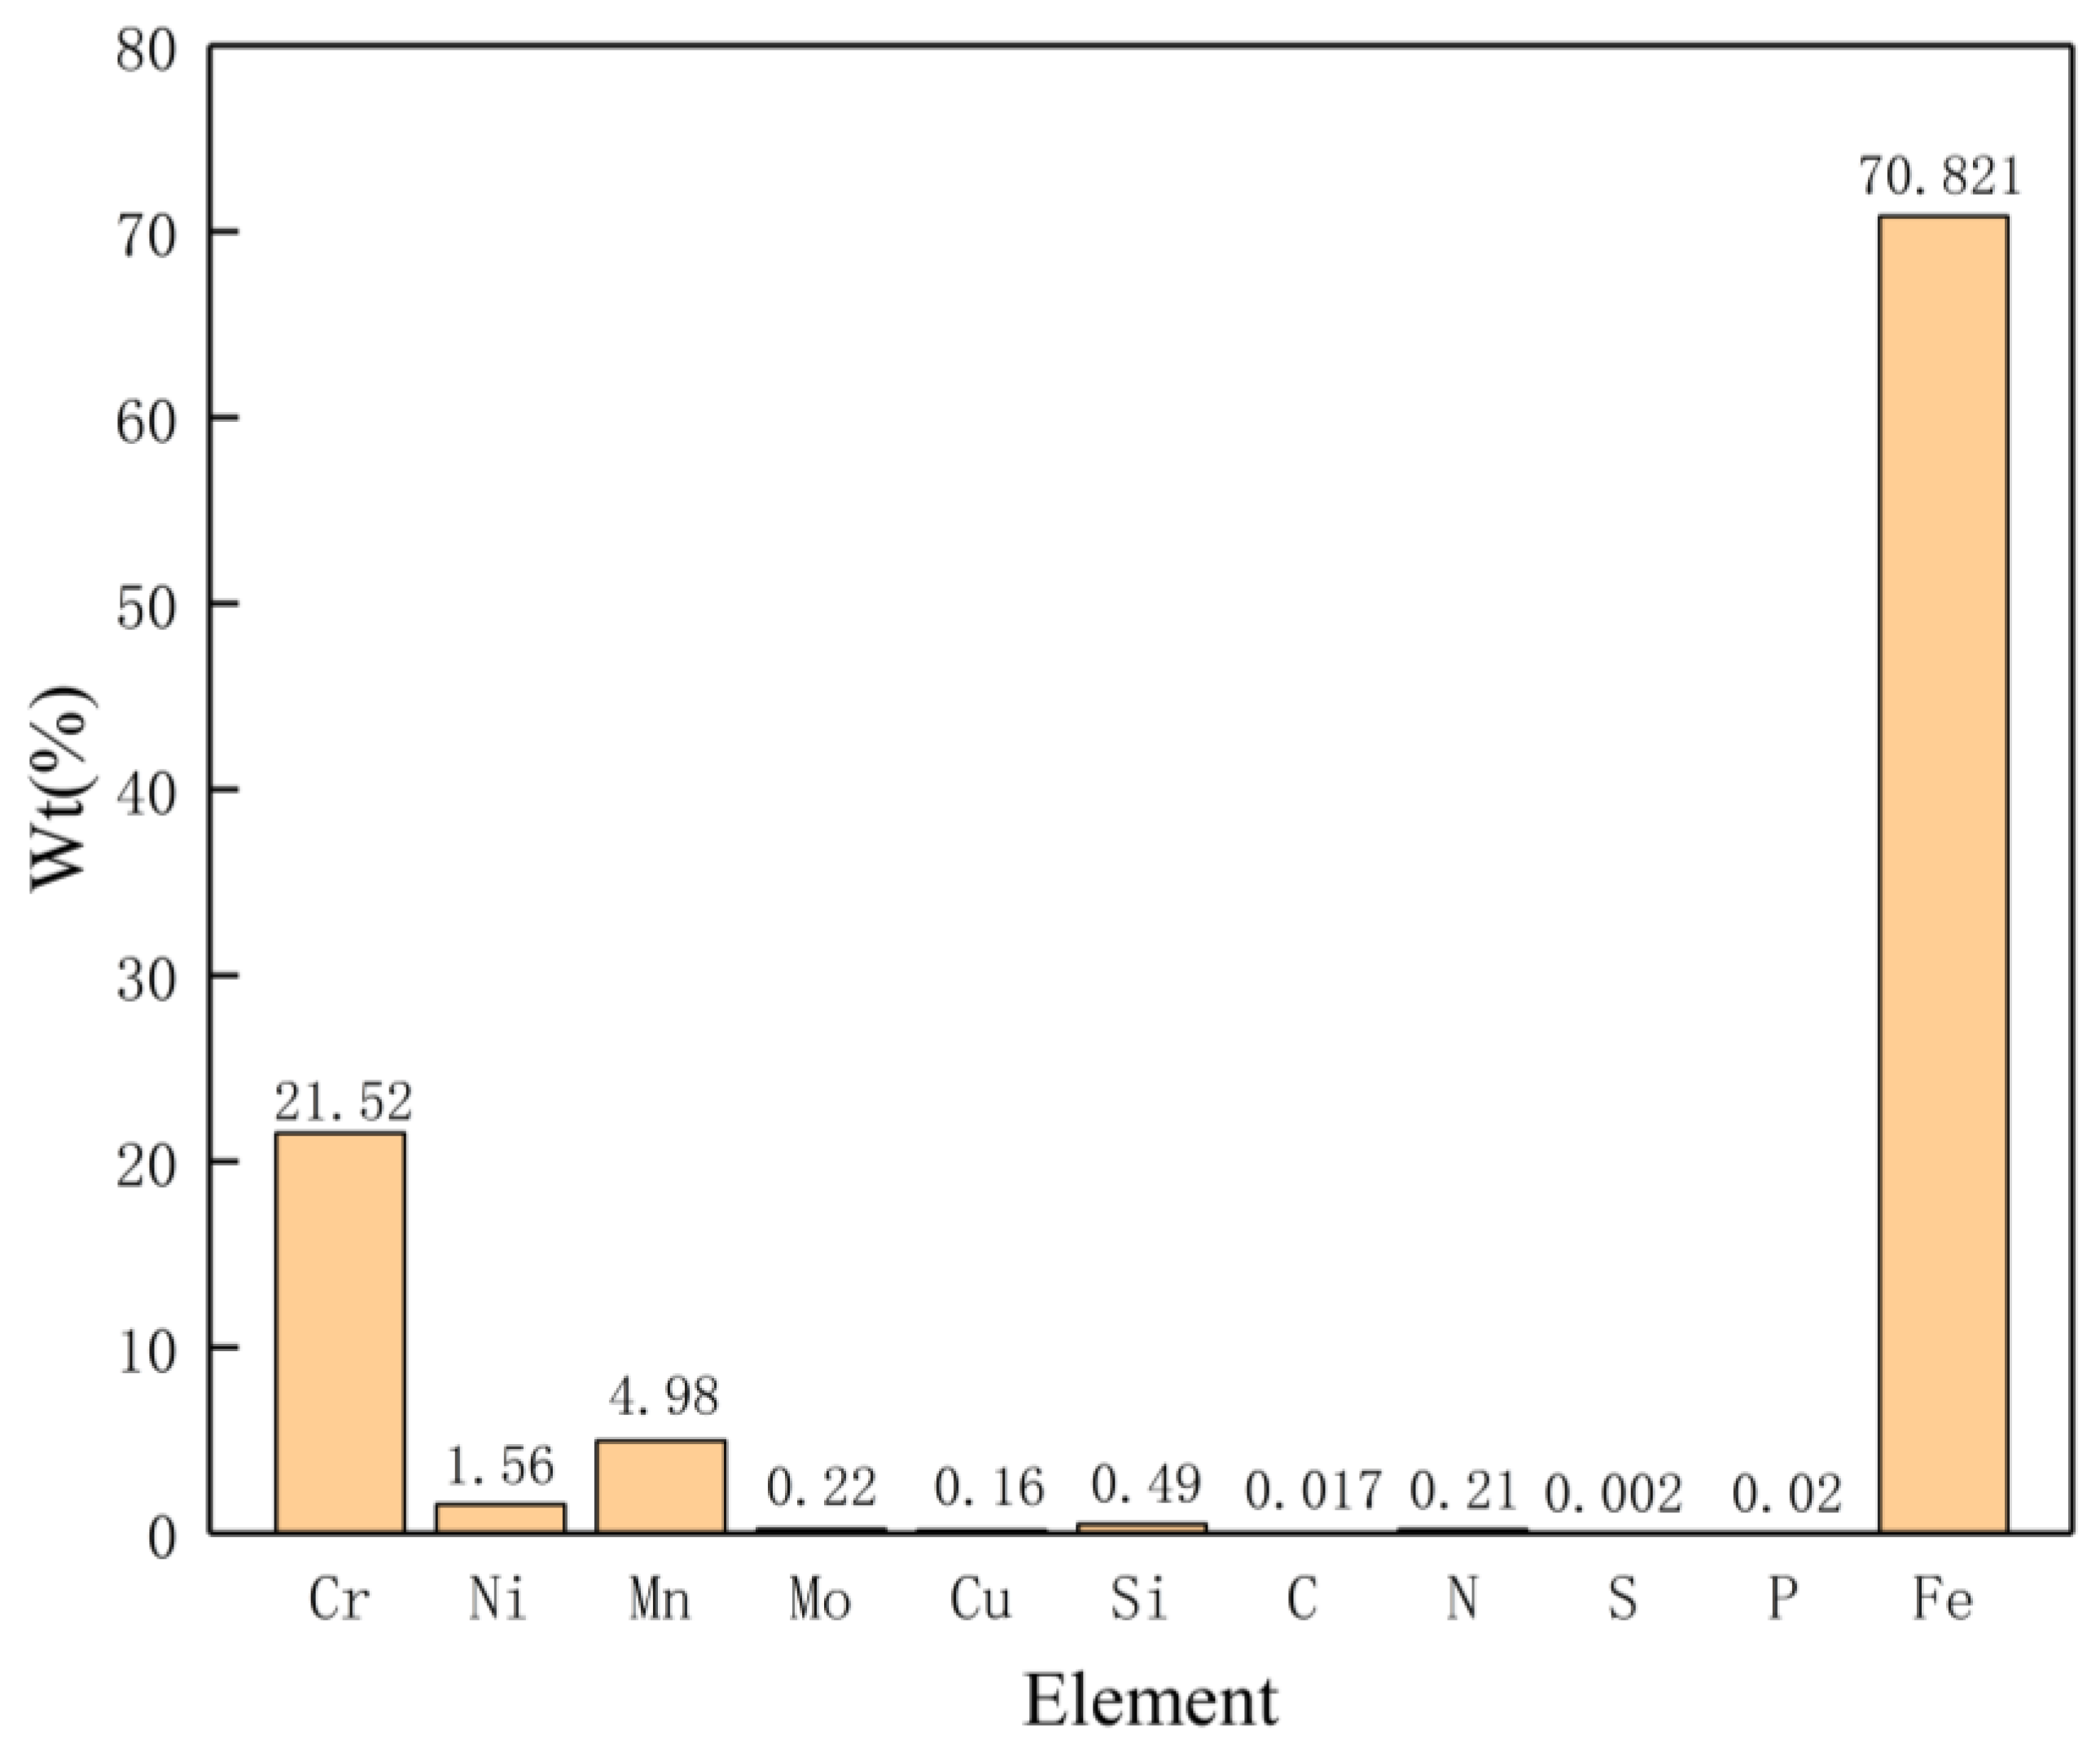
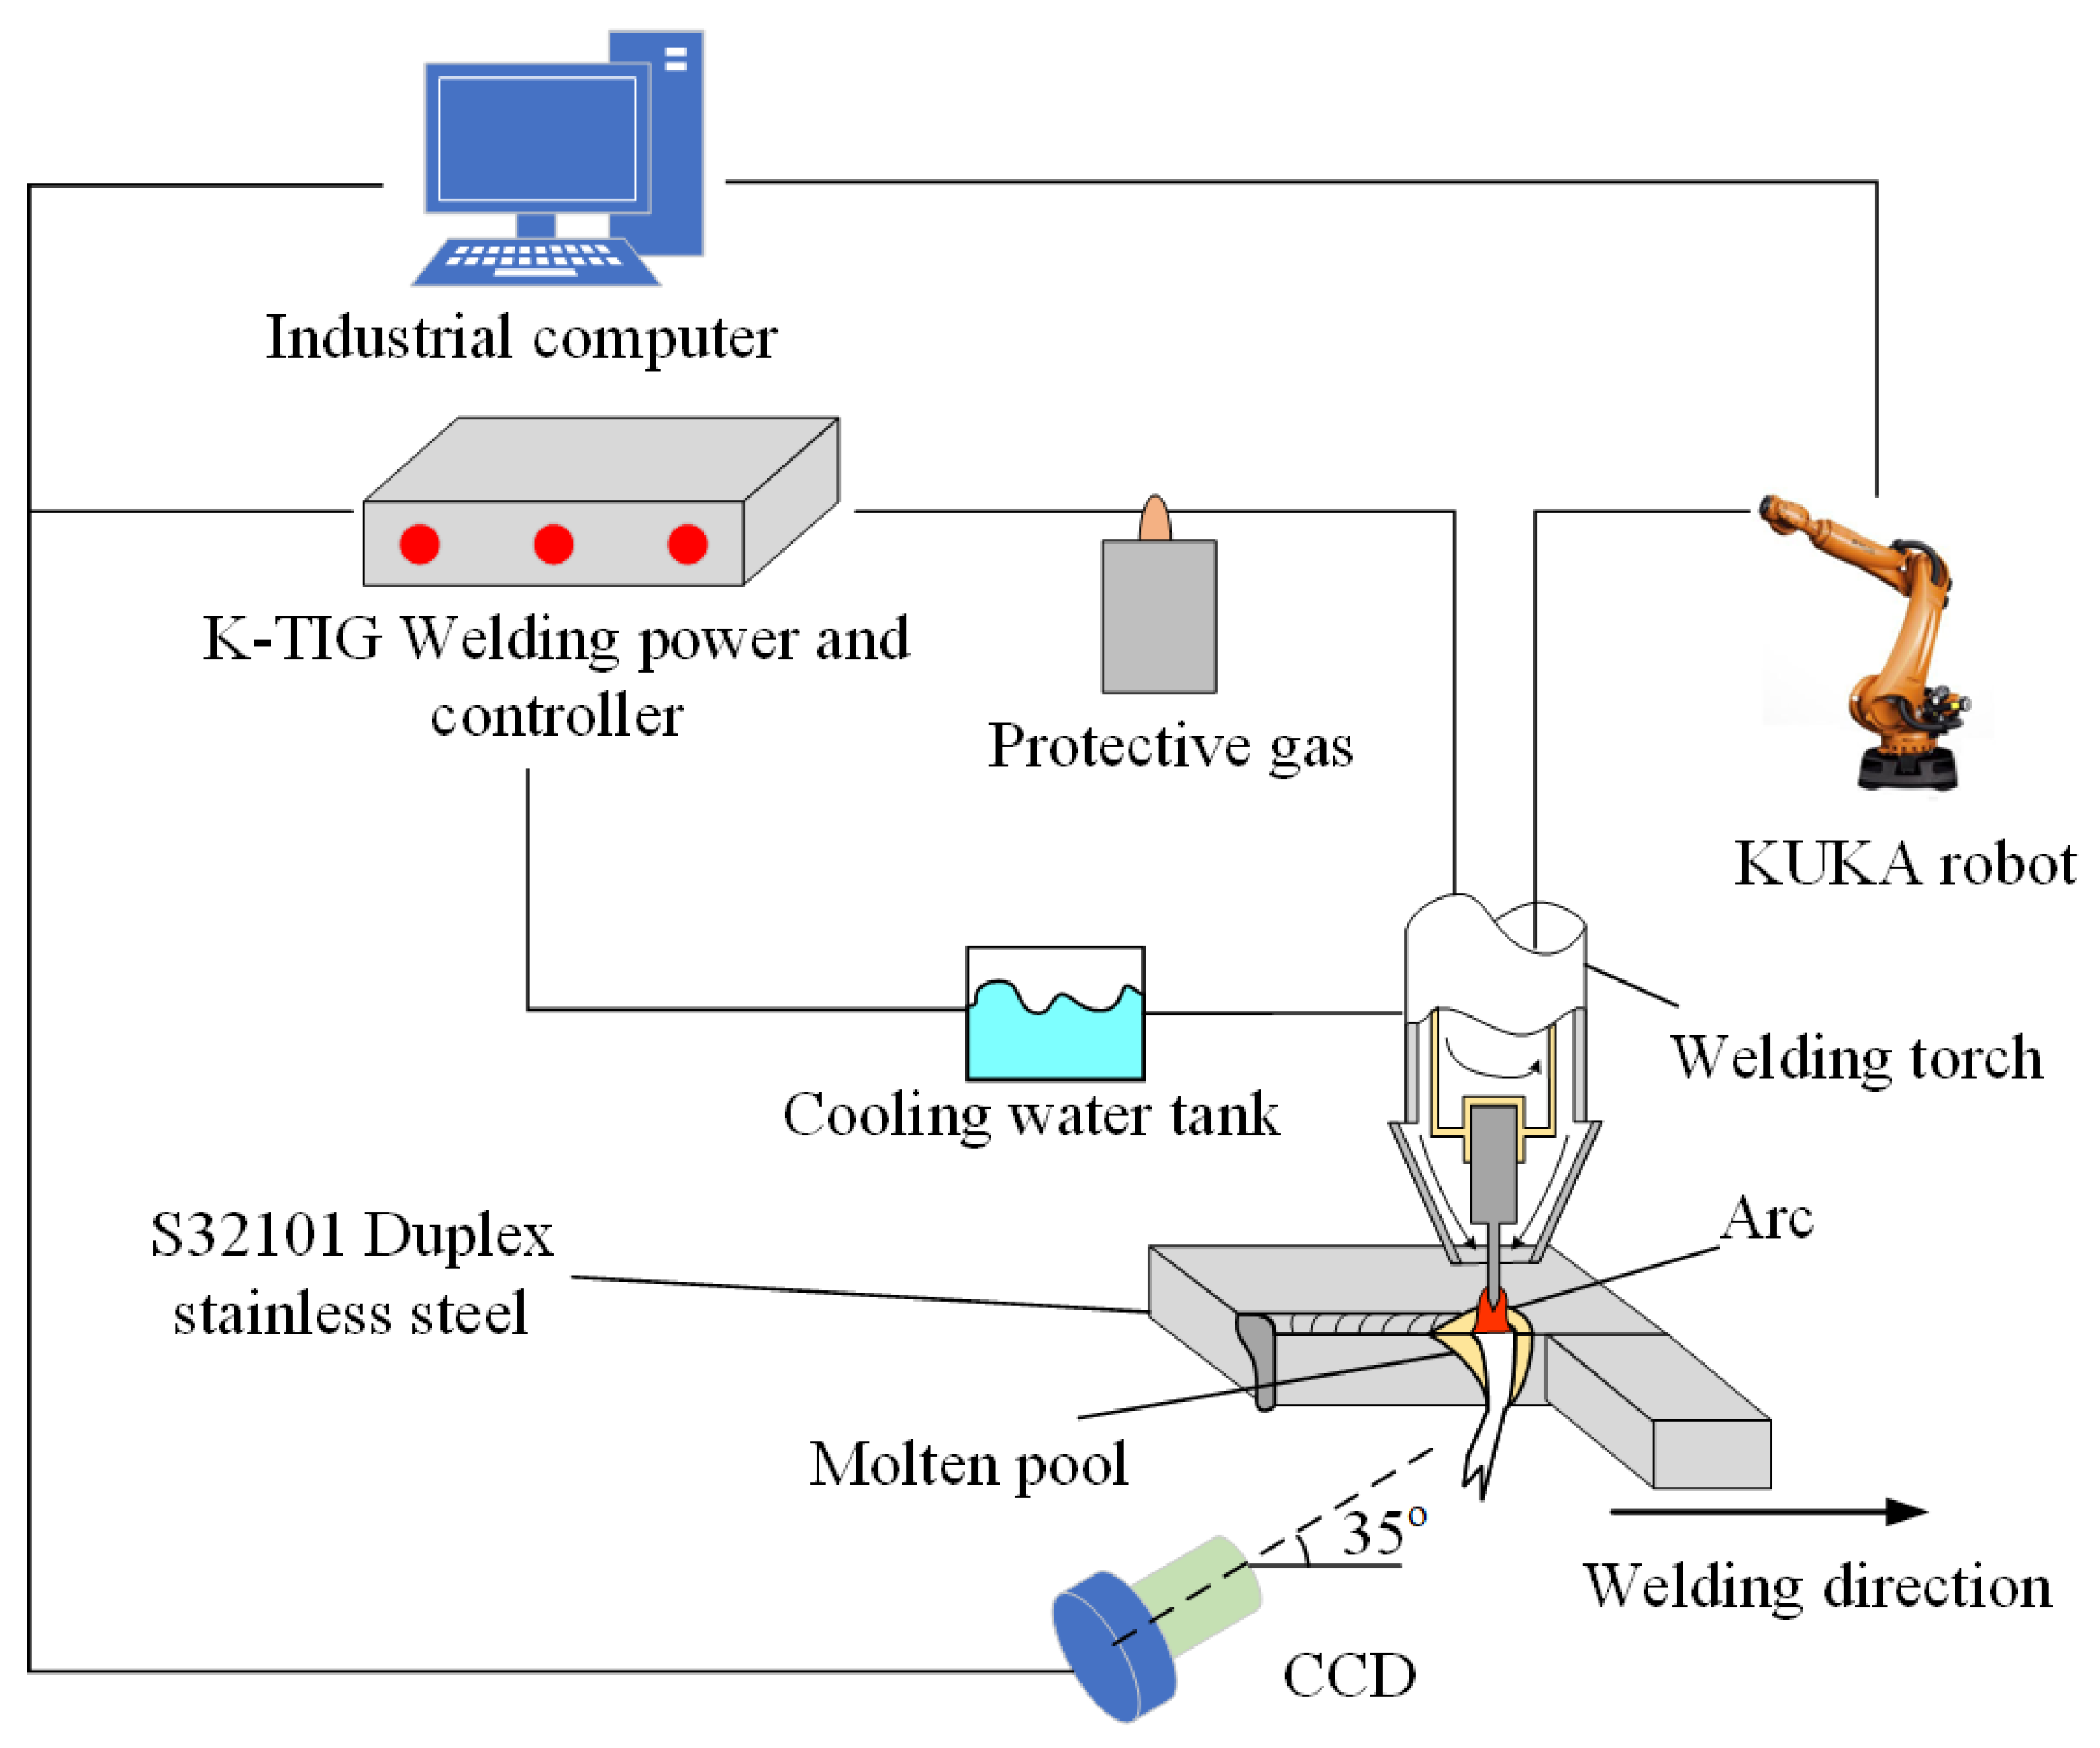
2.1. Material and Welding Procedure
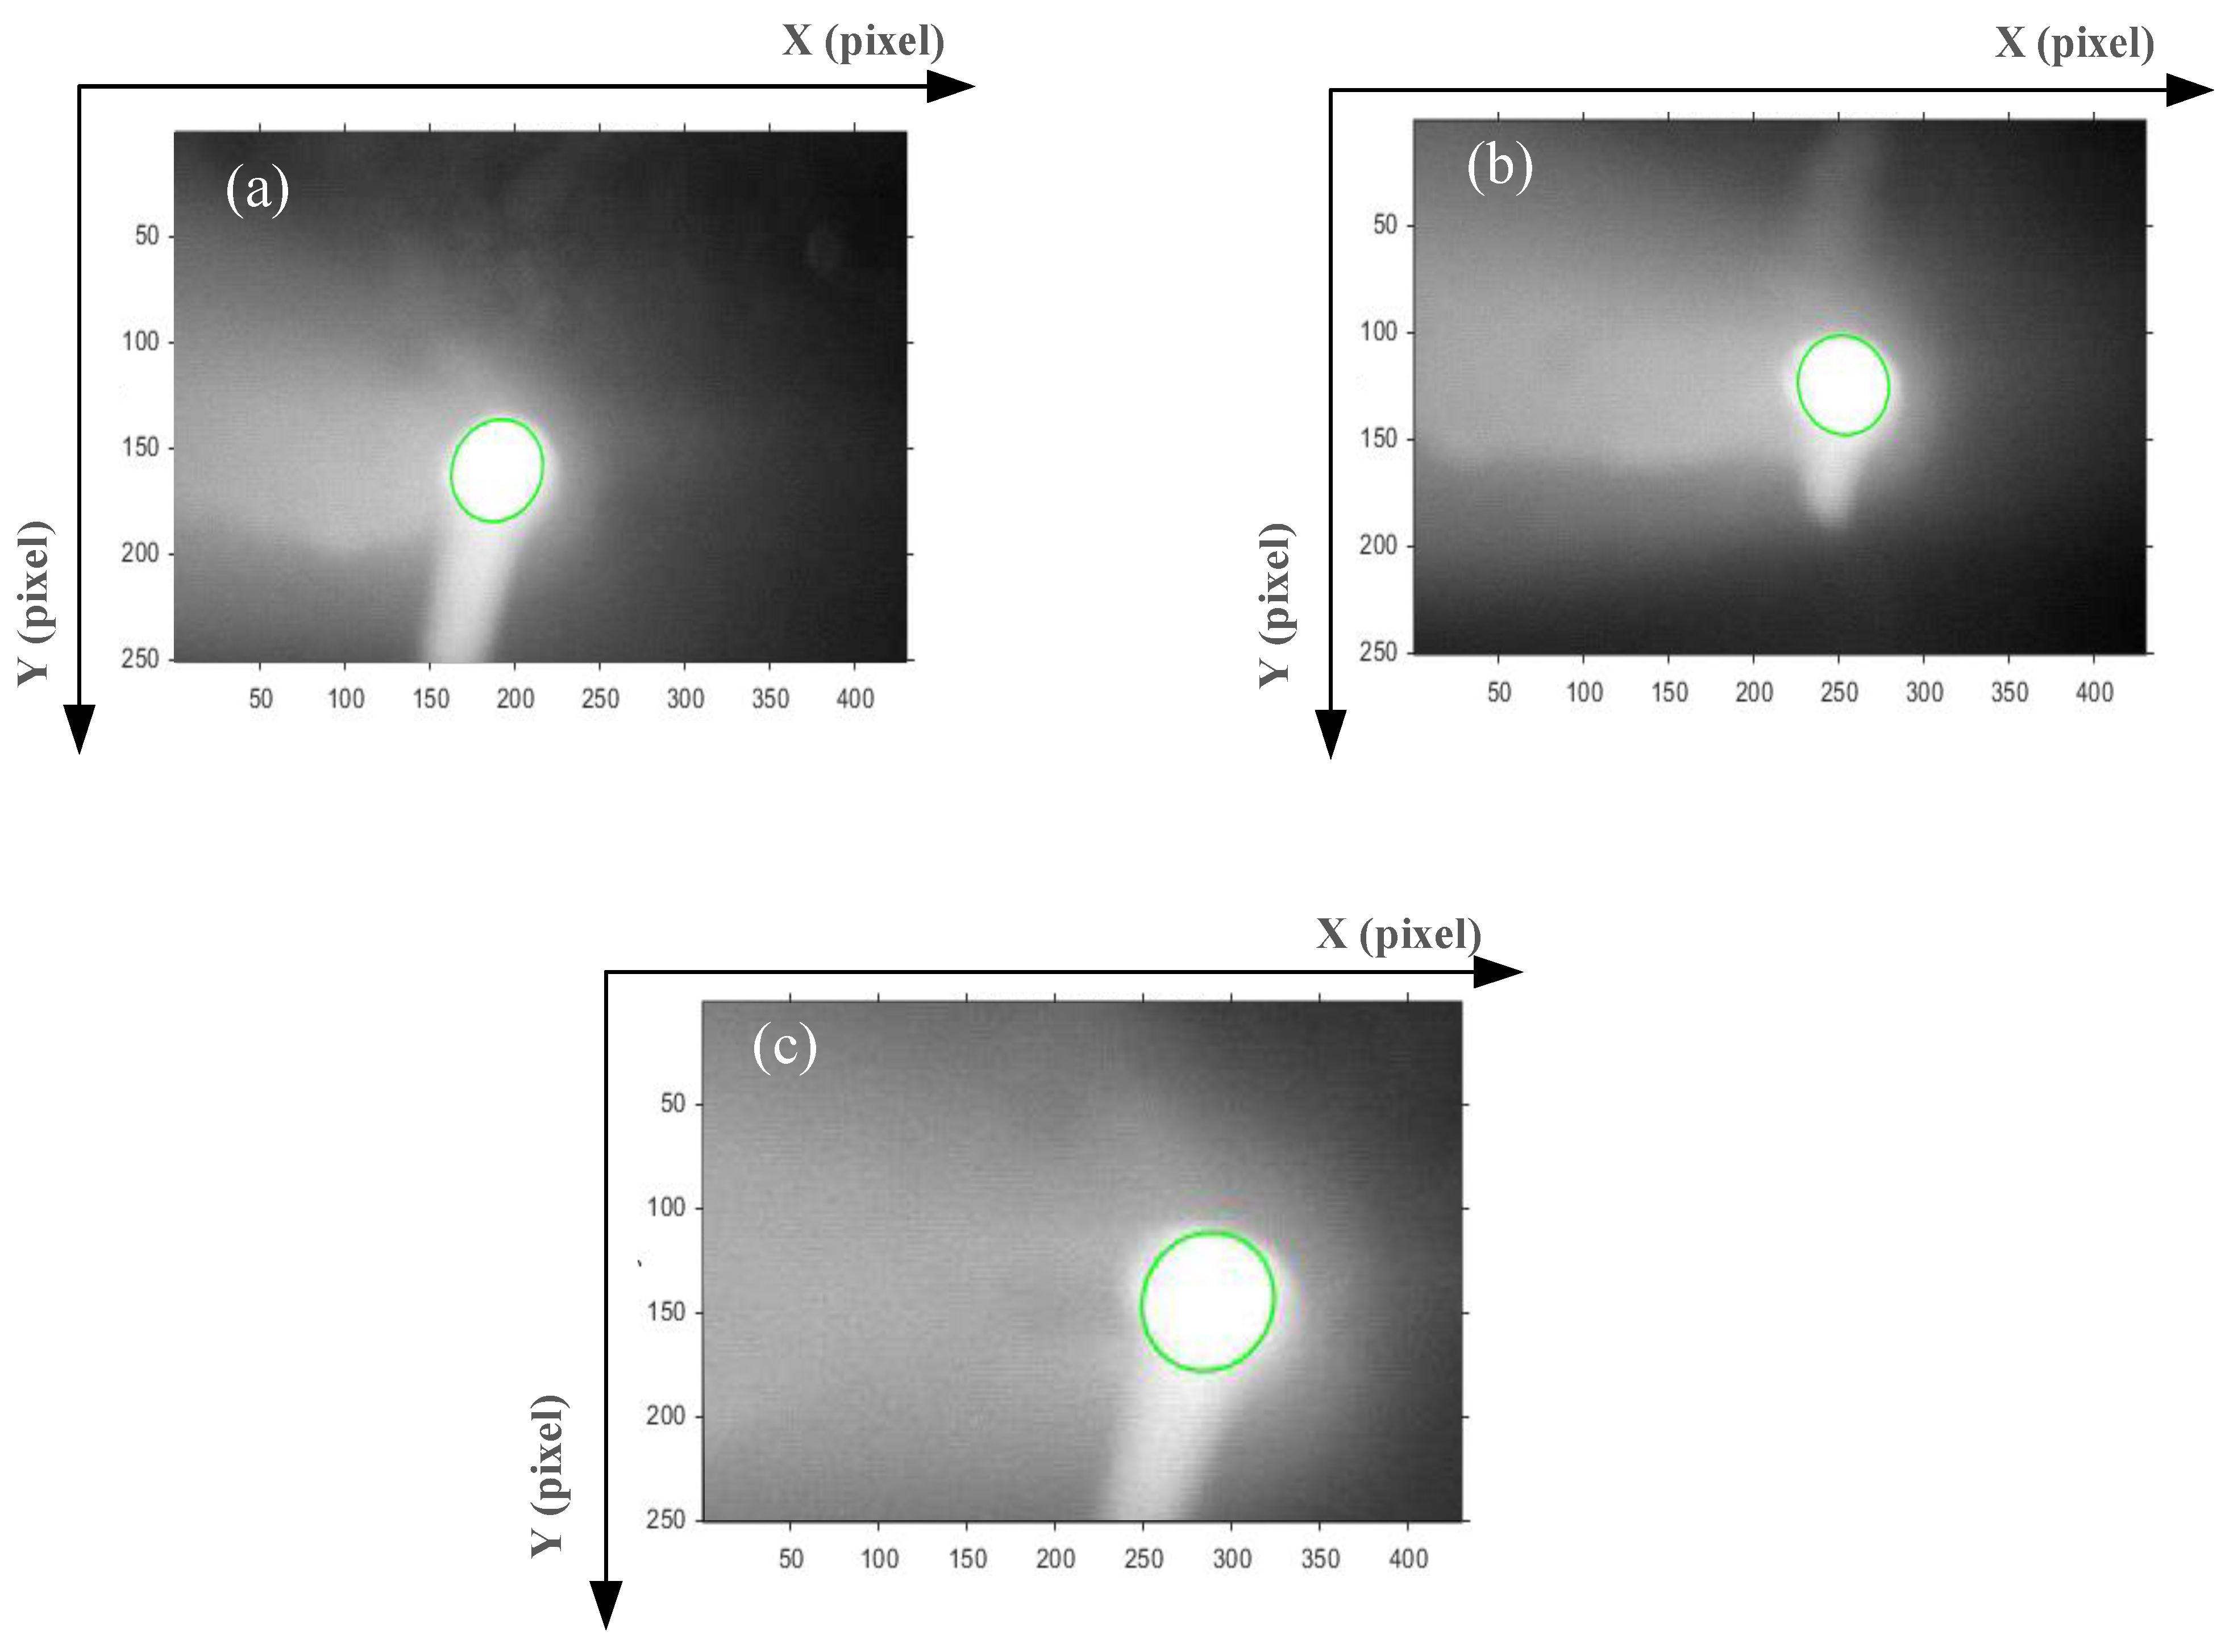
2.2. Keyhole Image Acquisition and Feature Extraction
- (1)
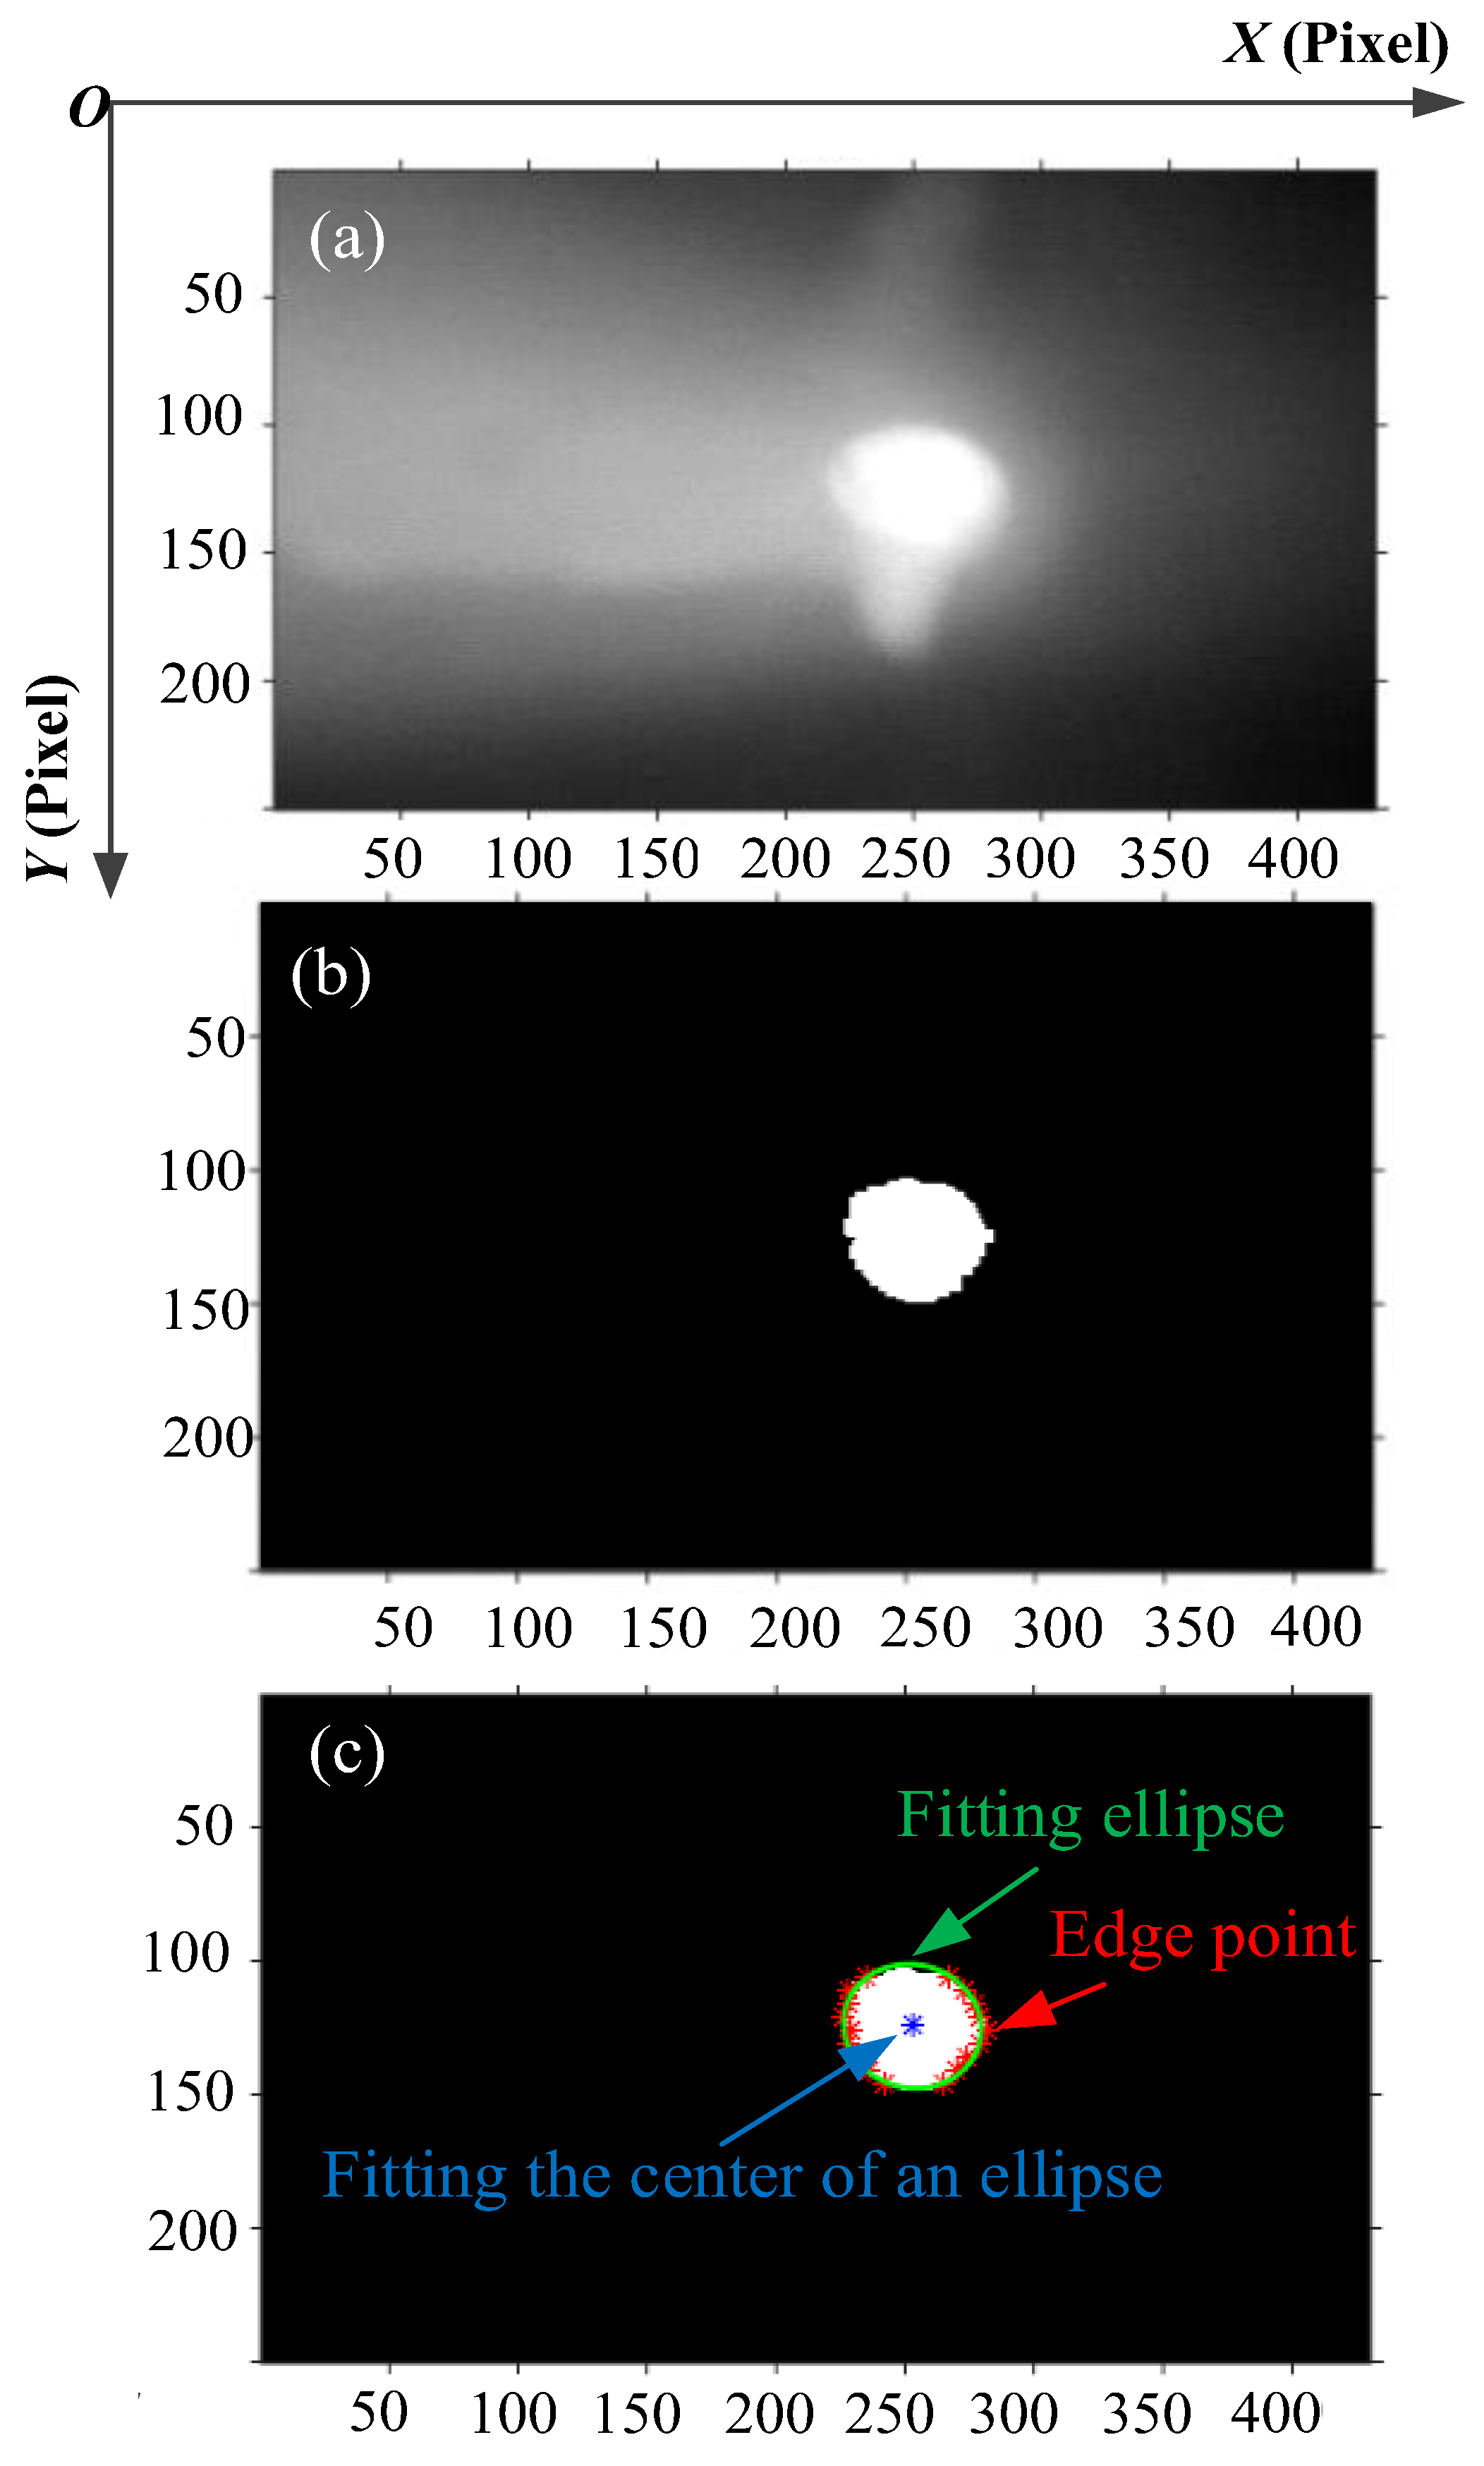
- Combining the characteristics of the grayscale distribution of the keyhole grayscale image, use 5 × 5 disc-shaped structural elements for the corrosion operation;
- (2)
- The method of multi-level threshold segmentation was used to solve the binary image of the keyhole, and the edge points were obtained by line scanning. The specific threshold segmentation was realized by Formulas (1) and (2). f (x, y), h (x, y) and g (x, y) were the gray values at the coordinates (x, y) of the raw image and the image after two divisions. T1 = 240, and T2 is the threshold calculated by the Otsu algorithm for h (x, y). Finally, the ellipse is fitted based on the least square method, as shown in Figure 3c.
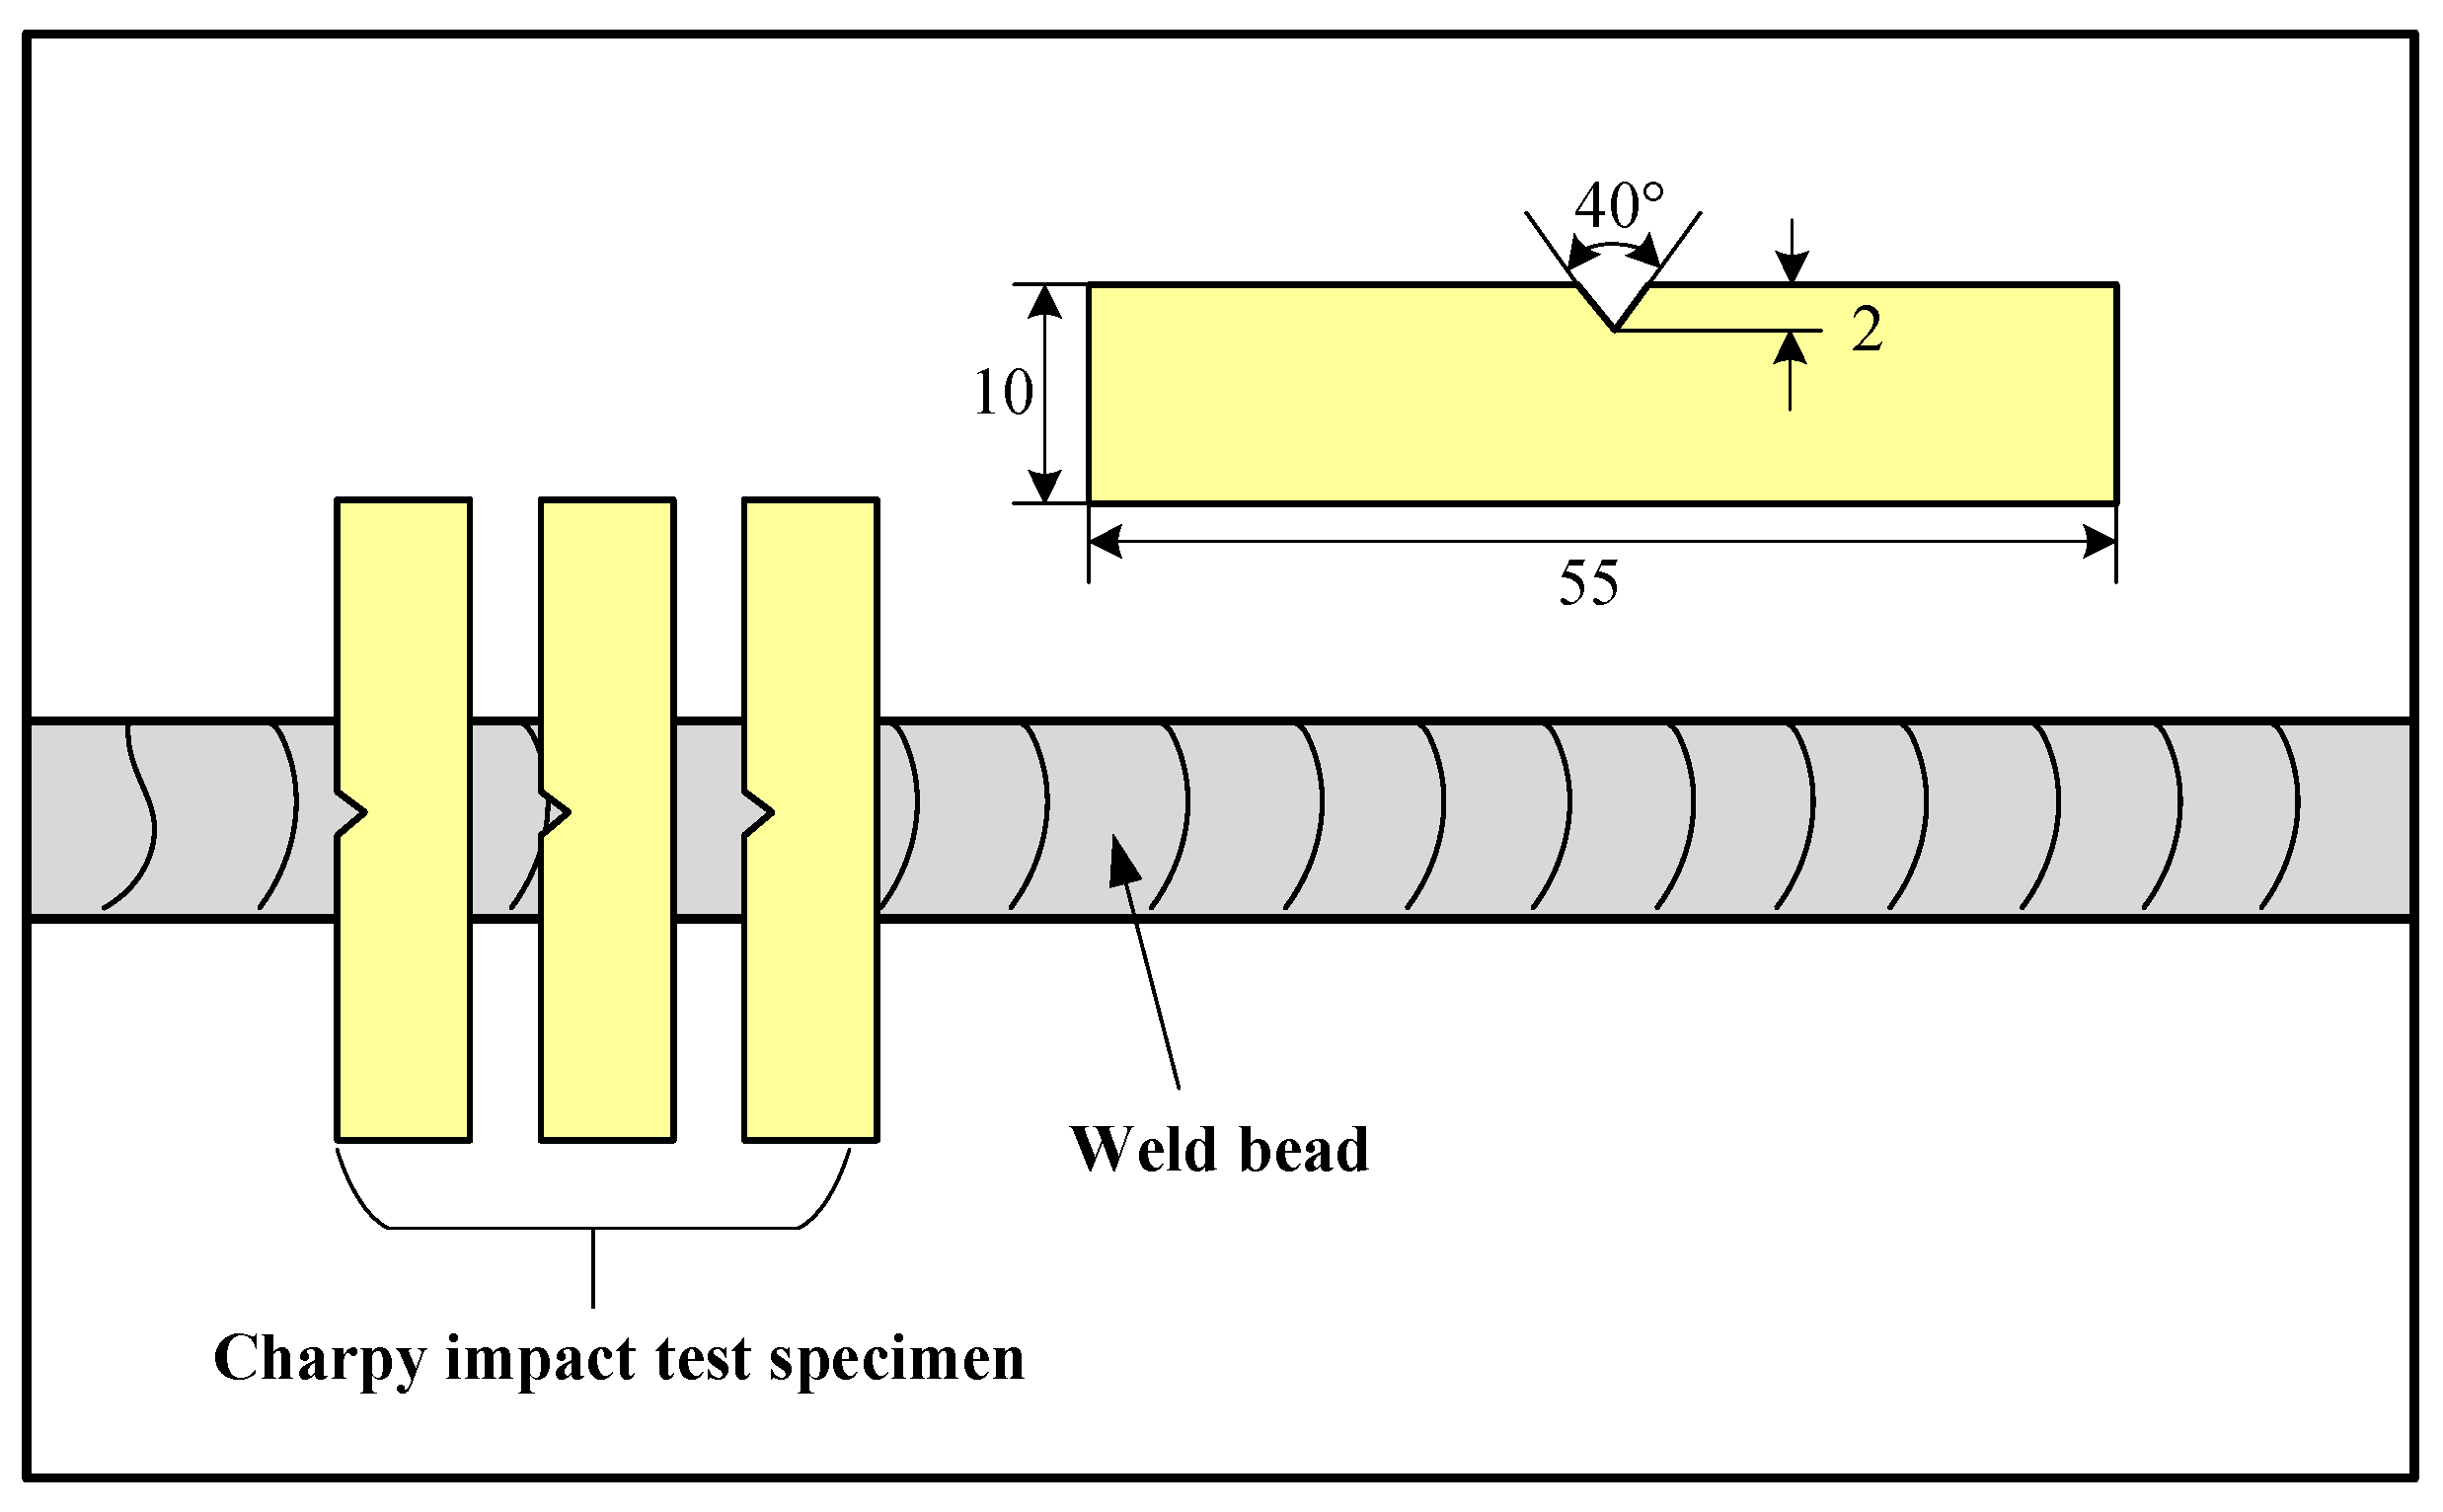
2.3. Joint Characterization
3. Results and Discussion
3.1. Geometry Profile of K-TIG Weld of S32101 Duplex Stainless Steel
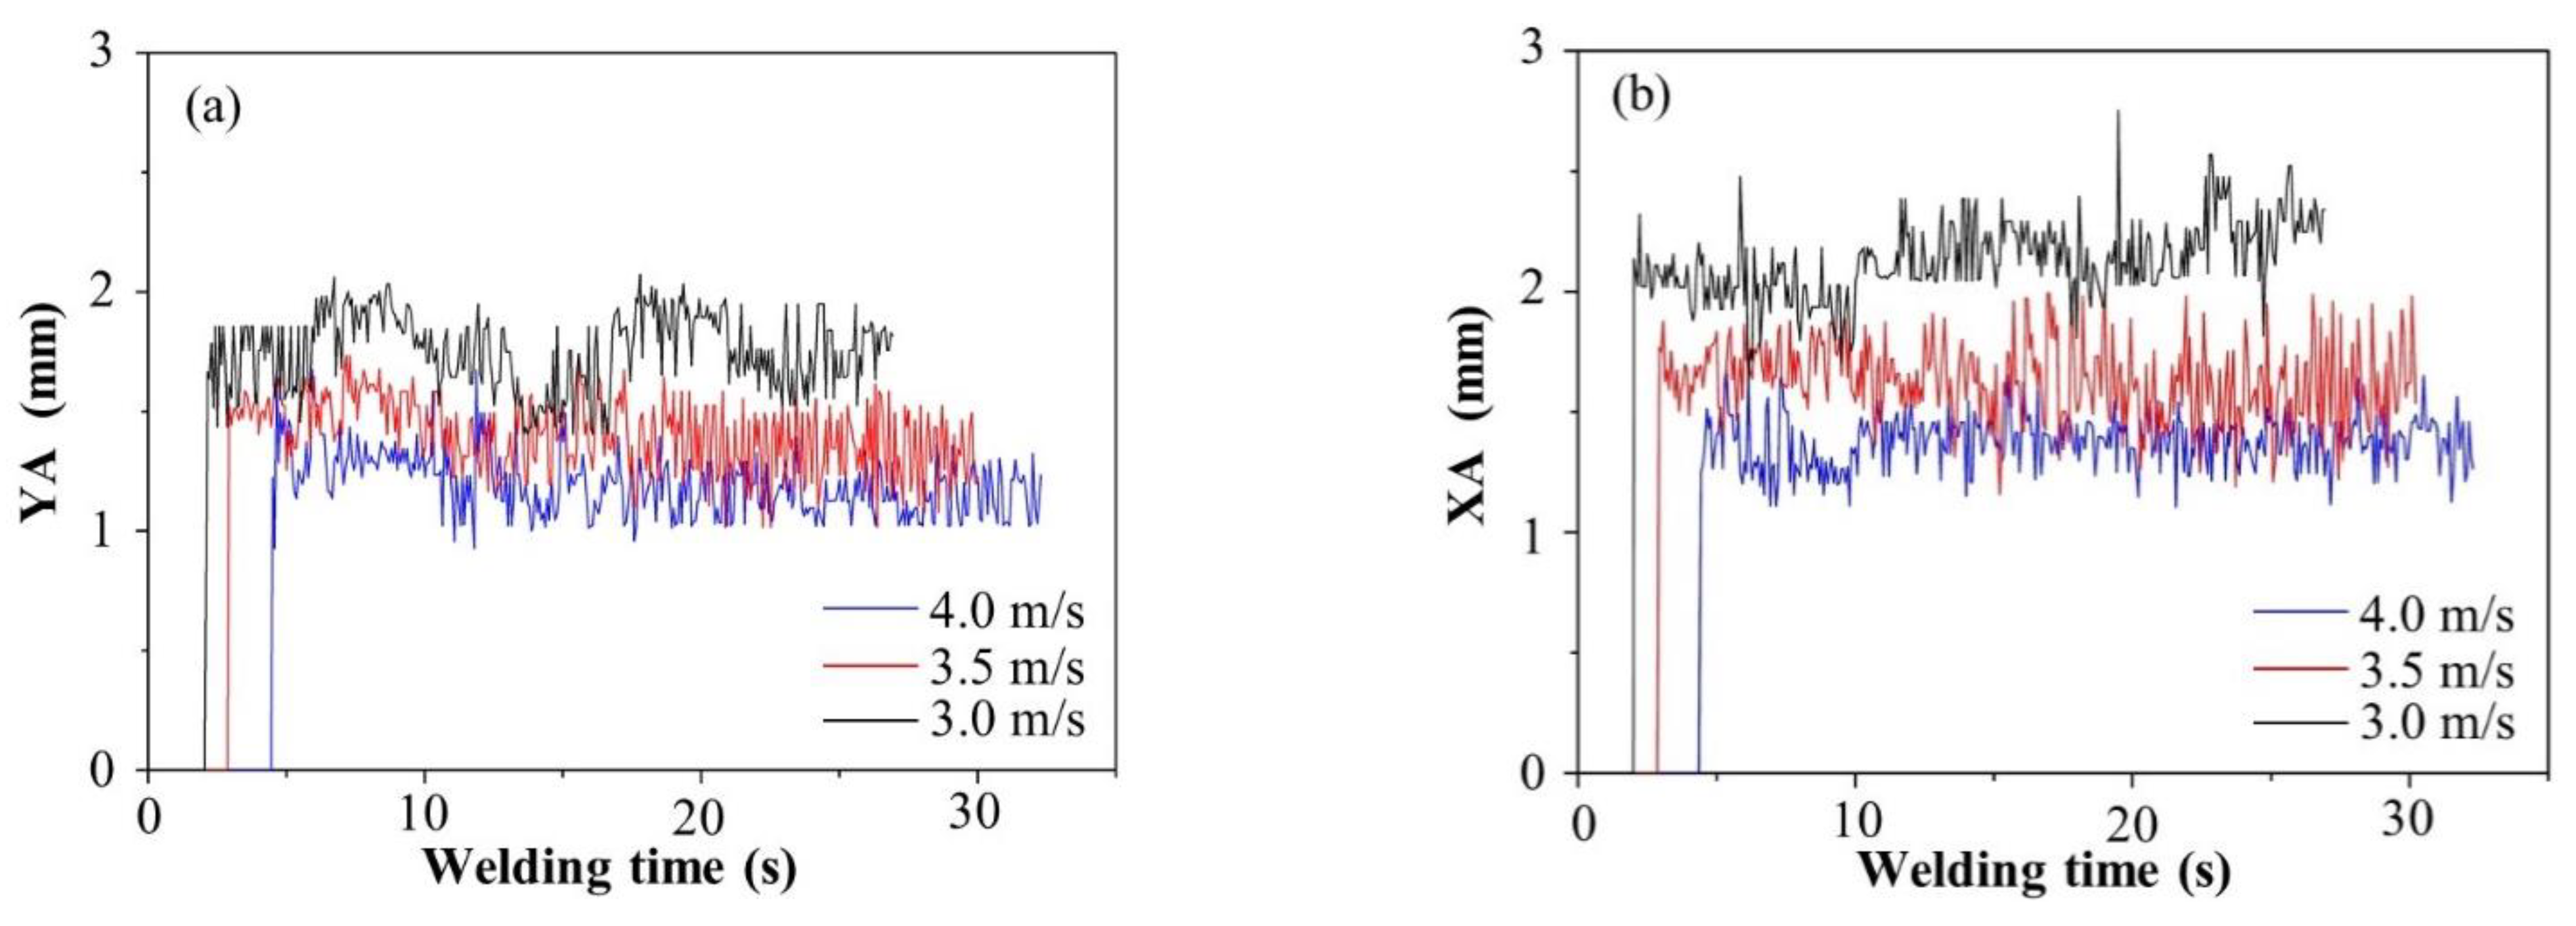
3.2. Dynamic Behavior and Characteristic Parameters of the Keyhole
3.2.1. Dynamic Behavior of the Keyhole
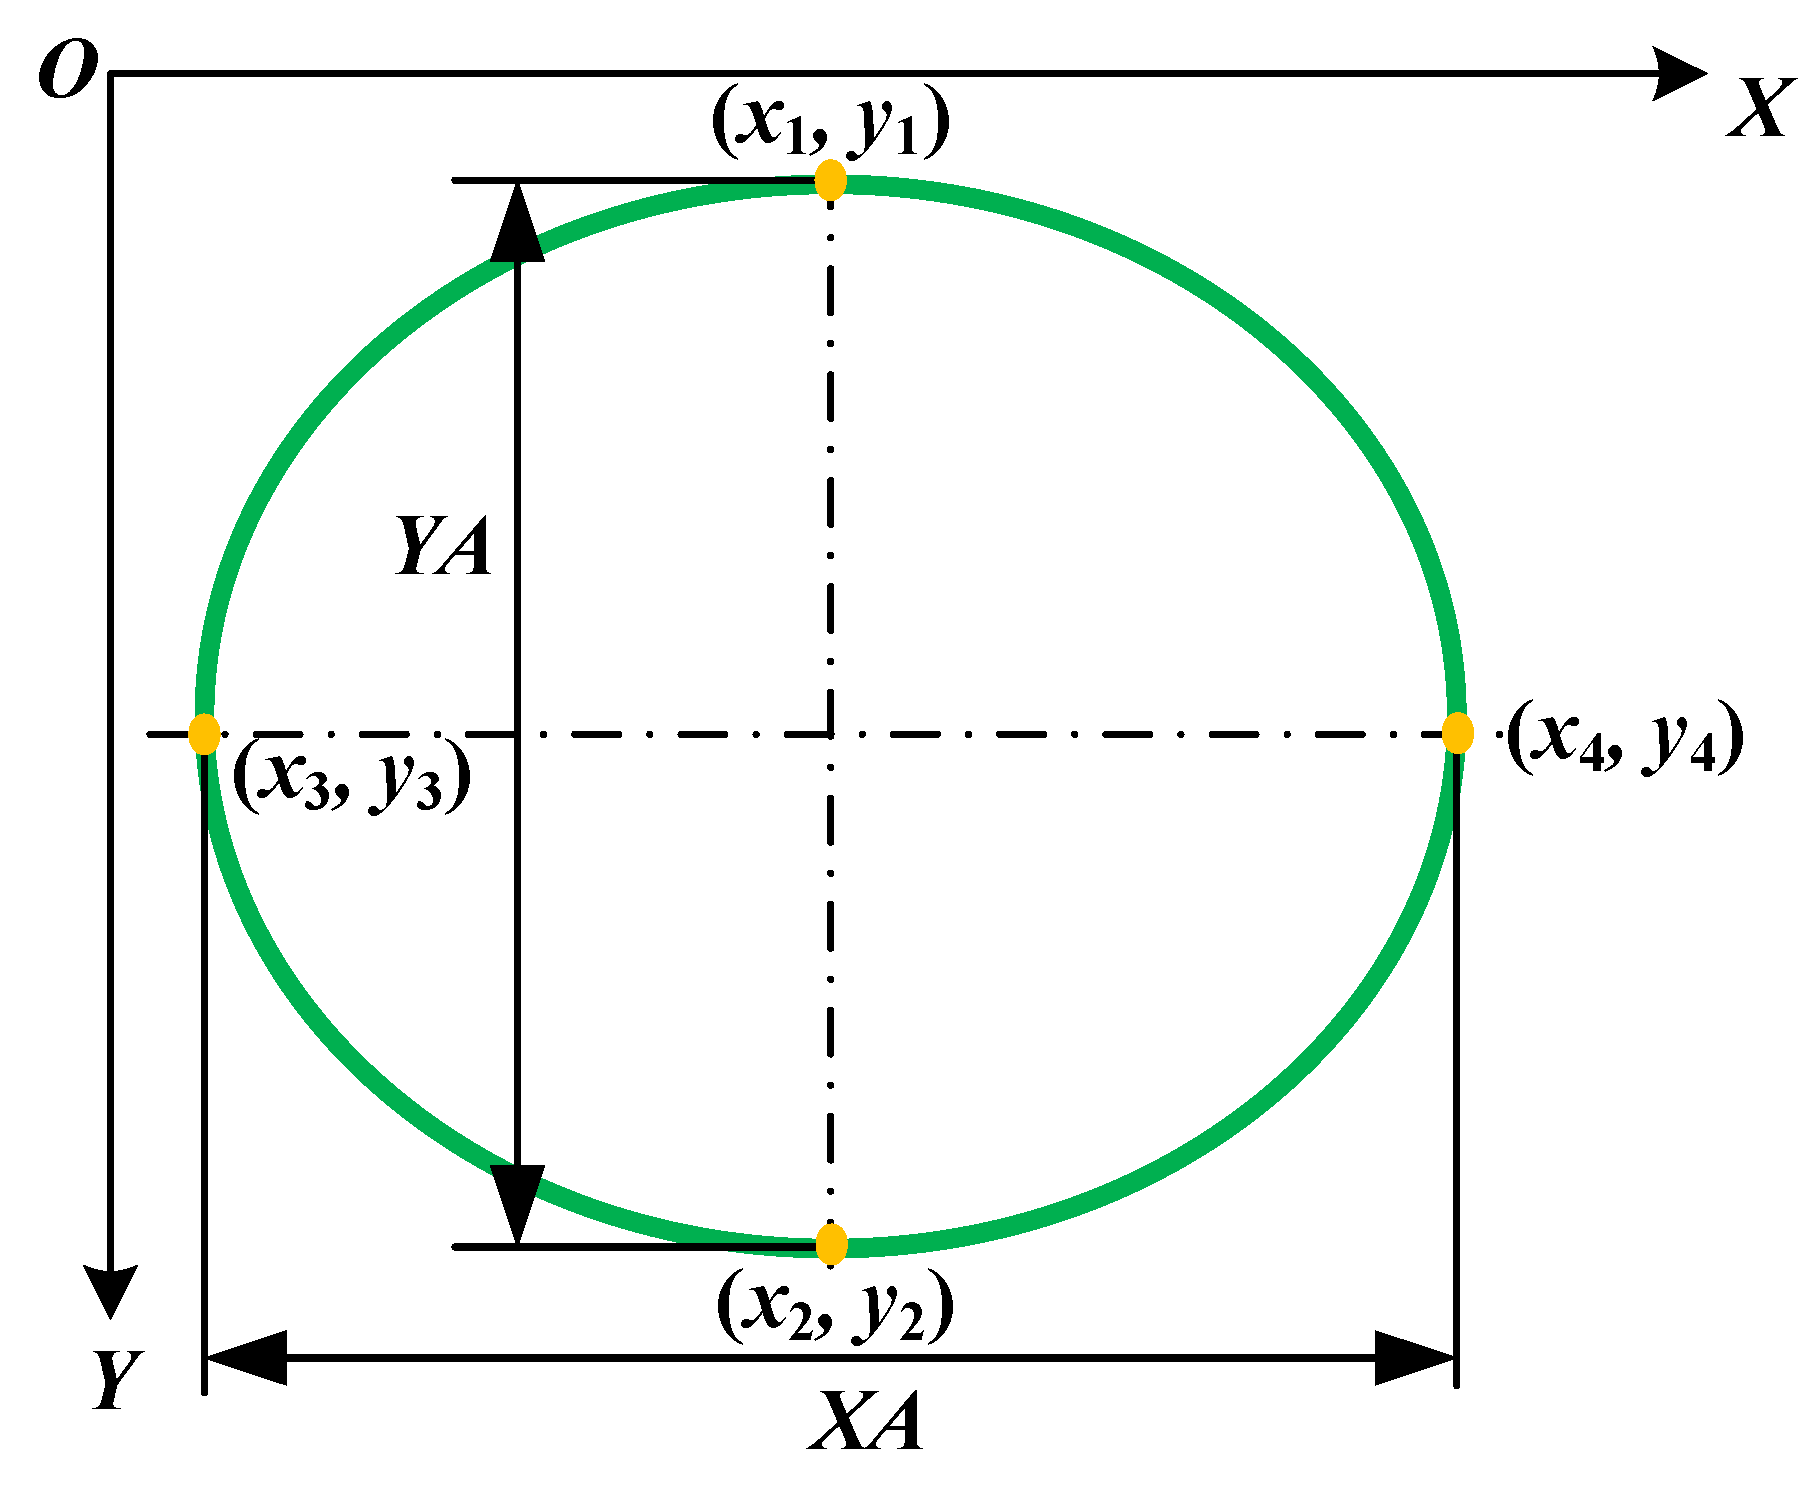
3.2.2. Characteristic Parameters of the Keyhole
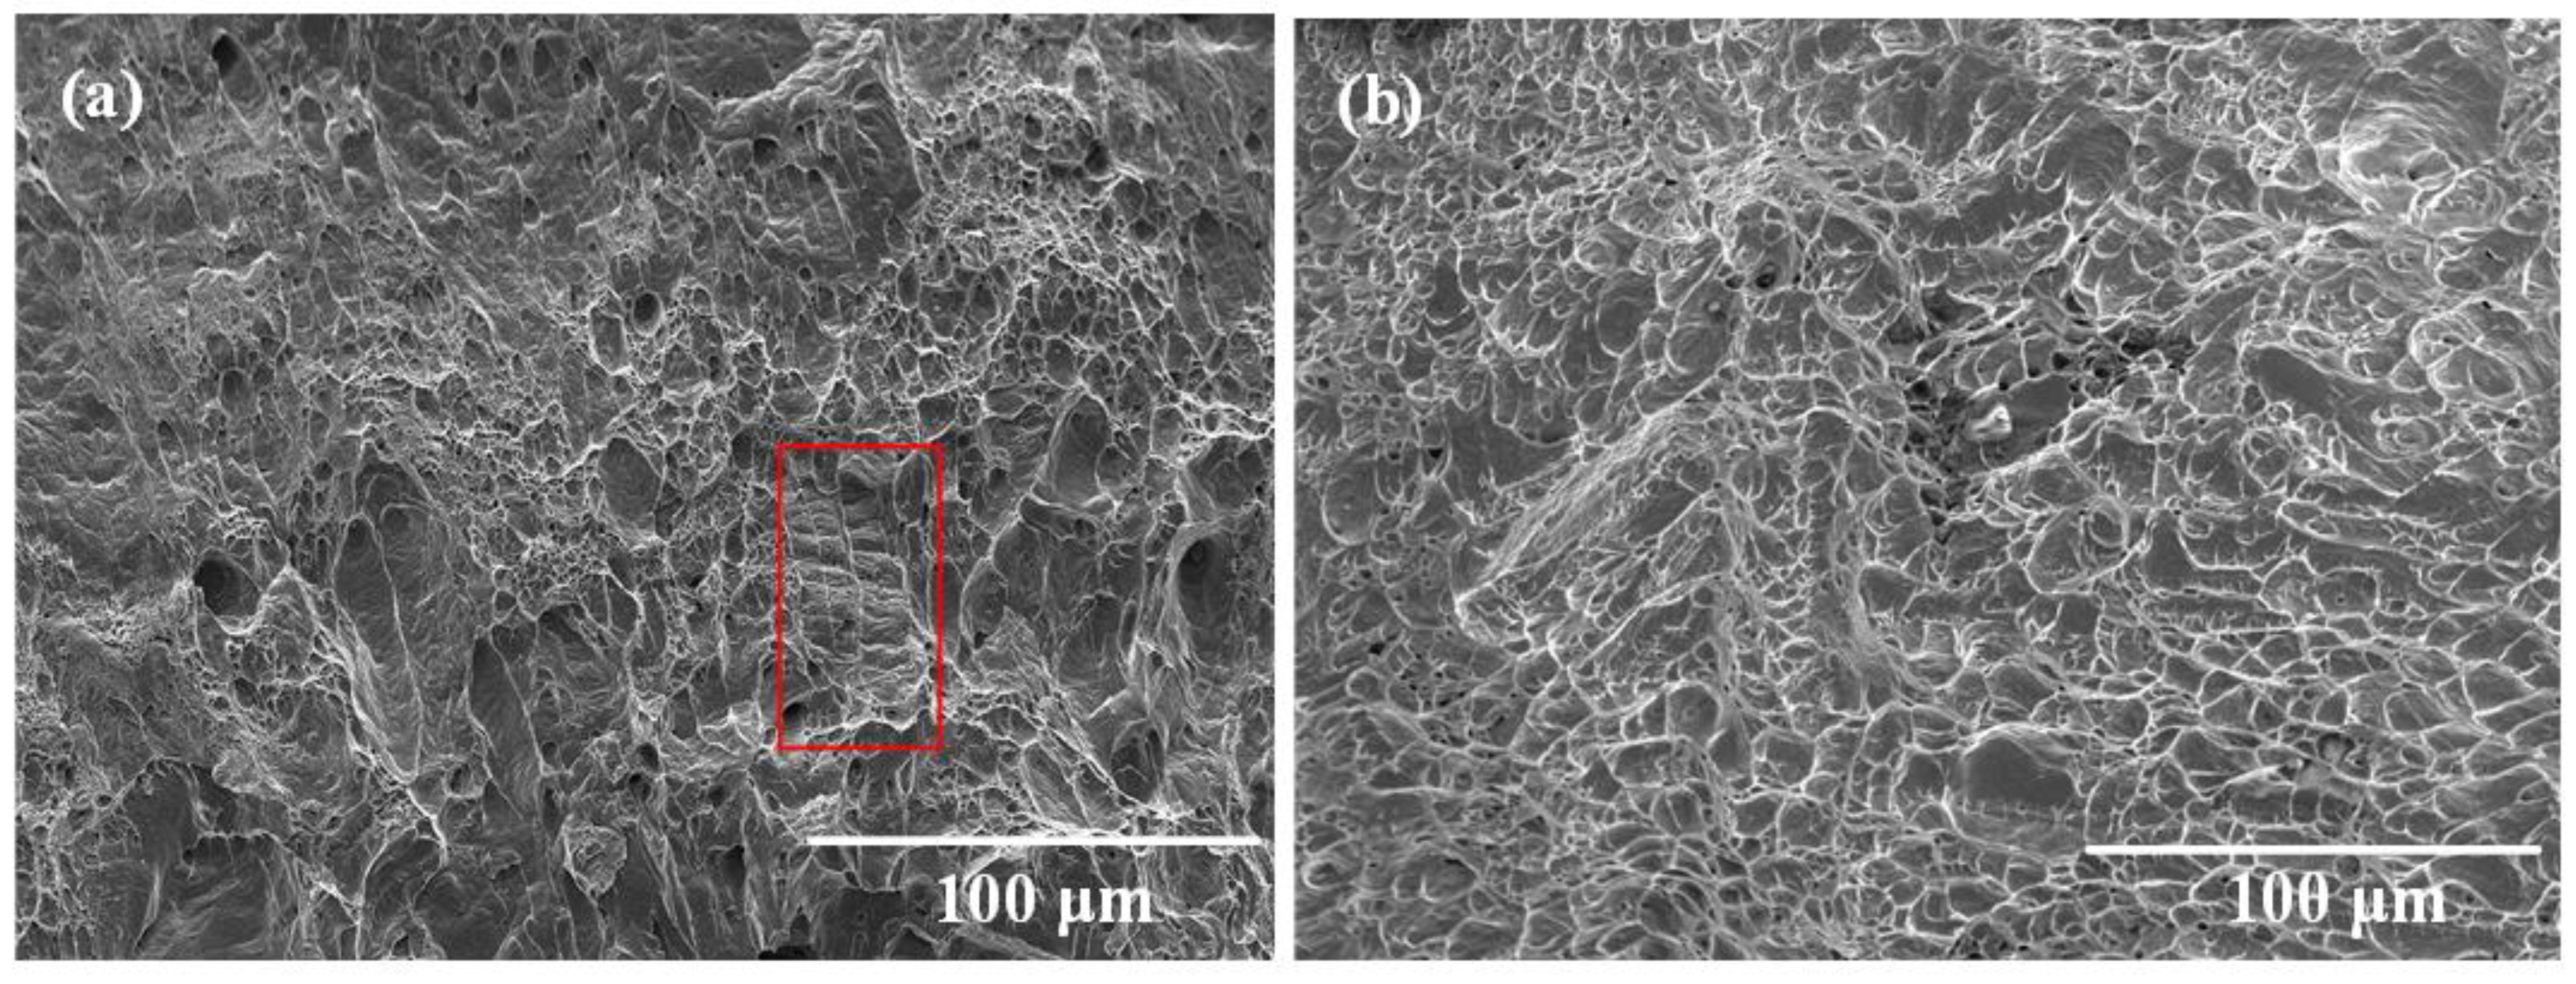
3.3. Impact Property
3.4. Effect of Microstructure in the WMZ on Its Impact Toughness
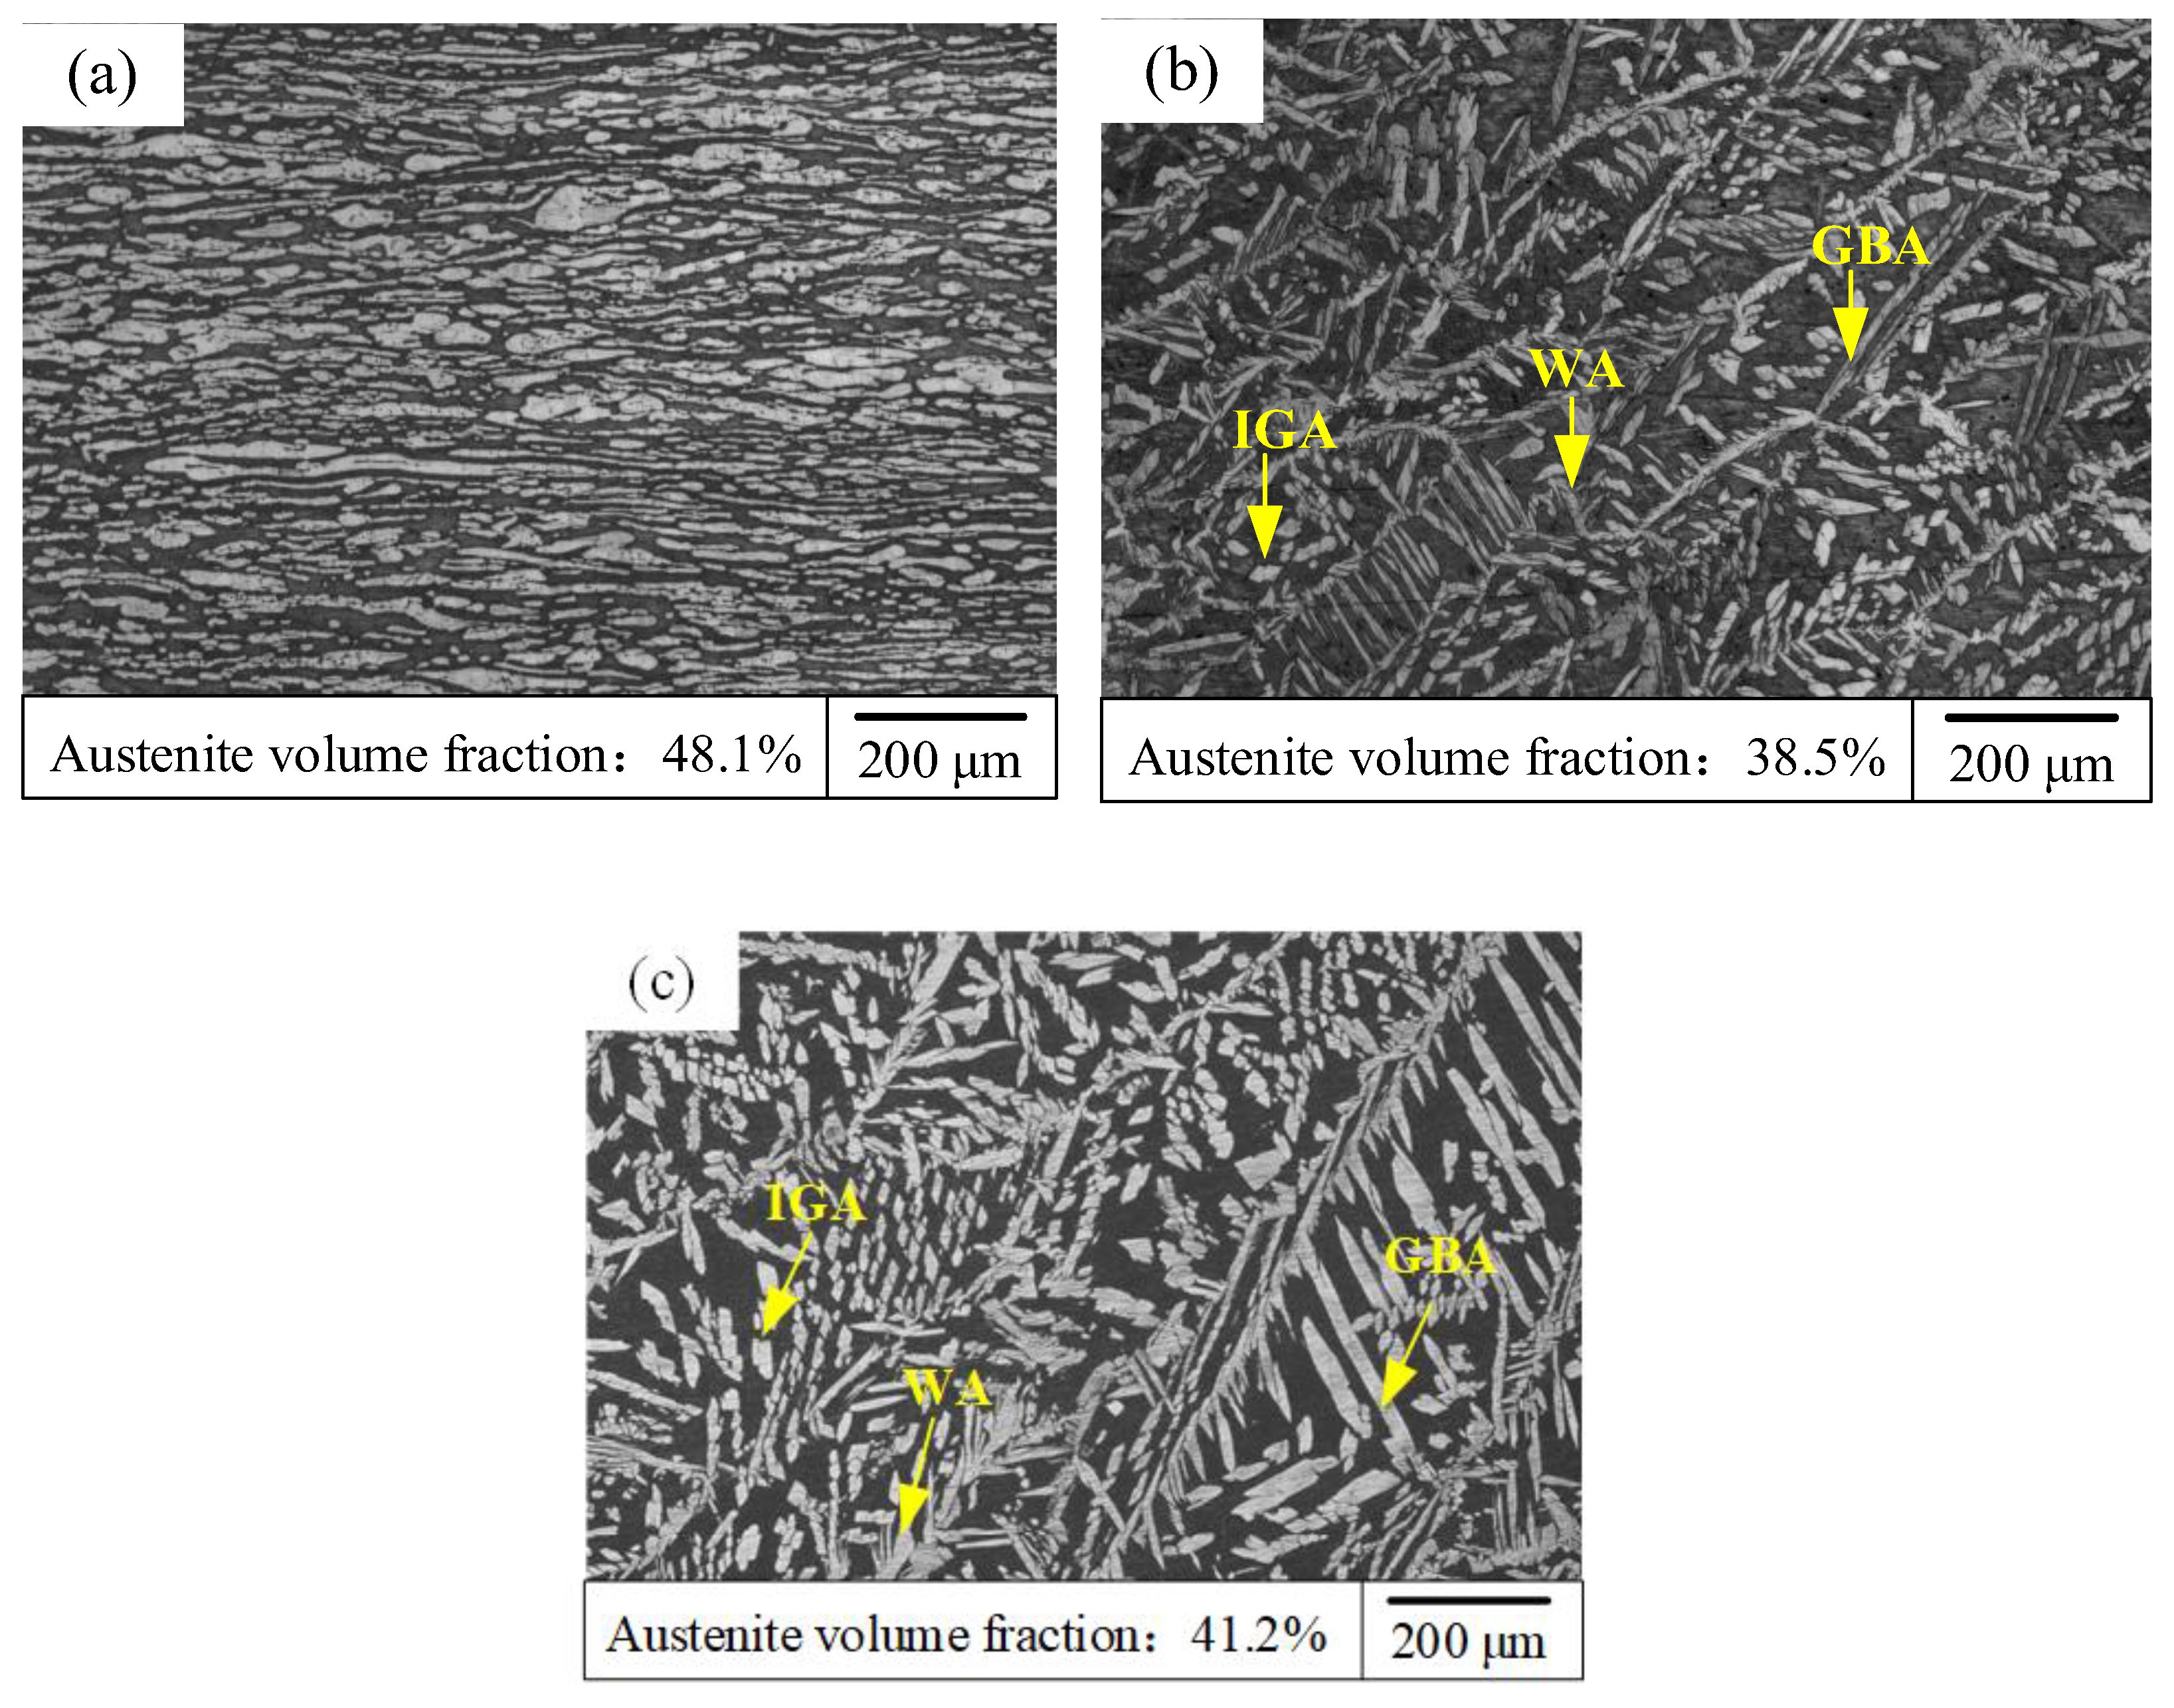
3.4.1. The Volume Fraction and Morphology of Austenite
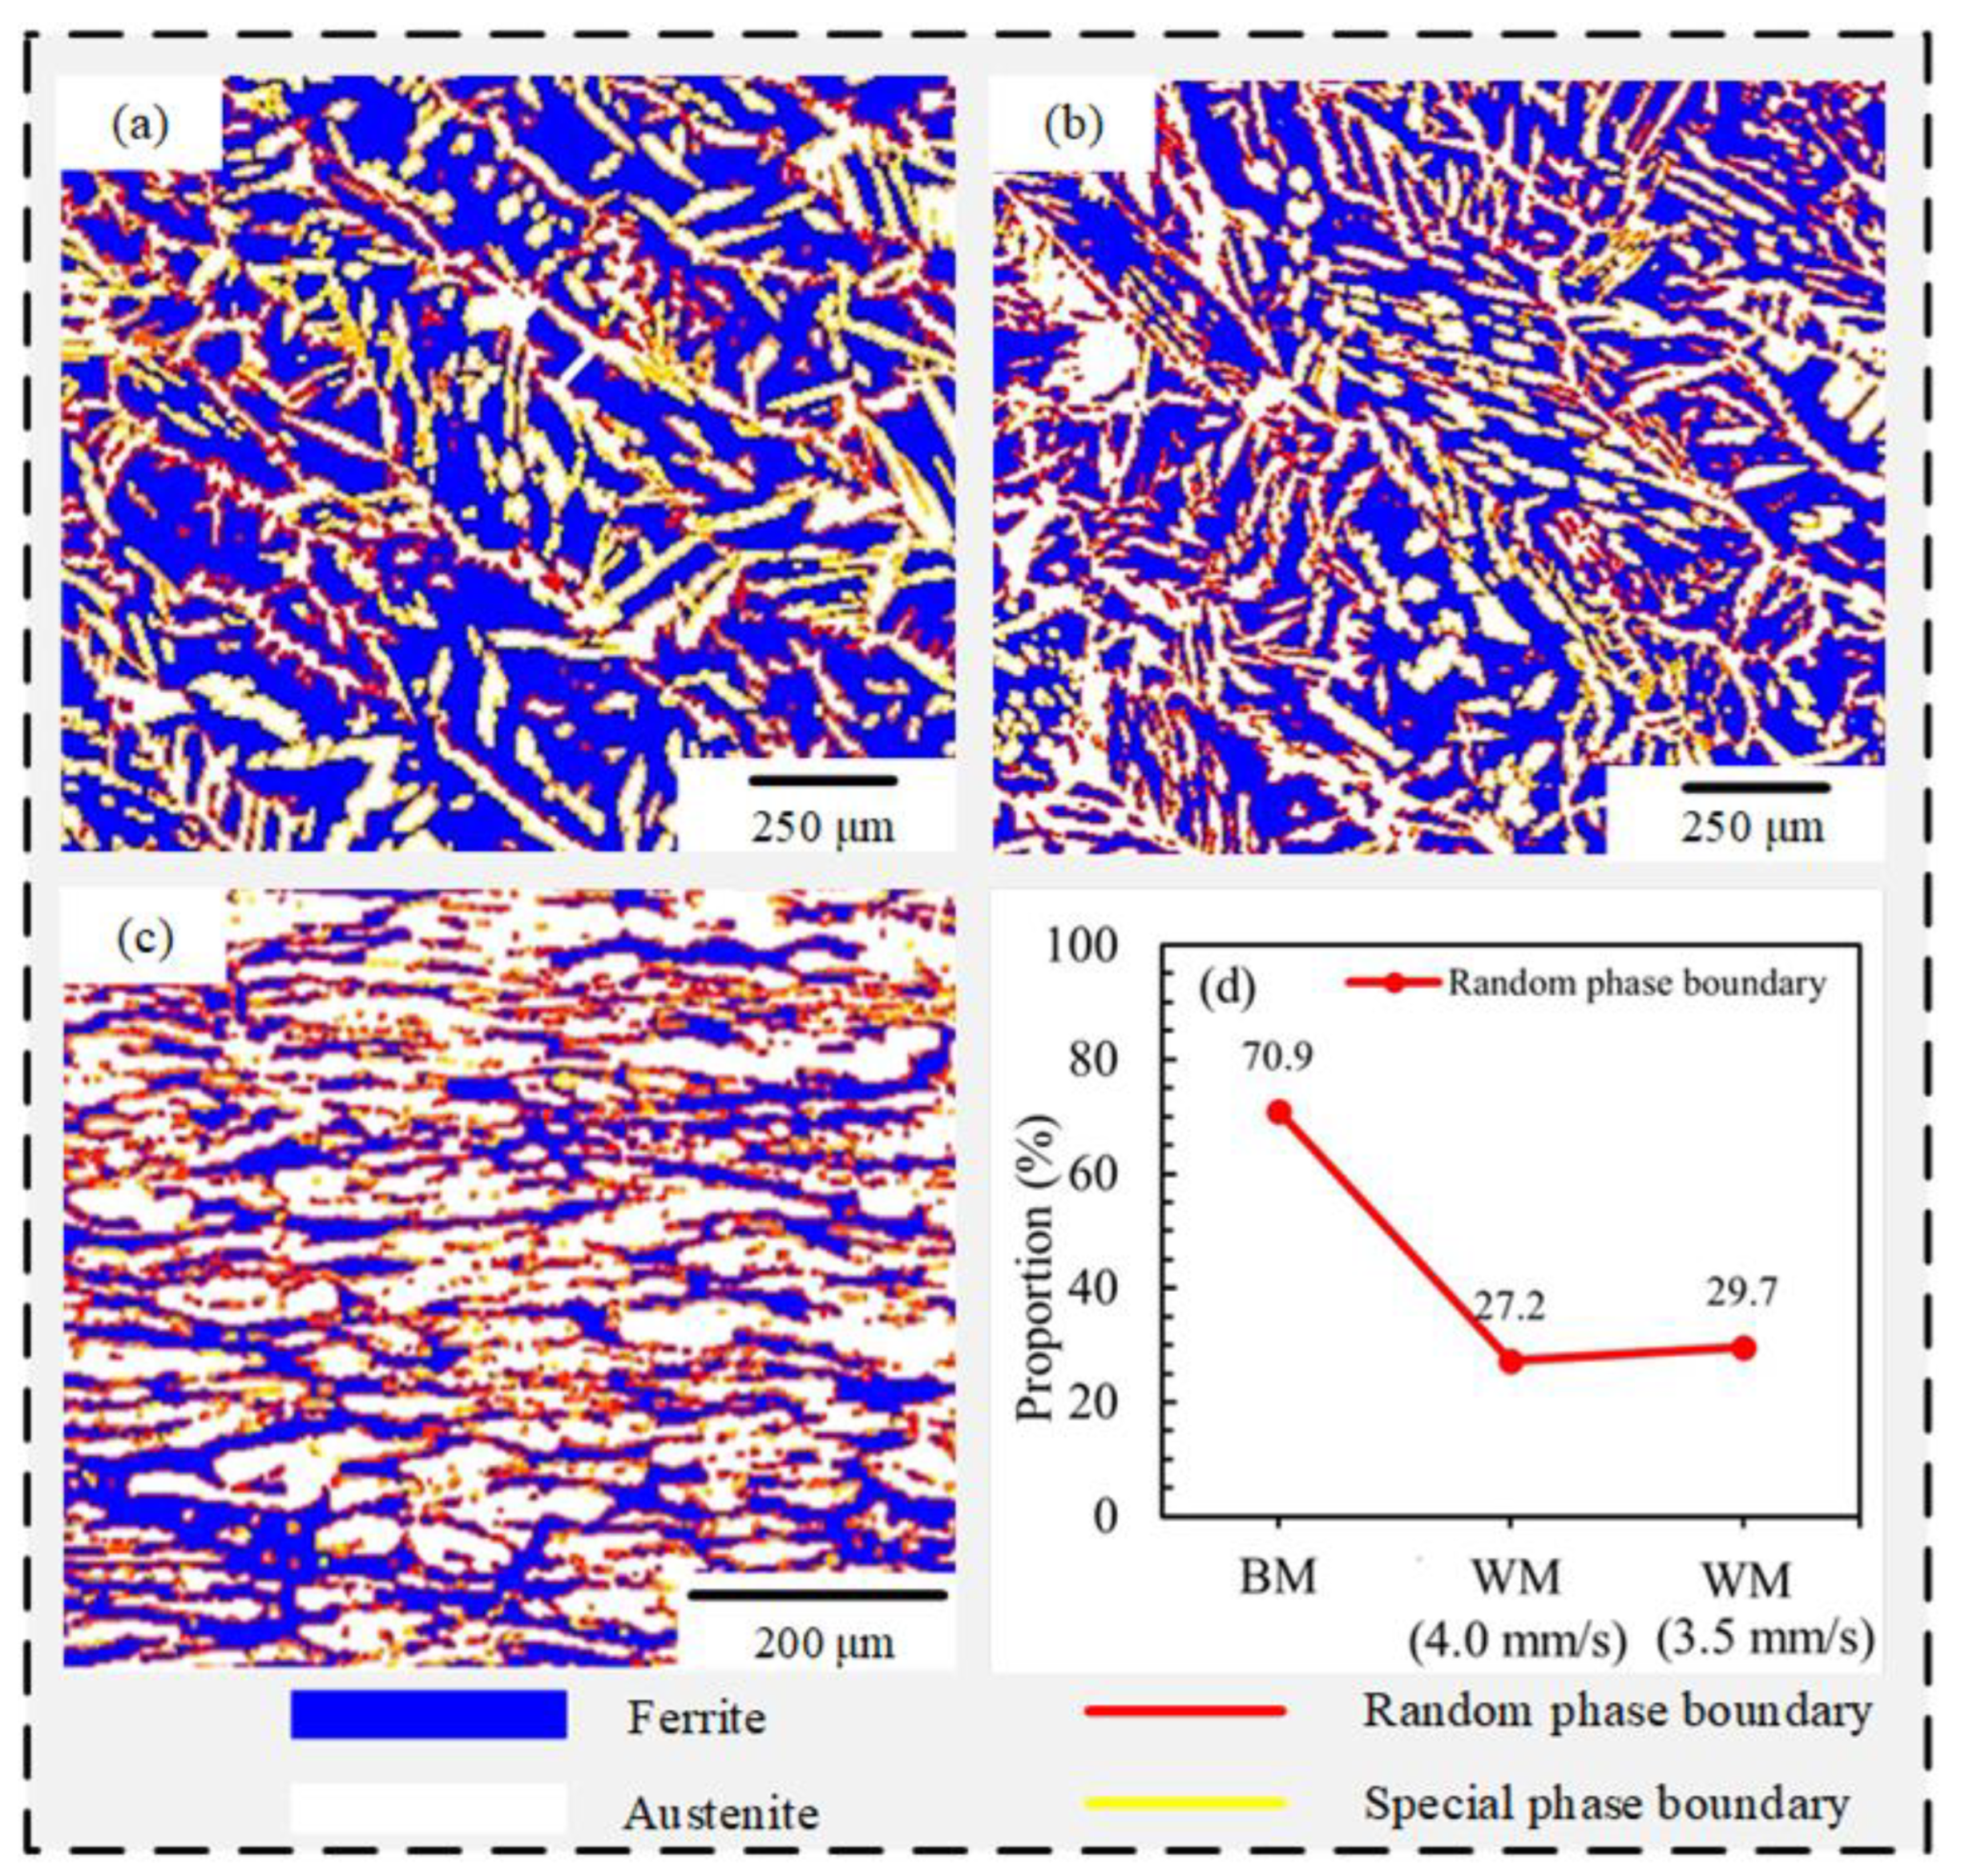
3.4.2. Effect of CSLGB on Impact Toughness of Welded Joint
3.4.3. Effect of Random Phase Boundary on Impact Toughness of Welded Joint
4. Conclusions
- The S32101 DSS welded joints were produced by applying a K-TIG welding system under different WS. When the WS were 3.5 mm/s and 4.0 mm/s, the weld morphologies were better.
- The keyhole was oval, and the characteristic parameters of the keyhole were dynamically changed during K-TIG welding. When the WS decreased, XA, YA, and SA of the keyhole changed significantly, which proved that the characteristic parameters of the keyhole can indirectly indicate the forming quality of the weld.
- When the WS was 3.5 mm/s, the impact toughness of the WMZ was better. The microstructure, GB orientation characteristics, and phase boundary have a certain influence on the impact toughness of the WMZ. When the proportion of the austenite, Σ3 CSLGB and random phase boundary increased, the impact toughness of the WMZ also increased.
Author Contributions
Funding
Data Availability Statement
Conflicts of Interest
References
- Ha, H.-Y.; Lee, T.-H.; Lee, C.-G.; Yoon, H. Understanding the relation between pitting corrosion resistance and phase fraction of S32101 duplex stainless steel. Corros. Sci. 2019, 149, 226–235. [Google Scholar] [CrossRef]
- Zhang, X.; Wang, P.; Li, D.; Li, Y. Multi-scale study on the heterogeneous deformation behavior in duplex stainless steel. J. Mater. Sci. Technol. 2021, 72, 180–188. [Google Scholar] [CrossRef]
- Cui, S.; Xian, Z.; Shi, Y.; Liao, B.; Zhu, T. Microstructure and Impact Toughness of Local-Dry Keyhole Tungsten Inert Gas Welded Joints. Materials 2019, 12, 1638. [Google Scholar] [CrossRef] [PubMed] [Green Version]
- Shi, Y.; Cui, S.; Zhu, T.; Gu, S.; Shen, X. Microstructure and intergranular corrosion behavior of HAZ in DP-TIG welded DSS joints. J. Mater. Process. Technol. 2018, 256, 254–261. [Google Scholar] [CrossRef]
- Westin, E.M.; Johansson, M.M.; Pettersson, R.F.A. Effect of nitrogen-containing shielding and backing gas on the pitting corrosion resistance of welded lean duplex stainless steel LDX 2101® (EN 1.4162, UNS S32101). Weld. World 2013, 57, 467–476. [Google Scholar] [CrossRef]
- Mourad, A.-H.; Khourshid, A.; Sharef, T. Gas tungsten arc and laser beam welding processes effects on duplex stainless steel 2205 properties. Mater. Sci. Eng. A 2012, 549, 105–113. [Google Scholar] [CrossRef]
- Pekkarinen, J.; Kujanpää, V. The effects of laser welding parameters on the microstructure of ferritic and duplex stainless steels welds. Phys. Procedia 2010, 5, 517–523. [Google Scholar] [CrossRef] [Green Version]
- Cui, S.; Shi, Y.; Zhu, T.; Liu, W. Microstructure, texture, and mechanical properties of Ti-6Al-4V joints by K-TIG welding. J. Manuf. Process. 2018, 37, 418–424. [Google Scholar] [CrossRef]
- Liu, Z.; Fang, Y.; Cui, S.; Yi, S.; Qiu, J.; Jiang, Q.; Liu, W.; Luo, Z. Keyhole thermal behavior in GTAW welding process. Int. J. Therm. Sci. 2017, 114, 352–362. [Google Scholar] [CrossRef]
- Cui, S.; Shi, Y.; Sun, K.; Gu, S. Microstructure evolution and mechanical properties of keyhole deep penetration TIG welds of S32101 duplex stainless steel. Mater. Sci. Eng. A 2019, 709, 214–222. [Google Scholar] [CrossRef]
- A370-17; Standard Test Methods and Definitions for Mechanical Testing of Steel Products. ASTM International: West Conshohocken, PA, USA, 2017.
- Zhang, Z.; Jing, H.; Xu, L.; Han, Y.; Zhao, L.; Zhang, J. Influence of microstructure and elemental partitioning on pitting corrosion resistance of duplex stainless steel welding joints. Appl. Surf. Sci. 2017, 394, 297–314. [Google Scholar] [CrossRef]
- Cui, S.; Shi, Y.; Cui, Y.; Zhu, T. The impact toughness of novel keyhole TIG welded duplex stainless steel joints. Eng. Fail. Anal. 2018, 94, 226–231. [Google Scholar] [CrossRef]
- Michiuchi, M.; Kokawa, H.; Wang, Z.; Sato, Y.; Sakai, K. Twin-induced grain boundary engineering for 316 austenitic stainless steel. Acta Mater. 2006, 54, 5179–5184. [Google Scholar] [CrossRef]
- Cui, S.-W.; Shi, Y.-H.; Zhang, C.-S. Microstructure and mechanical properties of TC4 titanium alloy K-TIG welded joints. Trans. Nonferrous Met. Soc. China 2021, 31, 416–425. [Google Scholar] [CrossRef]
- Randle, V.; Jones, R. Grain boundary plane distributions and single-step versus multiple-step grain boundary engineering. Mater. Sci. Eng. A 2009, 524, 134–142. [Google Scholar] [CrossRef]
- Piñol-Juez, A.; Iza-Mendia, A.; Gutiérrez, I. δ/γ Interface bondary sliding as a mechanism for strain accommodation during hot deformation in a duplex stainless steel. Met. Mater. Trans. A 2000, 31, 1671–1677. [Google Scholar] [CrossRef]
- Patra, S.; Ghosh, A.; Kumar, V.; Chakrabarti, D.; Singhal, L. Deformation induced austenite formation in as-cast 2101 duplex stainless steel and its effect on hot-ductility. Mater. Sci. Eng. A 2016, 660, 61–70. [Google Scholar] [CrossRef]
- Karlsson, L.; Börjesson, J. Orientation relationships of intragranular austenite in duplex stainless steel weld metals. Sci. Technol. Weld. Join. 2014, 19, 318–323. [Google Scholar] [CrossRef]
- Zhang, Z.; Jing, H.; Xu, L.; Han, Y.; Zhao, L.; Lv, X.; Zhang, J. The impact of annealing temperature on improving microstructure and toughness of electron beam welded duplex stainless steel. J. Manuf. Process. 2018, 31, 568–582. [Google Scholar] [CrossRef]


| Test | Welding Current | Welding Speed | Flow Rate of Argon |
|---|---|---|---|
| (A) | (mm/s) | L/min | |
| 1 | 530 | 5.0 | 20 |
| 2 | 530 | 4.5 | 20 |
| 3 | 530 | 4.0 | 20 |
| 4 | 530 | 3.5 | 20 |
| 5 | 530 | 3.0 | 20 |
| Welding Speed (mm/s) | Keyhole Image |
|---|---|
| 5.0 |  |
| 4.5 | 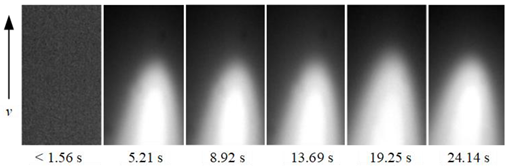 |
| 4.0 | 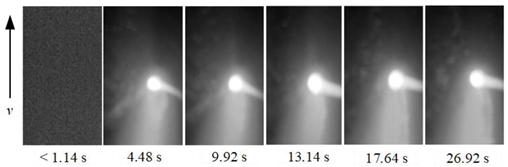 |
| 3.5 |  |
| 3.0 | 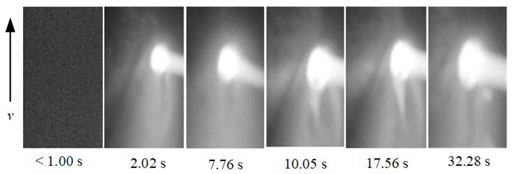 |
| Keyhole Parameters | Welding Speed (mm/s) | Rate of Change (4.0 mm/s → 3.0 mm/s, %) | ||
|---|---|---|---|---|
| 4.0 | 3.5 | 3.0 | ||
| YA (mm) | 1.21 | 1.32 | 1.78 | 47.1 |
| XA (mm) | 1.42 | 1.62 | 2.20 | 54.9 |
| SA (mm2) | 1.33 | 1.64 | 3.19 | 139.8 |
| XA/YA | 1.16 | 1.17 | 1.23 | 6.0 |
| Welding Speed (mm/s) | Absorbed Energy, Akv (J) (20 °C) | ||||
|---|---|---|---|---|---|
| 1 | 2 | 3 | Mean Value | ||
| WM | 4.0 | 148 | 146 | 133 | 142 |
| 3.5 | 166 | 172 | 179 | 172 | |
| BM | / | 205 | 215 | 208 | 209 |
Publisher’s Note: MDPI stays neutral with regard to jurisdictional claims in published maps and institutional affiliations. |
© 2022 by the authors. Licensee MDPI, Basel, Switzerland. This article is an open access article distributed under the terms and conditions of the Creative Commons Attribution (CC BY) license (https://creativecommons.org/licenses/by/4.0/).
Share and Cite
Cui, S.; Yu, Y.; Tian, F.; Pang, S. Morphology, Microstructure, and Mechanical Properties of S32101 Duplex Stainless-Steel Joints in K-TIG Welding. Materials 2022, 15, 5432. https://doi.org/10.3390/ma15155432
Cui S, Yu Y, Tian F, Pang S. Morphology, Microstructure, and Mechanical Properties of S32101 Duplex Stainless-Steel Joints in K-TIG Welding. Materials. 2022; 15(15):5432. https://doi.org/10.3390/ma15155432
Chicago/Turabian StyleCui, Shuwan, Yunhe Yu, Fuyuan Tian, and Shuwen Pang. 2022. "Morphology, Microstructure, and Mechanical Properties of S32101 Duplex Stainless-Steel Joints in K-TIG Welding" Materials 15, no. 15: 5432. https://doi.org/10.3390/ma15155432
APA StyleCui, S., Yu, Y., Tian, F., & Pang, S. (2022). Morphology, Microstructure, and Mechanical Properties of S32101 Duplex Stainless-Steel Joints in K-TIG Welding. Materials, 15(15), 5432. https://doi.org/10.3390/ma15155432