Article

Horizontal Oxidation Diffusion Behavior of MEMS-Based Tungsten-Rhenium Thin Film Thermocouples

1
Department of Precision Instruments, Tsinghua University, Beijing 100084, China
2
Department of Materials Physics and Chemistry, University of Science and Technology Beijing, Beijing 100083, China
*
Author to whom correspondence should be addressed.
These authors contributed equally to this work.
Materials 2022, 15(14), 5071; https://doi.org/10.3390/ma15145071
Submission received: 6 June 2022 / Revised: 8 July 2022 / Accepted: 18 July 2022 / Published: 21 July 2022
(This article belongs to the Section Thin Films and Interfaces)

Abstract

:
Tungsten-rhenium thin film thermocouples (TFTCs) are well suited for the surface temperature monitoring of hot components due to their small size, rapid response and low cost. In this study, a tungsten-rhenium TFTC with SiC protective film on all parts except the pads was fabricated by a microelectromechanical system (MEMS) process. During the low to medium temperature (−40 °C to 500 °C) repeatability test phase, the thermal voltage from the TFTC agreed well with that of the standard tungsten-rhenium thermocouple. However, during the high temperature test phase, the TFTC lost electronic response at around 620 °C. Failure analysis of the TFTC tested at 620 °C was performed by microscopy, scanning electron microscope (SEM), energy dispersive spectroscopy (EDS), laser scanning confocal microscope (LSCM) and statistics. The results showed that the pads were oxidized without the protective layer, the number of oxidized protrusions distributed in this TFTC from the pad to the node decreases more and more slowly and the size of the oxidized protrusions also becomes smaller and smaller. This demonstrates the presence of horizontal oxidation diffusion in TFTCs, further illustrating the importance of pad protection and provides a direction for the subsequent structural optimization and the extension of the service life of TFTCs and other sensors.

1. Introduction

High-temperature monitoring in confined spaces, such as a combustion chamber of an engine, applies harsh requirements on thermosensitive parts [1,2,3,4,5]. Compared to conventional wire and foil thermocouples, thin film thermocouple (TFTC) by microelectromechanical system (MEMS) process has the advantages of fast response speed and small size due to its low thermal mass and process [6,7,8,9]. Moreover, the thin films deposited by the MEMS process are exactly uniform without the problem of surface particles, which is more conducive to the production of large areas of films [10]. TFTCs were first proposed by Hackenann, a German researcher, during World War II to measure the temperature changes in the chamber wall of a gun [11]. A platinum–rhodium TFTC was fabricated on the alumina substrate by micromachining technology [12], which could operate at the temperature up to 1300 °C, but the high material cost limited its application to a certain extent. Tian Bian et al. fabricated a tungsten-rhenium TFTC-based SiC by magnetron sputtering, which had a potential output of 9 mV at 900 K with a protective tube [13]. The protective film on the surface of tungsten-rhenium TFTCs was proposed to effectively prevent the oxidation and evaporation of tungsten-rhenium TFTCs at high temperatures [14]. An In2O3-In2O5Sn (ITO) TFTC was fabricated with a high Seebeck coefficient of 44.5 μV/°C [15], but with a low repeatability.
Consequently, compared to In2O3-ITO thermocouples, tungsten-rhenium materials have been maturely used in linear thermocouples and have high repeatability. Compared to platinum-rhodium thermocouples, tungsten-rhenium thermocouples have higher sensitivity and greatly reduce costs. However, more research is needed to determine its high temperature oxidation characteristics. In this study, we fabricated the TFTCs with SiC as the substrate, W-5Re (95 wt% tungsten-5 wt% rhenium) and W-26Re (74 wt% tungsten-26 wt% rhenium) as the sensitive layer and SiC as the protective layer by a microelectromechanical system (MEMS) process. We evaluated the process, tested the thermoelectric effect of TFTCs and performed a failure analysis. The horizontal oxidation phenomenon was also analyzed by optical microscope, scanning electron microscope (SEM), energy dispersive spectrometer (EDS) and laser scanning confocal microscope (LSCM). It is concluded that it is important to add a thick protective layer on the pads and thermocouple lines.

2. Materials and Methods

The W-5Re and W-26Re sensitive film had a thickness of 0.3 μm and a wire width of 400 µm. The sizes of the junction and pads were 100 μm × 400 μm and 1200 μm × 1200 μm, respectively. The SiC protective film had a thickness of 0.1 μm. The size of the TFTC lines was 5.5 mm × 15.5 mm.

2.1. Fabrication of TFTCs

The tungsten-rhenium TFTCs were prepared based on the MEMS process. The flowchart of the fabrication process was shown in Figure 1 and described as follows. The SiC substrate had a diameter of 6 in and a thickness of 0.4 mm, which was cleaned ultrasonically in the bath of pure alcohol and then acetone, respectively. The relevant parameters [16,17] are shown in Table 1.
(a) First lithography process: The positive photoresist (PR) of AZ 5214 with a thickness of 2.8 μm was spin-coated and soft baked on the SiC substrate. Then, it was patterned using ultraviolet (UV) lithography and developing processes. The positive patterns of TFTCs were obtained.
(b) A magnetron deposition system (DENTON Explorer-14, America) was used to deposit films in this paper. The W-5Re film with a thickness of 0.3 μm was deposited on the above substrate by DC magnetron sputtering.
(c) The remaining PR was removed using acetone solution.
(d) Second lithography process: The AZ 5214 with a thickness of 2.8 μm was spin-coated and soft baked again. It was patterned using UV lithography and developing processes. Then, the negative patterns of TFTCs were obtained.
(e) The W-26 Re film with a thickness of 0.3 μm was deposited on the substrate by DC magnetron sputtering.
(f) The remaining PR was removed using acetone solution again. Additionally, the substrate was annealed at 300 °C for two hours under N2.
(g) The SiC film with a thickness of 0.1 μm was deposited on the substrate by RF magnetron sputtering.
(h) Third lithography process: The AZ 5214 with a thickness of 2.8 μm was spin-coated and soft baked once again. It was patterned by UV lithography and developing processes. Then, the pad patterns of TFTCs were obtained.
(i) The cold terminal pads of TFTCs were exposed by etching 0.1 μm with reactive ion etching machine.
(j) The remaining PR was once again removed with acetone solution.
(k) The wafers were cut on the extended scribe path to obtain many individual TFTCs.

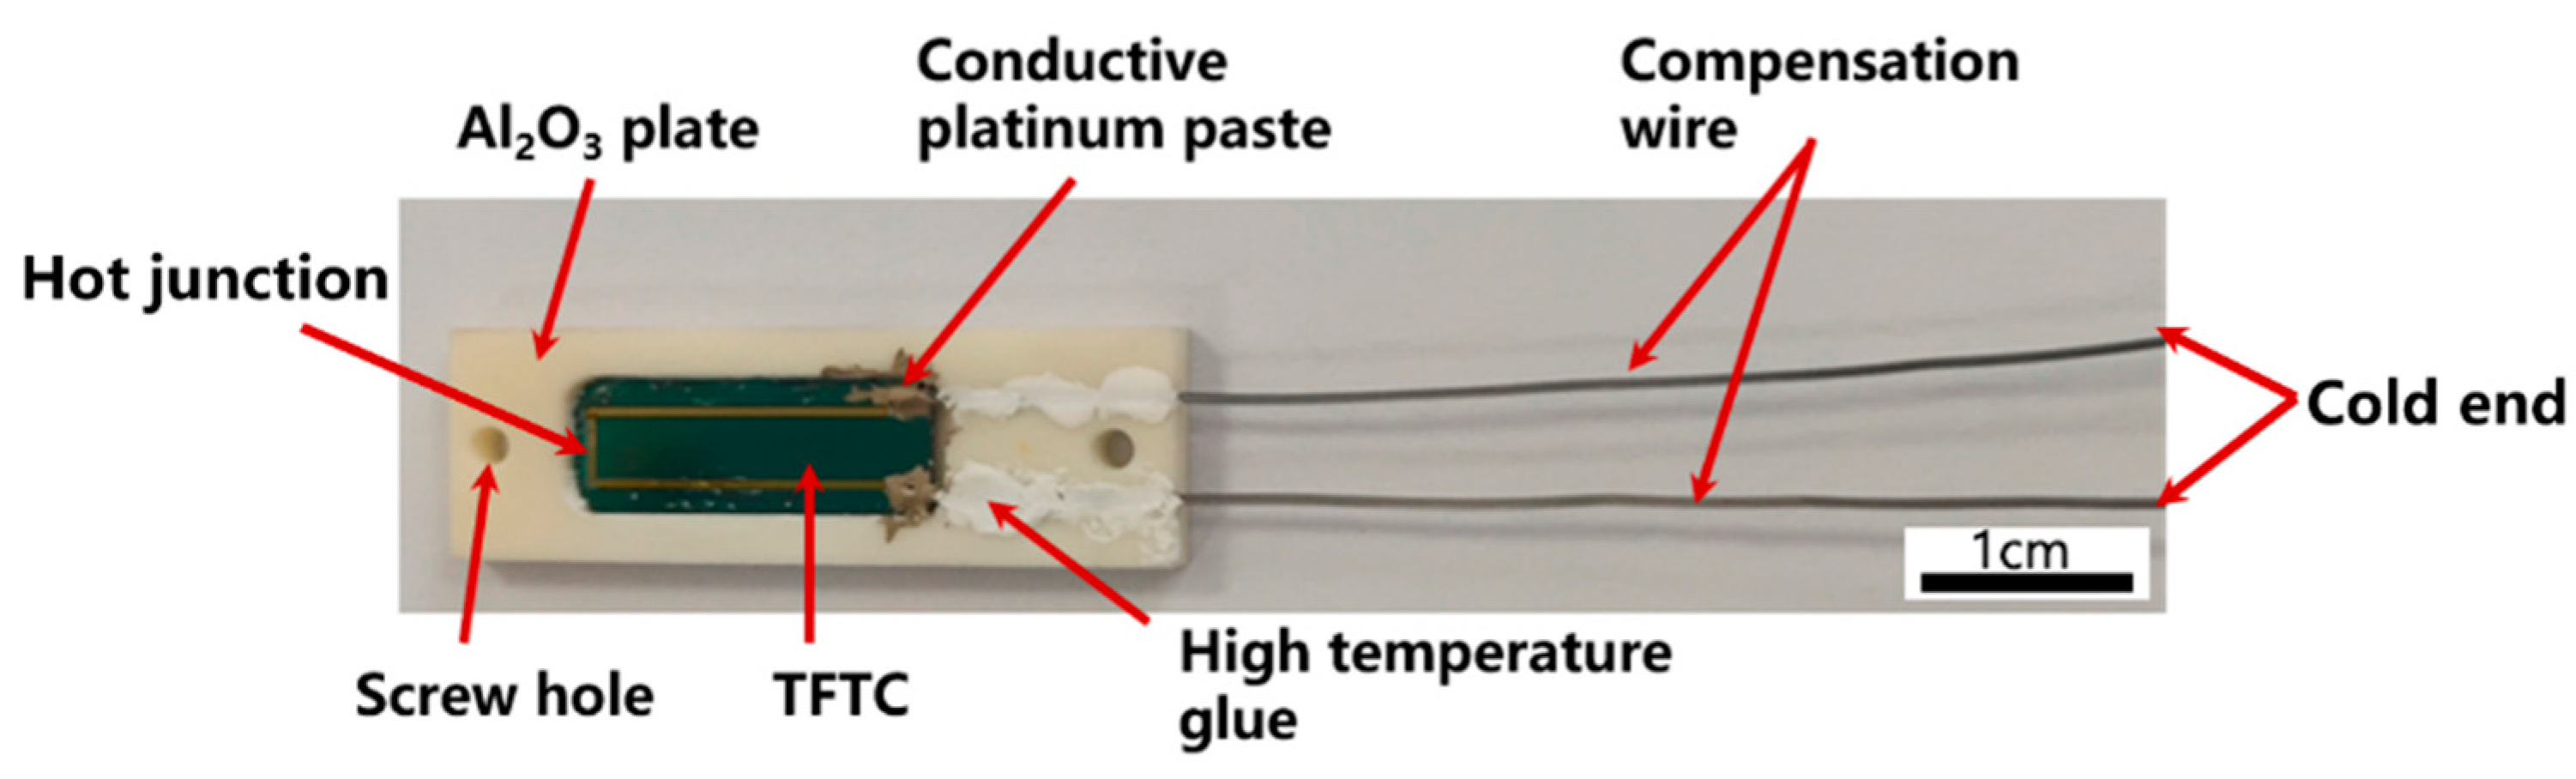
2.2. Compensation Wire Connection and Initial Package

The fabricated TFTC by MEMS process is showed in Figure 2, which was put into a customized Al2O3 plate for lead connection as shown in Figure 3. The Al2O3 plate was designed with recesses to allow the TFTC and homogeneous wires as compensation wires to fit exactly into them, and screw holes were reserved for subsequent packaging. The TFTC and leads were bonded to the ceramic plate using high-temperature glue to improve the mechanical strength of the overall sensor connection. The platinum paste was applied to provide electrical connections between the pads and compensation wires, and processed excellent electrical conductivity even at 1000 °C. After completing the above process, we covered it with matching Al2O3 covers with the same pre-drilled screw holes and screwed them together with ceramic screws, which completed the initial sandwich structure of the TFTC package.
The packaged TFTC was placed in a quartz tube and tested at thermostats, while there were standard thermocouples to control the temperature of these thermostats in real time.

3. Results and Discussion

3.1. Characterization of TFTC Films by MEMS

As shown in Figure 4a, the surface of the TFTC film is flat and smooth without obvious cracks and stray particles, which is uniformly covered on the SiC substrate [18]. From Figure 4b, the thickness of the tungsten-rhenium film is about 0.3 μm, and the protective layer SiC is about 0.1 μm. The film is dense without loose voids, while the layers are clearly distinguished without diffusing from each other, indicating that the above process design is very suitable for TFTC.

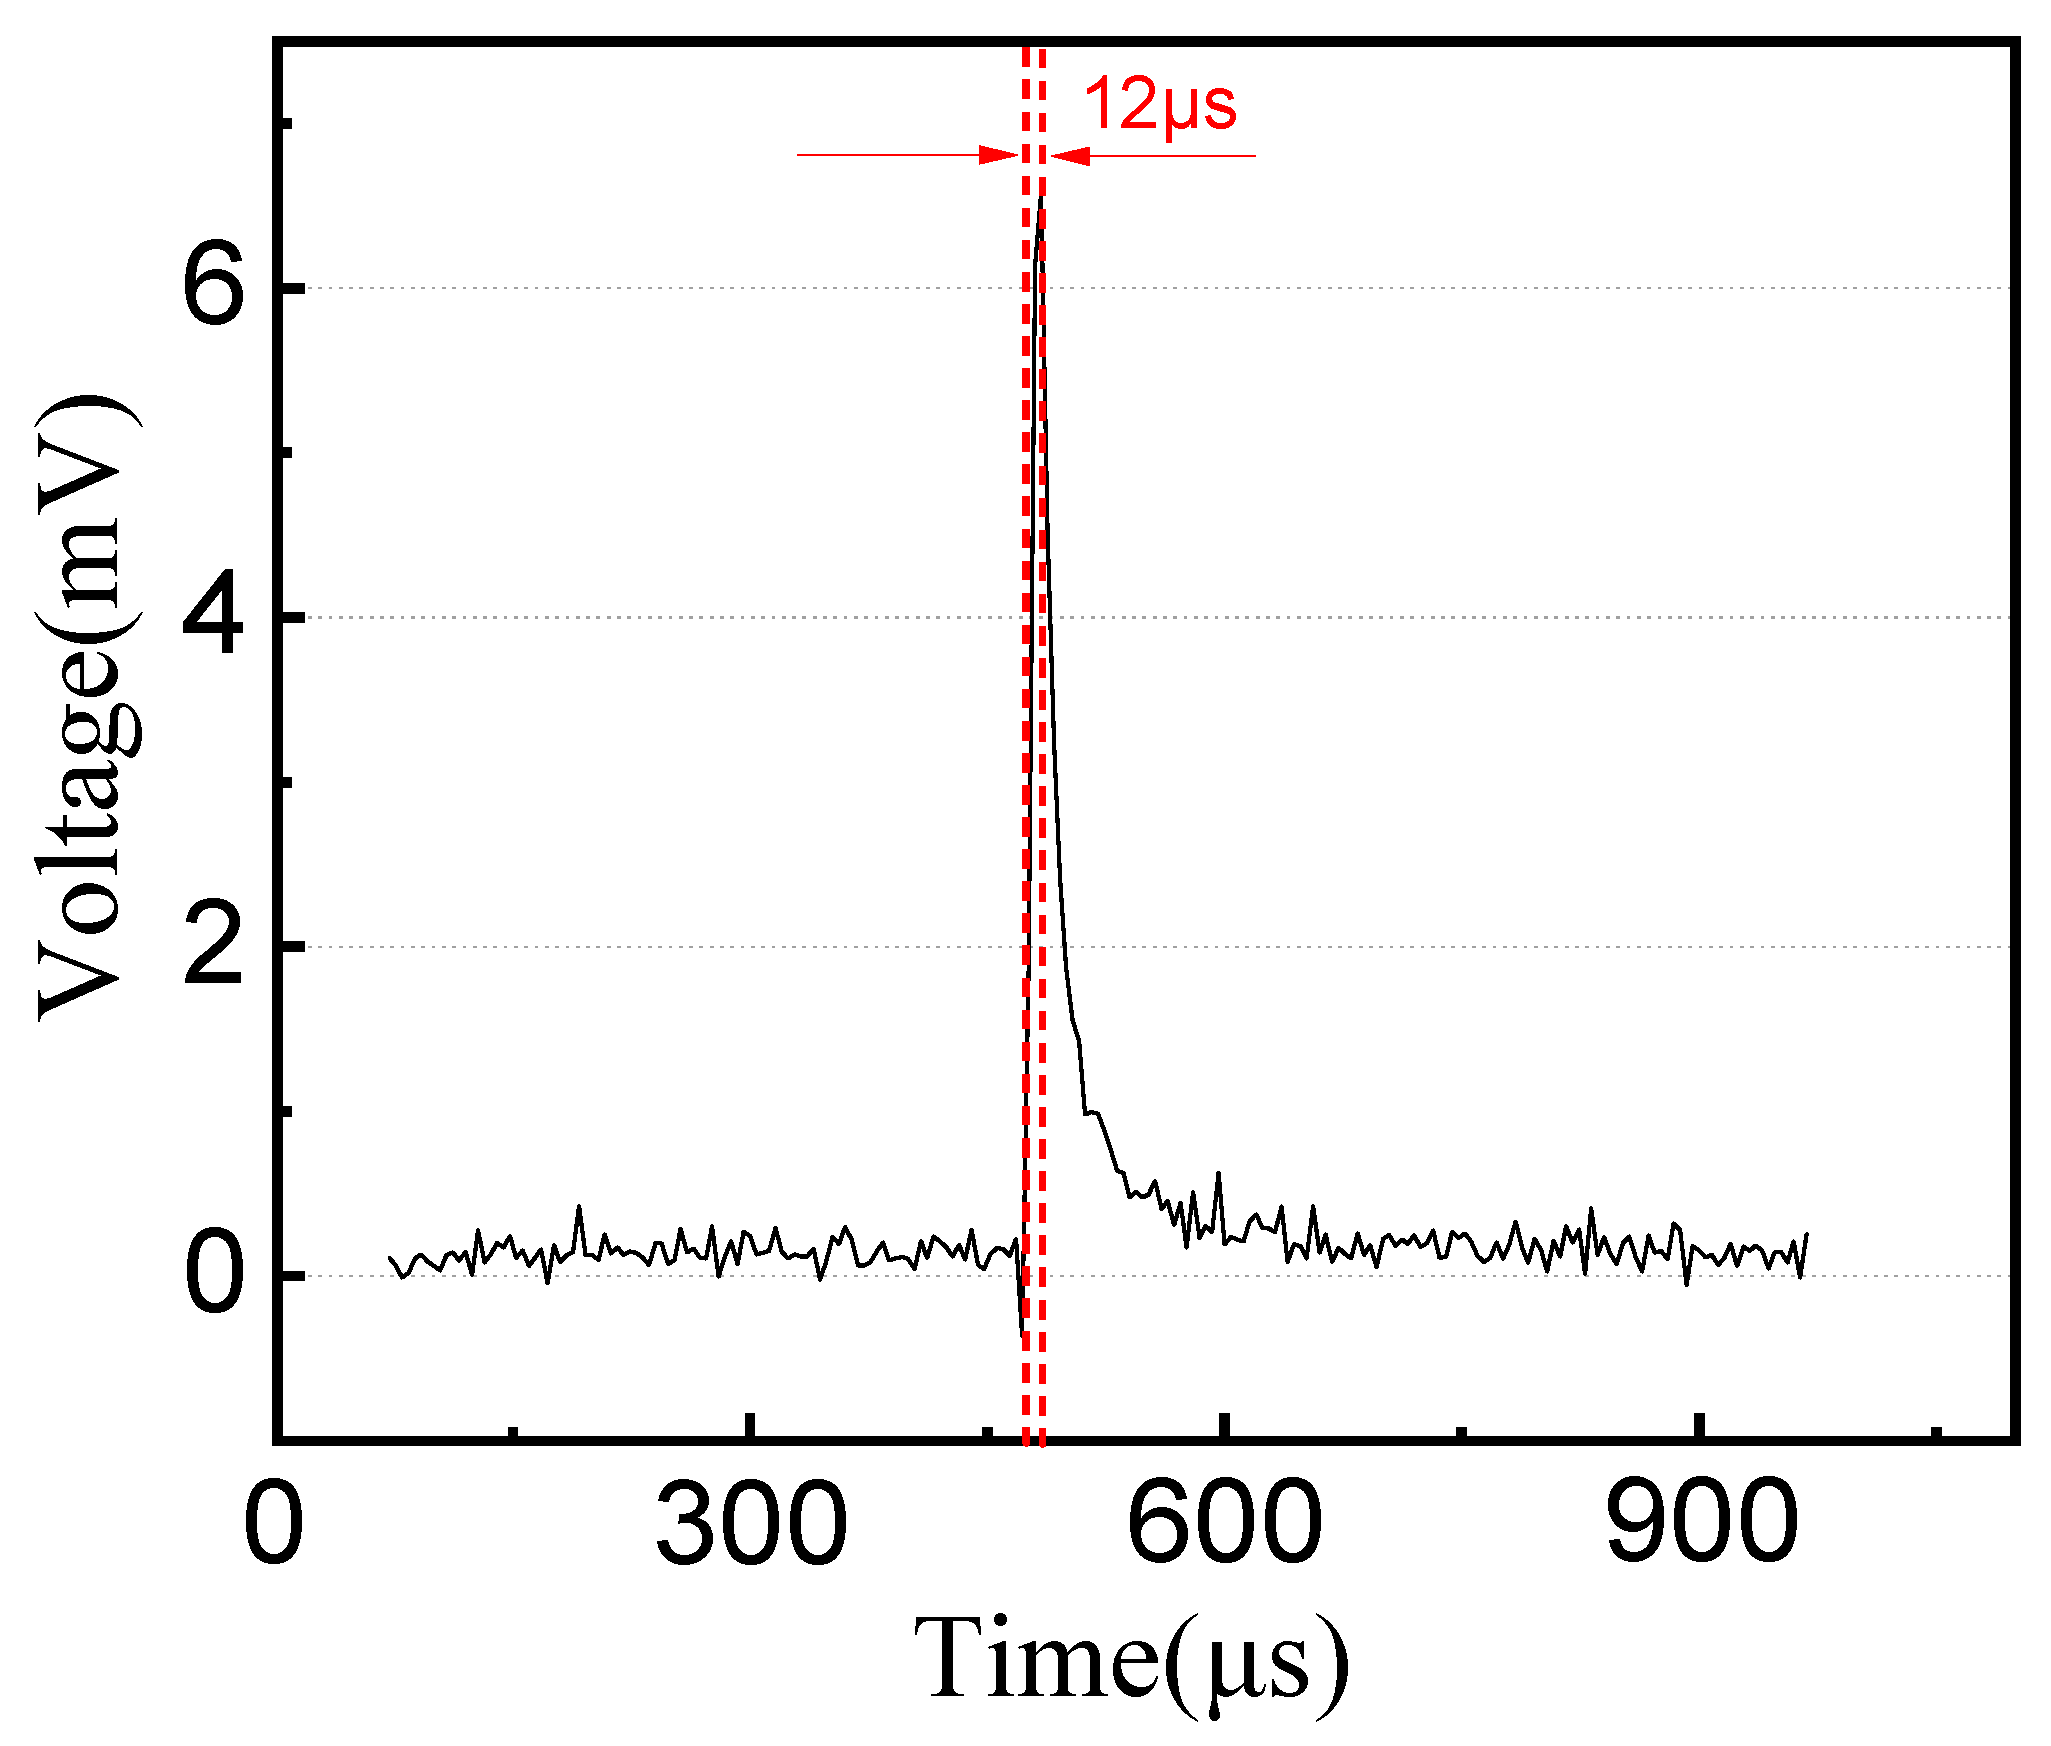
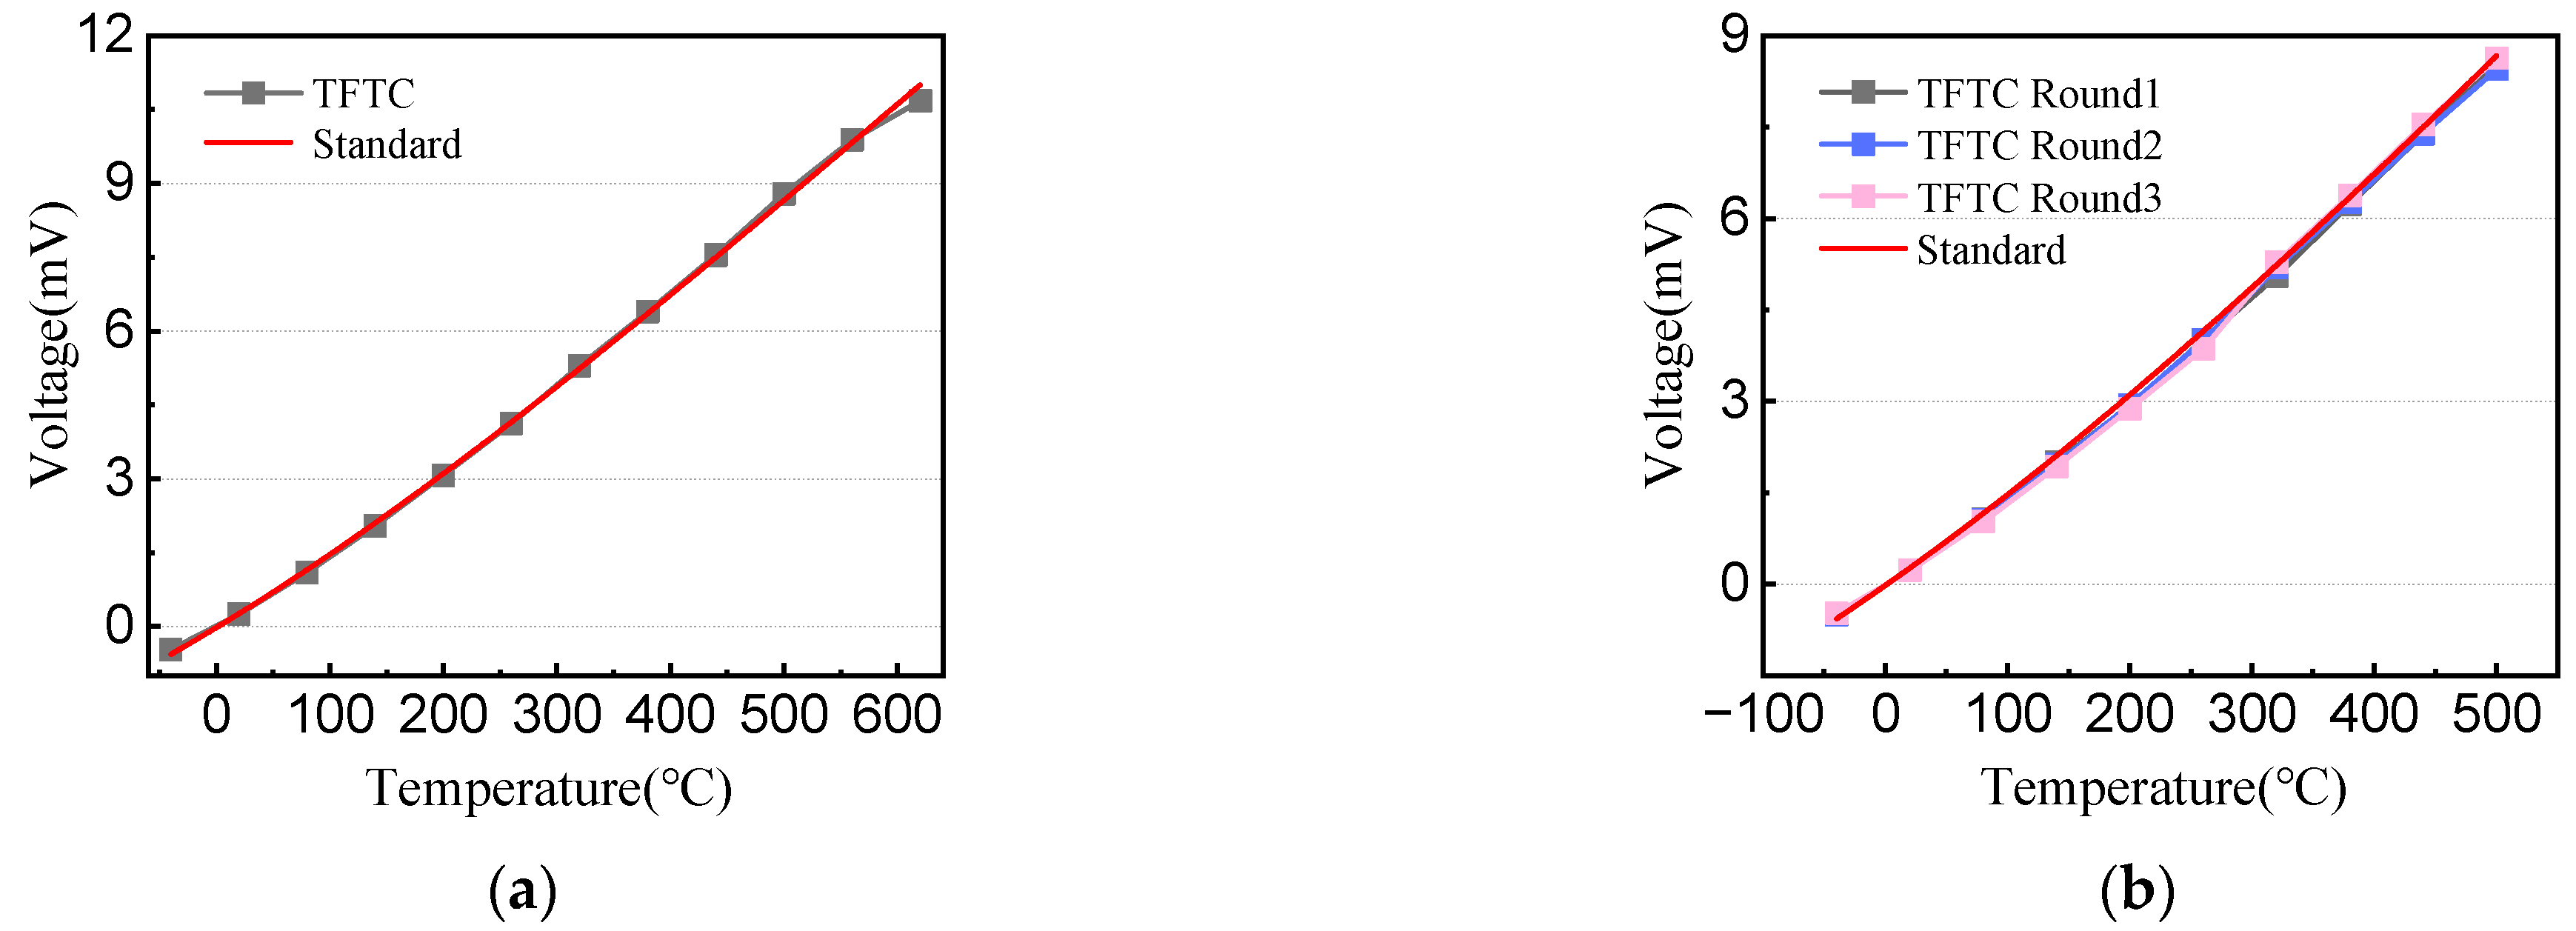
3.2. Thermoelectric Testing

The working principle of the TFTC is the Seebeck effect (thermoelectric effect) theory [19]. Two conductors (or semiconductors) of different materials form a closed loop. When the temperature of the cold end and the hot junction are different, a thermoelectric potential will be generated in the loop, and then the temperature information is indirectly reflected by measuring the voltage difference in the loop. As shown in Figure 5, the response time of the TFTC is 12 μs, which is 12 times faster than the response time of the same type of thermocouple made by Zhang Zhongkai et al. [20]. The voltage–temperature curves of the TFTC and the standard wire thermocouples are shown in Figure 6 and the sensitivity is 17.19 μV/°C. As shown in Figure 6a, the voltage–temperature curves of the TFTC and standard wire thermocouple have the same trend, they overlap each other and almost appear to be a single line, which indicates that the fabricated TFTC has a high accuracy [21].
The thermoelectric testing starts at −40 °C and takes about 3 h. When the temperature reaches 620 °C, the TFTC shows voltage instability and finally loses the electrical signal. Although there is no electrical signal between the two pads, testing this TFTC with a multimeter reveals that the platinum paste to the end of the compensation wires is still conductive. Therefore, this is a failure of the sensor itself.
In order to verify whether the failure of TFTC is related to high temperature or long use time, we repeatedly test it at 500 °C to ensure it works properly. As shown in Figure 6b, TFTC continues to work after three cycles, about 9 h, and the accuracy remains high, indicating that its failure is mainly related to high temperature.

3.3. Failure Analysis

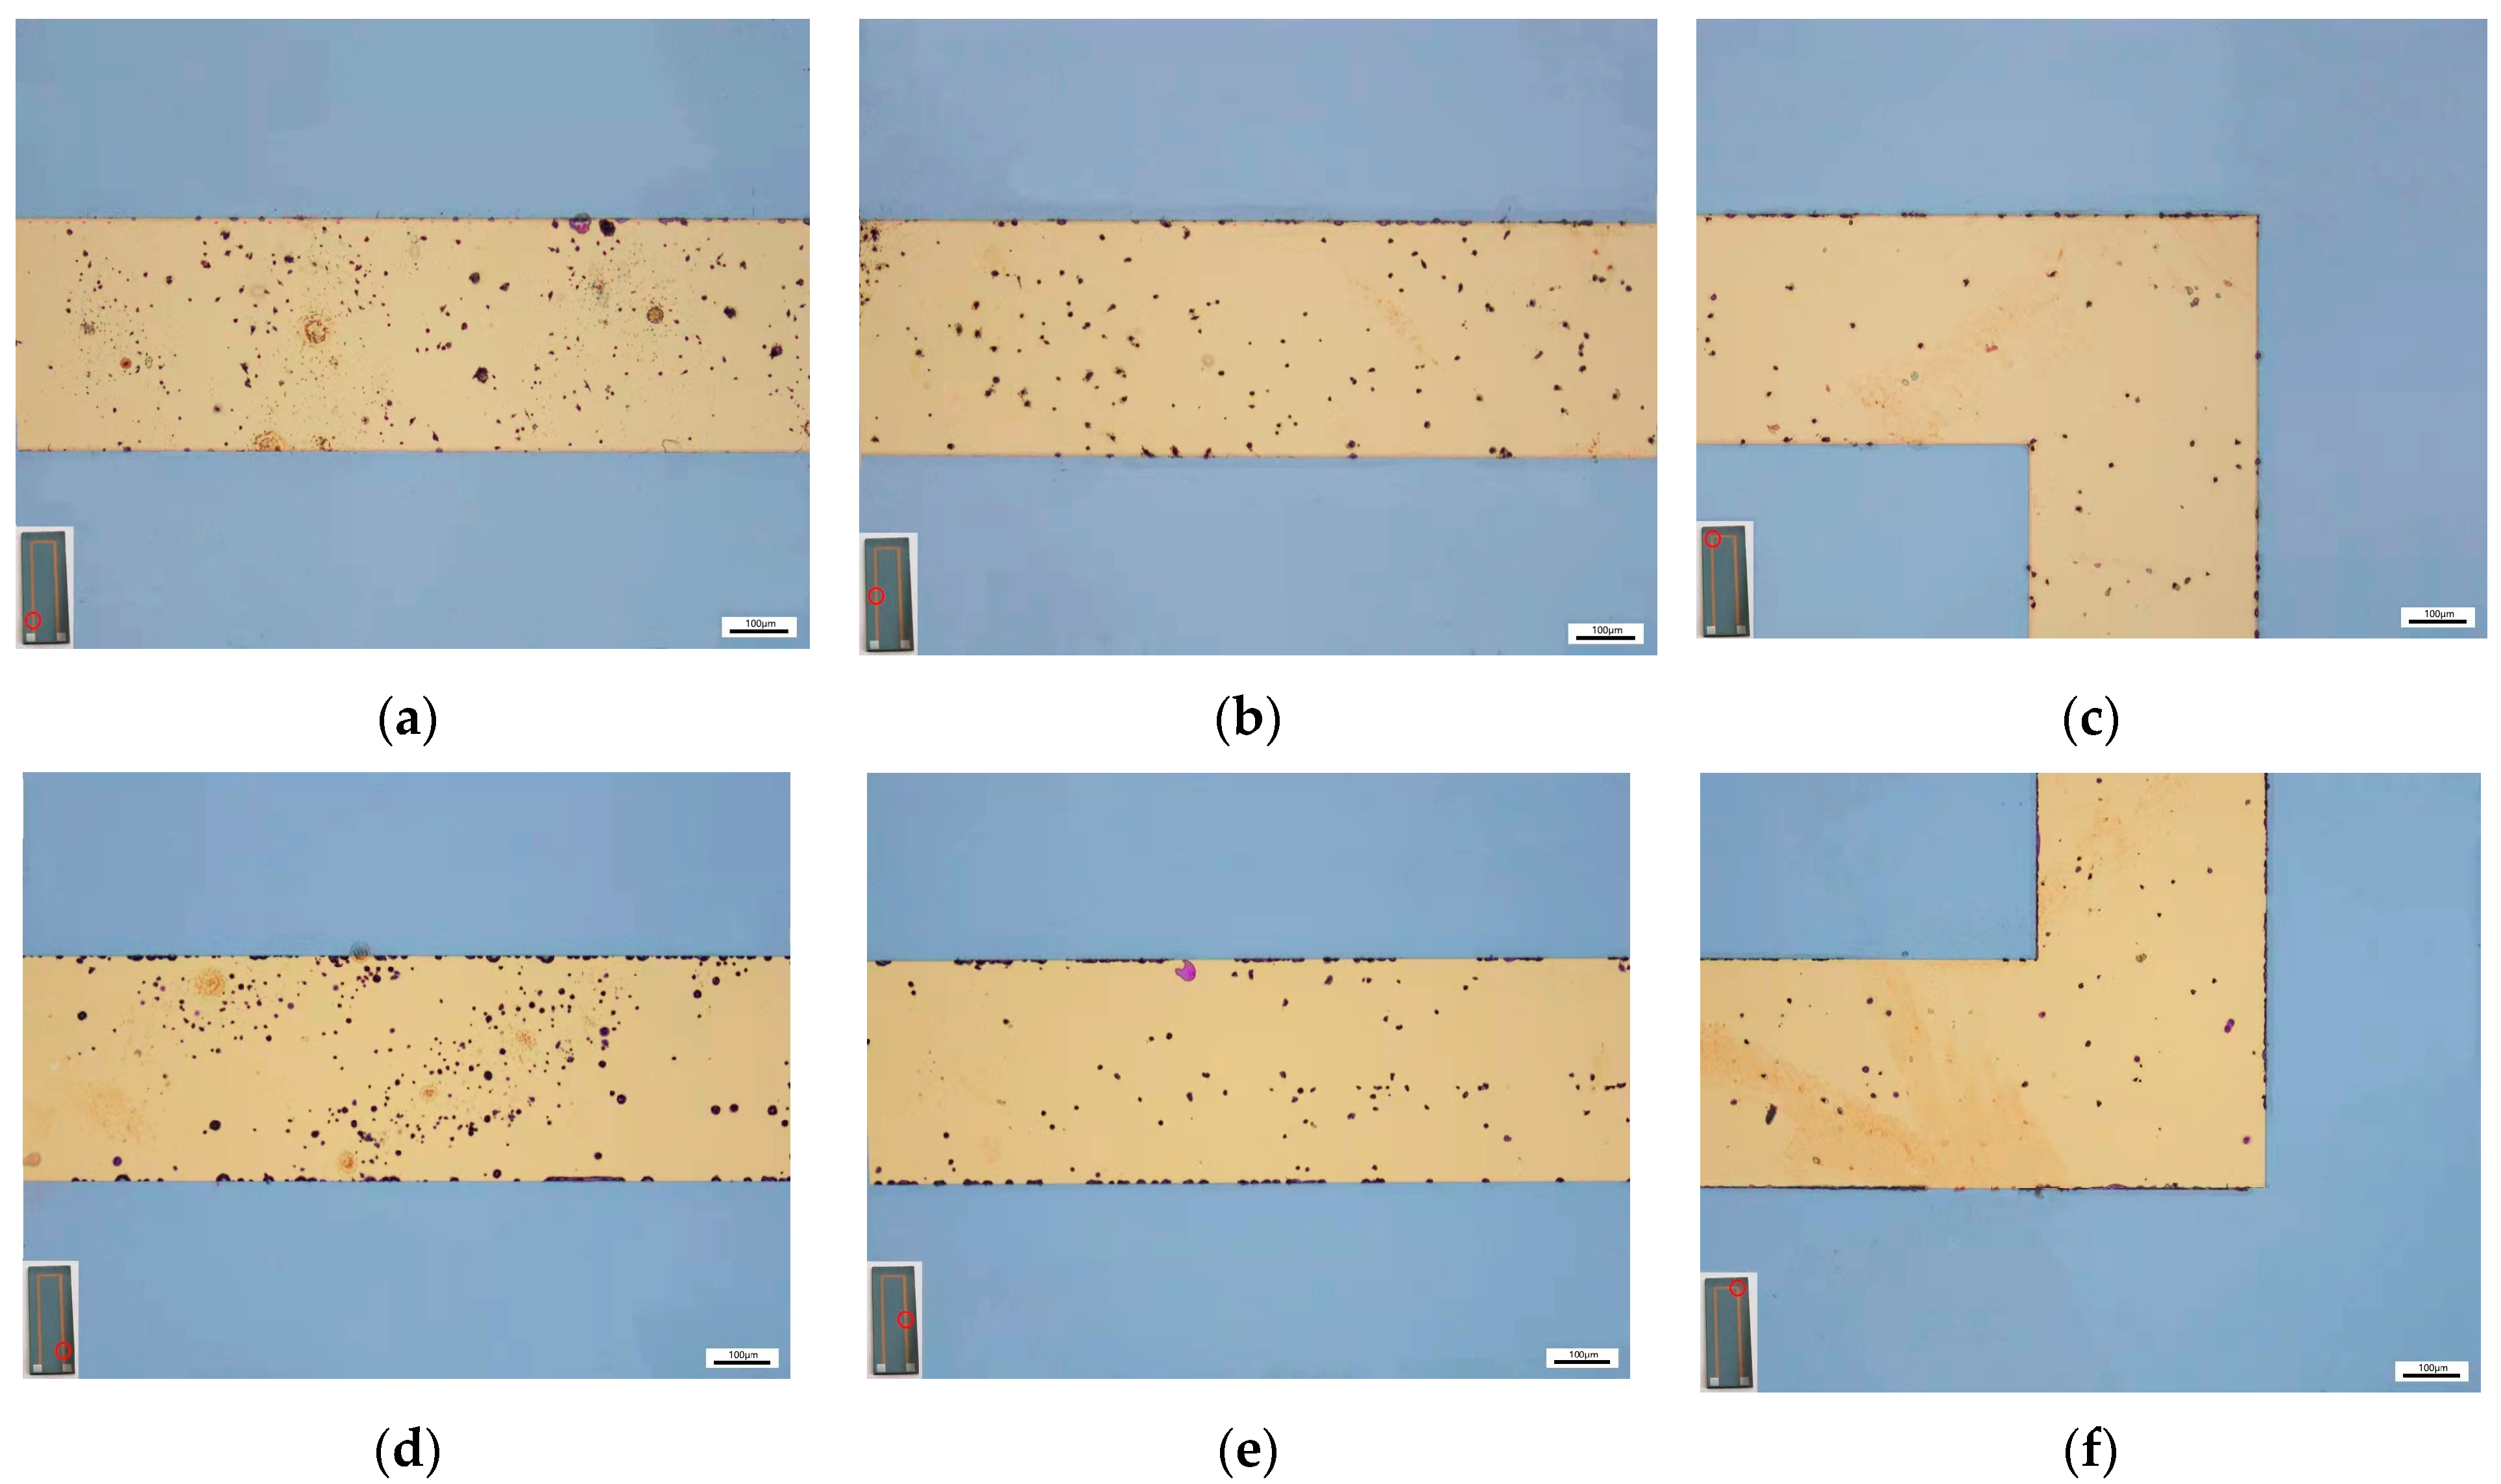
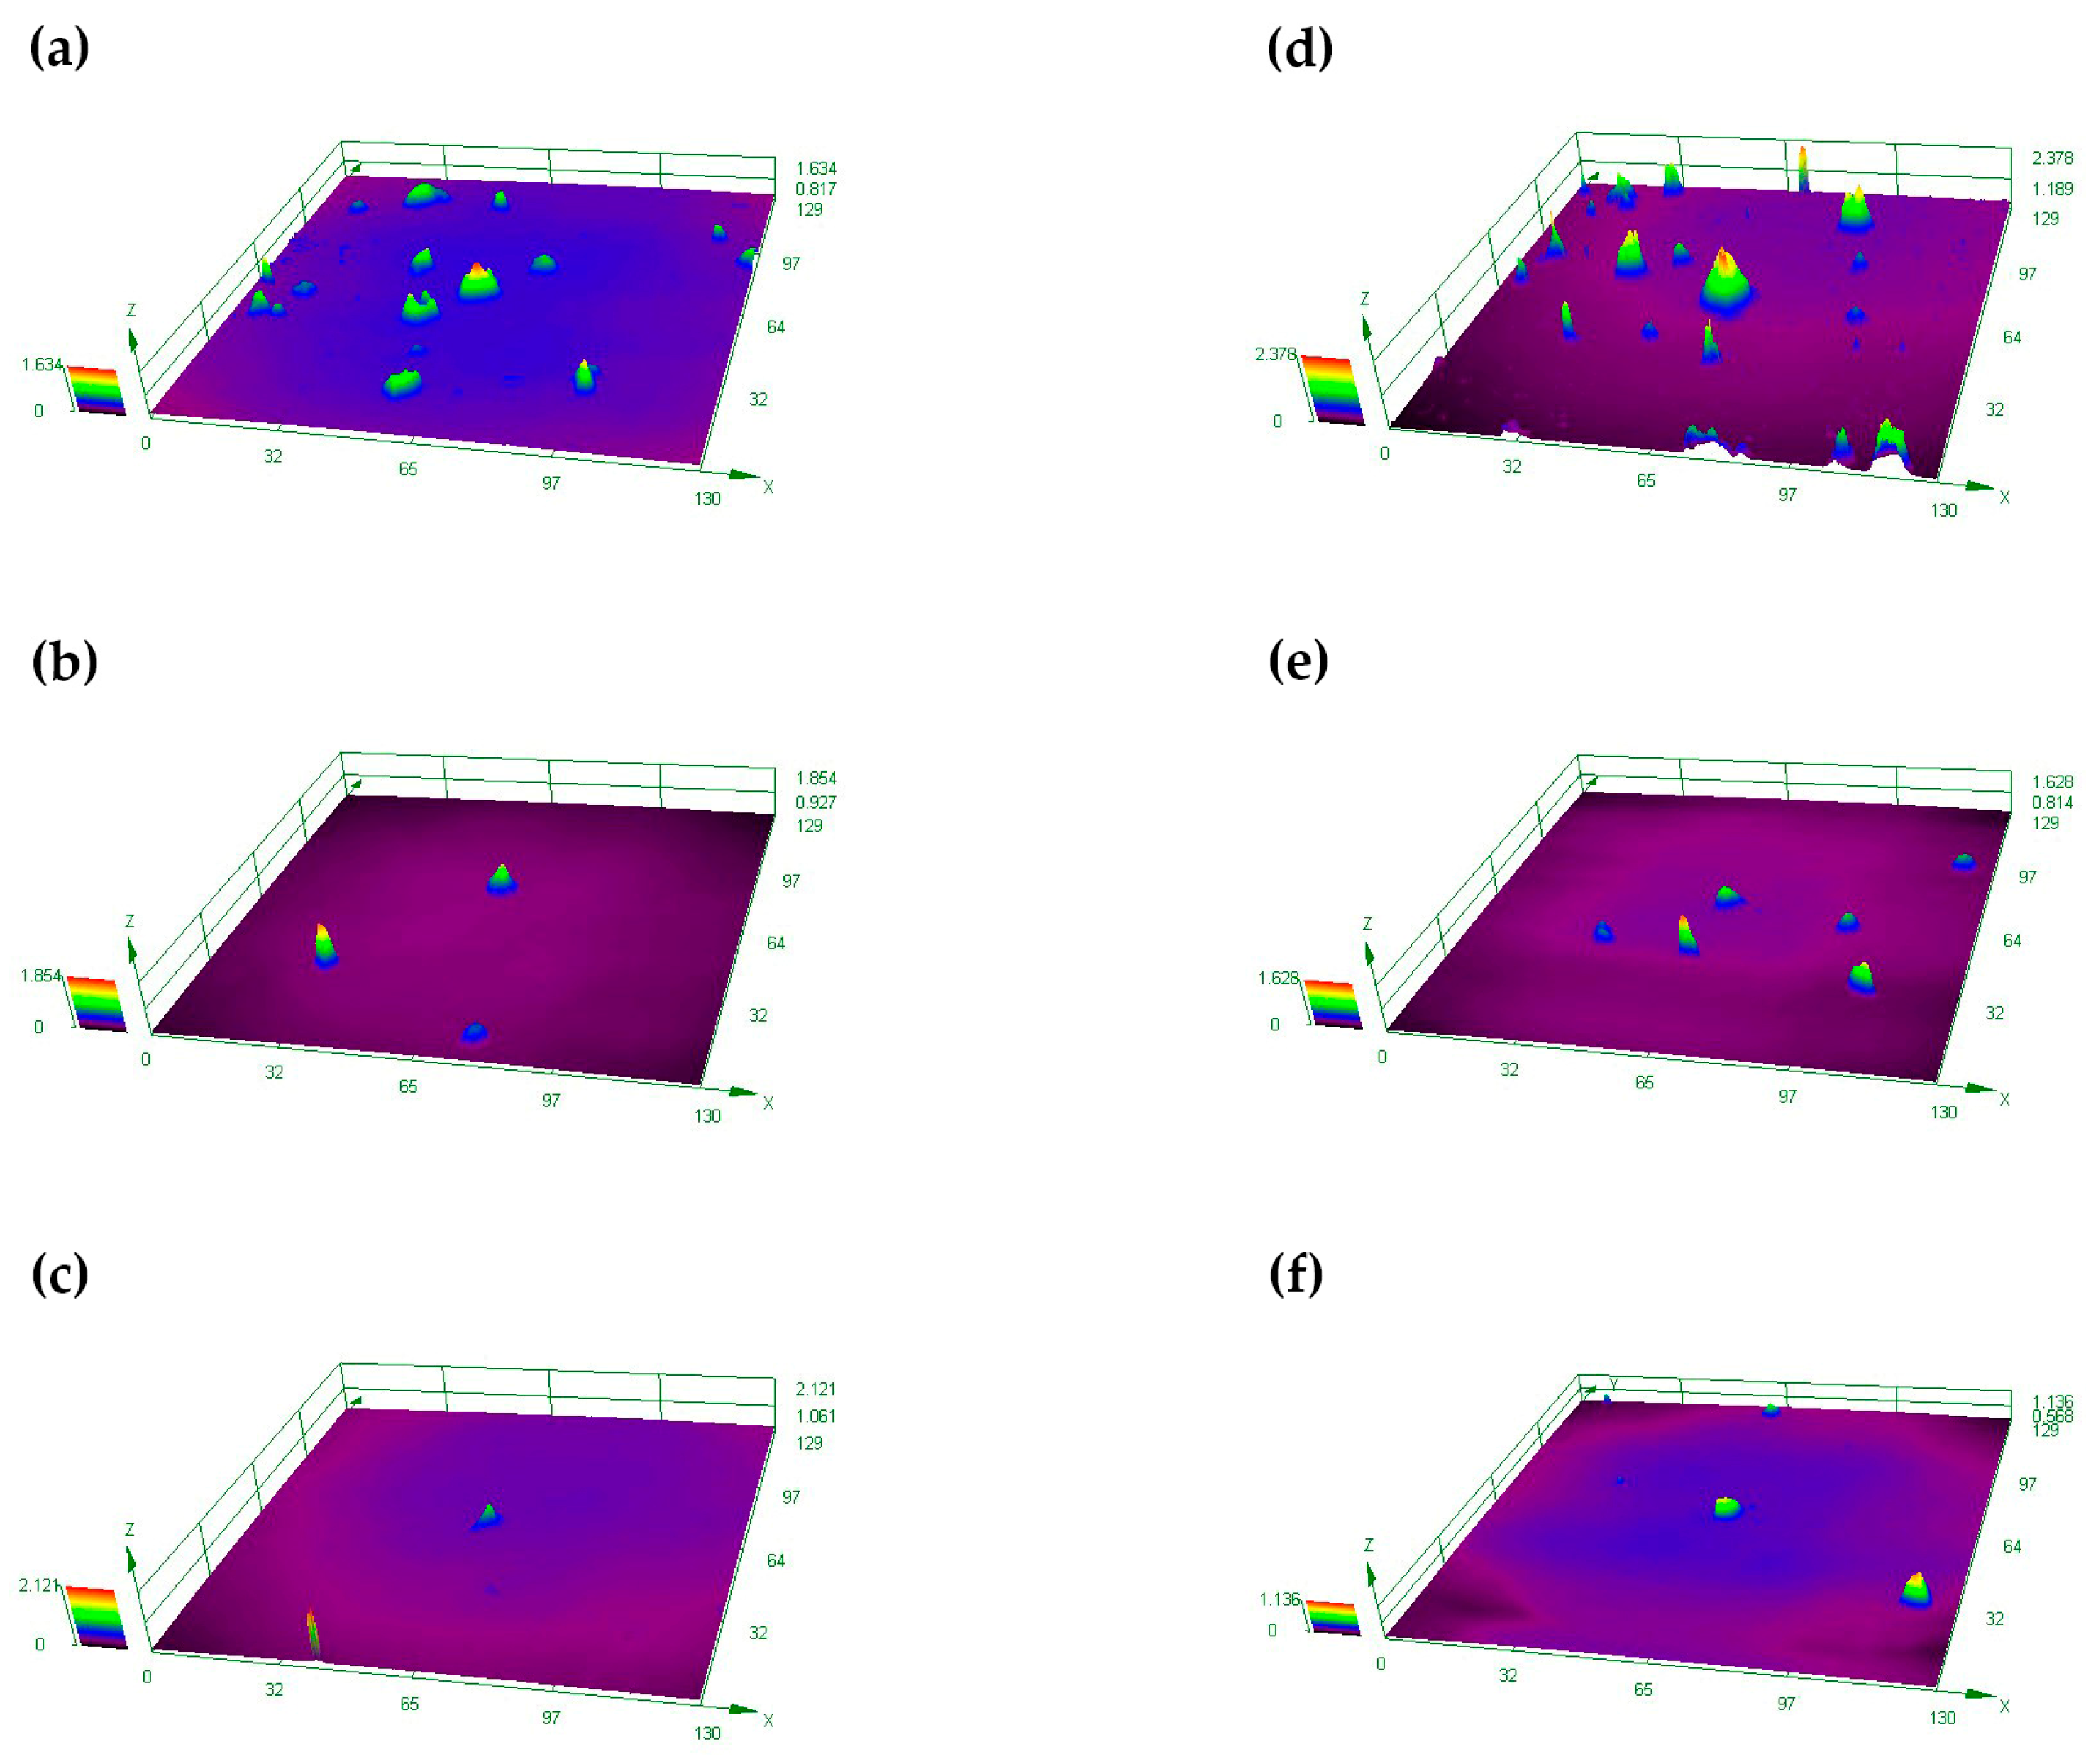
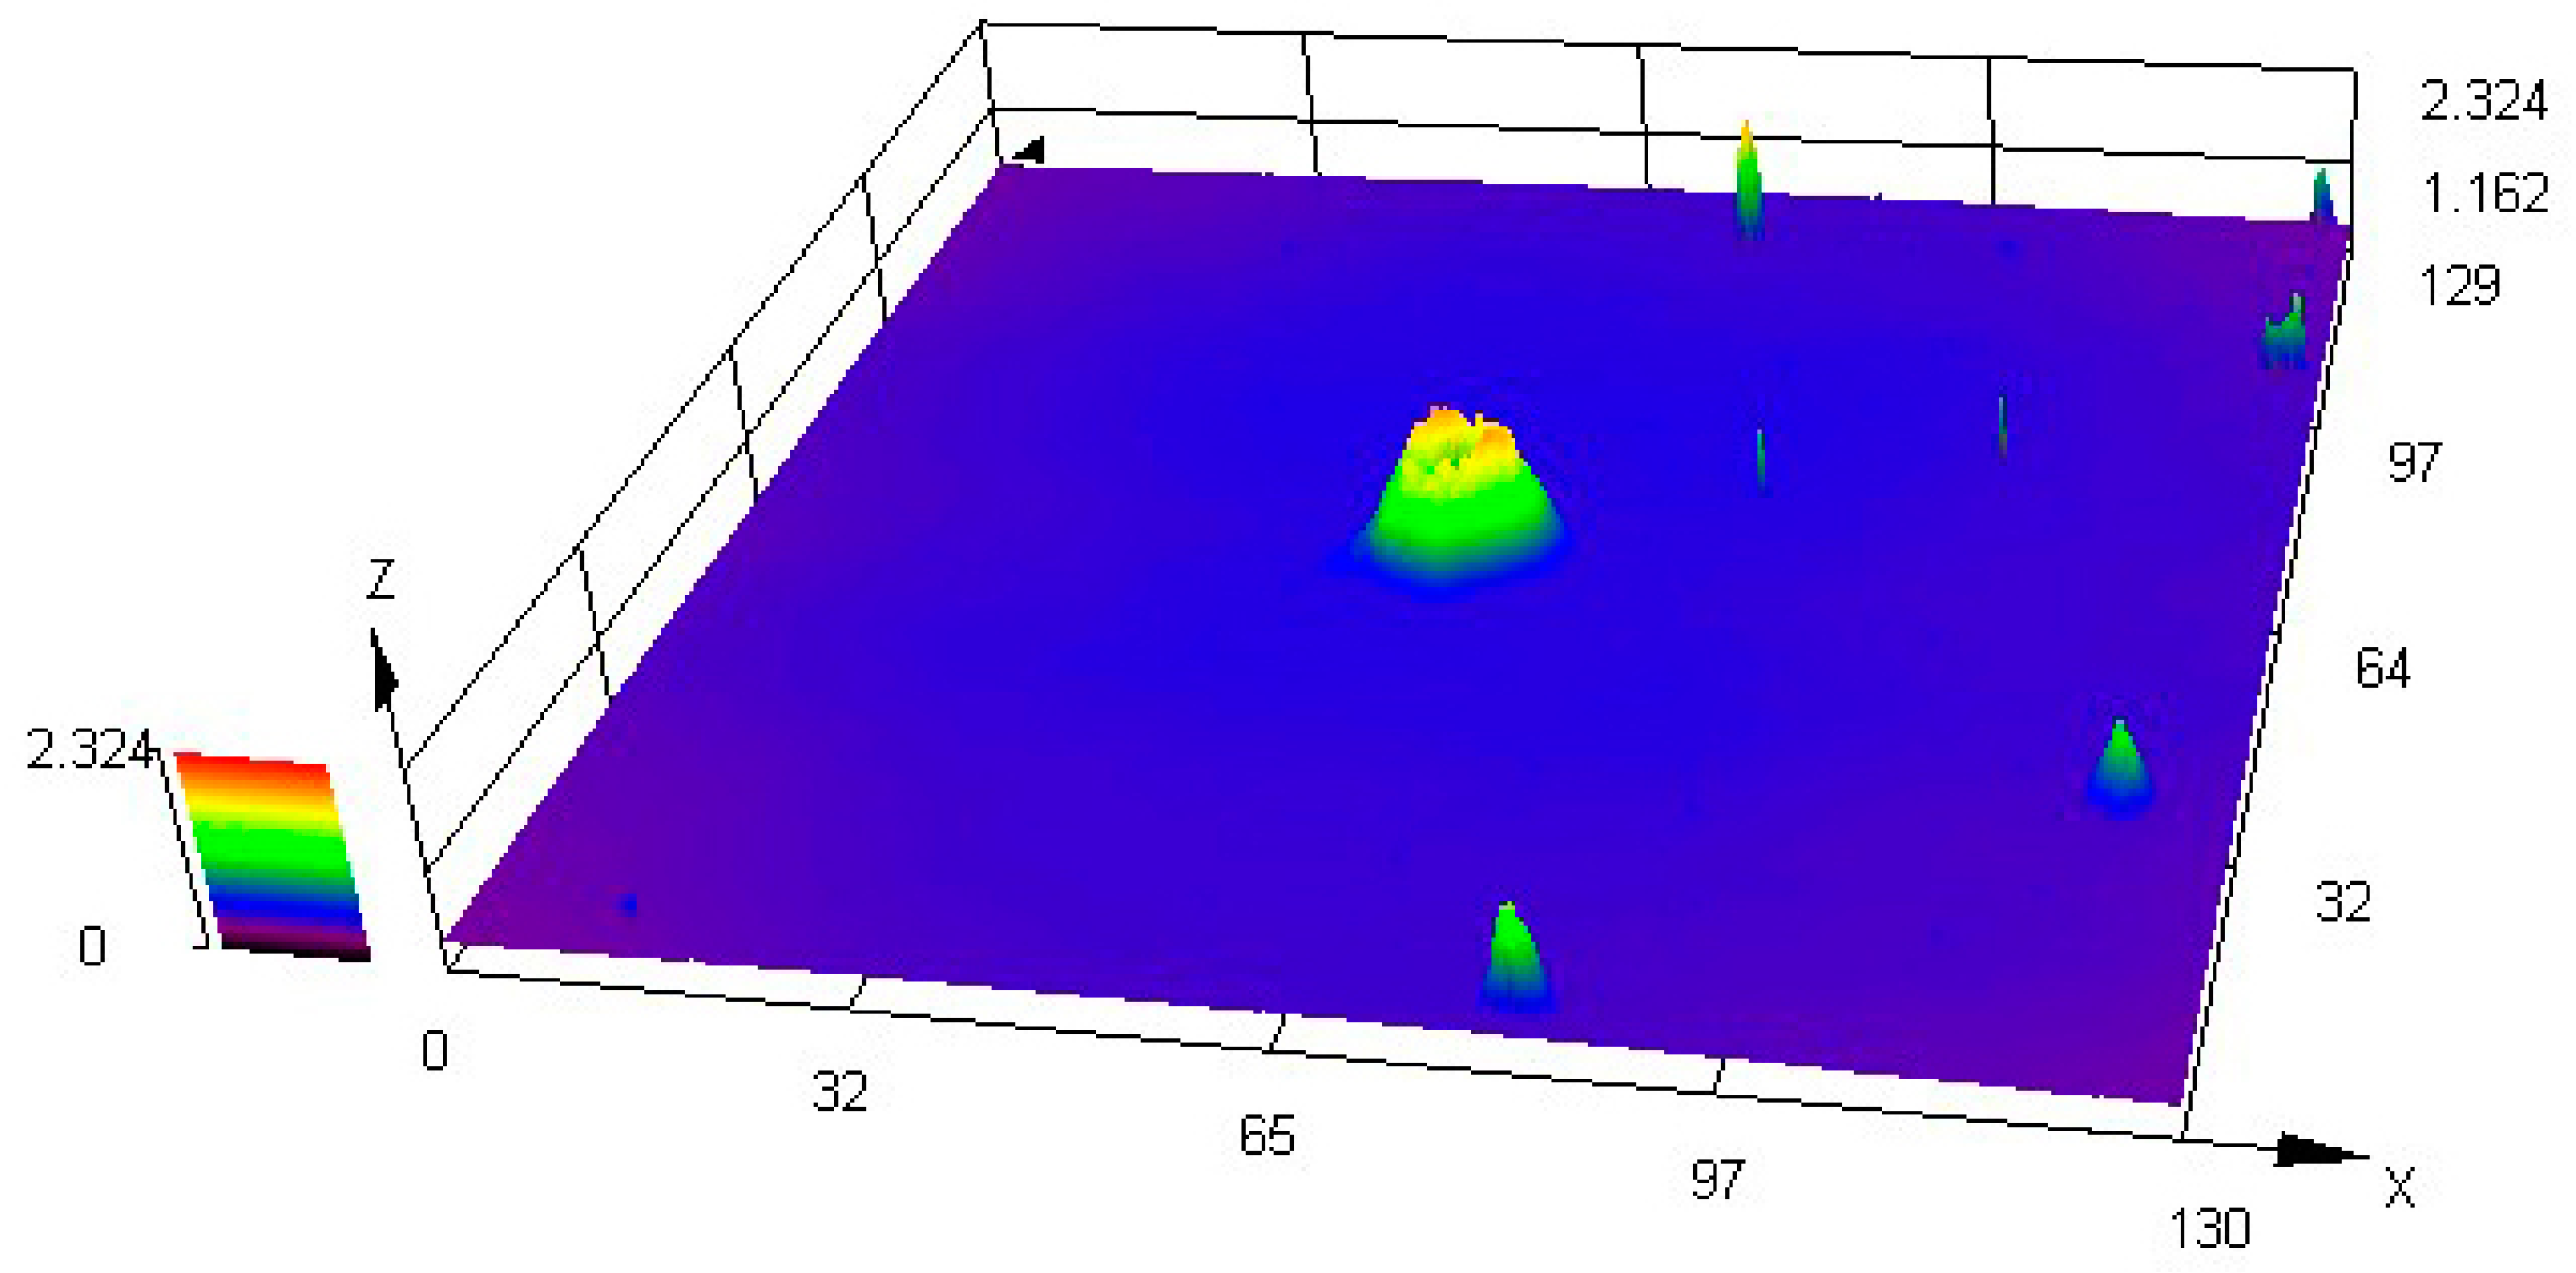
3.3.1. Optical Observation

Changes in the fine structure of the TFTC are no longer easily observable after the compensation wire is connected. To facilitate the observation, TFTC molds subjected to the same test environment are used in the subsequent analysis and inspection. The optical images of TFTC pads before and after 620 °C are shown in Figure 7.
After testing, the surface of the pads becomes burnt black from the yellow before testing, and the dense film on the surface of the pads becomes a layer of powder-like particles. The resistance of TFTC before the test is 178 Ω, but exceeds the range of the test instrument (20 MΩ) after the test. Analysis suggests the lack of a protective layer on the pad due to the oxidation of the tungsten-rhenium metal film to a black powder in the air at about 620 °C, resulting in no electrical response.
Figure 8 shows the optical images of TFTC left and right lines at different positions. The bottom, middle and top images of each side line are equally spaced samples, spaced 500 μm apart. There are plenty of black spots appearing on the lines of TFTC. Since the distribution of black spots is not particularly uniform, the paper adopts the sampling model shown in Figure 9 to calculate the quantity in order to make the results more accurate. For each image, 11 rectangular bits of 70 μm × 70 μm are selected as sampling points (images in Figure 8c,f are straightened during sampling).
The quantity results of black spots at different sampling points are shown in Table 2. As shown in Figure 10, the quantity of black spots in each graph of Figure 8 is obtained after the average calculation, which gradually decreases from the bottom (near the pad) to the top (near the node), and decreases faster from the bottom to the middle than from the middle to the top. Therefore, it is speculated that the TFTC not only undergoes vertical oxidation through the protective layer, but also horizontal oxidation from the pad to the node direction. Additionally, the closer this oxidation is to the pad, the faster it oxidizes.

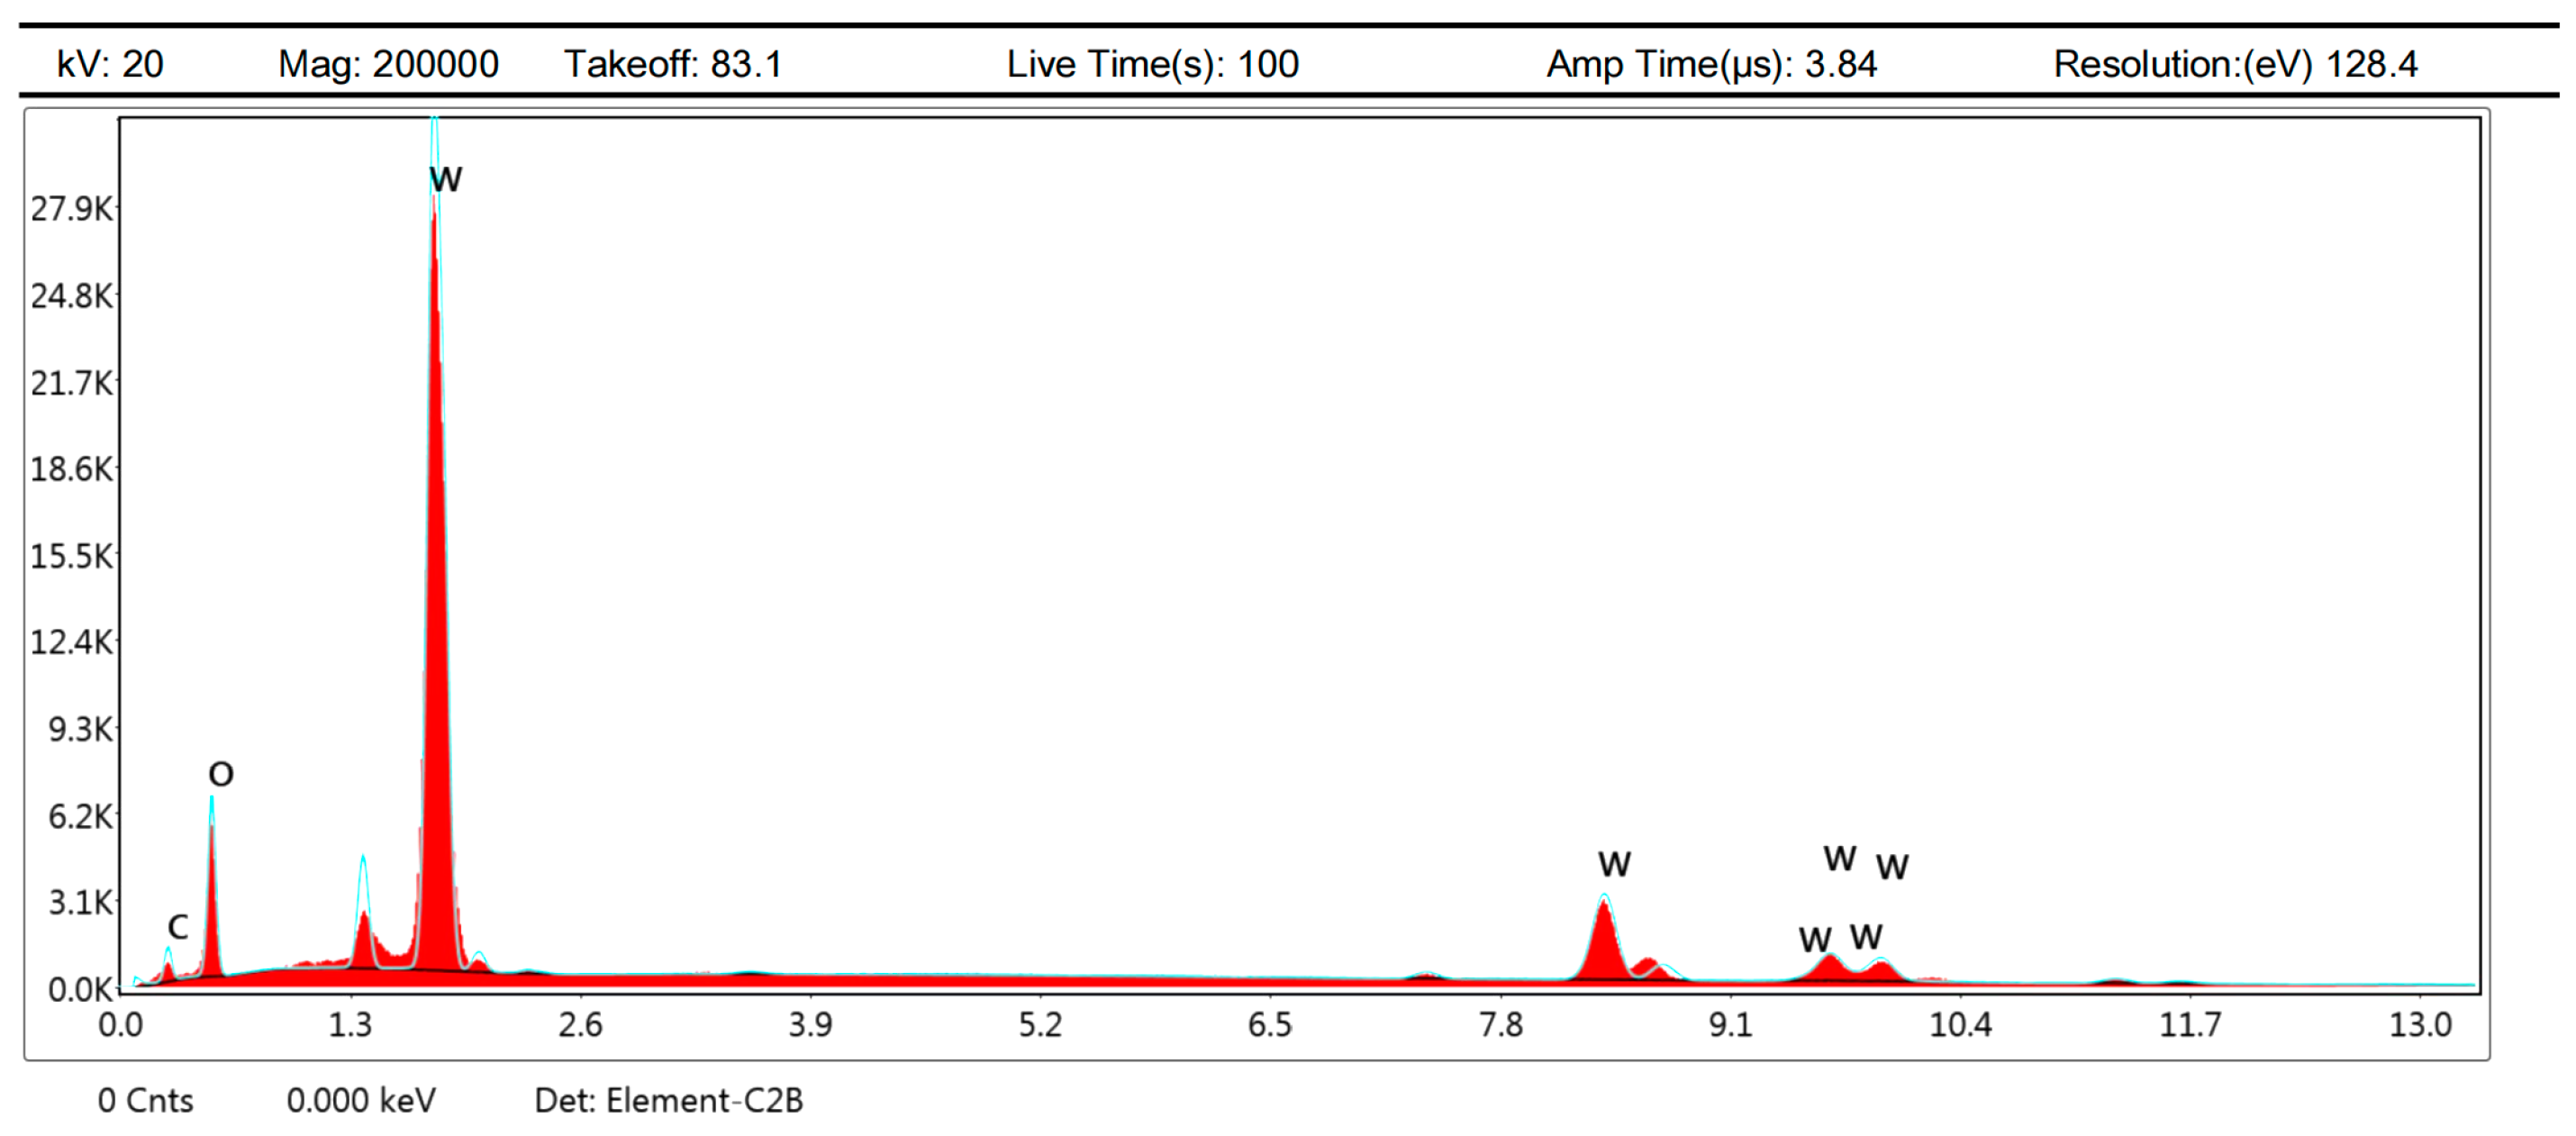
3.3.2. EDS and SEM Analysis

After EDS analysis, as shown in Figure 11, it is found that the main components of these spots are O and W elements, indicating that they are mainly oxidation products of W and Re elements, which causes the color change. The reason that the Re element is not detected is that the content of the Re element is originally less than that of the W element, and the rhenium oxide formed by the reaction at high temperature volatilizes due to the low sublimation point, which is consistent with the perspective of Dai Min [22].
As shown in Figure 12 and Figure 13, it is observed by SEM and LSCM that the black spots are oxide protrusions whose number at the bottom position is higher and the size is larger, while the number of protrusions at the top is relatively less and the size is smaller. The oxide in some of the large-sized protrusions has fallen off, forming pits with crater morphologies in Figure 14, which also demonstrates the formation process of small-sized oxide protrusions, middle-sized protrusions and large pits with crater morphologies. The decreasing number and size of protrusions from the bottom to the top indicate that the oxidation of TFTC from the bottom to the top is getting lighter. Thus, not only does vertical oxidation occur through the protective layer [23], but horizontal oxidation also occurs from the bottom to the top direction.
Therefore, we found that the protective layer of the TFTC needs to be thickened to resist oxidation at high temperatures [20], and the pads also need to be protected because not only does the pad undergo oxidation, but the TFTC also suffers from horizontal oxidation. This finding also applies to other sensors.

4. Conclusions

A tungsten-rhenium TFTC with a SiC protective film on all parts except the pads was fabricated by the MEMS process, and initial package and testing were performed. The Seebeck coefficient was 17.19 μV/°C and the response time was up to 12 μs. Additionally, the repeatability was still consistent with the standard curve under multiple cycle tests. However, during the high temperature test phase, the TFTC failed at around 620 °C. In this study, failure analysis is performed and it is verified that horizontal oxidation diffusion in the TFTC occurs, illustrating the importance of pad protection and providing a direction for the subsequent structural optimization and the extension of the service life of TFTCs and other sensors.

Author Contributions

Y.R. and M.X. are co-first authors. Conceptualization, Y.R., J.T. and Y.W.; Data curation, M.X.; Formal analysis, M.X.; Funding acquisition, Y.R., Y.W. and M.S.; Investigation, M.X.; Supervision, M.X., J.T., Y.W. and M.S. All authors have read and agreed to the published version of the manuscript.

Funding

This work is supported by the National Key Research and Development Program of China (2020YFB2009103).

Acknowledgments

Authors acknowledge Yong Zhu of AUS Griffith University for providing revision guidance. Authors acknowledge the Mems Research Institute of Zibo High-tech Industrial Development Zone for providing technical support.

Conflicts of Interest

The authors declare no conflict of interest. The funders had no role in the design of the study, in the collection, analyses or interpretation of data, in the writing of the manuscript or in the decision to publish the results.

References

  1. Ji, Z.; Duan, F.L.; Xie, Z. Transient Measurement of Temperature Distribution Using Thin Film Thermocouple Array on Turbine Blade Surface. IEEE Sens. J. 2021, 21, 207–212. [Google Scholar] [CrossRef]
  2. Jin, X.; Tian, Y.; Zhao, K.; Ma, B.; Deng, J.; Luo, J. Experimental study on supersonic combustion fluctuation using thin-film thermocouple and time–frequency analysis. Acta Astronaut. 2021, 179, 33–41. [Google Scholar] [CrossRef]
  3. Raman, P.K.N.; Bahari, A. Effect of Changing in Air Intake Temperature on Engine Performance Using Thermocouple. J. Adv. Ind. Technol. Appl. 2021, 2, 43–50. [Google Scholar] [CrossRef]
  4. Jin, X.H.; Ma, B.H.; Qiu, T.; Deng, J.J. ITO thin film thermocouple for transient high temperature measurement in scramjet combustor. In Proceedings of the 2017 19th International Conference on Solid-State Sensors, Actuators and Microsystems (TRANSDUCERS), Kaohsiung, Taiwan, 18–22 June 2017; pp. 1148–1151. [Google Scholar]
  5. Liu, D.; Shi, P.; Ren, W.; Liu, Y.; Liu, M.; Zhang, Y.; Tian, B.; Lin, Q.; Jiang, Z.; Ye, Z.-G. Fabrication and characterization of La0.8Sr0.2CrO3/In2O3 thin film thermocouple for high temperature sensing. Sens. Actuators A Phys. 2018, 280, 459–465. [Google Scholar] [CrossRef]
  6. Yakaboylu, G.A.; Pillai, R.C.; Sabolsky, K.; Sabolsky, E.M. MoSi2- and WSi2-based embedded ceramic composite thermocouples for high-temperature and harsh-environment sensing. Sens. Actuators A Phys. 2018, 272, 139–152. [Google Scholar] [CrossRef]
  7. Li, S.; Wang, Y.; Dong, M.; Pu, H.; Jiao, S.; Shang, Y. Experimental investigation on flow and heat transfer instabilities of RP-3 aviation kerosene in a vertical miniature tube under supercritical pressures. Appl. Therm. Eng. 2019, 149, 73–84. [Google Scholar] [CrossRef]
  8. Zhu, H.; Chi, Q.; Sun, H.; Zhao, X. Study on Temperature Field of Cable Tunnel Fire. In Proceedings of the 2019 9th International Conference on Fire Science and Fire Protection Engineering (ICFSFPE), Chengdu, China, 18–20 October 2019; pp. 1–5. [Google Scholar]
  9. Tian, B.; Yu, Q.; Zhang, Z.; Du, Z.; Ren, W.; Shi, P.; Jiang, Z. Effect of magnetron sputtering parameters on adhesion properties of tungsten-rhenium thin film thermocouples. Ceram. Int. 2018, 44, S15–S18. [Google Scholar] [CrossRef]
  10. Ferrer, A.J.; Halajko, A.; Amatucci, G.G. Direct-Write Dewetting of High Melting Temperature Metals on Flexible Substrates. Appl. Sci. 2019, 9, 3165. [Google Scholar] [CrossRef] [Green Version]
  11. Değirmenci, E.; Hüsnü Dirikolu, M. A thermochemical approach for the determination of convection heat transfer coefficients in a gun barrel. Appl. Therm. Eng. 2012, 37, 275–279. [Google Scholar] [CrossRef]
  12. Zhang, J.; Cheng, P.; Zhang, C.; Ding, G.; Duan, L.; Shao, J.; Wang, Q. MEMS-based platinum–platinum rhodium film temperature sensor on alumina substrate. J. Eng. 2016, 2016, 315–317. [Google Scholar] [CrossRef]
  13. Tian, B.; Zhang, Z.; Shi, P.; Zheng, C.; Yu, Q.; Jing, W.; Jiang, Z. Tungsten-rhenium thin film thermocouples for SiC-based ceramic matrix composites. Rev. Sci. Instrum. 2017, 88, 015007. [Google Scholar] [CrossRef] [PubMed]
  14. Zhang, Z.; Tian, B.; Yu, Q.; Lin, Q.; Zhao, N.; Jing, W.; Jiang, Z. A protected tungsten-rhenium thin film thermocouples sensor. In Proceedings of the 2017 IEEE 12th International Conference on Nano/Micro Engineered and Molecular Systems (NEMS), Los Angeles, CA, USA, 9–12 April 2017; pp. 796–799. [Google Scholar]
  15. Liu, Y.; Ren, W.; Shi, P.; Liu, D.; Zhang, Y.; Liu, M.; Ye, Z.G.; Jing, W.; Tian, B.; Jiang, Z. A Highly Thermostable In(2)O(3)/ITO Thin Film Thermocouple Prepared via Screen Printing for High Temperature Measurements. Sensors 2018, 18, 958. [Google Scholar] [CrossRef] [Green Version]
  16. Tian, B.; Liu, Z.; Zhang, Z.; Liu, Y.; Lin, Q.; Peng, S.; Jiang, Z. Effect of film deposition rate on the thermoelectric output of tungsten-rhenium thin film thermocouples by DC magnetron sputtering. J. Micromech. Microeng. 2020, 30, 065004. [Google Scholar] [CrossRef]
  17. Tian, B.; Yu, Q.; Zhang, Z.; Lin, Q.; Zhao, N.; Jing, W.; Jiang, Z. Measurement study of residual stress on tungsten-rhenium thin film thermocouples by nanoindentation technology. In Proceedings of the 2017 IEEE 12th International Conference on Nano/Micro Engineered and Molecular Systems (NEMS), Los Angeles, CA, USA, 9–12 April 2017; pp. 800–803. [Google Scholar]
  18. Li, M.-Q.; Yang, N.; Wang, G.-G.; Zhang, H.-Y.; Han, J.-C. Highly preferred orientation of Ga2O3 films sputtered on SiC substrates for deep UV photodetector application. Appl. Surf. Sci. 2019, 471, 694–702. [Google Scholar] [CrossRef]
  19. Grangsjo, G.; Sandblom, J.; Ulfendahl, H.R.; Wolgast, M. Theory of the heated thermocouple principle. Acta Physiol. Scand. 1966, 66, 366–373. [Google Scholar] [CrossRef] [PubMed]
  20. Zhang, Z.K.; Tian, B.; Liu, Y.; Du, Z.; Lin, Q.J.; Jiang, Z.D. Thermoelectric Characteristics of Silicon Carbide and Tungsten-Rhenium-Based Thin-Film Thermocouples Sensor with Protective Coating Layer by RF Magnetron Sputtering. Materials 2019, 12, 1981. [Google Scholar] [CrossRef] [Green Version]
  21. Zhang, Z.; Tian, B.; Du, Z.; Yu, Q.; Lin, Q.; Zhao, N.; Jiang, Z. Research on Measurement and Process of Tungsten-Rhenium Thin Film Thermocouples Sensor. In Proceedings of the 2018 IEEE 13th Annual International Conference on Nano/Micro Engineered and Molecular Systems (NEMS), Singapore, 22–26 April 2018; pp. 139–142. [Google Scholar]
  22. Min, D.; Zhanwei, H.; KuiHan, W.; Zhanguo, F. Oxidation behaviors of W-5%Re and W-26%Re tungsten-rhenium thermocouple wires. J. Mater. Metall. 2014, 13, 55–59. [Google Scholar] [CrossRef]
  23. Zhang, Z.; Tian, B.; Du, Z.; Lin, Q.; Li, K.; Zhao, N.; Jiang, Z. Effect of Oxidation on Conductivity Characteristics of Tungsten-Rhenium Thin-Film Thermocouples Sensor. In Proceedings of the 2019 IEEE 14th International Conference on Nano/Micro Engineered and Molecular Systems (NEMS), Bangkok, Thailand, 11–14 April 2019; pp. 114–117. [Google Scholar]
Figure 1. Fabrication process of tungsten-rhenium TFTCs (ak).
Materials 15 05071 g001
Figure 2. The fabricated TFTC by MEMS process.
Materials 15 05071 g002
Figure 3. Connection of compensation wires.
Materials 15 05071 g003
Figure 4. SEM micrographs of TFTC by MEMS. (a) Surface; (b) Cross section.
Materials 15 05071 g004
Figure 5. The response time of the TFTCs.
Materials 15 05071 g005
Figure 6. Comparison of voltage–temperature curves of TFTC and standard wire thermocouples. (a) −40~620 °C; (b) −40~500 °C.
Materials 15 05071 g006
Figure 7. Optical images of TFTC pads. (a) Before 620 °C; (b) After 620 °C.
Materials 15 05071 g007
Figure 8. Optical images of the TFTC line. (a) The bottom of the TFTC left line; (b) The middle of the TFTC left line; (c) The top of the TFTC left line; (d) The bottom of the TFTC right line; (e) The middle of the TFTC right line; (f) The top of the TFTC right line.
Materials 15 05071 g008
Figure 9. Model diagram of the sampling method.
Materials 15 05071 g009
Figure 10. The relationship between the quantity and position of black spots.
Materials 15 05071 g010
Figure 11. The EDS pattern of spots.
Materials 15 05071 g011
Figure 12. SEM images of the TFTC line. (a) The bottom of the TFTC left line; (b) The middle of the TFTC left line; (c) The top of the TFTC left line; (d) The bottom of the TFTC right line; (e) The middle of the TFTC right line; (f) The top of the TFTC right line.
Materials 15 05071 g012
Figure 13. LSCM images of the TFTC line. (a) The bottom of the TFTC left line; (b) The middle of the TFTC left line; (c) The top of the TFTC left line; (d) The bottom of the TFTC right line; (e) The middle of the TFTC right line; (f) The top of the TFTC right line.
Materials 15 05071 g013
Figure 14. LSCM images of the large spot.
Materials 15 05071 g014
Table 1. Sputtering parameters.
Target-Base Distance (mm)Background Pressure
(Torr)
Working Pressure
(Torr)
Sputtering Power
(W)
Ar2 Flow Rate
(sccm)
W-5Re602.8 × 10−75 × 10−325045
W-26Re200
SiC200
Table 2. The quantity of black spots at different sampling points.
Serial NumberQuantity of Spots
1234567891011
a62142421162
b00023120122
c01110001002
d02623412460
e22004200001
f10111011000
Publisher’s Note: MDPI stays neutral with regard to jurisdictional claims in published maps and institutional affiliations.

