Article

Research on Monocrystalline Silicon Micro-Nano Structures Irradiated by Femtosecond Laser

1
School of Mechatronics Engineering, Harbin Institute of Technology, Harbin 150001, China
2
Key Laboratory of Micro-Systems and Micro-Structures Manufacturing, Ministry of Education, Harbin Institute of Technology, Harbin 150001, China
3
Laboratoire Roberval, UTC, Sorbonne Universités, Université de Technologie de Compiègne, Centre de Recherche Royallieu, CS60319, CEDEX, 60203 Compiègne, France
4
Xinchang Research Institute of Zhejiang University of Technology, Xinchang 312500, China
5
College of Mechanical Engineering, Zhejiang University of Technology, Hangzhou 310014, China
*
Authors to whom correspondence should be addressed.
Materials 2022, 15(14), 4897; https://doi.org/10.3390/ma15144897
Submission received: 23 April 2022 / Revised: 27 June 2022 / Accepted: 8 July 2022 / Published: 14 July 2022
(This article belongs to the Special Issue Laser Manufacturing Technology and Its Advanced Applications)

Abstract

:
Femtosecond (fs) laser processing has received great attention for preparing novel micro-nano structures and functional materials. However, the induction mechanism of the micro-nano structures induced by fs lasers still needs to be explored. In this work, the laser-induced periodic surface structure (LIPSS) of monocrystalline silicon (Si) under fs laser irradiation is investigated. Three different layers named amorphous silicon (a-Si) layer, transition layer, and unaffected Si layer are observed after laser irradiation. The a-Si layer on the surface is generated by the resolidification of melting materials. The unaffected Si layer is not affected by laser irradiation and maintains the initial atomic structure. The transition layer consisting of a-Si and unaffected Si layers was observed under the irradiated subsurface. The phase transition mechanism of Si irradiated by fs laser is “amorphous transition”, with the absence of other crystal structures. A numerical model is established to describe the fs laser-Si interaction to characterize the electronic (lattice) dynamics of the LIPSS formation. The obtained results contribute to the understanding of fs laser processing of Si at the atomic scale as well as broaden the application prospects of fs laser for treating other semiconductor materials.

1. Introduction

Monocrystalline silicon (Si) is the most widely used first-generation semiconductor and has been applied in electronics, biology, energy, and communication, among other areas [1]. The fabrication of micro-nano structures on Si surfaces is a crucial factor in these applications. To date, a variety of micro-and nano-fabrication techniques have been established [2,3,4], including electron beam lithography, additive manufacturing, plasma etching, and focused ion beam processing. However, smooth surfaces, complex operations, and expensive equipment are commonly required in these techniques, making the rapid production of Si nanostructured surfaces challenging. Femtosecond (fs) laser, a promising high-resolution material processing technology, has been proven to be an ideal tool for regulating the surface energy deposition and inducing phase transitions of materials [5]. The foremost advantages of fs laser are the rapid energy transfer and limited heat-affected areas, which suggest great potential in the field of micro-and nano-scale manufacturing. Various surface structures induced by fs-laser on numerous materials have been reported, including semiconductors, metals, dielectrics, ceramics, and polymers [6,7,8,9,10]. It is obvious that the fs laser plays an essential role in photonics, biomedicine, and nanomanufacturing fields [11,12].
In recent decades, laser-induced periodic surface structuring (LIPSS) has been reported to fabricate different materials, which has attracted extensive attention in the field of ultrafast laser micro-nano processing [13,14,15,16,17,18]. Concerning the potential physical origin of LIPSS formation, various mechanisms have been proposed to explain its generation, such as interference between the laser and induced scattering wave, or with the surface plasmon polariton (SPP), self-organization mechanisms, Marangoni convection flow, Marangoni bursting, and liquid vortexes and flows, etc. [19,20,21,22,23,24]. Although the exact mechanism of the origin of the LIPSS remains under debate, there is no doubt that the fs laser irradiation process eventually leads to modification of the material surfaces. Fs laser irradiation can enable the materials to enter an extreme nonequilibrium state and trigger a series of structural changes, resulting in complex multi-scale surface morphology, unusual metastable phase, and microstructures that are difficult to produce by other methods [25]. Recent studies have revealed that the extremely high-pressure and high-temperature conditions generated by fs laser-induced confined micro-explosions realize a new metastable tetragonal phase of Si, providing a favorable pathway for opening up a series of new metastable phases, and expanding the further exploration of new crystal structure materials [26]. Furthermore, fs laser irradiation can cause rapid heating and melting of the material surface or internal local area and produce a high cooling rate of more than 1012 K/s, leading to instantaneous melting and rapid quenching of materials [27]. The extraordinarily nonequilibrium ultrafast process depends on the interaction between photons and electrons, which directly determines the shape and performance of the final structure, thus determining the function of the device. Therefore, research on the interaction of fs lasers with Si is necessary to broaden the understanding of the behavior of materials under extreme conditions and identify the generation of new phase transitions and microstructures [28].
The interaction between fs laser and semiconductors is a complex process involving energy transport and electron (lattice) dynamics across time and space scales [29]. During fs laser irradiation on Si materials, a thin layer on its surface undergoes ultrafast melting and resolidification processes, resulting in atomic positions and structural properties changes [30]. In addition, the extremely nonequilibrium characteristic of fs laser processing leads to amorphization, high-pressure phases, self-organizing structure, nanocrystalline phases, and pressure-driven phase transitions of Si [31]. Nevertheless, up to now, the micro-nano structures of Si induced by fs laser are yet to be in-depth investigated at the atomic scale.
To this end, the fs laser–Si interactions, LIPSS formation, and the phase transition mechanisms involved during fs laser processing were investigated through both experimental and numerical approaches. TEM (transmission electron microscope) characterization was employed to analyze the phase transition and interface structure of the LIPSS on the atomic scale. The characteristics and formation mechanisms of amorphous silicon (a-Si) preferentially formed in the surface layer and the peak center were determined. Simultaneously, a theoretical model was developed for simulating the ultrafast thermal and optical dynamics of Si with fs laser irradiation. Based on these results, the phase transition and ultrafast mechanisms of Si during LIPSS formation were proposed. This work focuses on the TEM characterization of Si micro-nano structures irradiated by fs laser and elucidates the electronic (lattice) dynamics involved in the ablation process based on numerical simulations. It aims to provide a new perspective of fs laser processing for the preparation of functional micro-nano structure surfaces and materials.

2. Theoretical Background

In this section, a theoretical model was established to simulate the electron and lattice dynamics of Si during the fs laser irradiation. The parameters of Si used in the model are listed in Table 1 [32]. Considering carrier generation, carrier diffusion, and Auger recombination, the change in the carrier density (Ne) as a function of time in the conduction band (CB) is described by a nonlinear partial differential equation (Equation (1)). The electron (Te) and lattice (Tl) temperature are defined by the two-temperature model (TTM) based on Equations (2) and (3) [33,34,35]:
N e t = ( k B T e μ e N e ) + J e n 0 N e n 0 P e
C e T e t = K e 2 T e ϒ ( T e T l ) + Q
C l T l t = K l 2 T l + ϒ ( T e T l )
where kB is the Boltzmann constant, μe is the carrier mobility, Je is the gain of free carriers per unit time and volume, n0 denotes the atomic density of non-excited Si, and Pe represents the conduction electron loss caused by Auger recombination. In the TTM model, t is time, ϒ is the coupling coefficient between the electron and the lattice, Ce (Cl) and Ke (Kl) represent the electron (lattice) heat capacity and electron (lattice) thermal conductivity of Si, respectively. The heat source term (Q) contains one-photon and two-photon absorption, the electron energy loss caused by impact ionization, the free-carrier heating, and the energy released by Auger recombination [36], which can be expressed as follows:
Q = [ ( ħ ω E 0 ) ψ 1 I ħ ω + ( 2 ħ ω E 0 ) ψ 2 I 2 2 ħ ω δ E 0 N e ] n 0 N e n 0 + α I + E 0 P e 3 2 k B T e N e t
where ω is the laser angular frequency, ħ is the reduced Planck constant, ψ 1 and ψ 2 are the one- and two-photon absorption coefficients, E0 is the bandgap, δ is the impact ionization coefficient, and α is the free electron absorption coefficient. The laser intensity on the Si surface is I = ( 1 R ) I E , R denotes the surface reflectivity. The energy attenuation of the laser beam propagating inside the sample is determined by the multiphoton loss and inverse Bremsstrahlung absorption [32], which is expressed as:
d I d z = ψ 1 I ψ 2 I 2 α I
where z is the depth into the sample, and absorption coefficient α is calculated via:
α = 2 ω c Im 1 ω p 2 / ω 2 ( 1 + i v ω )
where c is the light speed, ω p is the plasma frequency, and v denotes the carrier collision frequency.
To explain the phenomenon of modulation and absorption of fs laser pulse caused by the interference between the electromagnetic wave and the excited laser field on the Si surface, the periodic disturbance is added to the lateral intensity distribution of the laser beam. The incident laser intensity IE is given by [37]:
I E = 2 F I t p ln 2 π [ 1 + ζ cos ( 2 π x Ω x ) ] exp [ 2 ( x 2 + y 2 ) R 0 2 ] exp [ 4 ln 2 ( t t p ) t p 2 2 ]
where FI = 2Ep/(πR0)2 denotes the pulse fluence, Ep stands for the pulse energy, R0 is the laser spot radius, tp is the laser pulse duration, and Ω x represents the spatial period, which is regarded as approximately equal to the wavelength of the surface electromagnetic wave ΛE and is expressed as follows [38]:
Ω x Λ E = λ / ( Re ( ε ε + 1 ) ± sin θ )
where λ is the laser wavelength, θ is the laser incident angle, and ε is the dielectric permittivity.
The free electrons in the Si valence band (VB) absorb photons and transit to the CB induced by the fs laser irradiation. The dielectric permittivity ε can be expressed by using the Drude model [39]:
ε = 1 + ( ε S i 1 ) ( 1 N e N 0 ) ω p 2 ( N e ) ω 2 ( 1 + i ν ω )
where ε S i = 13.64 + 0.048i is the dielectric constant of non-excited Si. N0 stands for the total valance band density.
The reflection of Si on the fs laser heat source directly affects the electron–lattice nonequilibrium heat transfer and laser energy deposition process, which can be written as Equations (10)–(12) [36]:
n = n 1 + i n 2
n 1 = ε 1 + ε 1 2 + ε 2 2 2
n 2 = ε 1 + ε 1 2 + ε 2 2 2
where n1 is the normal refractive index, and n2 denotes the extinction coefficient. ε1 and ε2 represent the real and imaginary parts of the dielectric coefficient.
Based on the above equations, the reflection R of the Si surface can be calculated:
R = ( n 1 1 ) 2 + n 2 2 ( n 1 + 1 ) 2 + n 2 2
The dimension of the TTM simulation domain is 20 × 20 × 1 mm3 with a minimum grid size of 100 nm. The step size was set as 5 fs. The initial values of the system were set as Te = Tl = 300 K, T e / t = 0 , T l / t = 0 , and the initial electron density (NI) value of Si was 1 × 1024 m−3.

3. Experimental Processes and Sample Tests

3.1. Materials and Laser Irradiation

The standard one-side-polished (100) crystallographic Si wafer with a size of 10 × 10 × 0.6 mm3 was chosen for single-pulse fs laser irradiation. The high-resolution transmission electron microscope (HRTEM, Talos F200X, FEI Corp., Hillsborough, OR, USA) and corresponding detailed fast Fourier transform (FFT) images of the sample are shown in Figure 1. It is proved that [1] is the dominant exposed zone axis (ZA) and consists of (040), (220), and ( 2 ¯ 20 ) lattice planes with the distance of 0.136 nm, 0.192 nm, and 0.192 nm, respectively. A linearly polarized fs laser system (Pharos, Light Conversion Ltd., Vilnius, Lithuania), working at the 1030 nm wavelength with a pulse duration of 300 fs and a repetition rate of 1 MHz, was used to irradiate the sample. A pulse picker divider is integrated into the used laser source. Its n1 value indicates that one of n1 pulses in the pulse train is selected to be emitted from the laser source. In addition, the laser machining system is equipped with a high-speed optical shutter (10FBS-5-10, Micro photons Technology, Co., Ltd., Shanghai, China), with a maximum working frequency of 2 kHz. By setting the values of shutter open time, shutter working frequency, n1, and laser repetition rate as 1, 1 kHz, 1000, and 1 MHz, respectively, the effective emitting laser pulse number is calculated as 1 ÷ 1000 ÷ 1000 × 106 = 1. Therefore, the single pulse laser irradiation strategy can be realized at a fixed position. The laser beam was focused on the sample surface through an optical lens with a focal length of 50 mm, and the focal spot diameter was approximately 11 μm. The sample was fixed on a three-dimensional micro-mobile platform with a positioning accuracy of 1 um for processing in an atmospheric environment. After laser processing, the obtained sample was placed in ethanol for ultrasonic cleaning for 15 min.

3.2. Characterization

The phase composition of the pristine Si was characterized using X-ray diffraction (XRD, X’PERT, Panalytical, Almelo, The Netherlands) in the range of 10°–100° at a scanning rate of 5°/min. The internal LIPSS structure was characterized via transmission electron microscopy (TEM, Talos F200X, FEI Corp., Hillsborough, OR, USA) operated at 200 kV and equipped with an energy dispersive X-ray spectrometer (EDS). The TEM sample is extracted by a focused ion beam device (FIB, Helios Nanolab 600i, FEI Corp.) from the center position irradiated by the laser.

4. Results and Discussion

4.1. Ultrafast Electron and Lattice Dynamics

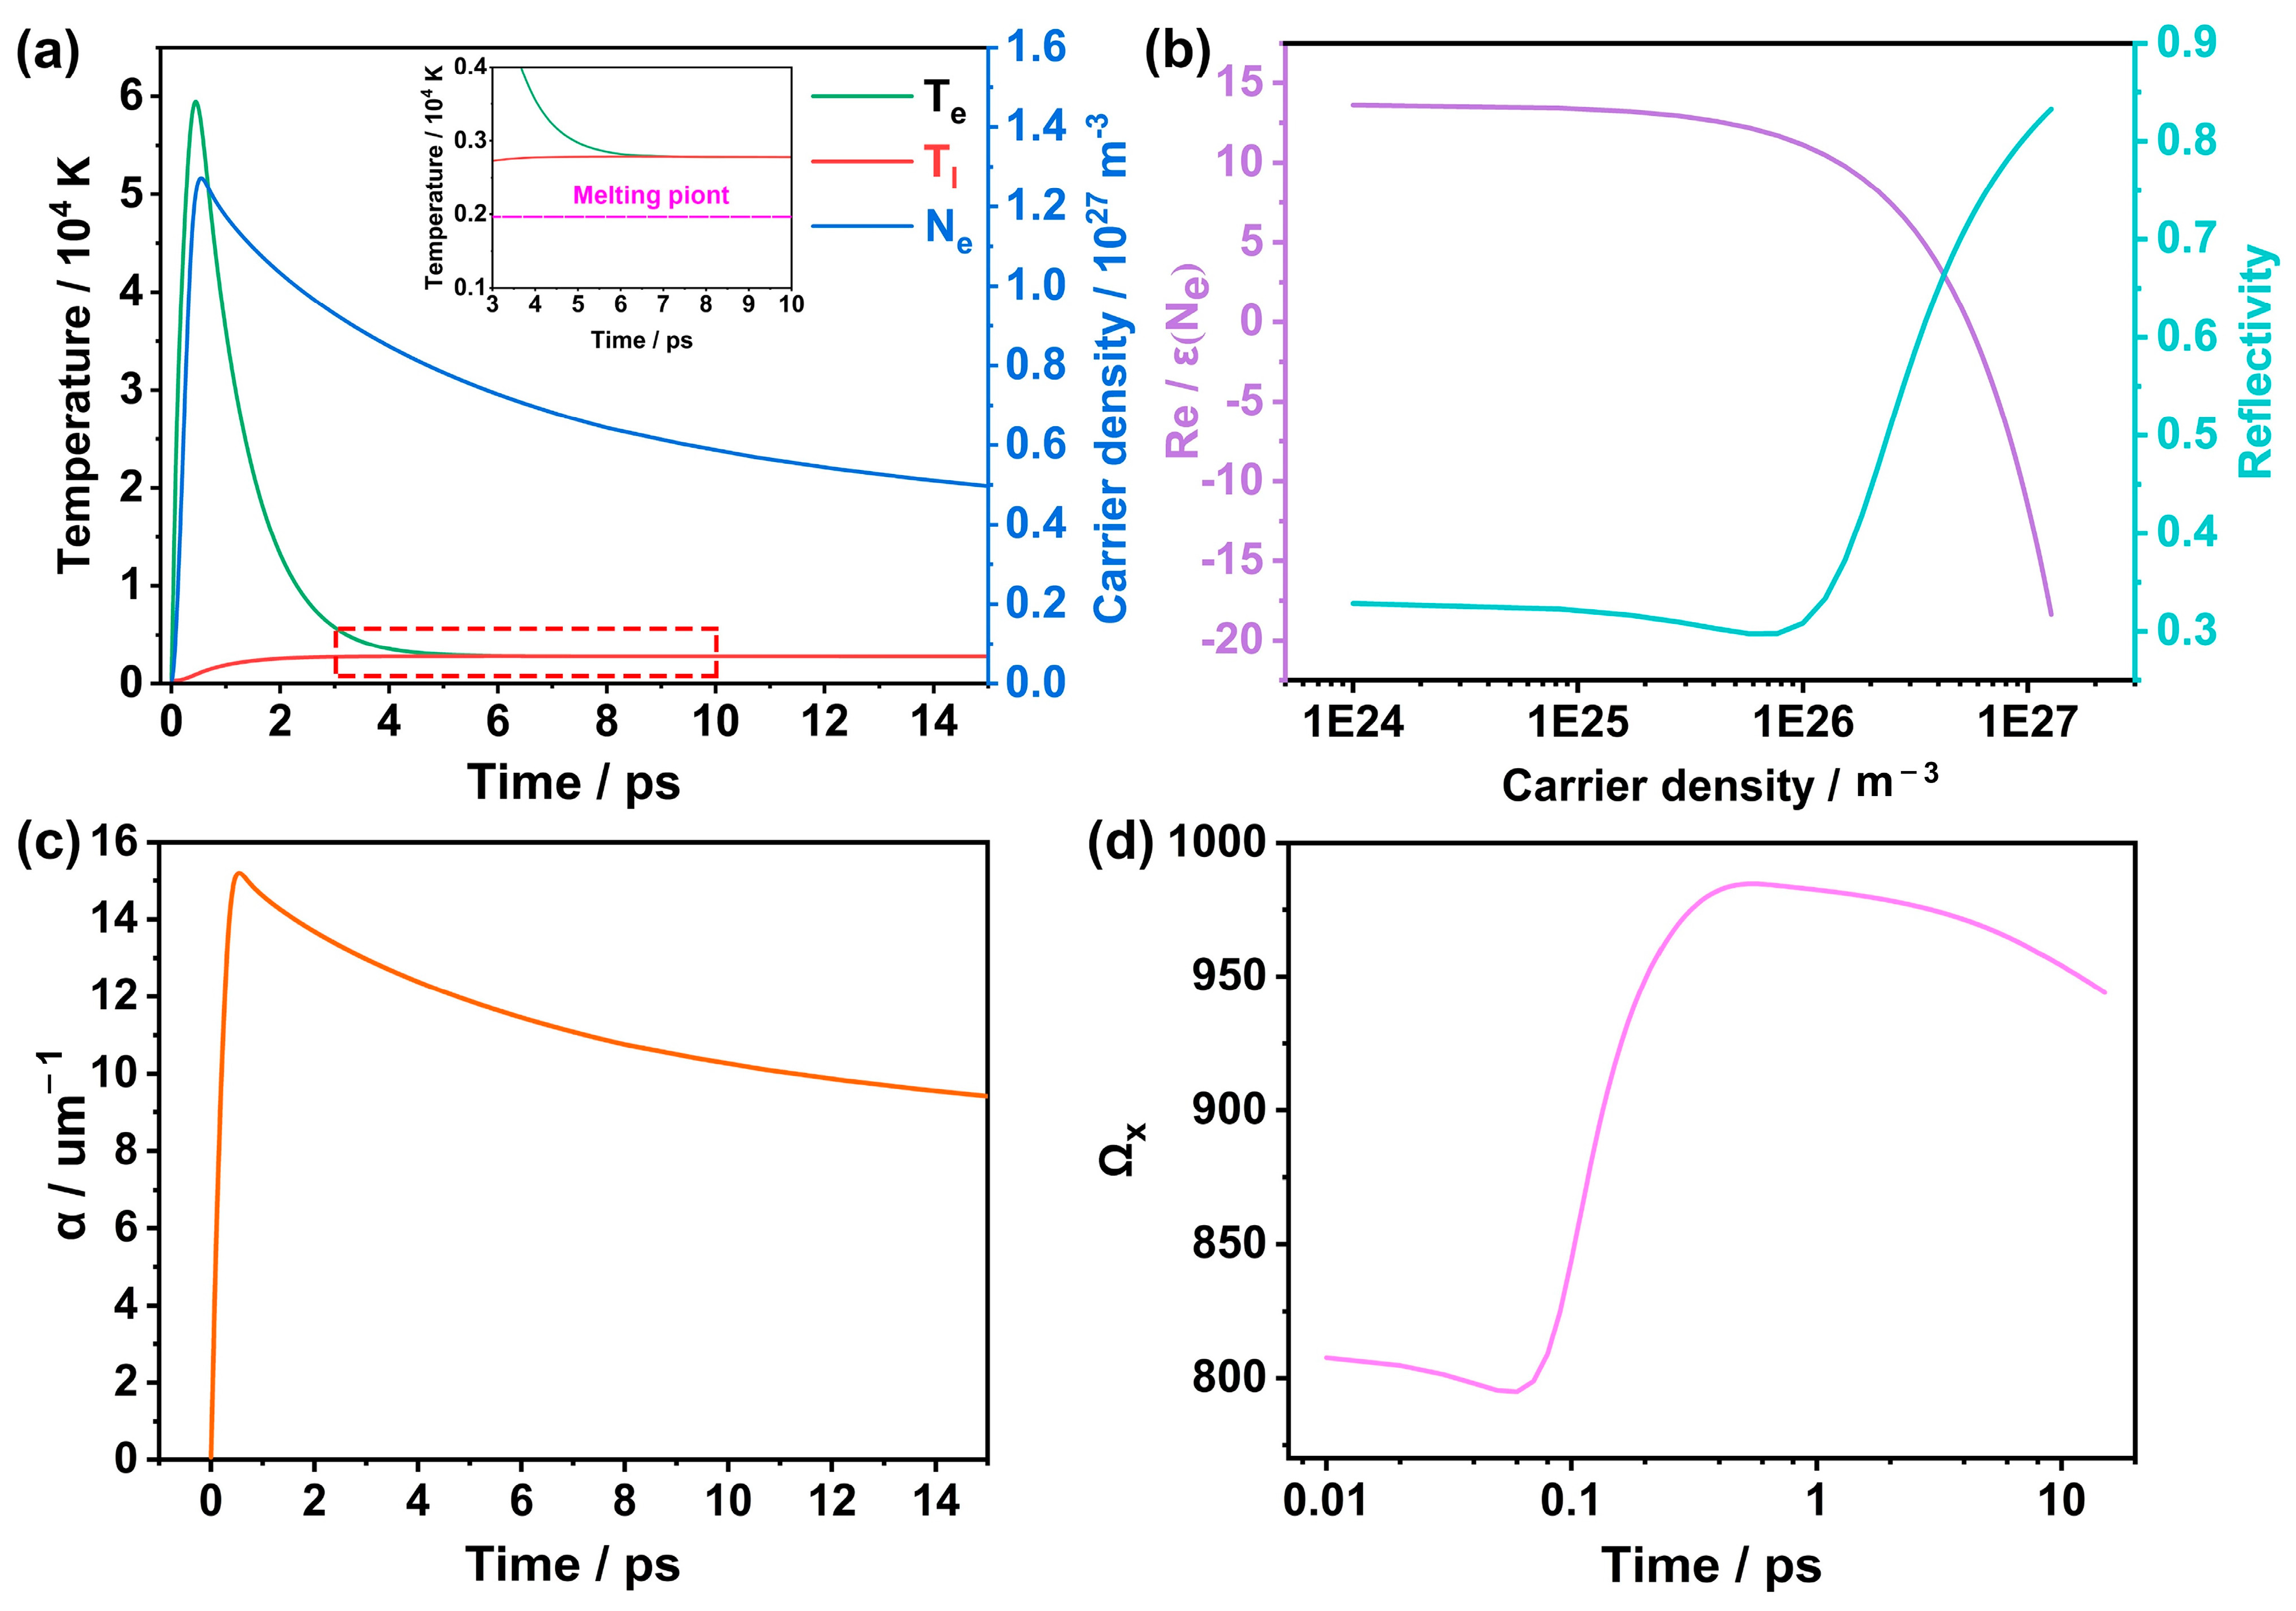
Based on simulating the electron (lattice) dynamics of Si under fs laser irradiation, the electron (lattice) temperature and optical properties evolution can be obtained. Figure 2 illustrates the distribution of electrons, lattice temperature, and carrier density of Si at 6 ps under laser irradiation. It can be discovered that the distribution of electrons, lattice temperature, and carrier density of Si exhibit evident periodicity, which is modulated by the periodic interference energy field formed by the incident laser and the SPP. Figure 3a shows the time-dependent evolution of electron (lattice) temperature and carrier density at the x = 0, y = 0 and z = 0 positions. Firstly, the carriers absorb the laser pulse energy in an extremely short time (100 fs), resulting in a rapid temperature rise to a peak value of 5.95 × 10⁴ K at 450 fs. Meanwhile, the carrier density reached a peak of 1.24 × 1027 m−3. Subsequently, the thermalized free electrons undergo rapid inelastic collisions with the surrounding lattice, which are transferred to the lattice system through the carrier–lattice coupling effect. The electron temperature and carrier density gradually decrease due to the end of laser incidence. Finally, the electron and lattice temperatures reach thermal equilibrium at 6 ps. Notably, the equilibrium temperature is 2820 K, which is higher than the melting point of Si (1687 K), indicating that the laser fluence has exceeded its melting threshold.
Based on the Drude model, a large number of electrons in the VB are excited by fs laser to form free electrons in the CB. The carrier density change in Si will affect its optical properties [40]. Figure 3b displays the evolution of the real part of the dielectric constant and surface reflectivity of Si. The fs laser irradiation leads to the increasing carrier density. During this process, the reflectivity is reduced with the enhanced absorption of laser energy by Si. With the increase of carrier density, the real part of the dielectric constant gradually decreases and eventually becomes negative, i.e., the optical properties of the Si surface will evolve from a semiconductor to a metal-like material. The resonance absorption is generated when plasma frequency approaches the laser frequency, resulting in the lowest reflectivity. Subsequently, the increased reflectivity indicates a decrease in the energy coupling efficiency between the laser and the highly excited surface. Figure 3c demonstrates that the absorption coefficient increases rapidly in the high excitation state and gradually decreases when the laser pulse disappears. This result reflects that the variations of the reflectivity and absorption coefficient of Si indicate the influence of the carrier density on its optical properties. Furthermore, the wavelength range of the SPP could estimate the expected subwavelength structure on fs laser-irradiated Si. Figure 3d exhibits the period of SPP as a function of time. It is seen that the generation period varies significantly with time and the period of the SPP is in the range of 790–980 nm. Therefore, the energy transfer of fs laser irradiation on Si transmits photon energy to VB electrons through photoionization, causing changes in carrier density to affect the optical properties of Si. In particular, numerous excited free electrons form SPP on the Si surface. The energy field generated by the interference of SPP with the incident laser removes Si through an ultrafast heat effect, resulting in the LIPSS formation. Therefore, the excitation of SPP and its interference with the incident laser beam is regarded as the primary formation mechanism of the LIPSS.

4.2. Surface Micro-Nano Structure Characteristics

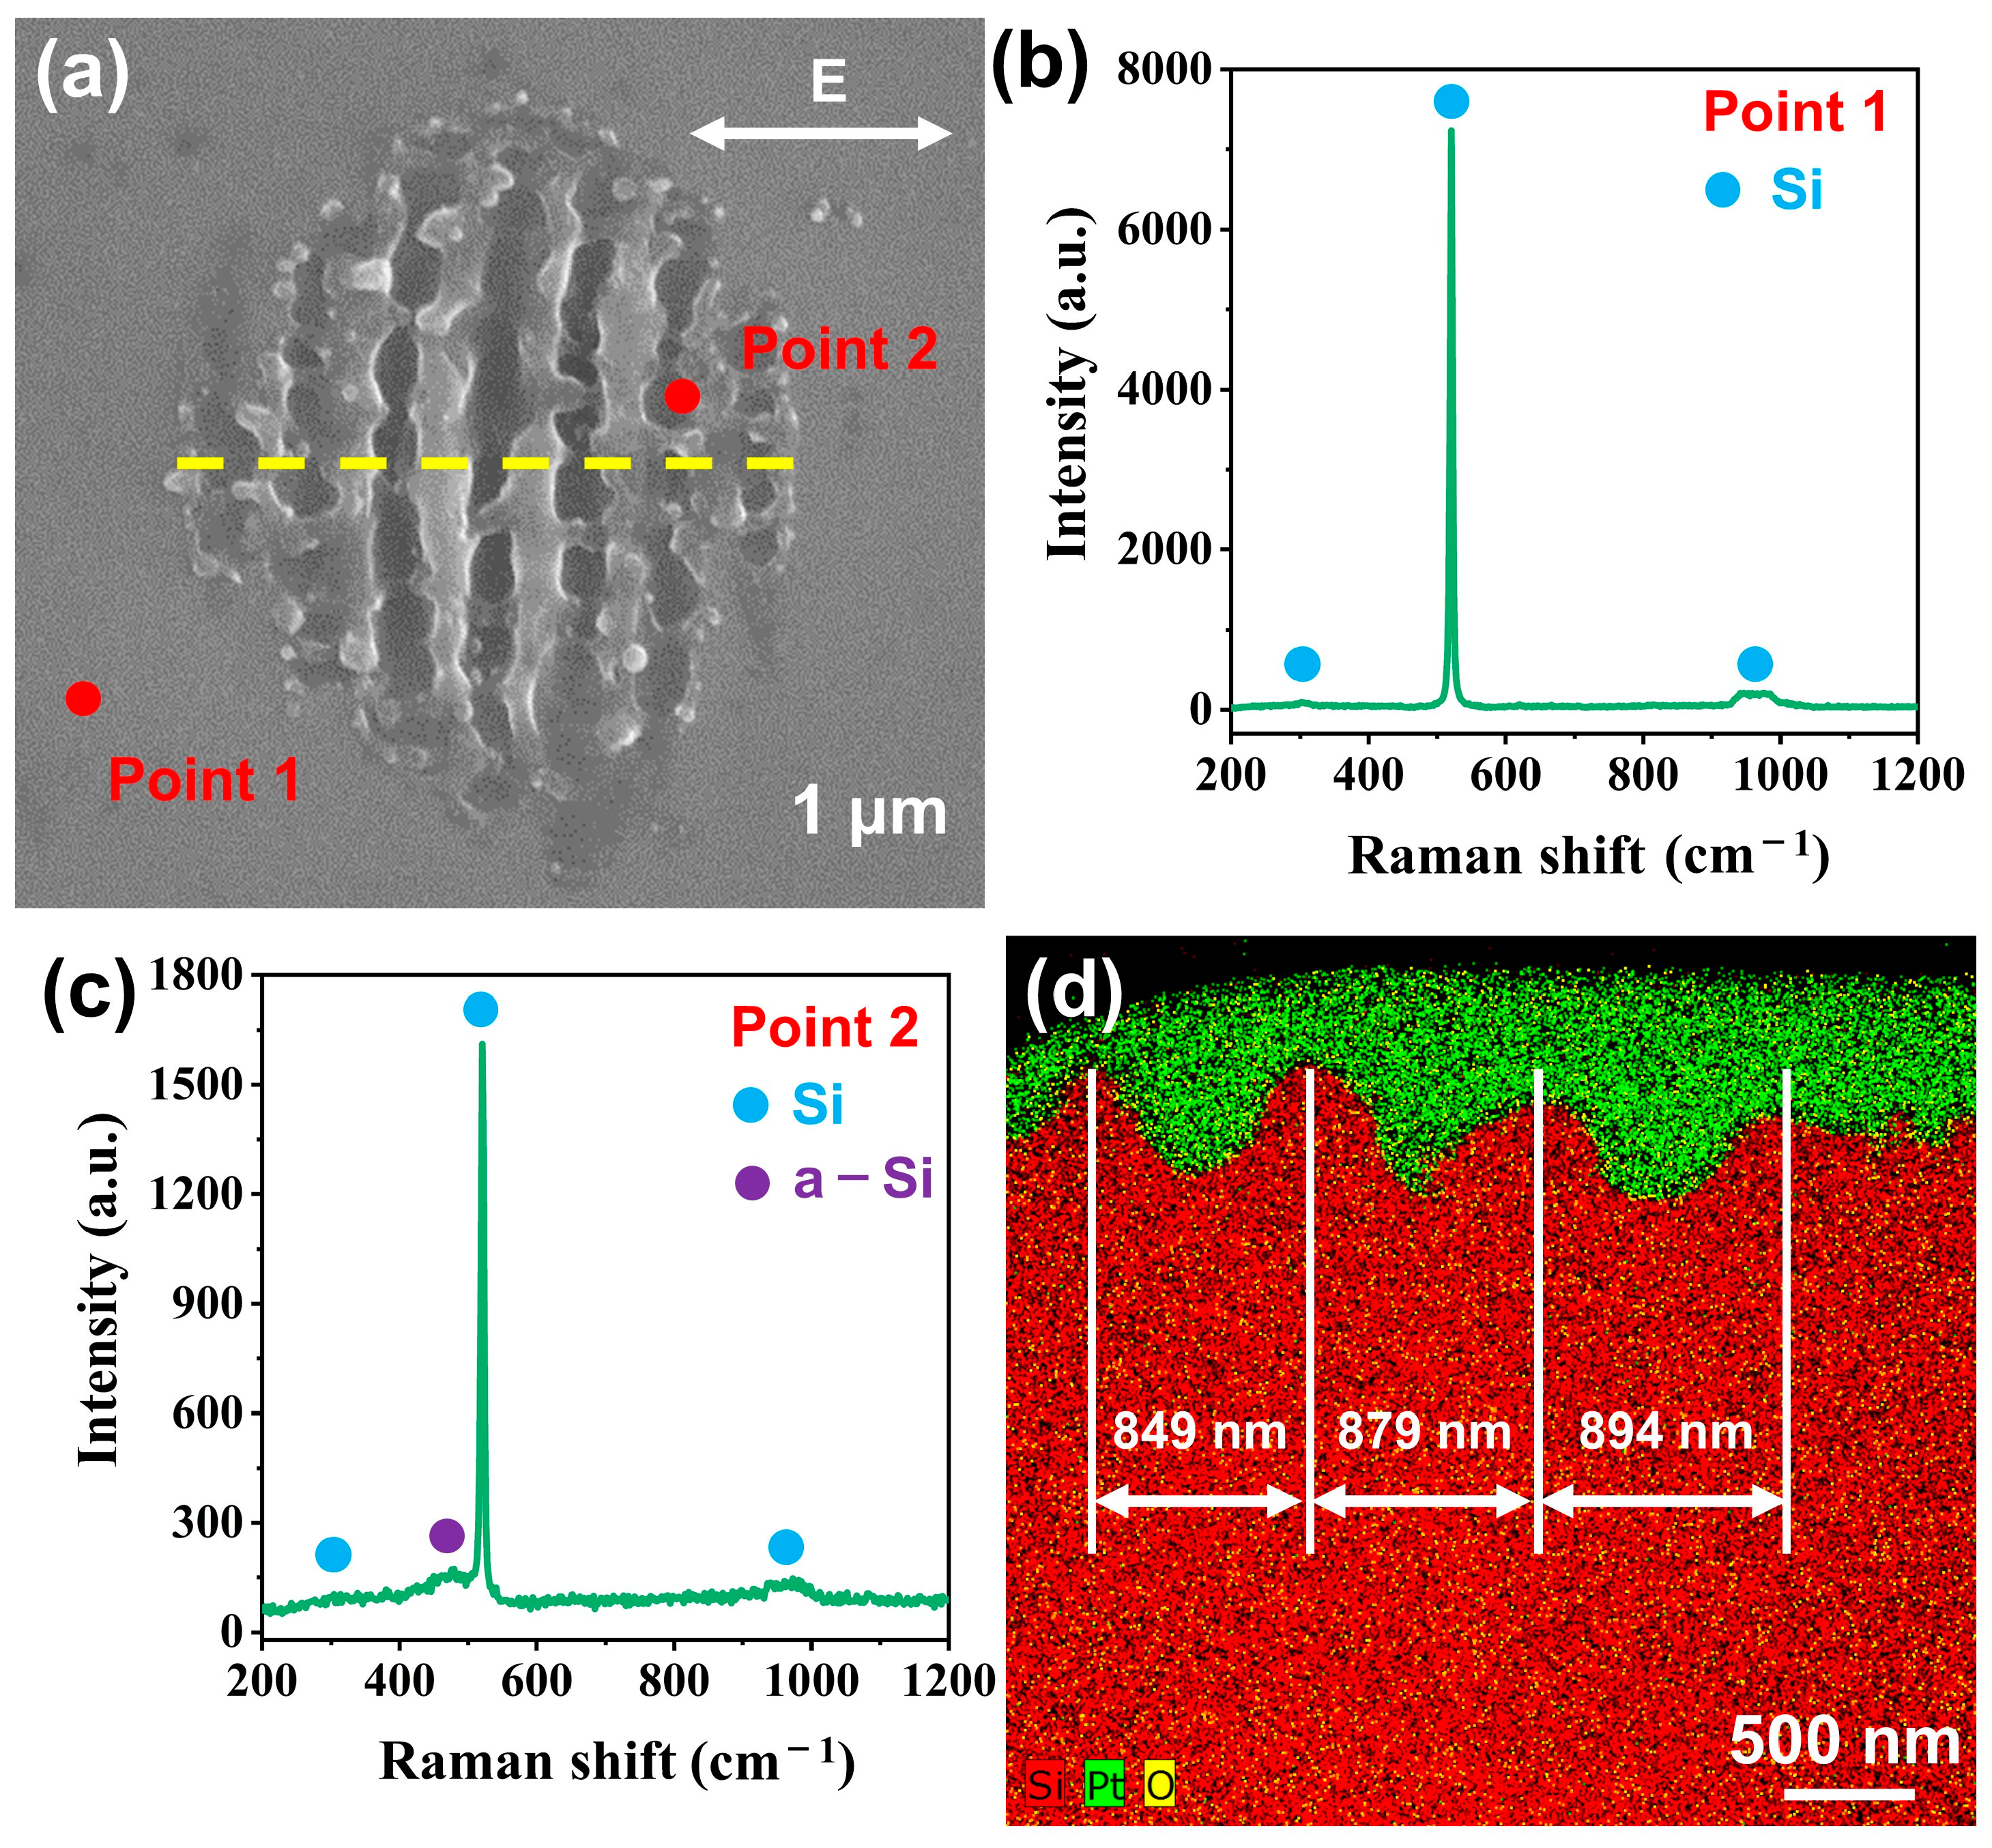
Figure 4a displays the SEM image of the LIPSS induced by fs laser with a laser fluence of 0.25 J/cm2, exhibiting a state perpendicular to the horizontal polarization direction of the laser beam. Surface melting usually occurs in fs laser-induced Si structures in the air [2]. Figure 4b,c provide the Raman spectroscopy analysis of the unirradiated Si (Point 1) and the LIPSS (Point 2). As shown in Figure 4c, three intrinsic Raman peaks located at around 300 cm−1, 520.5 cm−1, and 960 cm−1 are observed, which belong to two transverse acoustic (2TA) modes, transverse optical phonon (TO), and two transverse optical (2TO) modes, respectively [41]. As shown in Figure 4c, in addition to the intrinsic Si peak, a broad a-Si peak appears at 480 cm−1 in LIPSS, which is a good indicator of laser irradiation-induced melting of the Si surface. Furthermore, the peak intensity of the TO mode measured from the LIPSS is significantly lower than that measured from the unirradiated Si, implying a high absorptivity or intense scattered laser [42].
The EDS analysis of the cross-sectional morphology of the FIB lamella is presented in Figure 4d. Both the LIPSS and the deposited Pt layer are observed. The overall profile of the LIPSS in Figure 4d presents that the average period of the typical subwavelength structure within LIPSS is around 874 nm, which is close to the calculated period shown in Figure 3d. The apparent asymmetry of the LIPSS is attributed to the slight deviation of the incident laser beam from the normal direction of the sample. The superposition of Si, O, and Pt elements shows that the crystalline Si is below the LIPSS, and the Pt layer deposited on the top of the structure leads to a higher content of the O element. There is no significant O accumulation between the Pt layer and the crystalline Si layer, which means no evident redox reaction during the formation of the LIPSS. The laser-induced amorphization and atomic structure of the LIPSS obtained above are further confirmed and visualized in the cross-section of the irradiated Si structure described below.

4.3. Phase Transition Mechanism

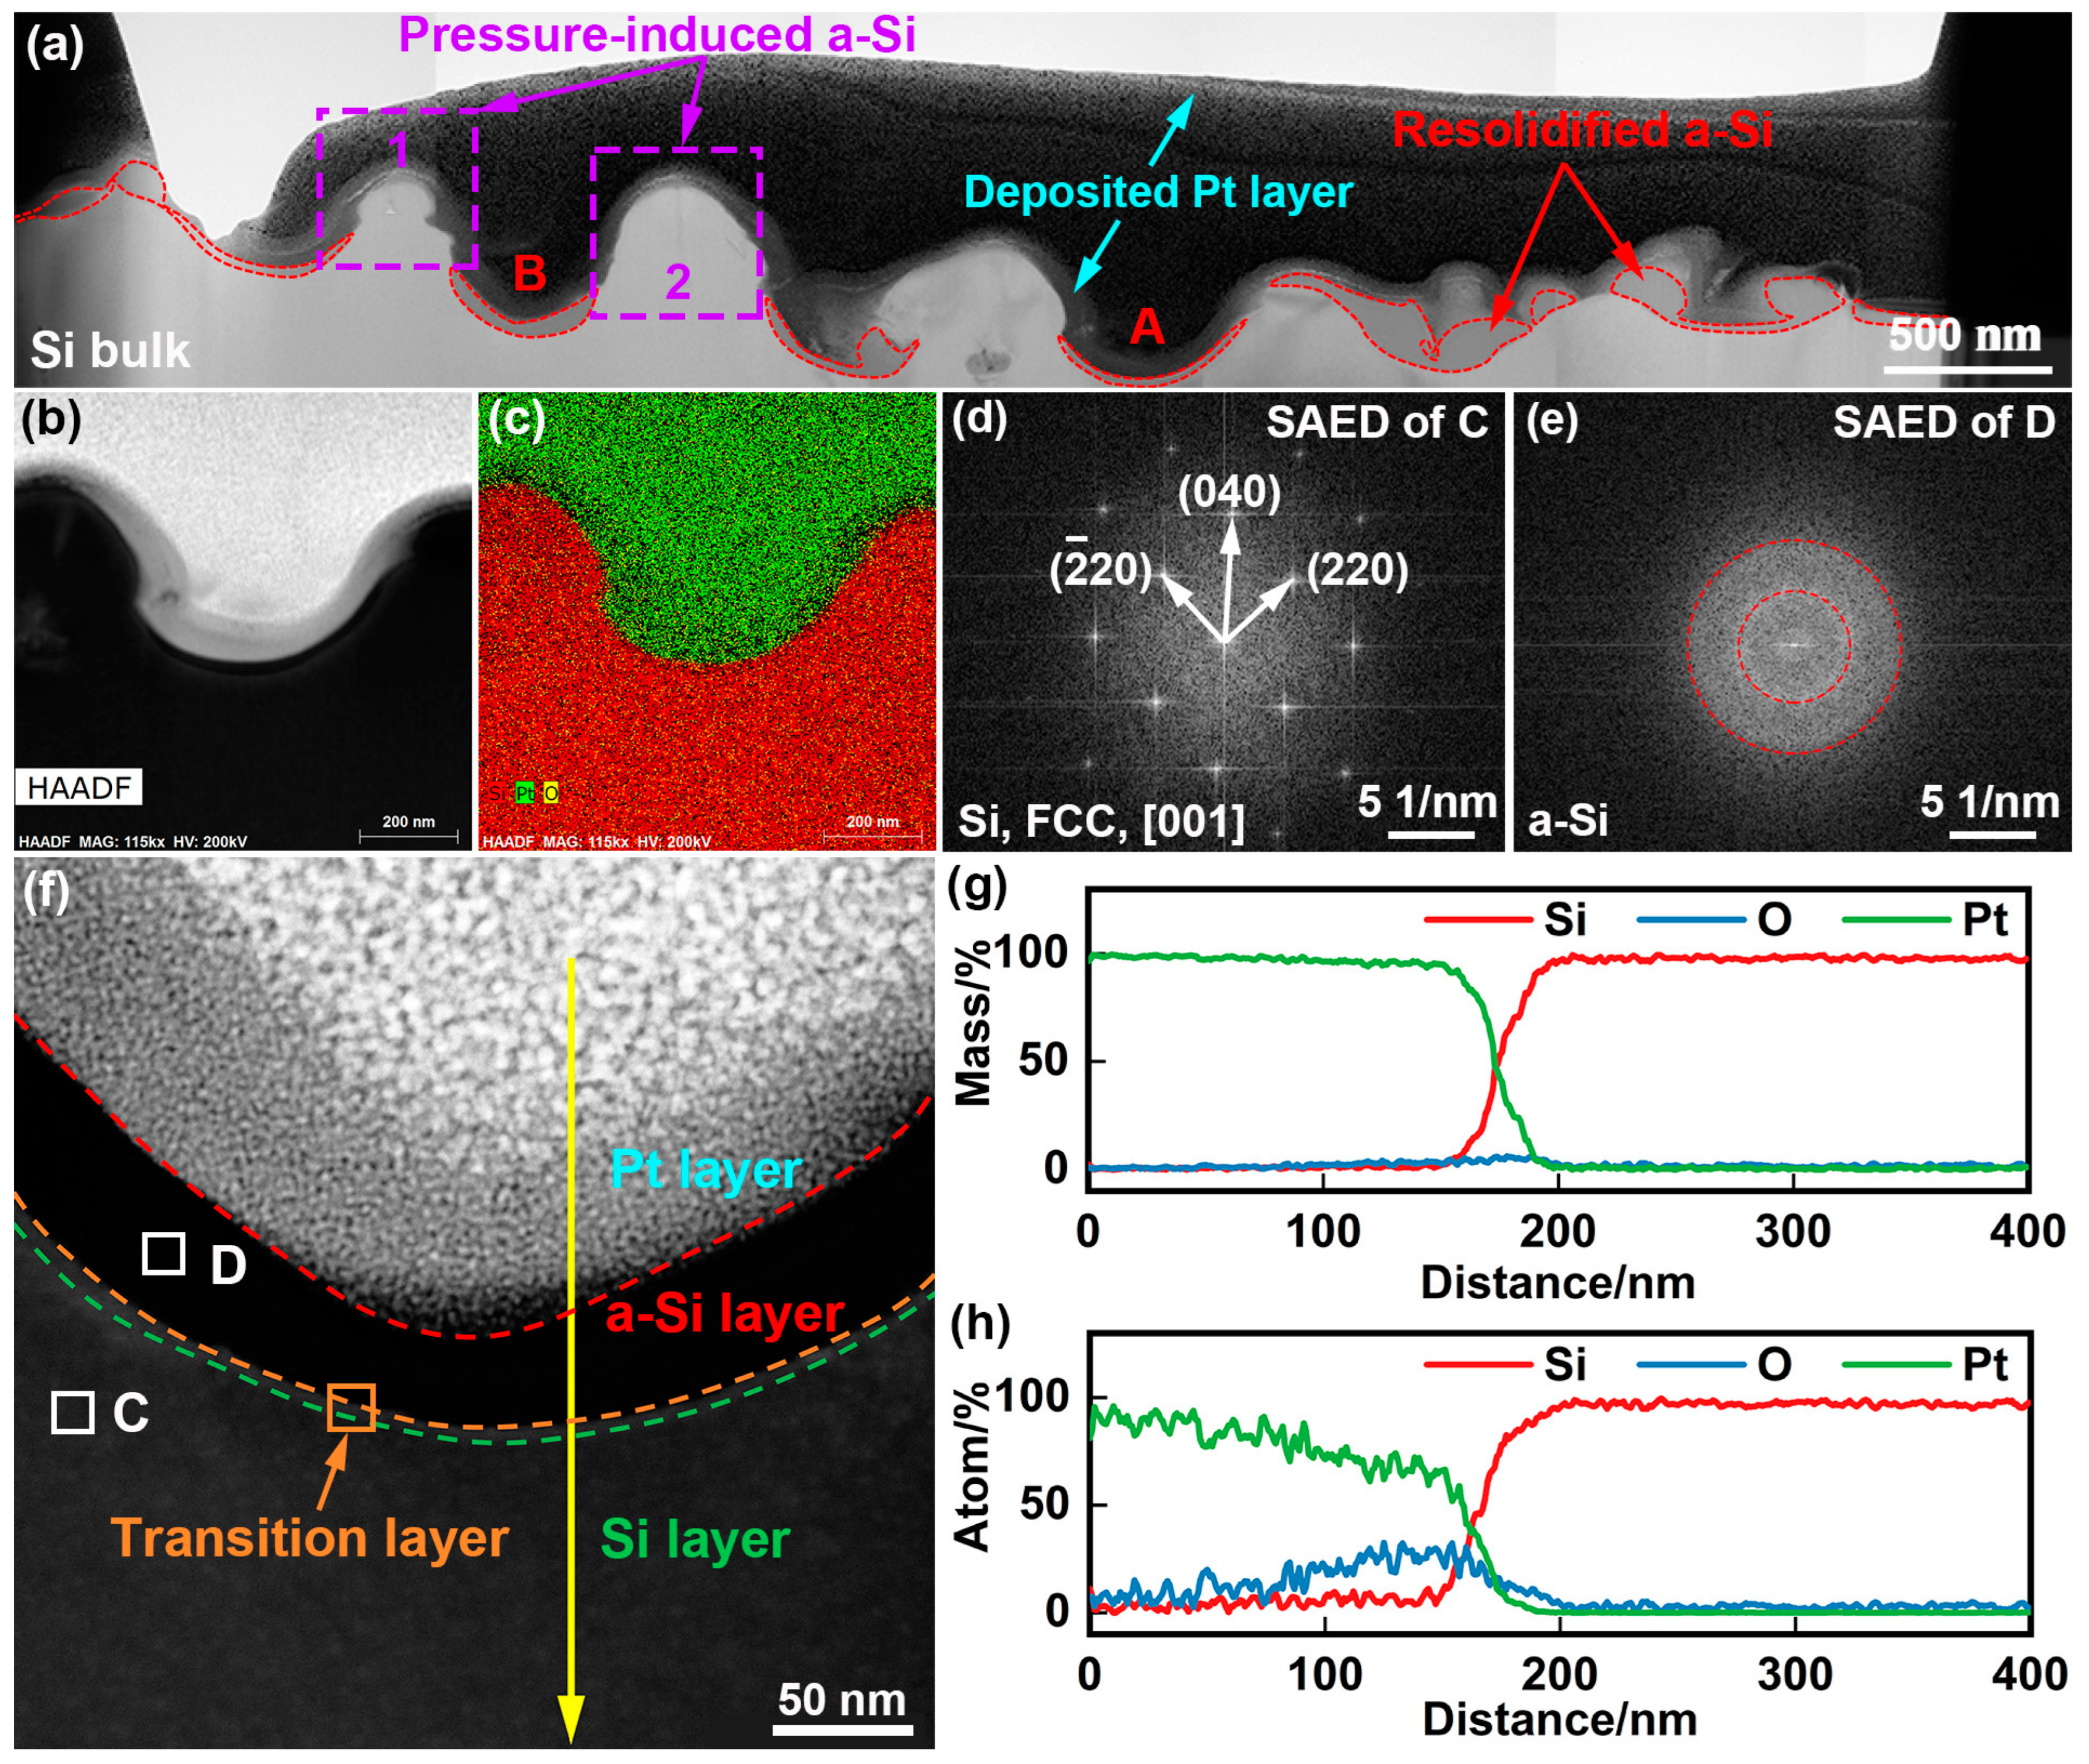
Figure 5a illustrates the overall cross-section morphology of the LIPSS, which is clearly visible under the dark deposited Pt layer. The central region of the LIPSS has a larger structure size and a low position, categorizing it as a highly modified region. However, the laser energy received by the edge regions is relatively low. This region is categorized as a lower modification region with a high position and smaller structural size. According to the LIPSS morphology in Figure 5a, it can be found that the surface damage distribution is highly complex. Therefore, TEM observation was used to further reveal the damage evolution mechanism induced by fs laser processing.
Figure 5b indicates the high angle annular darkfield (HAADF) image of region A in Figure 5a. It can be observed that the O content in the highly modified region is extremely low from the EDS maps results in Figure 5c. Moreover, the Si region beneath the LIPSS is not affected by the laser. Figure 5f demonstrates the HAADF image of region B in Figure 5a. The EDS-line scan results in Figure 5g and h corresponding to the yellow line in Figure 5f prove the low O content in the LIPSS. Figure 5d exhibits the SAED pattern of region C in Figure 5f, and the calibration result suggests that it is the [1] ZA of Si, which consists of (220), (220), and (040) lattice planes. The diffraction spots are entirely attributable to the Si crystal, i.e., there is no sign of oxidation forming the SiOx, indicating that no oxidation of molten Si occurred during the resolidification process. Furthermore, the amorphous ring demonstrated in Figure 5e corresponds to the SAED pattern of the region D in Figure 5f, which indicates an a-Si layer with a thickness of 50 ± 10 nm caused by melting and ultra-fast solidification. Due to the low-energy deposition of the first Pt protective layer, the amorphization induced by Ga+ ion irradiation during the FIB sample preparation can be ignored. Moreover, a transition layer with a few nanometers thickness is observed between Si and a-Si layers (see Figure 6). This phenomenon states that both the two phases could coexist. Therefore, the LIPSS in Figure 5f can be divided into the a-Si layer, transition layer, and unaffected Si layer from the peak to the bottom. The a-Si layer in Figure 5a is marked and surrounded by red dashed lines, indicating that the amorphization of Si occurs during LIPSS formation.
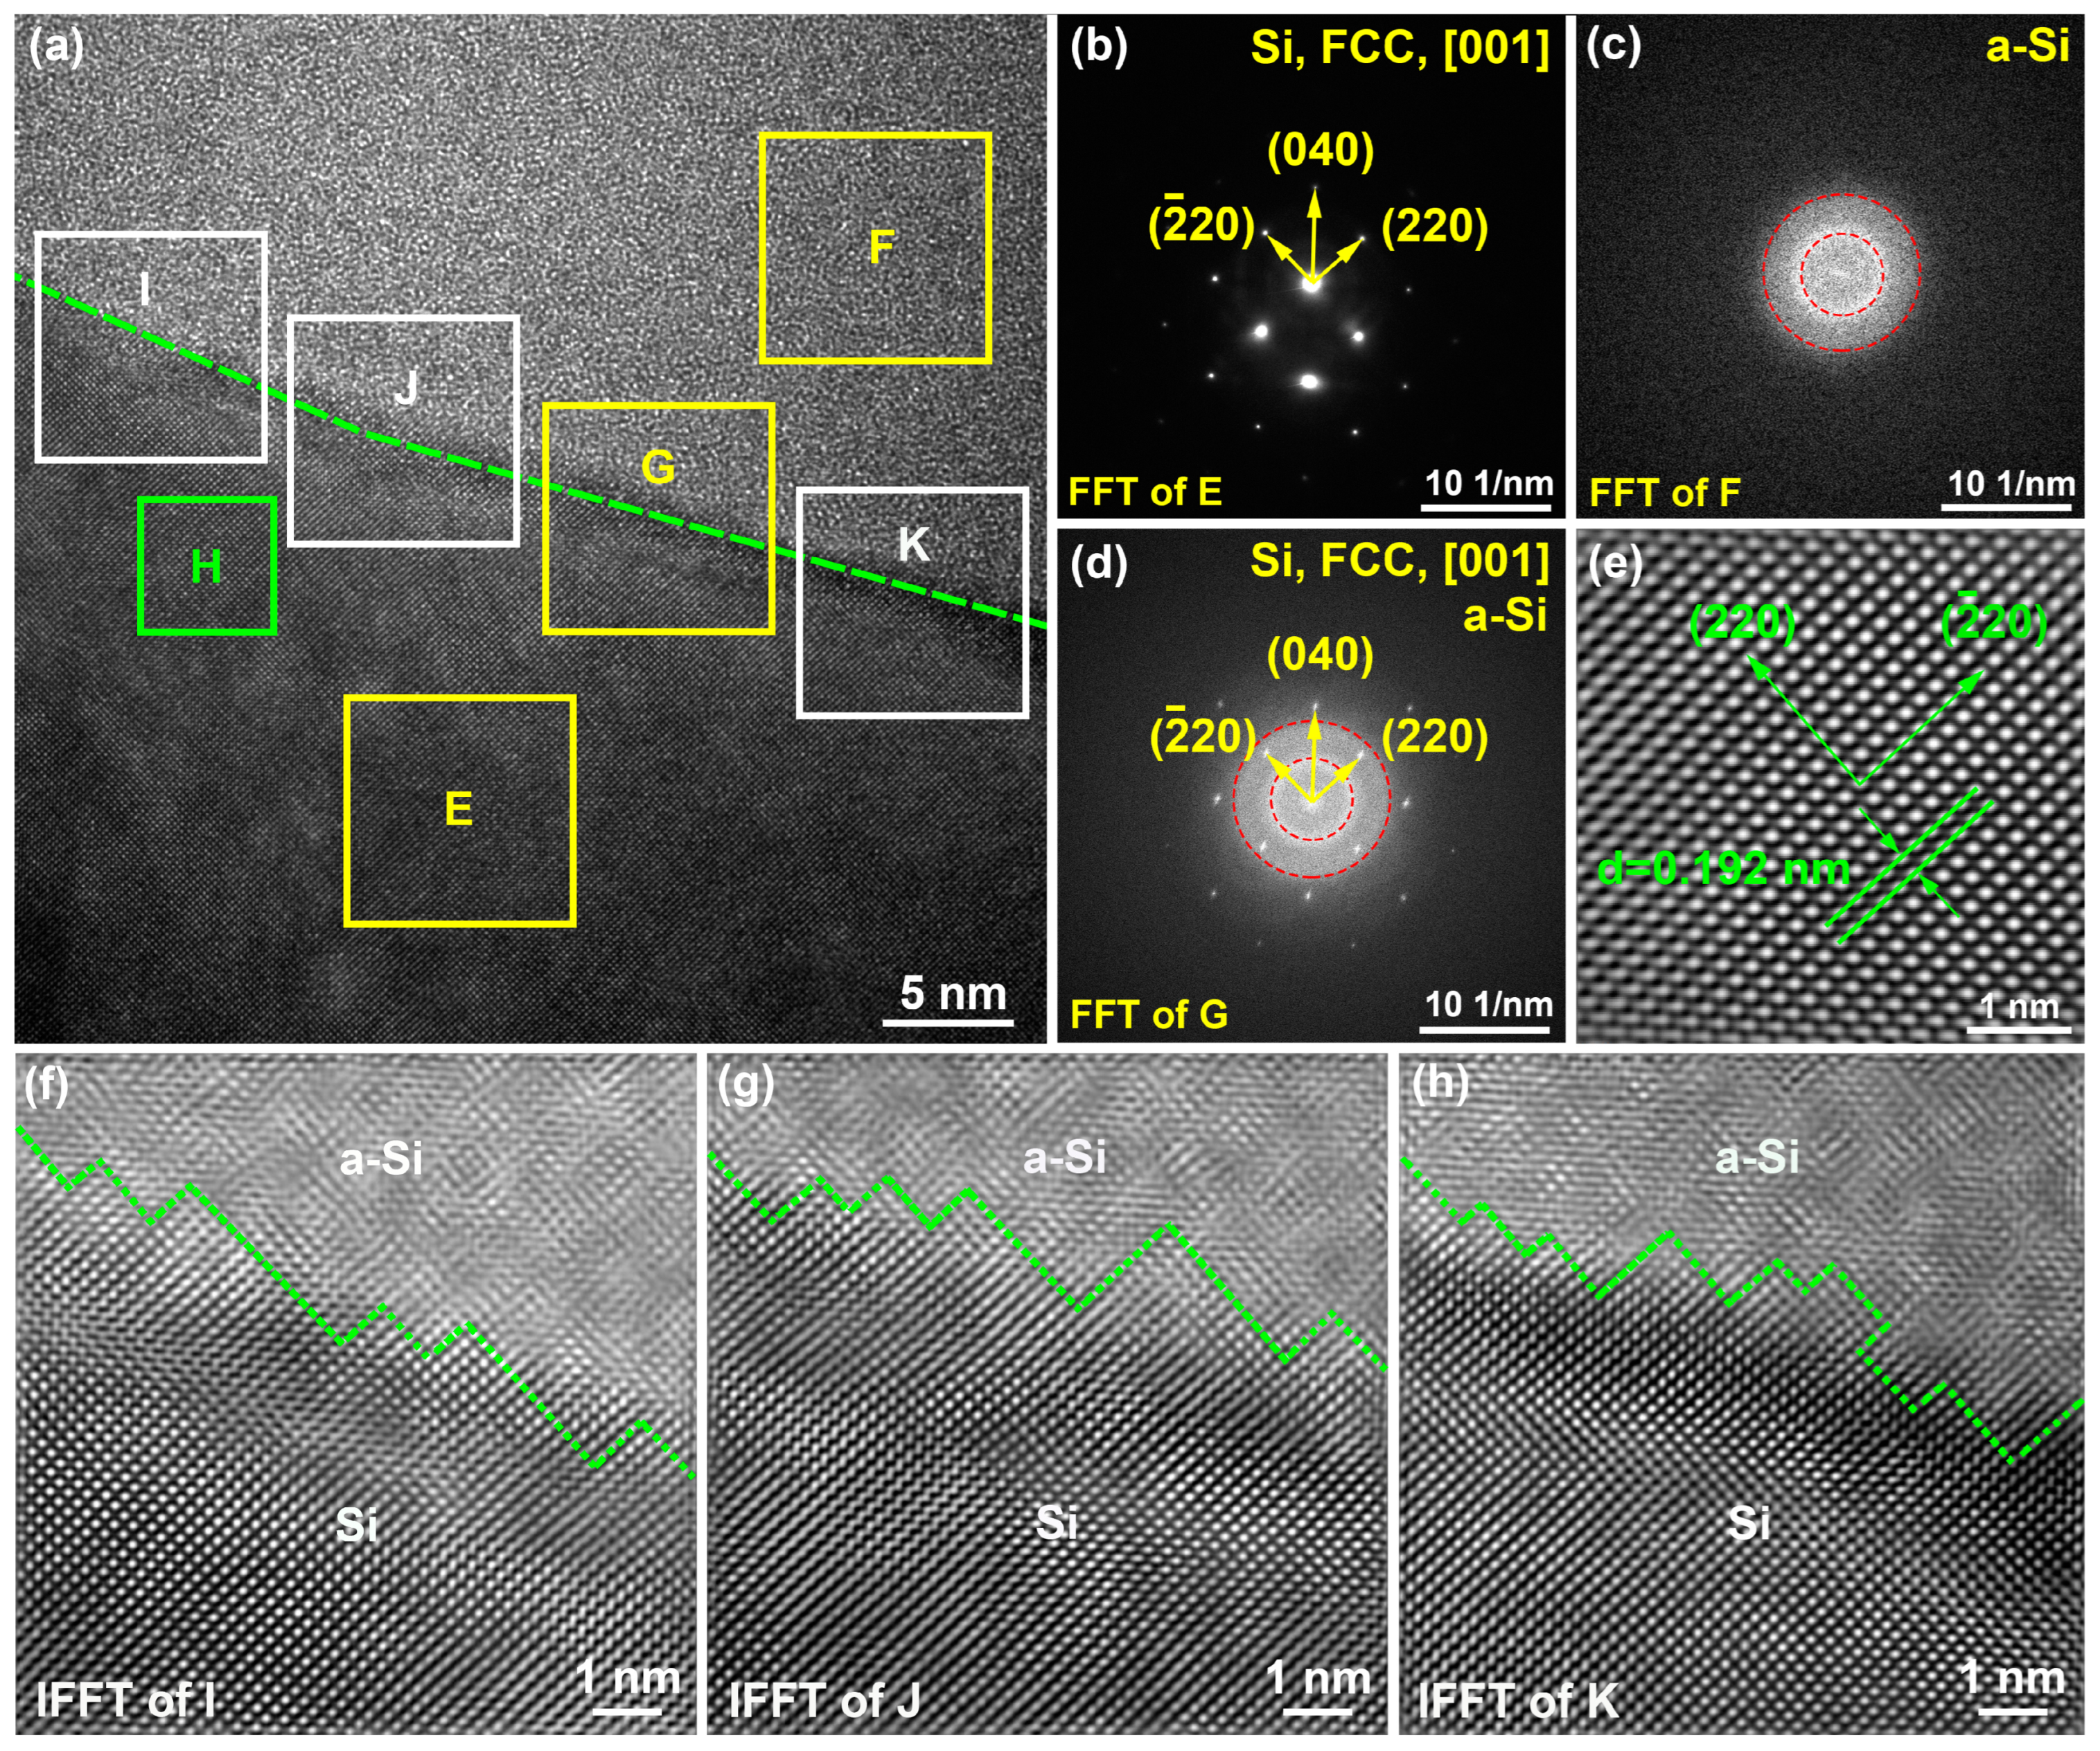
Fs laser-induced phase transitions involving the crystal structure of Si are evidently presented at the atomic scale using HRTEM. Figure 6a displays the HRTEM image of the transition region (orange square) in Figure 5f. Figure 6b–d present the detailed FFT images of the regions E, F, and G, respectively, confirming the existence of Si and a-Si in the transition layer. Moreover, the detailed IFFT image in Figure 6e illustrates that region H maintains a perfect face-centered cubic (FCC) structure, that is to say, the unaffected Si layer remains its initial structure and was not affected by the fs laser. Figure 6f–h indicate the IFFT images of the regions I-K in Figure 6a. It is seen that the a-Si layer is located above the boundary line (green dash line), exhibiting typical short-range order and long-range disordered amorphous characteristics. In contrast, the Si region below the boundary line was not affected by the fs laser, which was consistent with Figure 6e. In particular, defects such as dislocations and stacking faults are not observed at the Si/a-Si interface, indicating that the relatively smooth interface ensures the tight connection between the crystal Si and a-Si layers during the LIPSS formation, which is consistent with the previous study [43].
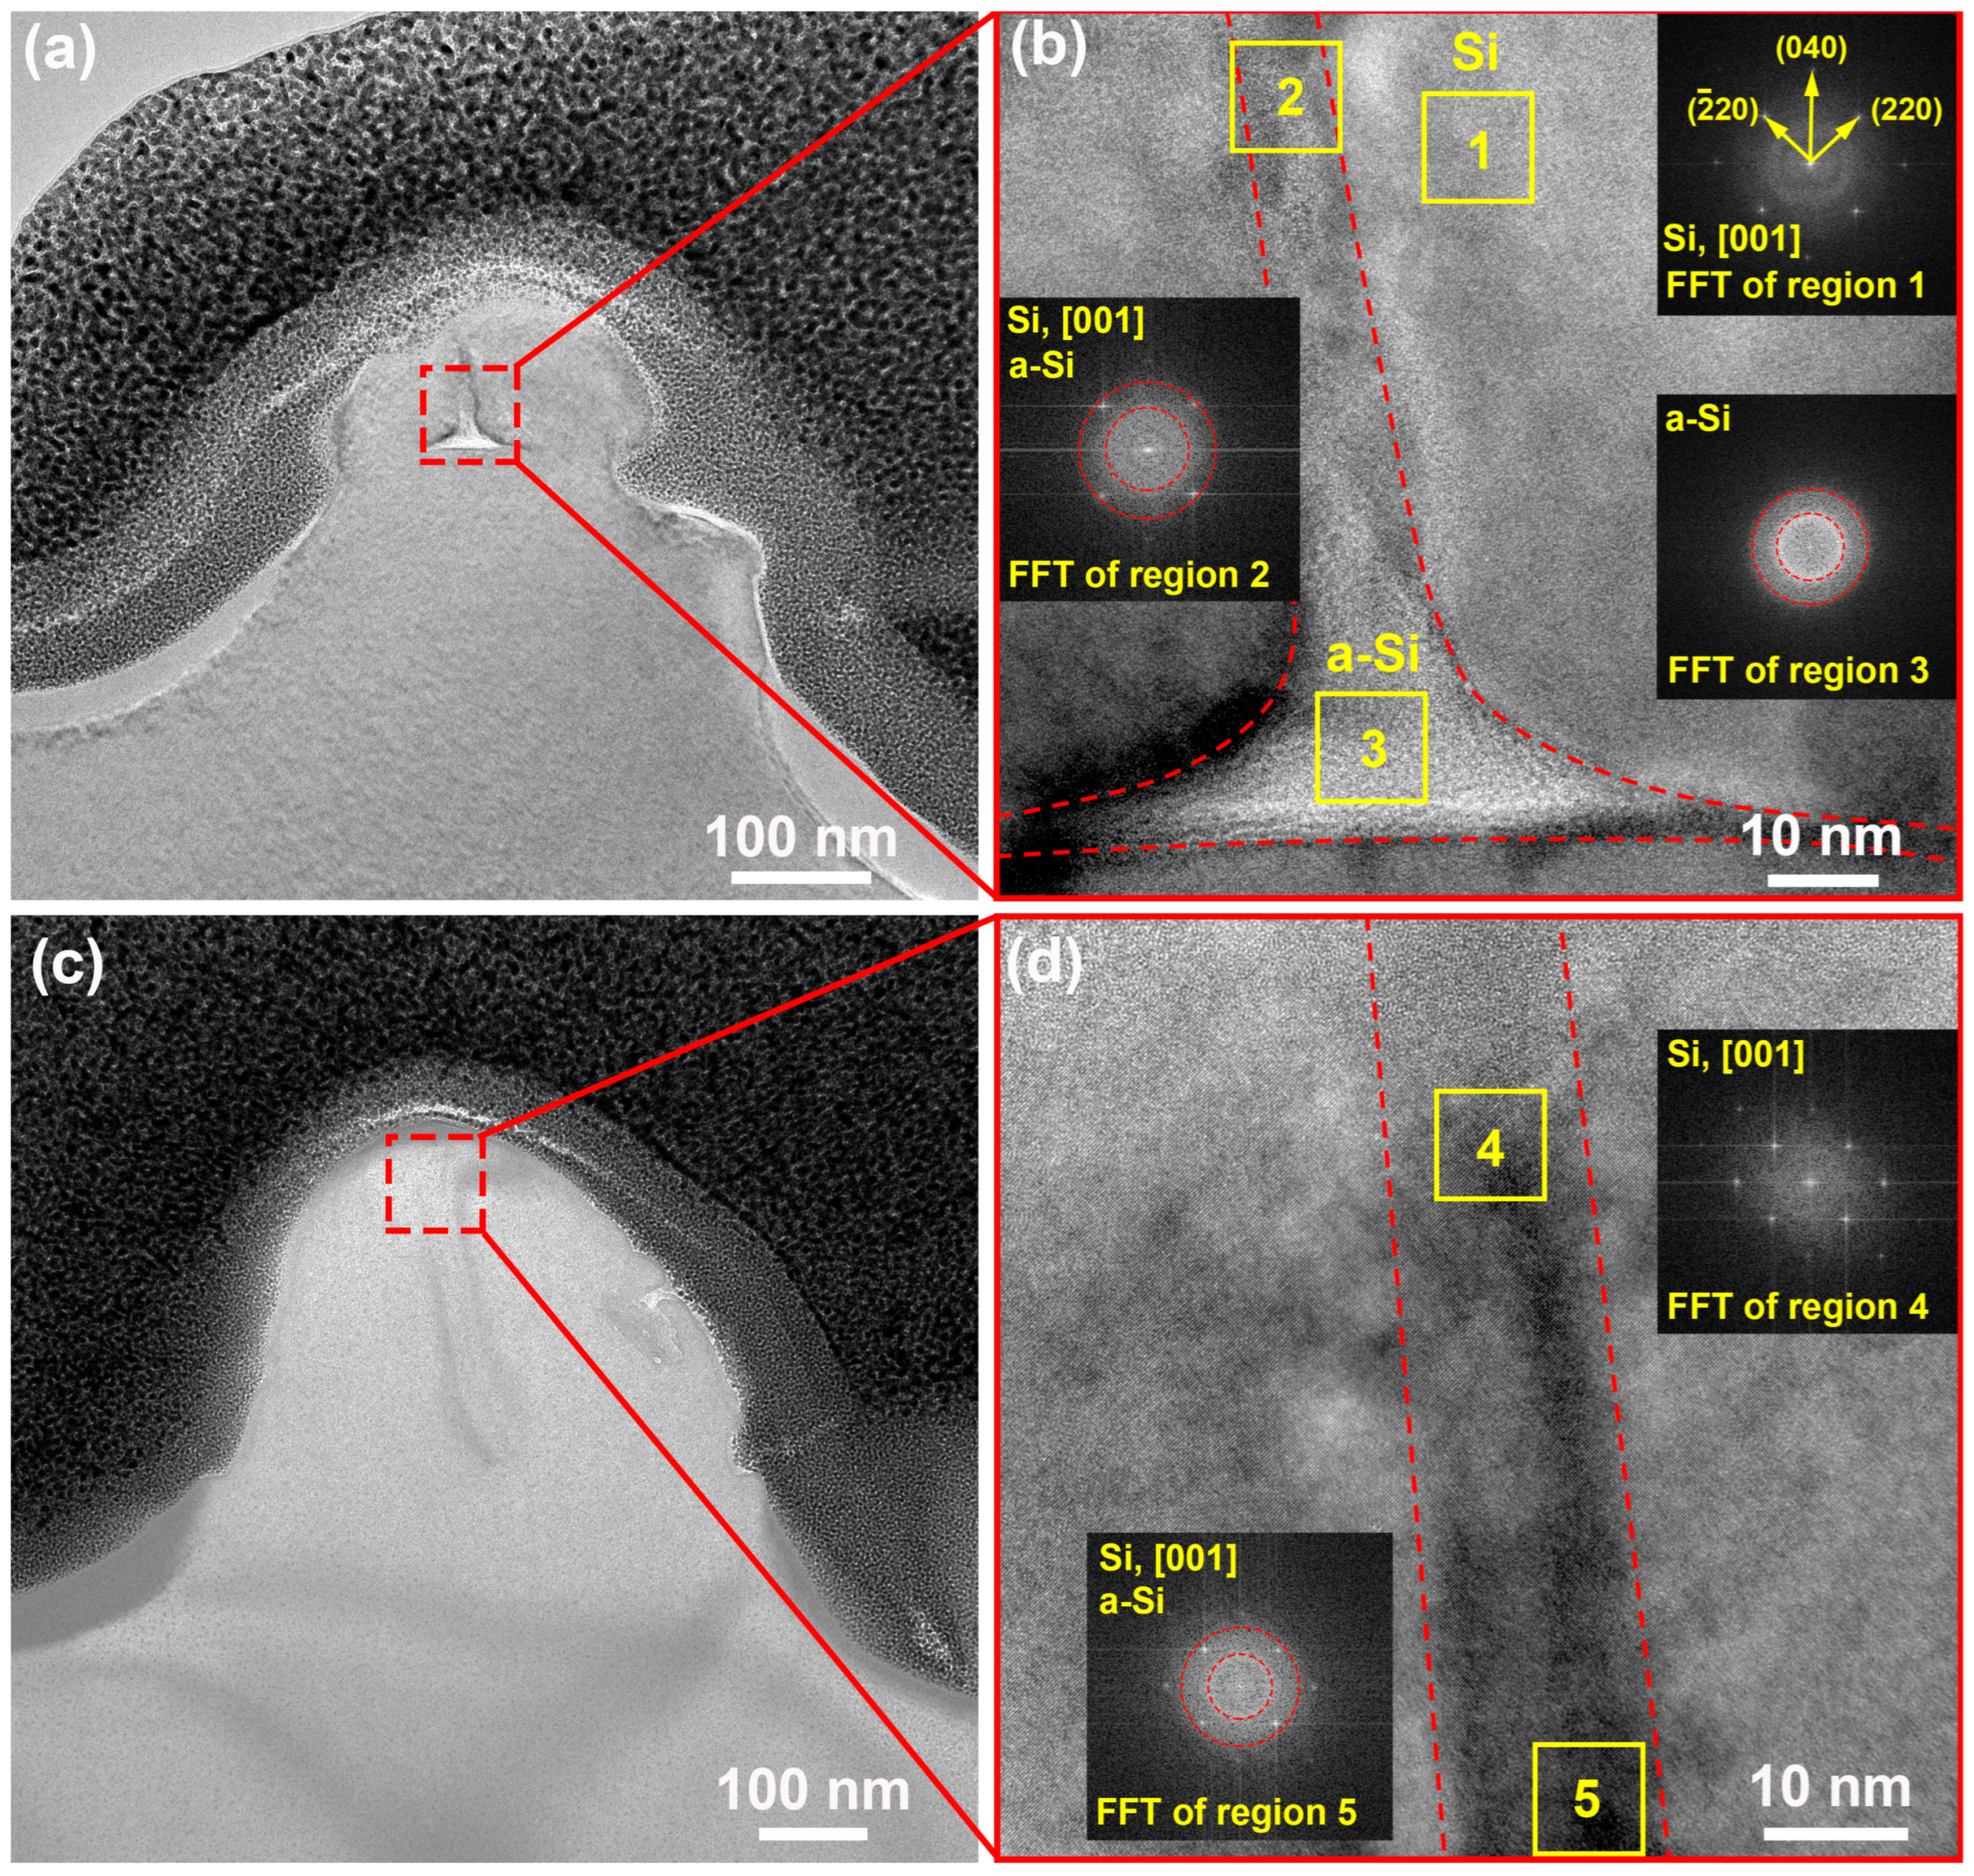
The formation of surface structure induced by fs laser processing is commonly accompanied by a series of phase transitions on the subsurface of the materials [44,45]. To further analyze the phase transition of the subsurface layer of the LIPSS, HRTEM analysis was performed on the purple square 1 in Figure 5a. The amorphous transition phenomenon in the subsurface layer near the left peak of the LIPSS was also observed. Figure 7a shows the bright field image of the purple dashed square 1 in Figure 5a, indicating that an inverted “T”-shaped region was generated at about 100 nm beneath the peak. The HRTEM image in Figure 7b, referring to the red dashed square in Figure 7a, represents the a-Si region. Moreover, the detailed FFT images corresponding to regions 1, 2, and 3 indicate that the amorphous region exhibits an increasing degree of atomic disorder from the peak to bottom regions, reflecting the gradual increase in the degree of amorphization. The bright-field image in Figure 7c exhibits a similar amorphous region corresponding to the purple dashed square 2 in Figure 5a. According to the detailed FFT images of regions 4 and 5 in Figure 7d, the structure of this region is similar to the a-Si region shown in Figure 7a, i.e., the amorphization becomes evidently from the upper region to the lower region.
The previous report has demonstrated the ability of fs laser to induce the amorphous top layer on Si with thicknesses on the order of several 10 nm [46]. Moreover, the coherent superposition of incident fs laser can promote periodic localized melting and amorphization processes of Si, as well as enhance energy deposition [40]. Meanwhile, a moving fs laser can induce LIPSS based on nonthermal melting and rapid solidification amorphization of Si depending on the free electron density. Unlike existing reports, single-pulse processing was used in this study, and the amorphization of Si was achieved by an extreme nonequilibrium process caused by fs laser irradiation. The laser photons transferred energy to electrons within 450 fs, resulting in a dramatic increase in the free carrier density. Subsequently, the electrons and the lattice gradually increased the lattice temperature within 6 ps through the coupling effect. During this period, the periodic oscillating energy field ablation formed by the interference of SPP and incident fs laser leads to the formation of the LIPSS. Finally, the a-Si layer is formed on the LIPSS surface due to the ultrafast solidification effect [47,48]. Nevertheless, the formation mechanism of the a-Si region located in the subsurface of the LIPSS is different from that of the a-Si layer on the LIPSS surface. Fs laser irradiation could trigger the required pressure to drive the phase transition of Si [49,50]. Firstly, the Si lattice is heated up in an extremely short time, and a thermoelastic pressure generates during the fs laser irradiation process. Then, the Si layer is completely gasified and rapidly expanded when the absorbed energy reaches the ablation threshold. The plasma expansion drives the recoil shock wave into the Si substrate. Finally, the residual stress is generated within the remelted Si after fs laser irradiation [51,52]. In addition, the volume expansion of the thin molten layer produces tensile stress at the bottom of the groove and compressive stress at the sides [53]. According to Figure 7, the a-Si region is only formed at the center of the protruding peak, indicating that the pressure generated on the surface is not uniform. This region is expected to be in a compressed state. Moreover, Figure 5a shows that the tips of the peaks on both sides of the LIPSS are also covered with an a-Si layer, indicating an intermediate state of a-Si during the formation of the LIPSS. Therefore, the pressure-induced phase transition of the a-Si region formed in the subsurface of the LIPSS is driven by the solidification-induced stress [54,55].
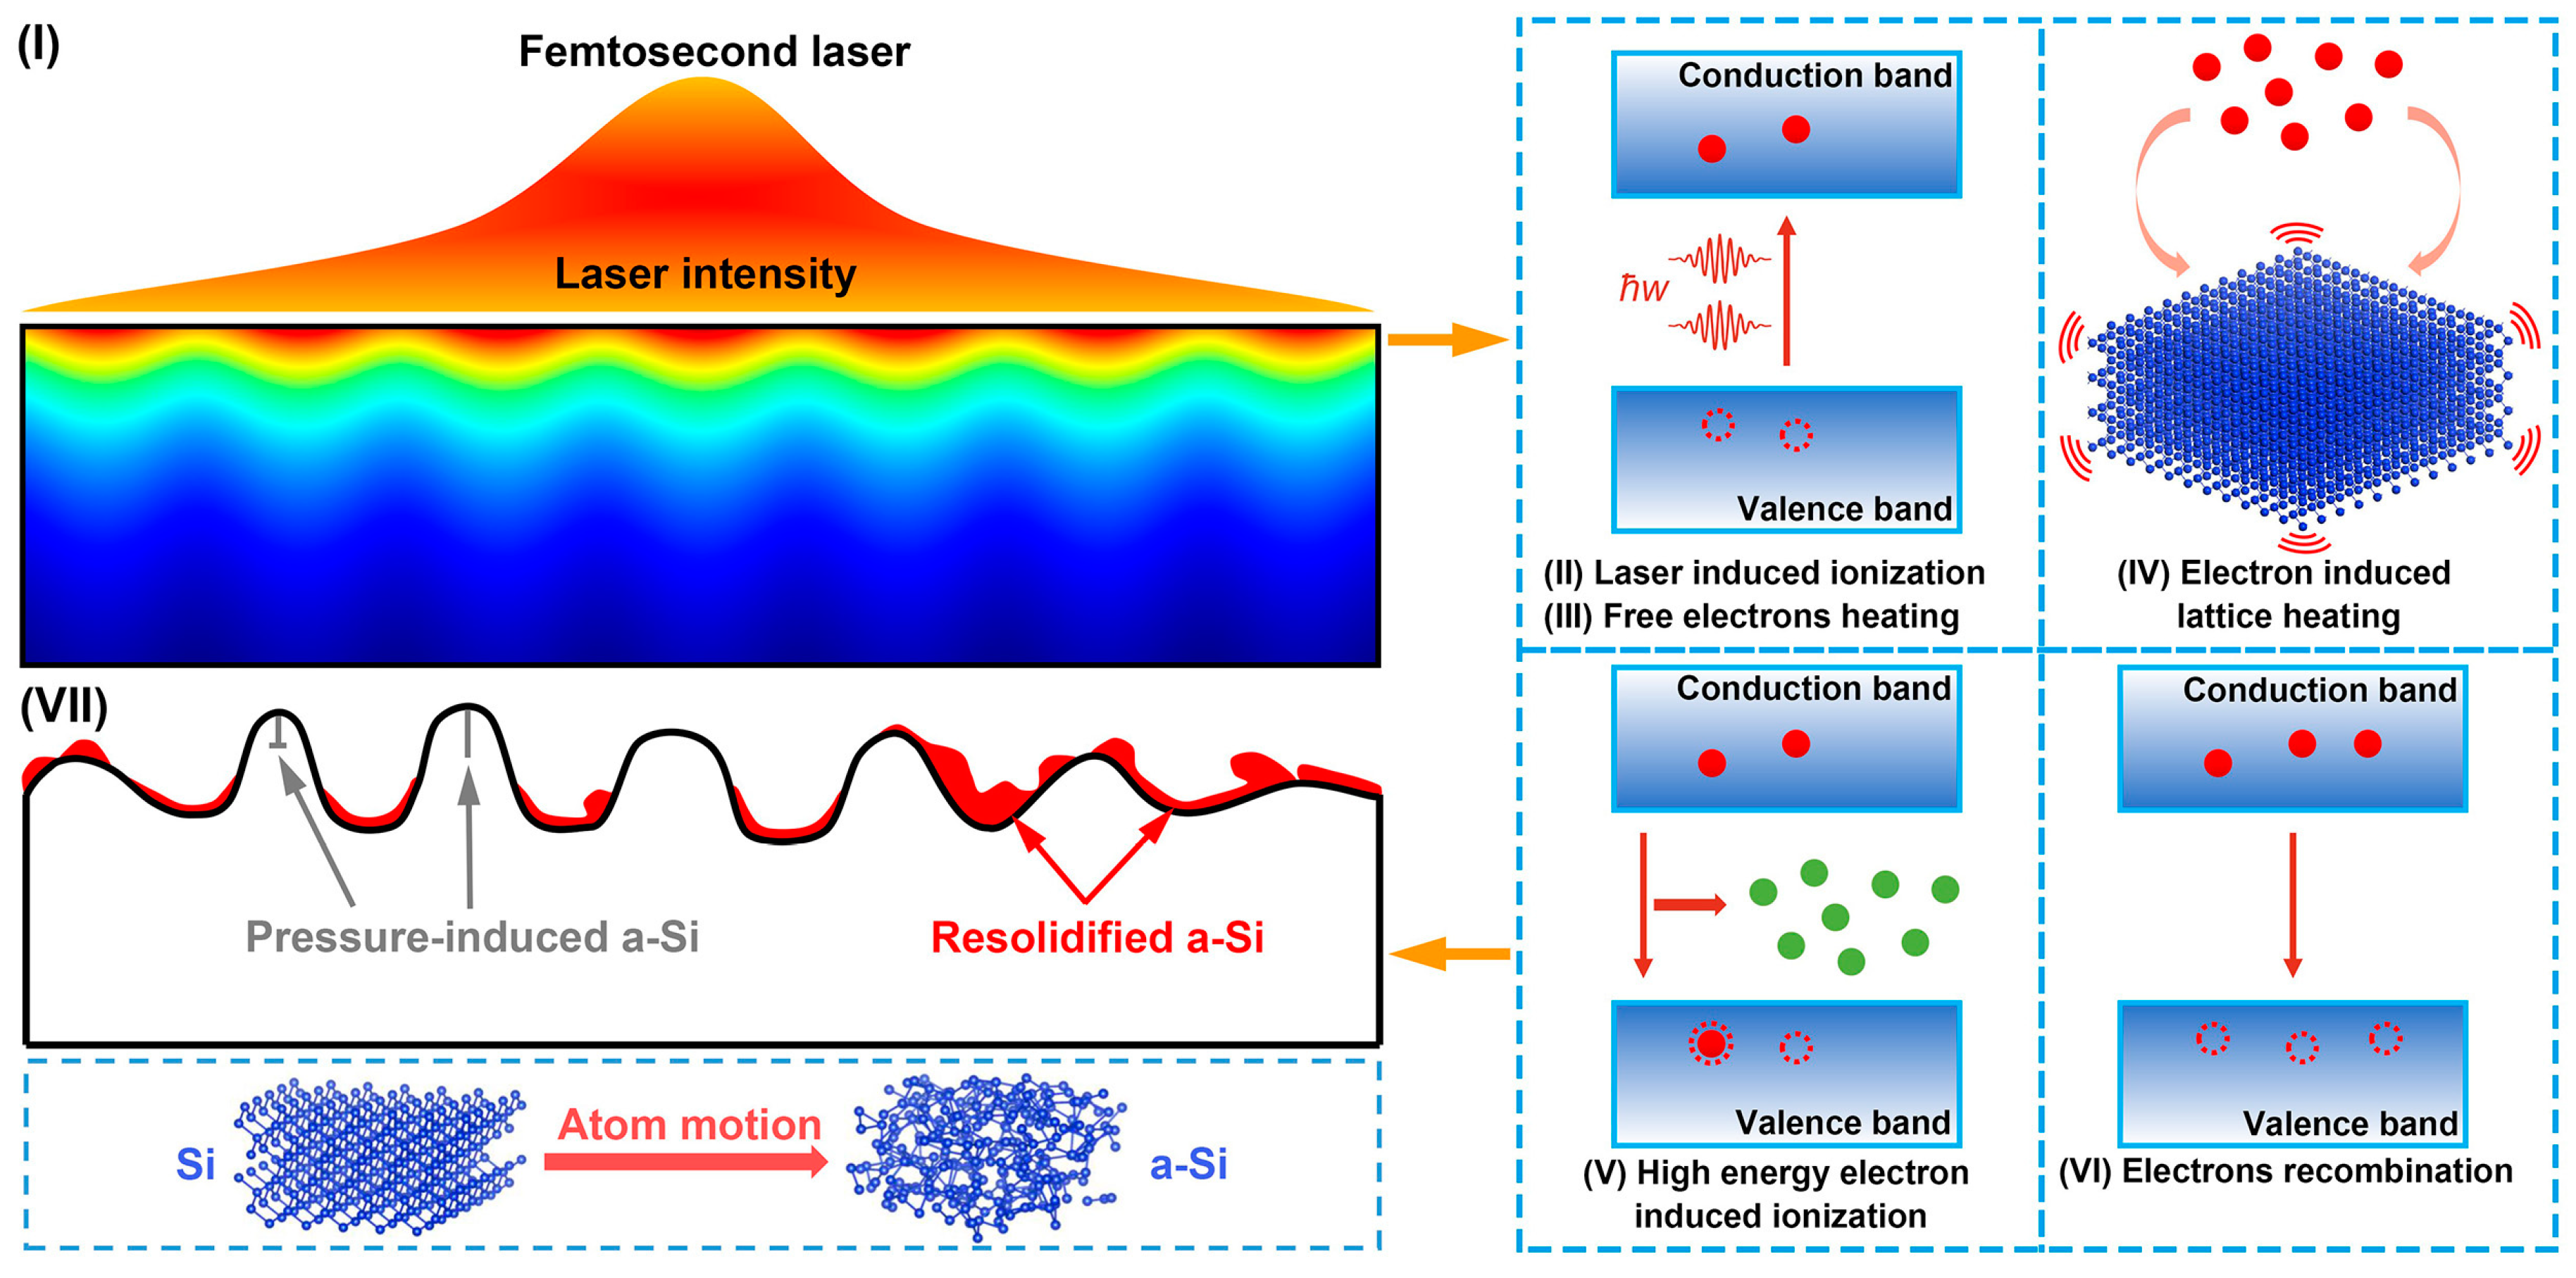
Based on the experimental and simulated results, a model for electron and lattice dynamics interactions during LIPSS formation is proposed, as displayed in Figure 8. The interaction process between fs laser and Si can be described as follows:
[I] The periodic distribution of incident fs laser energy in space;
[II] Laser-induced ionization: nonlinear ionization of electrons was excited by fs laser, involving single-photon and two-photon absorption;
[III] Free electron heating: inverse bremsstrahlung-induced in-band heating transfers energy to free electrons;
[IV] Electron-lattice coupling effect induced lattice heating: energy transfer from free electrons to the lattice to cause lattice instability and increase lattice temperature to achieve thermal melting [56];
[V] Electron-induced ionization: free electrons with high kinetic energy in the CB collide with bound electrons, resulting in ionizing multiple free electrons;
[VI] Recombination of holes and electrons in the VB;
[VII] LIPSS formation and amorphization: the periodic oscillation energy field ablation formed by the interference of SPP and incident laser leads to the LIPSS formation. The a-Si layer is formed by ultrafast nonequilibrium solidification, and the solidification-induced stress drives the generation of subsurface amorphization.

5. Conclusions

In summary, the electron (lattice) dynamics and micro-nano structure of Si under fs laser irradiation have been deeply studied from the aspects of numerical simulations and experiments in this work. The main conclusions are as follows.
(1) The modulation of laser energy results in the periodic distribution of electron (lattice) and micro-nano structure. The carrier density affects the optical properties of Si during laser irradiation.
(2) Three distinct layers were found in the LIPSS: an amorphous silicon layer, a transition layer, and an unaffected Si layer. The a-Si layer is located on the surface, and the atomic structure is characterized by short-range order and long-range disorder. The unaffected Si layer is not affected by the laser irradiation and maintains the initial perfect FCC structure. The transition layer is a mixed region of the a-Si and unaffected Si layers.
(3) The a-Si layer on the LIPSS surface is generated by ultrafast solidification, while the a-Si region on the LIPSS subsurface is caused by the stress induced by the solidification of molten Si.
This study provides a new perspective for investigating fs laser processing of Si and provides guidance for the preparation of semiconductor surface micro-nano structures and sub-surface structure analysis. Furthermore, beyond the case of a single laser pulse processing, it is valuable to extend to a detailed microscopic investigation of multi-point induced effects.

Author Contributions

Y.L.: Methodology, Investigation, Formal analysis, Writing—Original Draft, Writing—Review and Editing. Y.D.: Writing—Review and Editing, Supervision, Project Administration. J.X.: Writing—Review and Editing, Software. M.C.: Supervision, Writing—Review and Editing. L.Y.: Supervision, Writing—Review and Editing, Resources, Funding Acquisition, Project administration. X.L.: Writing—Review and Editing, Funding Acquisition. J.Y.: Writing—Review and Editing, Funding Acquisition. All authors have read and agreed to the published version of the manuscript.

Funding

This research was funded by [National Natural Science Foundation of China] grant number [52105437], [Shanghai Aerospace Science and Technology Innovation Fund] grant number [SAST2021-067], and [Open Fund of Xinchang Research Institute of Zhejiang University of Technology] grant number [No. 204001].

Institutional Review Board Statement

Not applicable.

Informed Consent Statement

Not applicable.

Data Availability Statement

Data available on request due to restrictions eg privacy or ethical.

Conflicts of Interest

The authors declare no conflict of interest.

References

  1. Akinwande, D.; Huyghebaert, C.; Wang, C.-H.; Serna, M.I.; Goossens, S.; Li, L.-J.; Wong, H.S.P.; Koppens, F.H.L. Graphene and two-dimensional materials for silicon technology. Nature 2019, 573, 507–518. [Google Scholar] [CrossRef] [PubMed]
  2. Kumar, K.; Lee, K.; Herman, P.R.; Nogami, J.; Kherani, N.P. Femtosecond laser direct hard mask writing for selective facile micron-scale inverted-pyramid patterning of silicon. Appl. Phys. Lett. 2012, 101, 222106. [Google Scholar] [CrossRef]
  3. Randall, J.; Lyding, J.; Schmucker, S.; Ehr, J.; Ballard, J.; Saini, R.; Xu, H.; Ding, Y. Atomic precision lithography on Si. J. Vac. Sci. Technol. B Microelectron. Nanometer Struct. 2009, 27, 2764–2768. [Google Scholar] [CrossRef]
  4. Hung, N.P.; Fu, Y.Q.; Ali, M.Y. Focused ion beam machining of silicon. J. Mater. Process. Technol. 2002, 127, 256–260. [Google Scholar] [CrossRef]
  5. Gattass, R.R.; Mazur, E. Femtosecond laser micromachining in transparent materials. Nat. Photonics 2008, 2, 219–225. [Google Scholar] [CrossRef]
  6. Bisht, A.; Kalsar, R.; Adak, A.; Dey, I.; Jana, K.; Lad, A.; Kumar, G.R.; Jagadeesh, G.; Suwas, S. Observation of ex-situ microstructure relaxation of non-conventional misorientations post femtosecond laser shock exposure in cp-Ti. Acta Mater. 2018, 150, 161–172. [Google Scholar] [CrossRef]
  7. Mahdieh, M.H.; Gharibzadeh, M. 3-Dimensional simulation and footprint of optical breakdown in dielectrics induced by femtosecond laser pulse. Opt. Laser Technol. 2012, 44, 1713–1721. [Google Scholar] [CrossRef]
  8. Yong, J.; Bai, X.; Yang, Q.; Hou, X.; Chen, F. Filtration and removal of liquid polymers from water (polymer/water separation) by use of the underwater superpolymphobic mesh produced with a femtosecond laser. J. Colloid Interface Sci. 2021, 582, 1203–1212. [Google Scholar] [CrossRef]
  9. Chen, Y.; Cao, Y.; Wang, Y.; Zhang, L.; Shao, G.; Zi, J. Fabrication of grooves on polymer-derived SiAlCN ceramics using femtosecond laser pulses. Ceram. Int. 2020, 46, 11747–11761. [Google Scholar] [CrossRef]
  10. Sun, T.; Huo, J.; Xiao, Y.; Liu, L.; Feng, B.; Zhai, X.; Wang, W.; Zou, G. Atomic Bonding-Engineered Heterogeneous Integration of Semiconductor Nanowires by Femtosecond Laser Irradiation for a Miniaturized Photodetector. Appl. Surf. Sci. 2021, 575, 151709. [Google Scholar] [CrossRef]
  11. Okano, K.; Hsu, H.-Y.; Li, Y.-K.; Masuhara, H. In situ patterning and controlling living cells by utilizing femtosecond laser. J. Photochem. Photobiol. C Photochem. Rev. 2016, 28, 1–28. [Google Scholar] [CrossRef]
  12. Ali, B.; Litvinyuk, I.V.; Rybachuk, M. Femtosecond laser micromachining of diamond: Current research status, applications and challenges. Carbon 2021, 179, 209–226. [Google Scholar] [CrossRef]
  13. Huang, M.; Zhao, F.; Cheng, Y.; Xu, N.; Xu, Z. Origin of Laser-Induced Near-Subwavelength Ripples: Interference between Surface Plasmons and Incident Laser. ACS Nano 2009, 3, 4062–4070. [Google Scholar] [CrossRef] [PubMed]
  14. Stephan, G.F.; Clemens, K.; Sebastian, E.; Thibault, D.; Frank, M. Femtosecond Laser-Induced Periodic Surface Structures on Fused Silica: The Impact of the Initial Substrate Temperature. Materials 2018, 11, 1340. [Google Scholar]
  15. Liang, F.; Vallée, R.; Chin, S.L. Mechanism of nanograting formation on the surface of fused silica. Opt. Express 2012, 20, 4389–4396. [Google Scholar] [CrossRef]
  16. Rebollar, E.; Castillejo, M.; Ezquerra, T.A. Laser induced periodic surface structures on polymer films: From fundamentals to applications. Eur. Polym. J. 2015, 73, 162–174. [Google Scholar] [CrossRef] [Green Version]
  17. Zhang, D.; Liu, R.; Li, Z. Irregular LIPSS produced on metals by single linearly polarized femtosecond laser. Int. J. Extrem. Manuf. 2022, 4, 015102. [Google Scholar] [CrossRef]
  18. Sokolowski-Tinten, K.; Bonse, J.; Barty, A.; Chapman, H.; Bajt, S.; Bogan, M.; Boutet, S.; Cavalleri, A.; Düsterer, s.; Frank, M.; et al. In-situ observation of the formation of laser-induced periodic surface structures with extreme spatial and temporal resolution. arXiv 2022, arXiv:2206.04556. [Google Scholar]
  19. Driel, H.; Young, J.F.; Sipe, J.E. Laser Induced Periodic Surface Structure: An Experimental And Theoretical Review. Mrs Online Proc. Libr. Arch. 1982, 13, 302–318. [Google Scholar]
  20. Sipe, J.E.; Driel, H. Laser Induced Periodic Surface Structure: An Experimental And Theoretical Review. In Proceedings of the Trends in Quantum Electronics, Bucharest, Romania, 29 August–3 September 1989. [Google Scholar]
  21. Bonse, J.; Rosenfeld, A.; Krüger, J. Implications of transient changes of optical and surface properties of solids during femtosecond laser pulse irradiation to the formation of laser-induced periodic surface structures. Appl. Surf. Sci. 2011, 257, 5420–5423. [Google Scholar] [CrossRef]
  22. Zhang, D.; Ranjan, B.; Tanaka, T.; Sugioka, K. Carbonized Hybrid Micro/Nanostructured Metasurfaces Produced by Femtosecond Laser Ablation in Organic Solvents for Biomimetic Antireflective Surfaces. ACS Appl. Nano Mater. 2020, 3, 1855–1871. [Google Scholar] [CrossRef] [Green Version]
  23. Tsibidis, G.D.; Skoulas, E.; Papadopoulos, A.; Stratakis, E. Convection roll-driven generation of supra-wavelength periodic surface structures on dielectrics upon irradiation with femtosecond pulsed lasers. Phys. Rev. B 2016, 94, 081305. [Google Scholar] [CrossRef] [Green Version]
  24. Zhang, D.S.; Li, X.Z.; Fu, Y.; Yao, Q.H.; Li, Z.G. Koji Sugioka Liquid vortexes and flows induced by femtosecond laser ablation in liquid governing formation of circular and crisscross LIPSS. Opto Electron. Adv. 2022, 5, 210066. [Google Scholar] [CrossRef]
  25. Abou Saleh, A. Relationship between Selforganization and Creation/Resorption of Microstructural Defects under Ultrashort Laser Irradiation. Ph.D. Thesis, University Jean Monnet, Lyon, France, 2020. [Google Scholar]
  26. Rapp, L.; Haberl, B.; Pickard, C.J.; Bradby, J.E.; Gamaly, E.G.; Williams, J.S.; Rode, A.V. Experimental evidence of new tetragonal polymorphs of silicon formed through ultrafast laser-induced confined microexplosion. Nat. Commun. 2015, 6, 7555. [Google Scholar] [CrossRef] [Green Version]
  27. Tan, D.; Sharafudeen, K.N.; Yue, Y.; Qiu, J. Femtosecond laser induced phenomena in transparent solid materials: Fundamentals and applications. Prog. Mater. Sci. 2016, 76, 154–228. [Google Scholar] [CrossRef]
  28. Bonse, J.; Grf, S. Maxwell Meets Marangoni—A Review of Theories on Laser—Induced Periodic Surface Structures. Laser Photonics Rev. 2020, 14, 2000215. [Google Scholar] [CrossRef]
  29. Juodkazis, S.; Nishimura, K.; Tanaka, S.; Misawa, H.; Gamaly, E.G.; Luther-Davies, B.; Hallo, L.; Nicolai, P.; Tikhonchuk, V.T. Laser-Induced Microexplosion Confined in the Bulk of a Sapphire Crystal: Evidence of Multimegabar Pressures. Phys. Rev. Lett. 2006, 96, 166101. [Google Scholar] [CrossRef] [PubMed] [Green Version]
  30. Gamaly, E.G.; Rapp, L.; Roppo, V.; Juodkazis, S.; Rode, A.V. Generation of high energy density by fs-laser-induced confined microexplosion. New J. Phys. 2013, 15, 025018. [Google Scholar] [CrossRef]
  31. Zhao, J.H.; Li, X.B.; Chen, Q.D.; Chen, Z.G.; Sun, H.B. Ultrafast laser induced black silicon, from micro-nanostructuring, infrared absorption mechanism, to high performance detecting devices. Mater. Today Nano 2020, 11, 100078. [Google Scholar] [CrossRef]
  32. Levy, Y.; Derrien, T.J.Y.; Bulgakova, N.M.; Gurevich, E.L.; Mocek, T. Relaxation dynamics of femtosecond-laser-induced temperature modulation on the surfaces of metals and semiconductors. Appl. Surf. Sci. 2016, 374, 157–164. [Google Scholar] [CrossRef]
  33. Tsibidis, G.D.; Barberoglou, M.; Loukakos, P.A.; Stratakis, E.; Fotakis, C. Dynamics of ripple formation on silicon surfaces by ultrashort laser pulses in sub-ablation conditions. arXiv 2011, arXiv:1109.2568. [Google Scholar]
  34. Tsibidis, G.D.; Stratakis, E. Ripple formation on silver after irradiation with radially polarised ultrashort-pulsed lasers. J. Appl. Phys. 2017, 121, 163106. [Google Scholar] [CrossRef]
  35. Anisimov, S.I.; Kapeliovich, B.L.; Perel’Man, T.L. Electron emission from metal surface exposed to ultrashort laser pulses. Sov. J. Exp. Theor. Phys. 1974, 39, 375–377. [Google Scholar]
  36. Bulgakova, N.M.; Stoian, R.; Rosenfeld, A.; Marine, W.; Campbell, E.E.B. A general continuum approach to describe fast electronic transport in pulsed laser irradiated materials: The problem of Coulomb explosion. Int. Soc. Opt. Photonics 2005, 81, 345–356. [Google Scholar] [CrossRef]
  37. Sipe, J.E.; Young, J.F.; Preston, J.S.; van Driel, H.M. Laser-induced periodic surface structure. I. Theory. Phys. Rev. B 1983, 27, 1141–1154. [Google Scholar] [CrossRef]
  38. Bäuerle, D. Laser Processing and Chemistry; Springer: Berlin/Heidelberg, Germany, 2011. [Google Scholar]
  39. Sokolowski-Tinten, K.; von der Linde, D. Generation of dense electron-hole plasmas in silicon. Phys. Rev. B 2000, 61, 2643–2650. [Google Scholar] [CrossRef] [Green Version]
  40. Colombier, J.-P.; Rudenko, A.; Silaeva, E.; Zhang, H.; Sedao, X.; Bévillon, E.; Reynaud, S.; Maurice, C.; Pigeon, F.; Garrelie, F.; et al. Mixing periodic topographies and structural patterns on silicon surfaces mediated by ultrafast photoexcited charge carriers. Phys. Rev. Res. 2020, 2, 043080. [Google Scholar] [CrossRef]
  41. Quiroga-González, E.; Carstensen, J.; Glynn, C.; O’Dwyer, C.; Föll, H. Pore size modulation in electrochemically etched macroporous p-type silicon monitored by FFT impedance spectroscopy and Raman scattering. Phys. Chem. Chem. Phys. Camb. R. Soc. Chem. 2014, 16, 255–263. [Google Scholar] [CrossRef]
  42. Miyazaki, K.; Miyaji, G. Periodic Nanostructure Formation on Silicon Irradiated with Multiple Low-fluence Femtosecond Laser Pulses in Water. Phys. Procedia 2012, 39, 674–682. [Google Scholar] [CrossRef] [Green Version]
  43. Izawa, Y.; Izawa, Y.; Setsuhara, Y.; Hashida, M.; Fujita, M.; Sasaki, R.; Nagai, H.; Yoshida, M. Ultrathin amorphous Si layer formation by femtosecond laser pulse irradiation. Applied Physics Letters 2007, 90, 044107. [Google Scholar] [CrossRef]
  44. Florian, C.; Fischer, D.; Freiberg, K.; Duwe, M.; Bonse, J. Single Femtosecond Laser-Pulse-Induced Superficial Amorphization and Re-Crystallization of Silicon. Materials 2021, 14, 1651. [Google Scholar] [CrossRef] [PubMed]
  45. Wen, C.; Yang, Y.J.; Ma, Y.J.; Shi, Z.Q.; Wang, Z.J.; Mo, J.; Li, T.C.; Li, X.H.; Hu, S.F.; Yang, W.B. Sulfur-hyperdoped silicon nanocrystalline layer prepared on polycrystalline silicon solar cell substrate by thin film deposition and nanosecond-pulsed laser irradiation. Appl. Surf. Sci. 2019, 476, 49–60. [Google Scholar] [CrossRef]
  46. Bonse, J.; Brzezinka, K.W.; Meixner, A.J. Modifying single-crystalline silicon by femtosecond laser pulses: An analysis by micro Raman spectroscopy, scanning laser microscopy and atomic force microscopy. Appl. Surf. Sci. 2004, 221, 215–230. [Google Scholar] [CrossRef]
  47. Crawford, T.; Yamanaka, J.; Botton, G.A.; Haugen, H.K. High-resolution observations of an amorphous layer and subsurface damage formed by femtosecond laser irradiation of silicon. J. Appl. Phys. 2008, 103, 215–453. [Google Scholar] [CrossRef]
  48. Schade, M.; Varlamova, O.; Reif, J.; Blumtritt, H.; Erfurth, W.; Leipner, H.S. High-resolution investigations of ripple structures formed by femtosecond laser irradiation of silicon. Anal. Bioanal. Chem. 2010, 396, 1905–1911. [Google Scholar] [CrossRef] [Green Version]
  49. Feng, Q.; Picard, Y.N.; Liu, H.; Yalisove, S.M.; Mourou, G.; Pollock, T.M. Femtosecond laser micromachining of a single-crystal superalloy. Scr. Mater. 2005, 53, 511–516. [Google Scholar] [CrossRef]
  50. Schoenfelder, S.; Bagdahn, J.; Baumann, S.; Kray, D.; Christiansen, S. Strength Characterization of Laser Diced Silicon for Application in Solar Industry. In Proceedings of the 21st European Photovoltaic Solar Energy Conference, Dresden, Germany, 4–8 September 2006. [Google Scholar]
  51. Amer, M.S.; Dosser, L.; LeClair, S.; Maguire, J.F. Induced stresses and structural changes in silicon wafers as a result of laser micro-machining. Appl. Surf. Sci. 2002, 187, 291–296. [Google Scholar] [CrossRef]
  52. Sokolowski-Tinten, K.; Bialkowski, J.; Cavalleri, A.; von der Linde, D.; Oparin, A.; Meyer-Ter-Vehn, J.; Anisimov, S. Transient States of Matter during Short Pulse Laser Ablation. Phys. Rev. Lett. 1998, 81, 224–227. [Google Scholar] [CrossRef] [Green Version]
  53. Borowiec, A.; Bruce, D.M.; Cassidy, D.T.; Haugen, H.K. Imaging the strain fields resulting from laser micromachining of semiconductors. Appl. Phys. Lett. 2003, 83, 225–227. [Google Scholar] [CrossRef]
  54. Smith, M.; Sher, M.-J.; Franta, B.; Lin, Y.-T.; Mazur, E.; Gradečak, S. The origins of pressure-induced phase transformations during the surface texturing of silicon using femtosecond laser irradiation. J. Appl. Phys. 2012, 112, 083518. [Google Scholar] [CrossRef]
  55. Smith, M.; Lin, Y.-T.; Sher, M.-J.; Winkler, M.; Mazur, E.; Gradečak, S. Pressure-induced phase transformations during femtosecond-laser doping of silicon. J. Appl. Phys. 2011, 110, 053524. [Google Scholar] [CrossRef]
  56. Cavalleri, A.; Sokolowski-Tinten, K.; Bialkowski, J.; Schreiner, M.; von der Linde, D. Femtosecond melting and ablation of semiconductors studied with time of flight mass spectroscopy. J. Appl. Phys. 1999, 85, 3301–3309. [Google Scholar] [CrossRef] [Green Version]
Figure 1. HRTEM image of [1] ZA of the pristine Si. The inset is the corresponding FFT image.
Materials 15 04897 g001
Figure 2. The evolution of the calculated (a) Te, (b) Tl, and (c) Ne at 6 ps.
Materials 15 04897 g002
Figure 3. (a) Calculated Te, Tl, and Ne as a function of time, the inset indicates details of the evolution of Te and Tl from 3 to 10 ps; (b) calculated the real part of the dielectric constant and reflectivity as a function of carrier density; (c) time dependence of the evolution of absorption coefficient; (d) wavelength period of SPP as a function of time.
Materials 15 04897 g003
Figure 4. (a) The SEM morphology of the LIPSS; Raman spectrum results of (b) unirradiated Si, and (c) LIPSS; (d) EDS map of the FIB lamella extracted from the yellow dashed line in (a).
Materials 15 04897 g004
Figure 5. TEM analysis of the LIPSS. (a) TEM bright-field image (red dashed lines indicate the a-Si region), numbers 1 and 2 represent regions of interest in Figure 7; (b) HAADF image of the region A in (a); (c) superposition of Si, O, and Pt elements; (g) HAADF image of region B in (a); (d,e) SAED patterns of regions C and D in (f); (g,h) EDS line scan analysis of the yellow line in (f).
Materials 15 04897 g005
Figure 6. HRTEM analysis of the transition layer of Figure 5f. (a) HRTEM image of the Si and a-Si interface; FFT images of regions (b) E, (c) F, and (d) G; (e) IFFT image of region H; IFFT images of regions (f) I, (g) J, and (h) K.
Materials 15 04897 g006
Figure 7. (a) Bright-field image of the purple dashed square 1 in Figure 5a; (b) HRTEM image of the red dashed square in (a); (c) bright-field image of the purple dashed square 2 in Figure 5a; (d) HRTEM image of the red dashed square in (c).
Materials 15 04897 g007
Figure 8. Scheme of electron and lattice dynamics interactions during LIPSS formation.
Materials 15 04897 g008
Table 1. The parameters used in the simulation [32].
SymbolNomenclatureValuesUnite
CAAuger recombination coefficient3.8 × 10−43m6/s
CeElectron specific heat capacity3kBNeJ/(m3·K)
ClLattice specific heat capacity 1.978 × 10 6 + 3.54 × 10 2 T l 3.68 × 10 6 T l 2 W/(m·K)
cLight speed3 × 108m/s
eElectric charge1.6 × 10−19C
E0Bandgap energy 1.16 7.02 × 10 4 T l 2 / ( T l + 1108 ) 1.5 × 10 8 N e 1 / 3 eV
JeElectron generation ψ 1 I ħ ω + ψ 2 I 2 2 ħ ω + δ N e (m3·s)−1
keElectronic thermal conductivity 2 k B 2 μ e N e T e / e W/(m·K)
klElectronic thermal conductivity 1.585 × 10 5 T l 1.23 J/(m3·K)
m*Effective optical mass1.64 × 10−31kg
NtThreshold density for electron-photon coupling6.02 × 1026m−3
N0Total valance band density2 × 1029m−3
n0Atomic density of Si5 × 1028m−3
PeAuger recombination N e / ( τ m + ( C A N e 2 ) 1 ) m−3
tpPulse duration300fs
μeCarrier mobility e / ( m * ν ) m2·V−1·s−1
ν Carrier collision frequency7.87 × 1014Hz
λWavelength1030nm
ω Laser angular frequency2πc/λs−1
ω p Plasma frequency N e e 2 / m * ε 0 s−1
ϒ Energy coupling rate between electron and lattice C e / τ γ W/(m3·K)
τ γ Electron-photon coupling time τ γ 0 [ 1 + ( N e / N t ) 2 ] s
τ γ 0 Minimum electron-photon coupling time2.4 × 10−13s
τ m Minimum Auger recombination time6 × 10−12s
ξ Modulation amplitude0.15-
ψ 1 One-photon absorption1.021 × 105m−1
ψ 2 Two-photon absorption1 × 10−10m/W
δ Impact ionization coefficient 3.6 × 10 10 exp ( 3 2 E 0 k B T e ) s−1
Publisher’s Note: MDPI stays neutral with regard to jurisdictional claims in published maps and institutional affiliations.