Article

Low-Pb High-Piezoelectric Ceramic System (1−x)Ba(Zr0.18Ti0.82)O3–x(Ba0.78Pb0.22)TiO3

MOE Key Laboratory for Nonequilibrium Synthesis and Modulation of Condensed Matter, School of Physics, Xi’an Jiaotong University, Xi’an 710049, China
*
Authors to whom correspondence should be addressed.
Materials 2022, 15(14), 4760; https://doi.org/10.3390/ma15144760
Submission received: 15 May 2022 / Revised: 23 June 2022 / Accepted: 29 June 2022 / Published: 7 July 2022

Abstract

:
Piezoelectric materials, especially Pb-based piezoelectric materials, are widely used in the key components of sensors, actuators, and transducers. Due to the rising concern of the toxicity of Pb, global legislation has been adopted to restrict the use of Pb. Given that the available Pb-free piezoelectric materials cannot replace the Pb-based ones for various reasons, we designed and fabricated a low-Pb piezoelectric solid-solution ceramic system, (1–x)Ba(Zr0.18Ti0.82)O3–x(Ba0.78Pb0.22)TiO3 (denoted as BZ0.18T–xBP0.22T herein). The crystal structure, ferroelectric, dielectric, and piezoelectric properties of the BZ0.18T–xBP0.22T system were systematically studied. With the increase in BP0.22T content, the structure of the samples changed from a rhombohedral phase to a tetragonal phase; the intermediate composition x = 0.5 was located at the morphotropic phase boundary of the system and corresponded to the state with the coexistence of the rhombohedral and tetragonal phases. Moreover, x = 0.5 exhibited the optimum comprehensive properties among all the samples, with a piezoelectric coefficient d33 of 240 pC/N, a maximum dielectric temperature Tm of 121.1°C, and a maximum polarization Pm of 15 μC/cm2. Our work verifies the validity of the route to design low-Pb high-piezoelectric materials and may stimulate the interests for exploring new low-Pb high-performance ferroelectric and piezoelectric materials.

1. Introduction

Piezoelectric materials can realize the conversion between elastic energy and electric energy; thus, they are widely used in actuators, sensors, and transducers [1]. Since the discovery of high piezoelectricity in Pb(Zr0.52Ti0.48)O3 (PZT) [2], Pb-based piezoelectric materials, i.e., Pb(Mg1/3Nb2/3)O3-PbTiO3 (PMN-PT) [3] and Pb(Zn1/3Nb2/3)O3-PbTiO3 (PZN-PT) [4], have accounted for the majority of the market share [5].
However, with the rising concern regarding the hazards for both human health and the environment caused by the toxic element Pb, the use of Pb in electronic devices is facing fierce circumstance and will be rigidly limited by laws and regulations, such as “Waste Electrical and Electronic Equipment” (WEEE) and “The Restriction of the use of certain Hazardous substances in Electrical and Electronic Equipment” (RoHS). In such a situation, high-performance Pb-free or low-Pb piezoelectric materials are highly desired. In the last two decades, many Pb-free piezoelectric materials have been introduced, such as (K0.5Na0.5)NbO3 (KNN) [6], (Bi1/2Na1/2)TiO3-BaTiO3 (BNT-BT) [7], Ba(Zr0.2Ti0.8)O3–x(Ba0.7Ca0.3)TiO3 (BZTBCT) [8], etc. Although much effort has been devoted to this task, it has to be admitted that all of the above-mentioned Pb-free materials face various problems; for example, the raw materials (K2CO3, Na2CO3) used to fabricate KNN are moisture-sensitive [9], the piezoelectricity of BNT-BT is inferior to most Pb-based materials [10], and the maximum dielectric temperature (Tm) is below 100°C (Tm of the optimum composition BZT-0.5BCT is 93°C) [8]. As a result, none of the above Pb-free materials can substitute for Pb-based ones.
Therefore, in the present study, we explore low-Pb high-piezoelectric materials as an alternative. As a comprehensive consideration, such a strategy will not only help people confront the situation of the strict limits on the use of Pb, it will also gain time for the exploration of Pb-free high-performance piezoelectric materials that can completely replace the Pb-based ones.
It has been well acknowledged that the design of morphotropic phase boundary (MPB) is an effective route to obtain high piezoelectricity [11]. At MPB, the coexistence of rhombohedral (R) and tetragonal (T) phases leads to the facilitated rotation and switching of polarization under external stress, thus yielding a high piezoelectric response [8,12]. The end members of such systems should meet the following criteria: (1) one end member undergoes the transition from the cubic (C) to T phase, while the other end member undergoes the transition from the C to R phase; (2) the two end members can form a solid-solution compound; then, a triple-point would exist [13]. We discovered that Zr-doped BaTiO3 [14] and Pb-doped BaTiO3 [15], satisfy the above requirements.
For the end member Zr-doped BaTiO3, i.e., Ba(ZrmTi1m)O3 (BZT), to ensure it satisfies the abovementioned criteria, m was fixed as 0.18. For the end member Pb-doped BaTiO3, i.e., (Ba1nPbn)TiO3 (BPT), the value of n should guarantee that the BPT undergoes one single transition from a cubic to a tetragonal phase. According to the phase diagram [15], when n exceeds 0.2, this occurs. Therefore, the value of n that satisfies the criterion is not unique and was selected as 0.22 in the present study. However, the value of n should not be too large, which would be contrary to our aim—“low Pb” content. Thus, based on the two end member compounds, we designed the low-Pb solid-solution system (1–x)Ba(Zr0.18Ti0.82)O3–x(Ba0.78Pb0.22)TiO3.

2. Materials and Methods

The (1–x)Ba(Zr0.18Ti0.82)O3–x(Ba0.78Pb0.22)TiO3 (denoted as BZ0.18T–xBP0.22T hereafter; x represents the mole fraction of (Ba0.78Pb0.22)TiO3) ceramic samples were prepared with the conventional solid-state reaction method, with the raw chemicals of BaCO3 (99.95%), ZrO2 (98%), TiO2 (99.9%), and PbO (99.9%). Considering that a Pb-induced nonstoichiometric compound usually leads to the formation of an oxygen vacancy [16], excess PbO (5 at%) was added to compensate for the loss of Pb. The calcining was performed at 1200°C in air for 2 h, and the sintering was performed at 1250°C in air for 3 h. The crystal structure was detected using an X-ray diffractometer (XRD, Bruker D8 ADVANCE, Hamburg, Germany). The temperature spectrum of dielectric permittivity was measured using an LCR meter (HIOKI-3532) at 10 kHz in a temperature chamber (Linkam), with the ramp rate of 2°C/min. The ferroelectric properties (Polarization-Electric field loops) were measured using a ferroelectric tester (Radiant Workstation Premier II, Albuquerque, NM, USA) at a frequency of 10 Hz at room temperature (22°C). The piezoelectric coefficient d33 was measured using a Berlincourt-type d33 meter (ZJ-3A). Before piezoelectric measurements, the ceramic samples were poled at 22°C for 1.5 h under an electric field of 1.0 kV/mm.

3. Results and Discussion

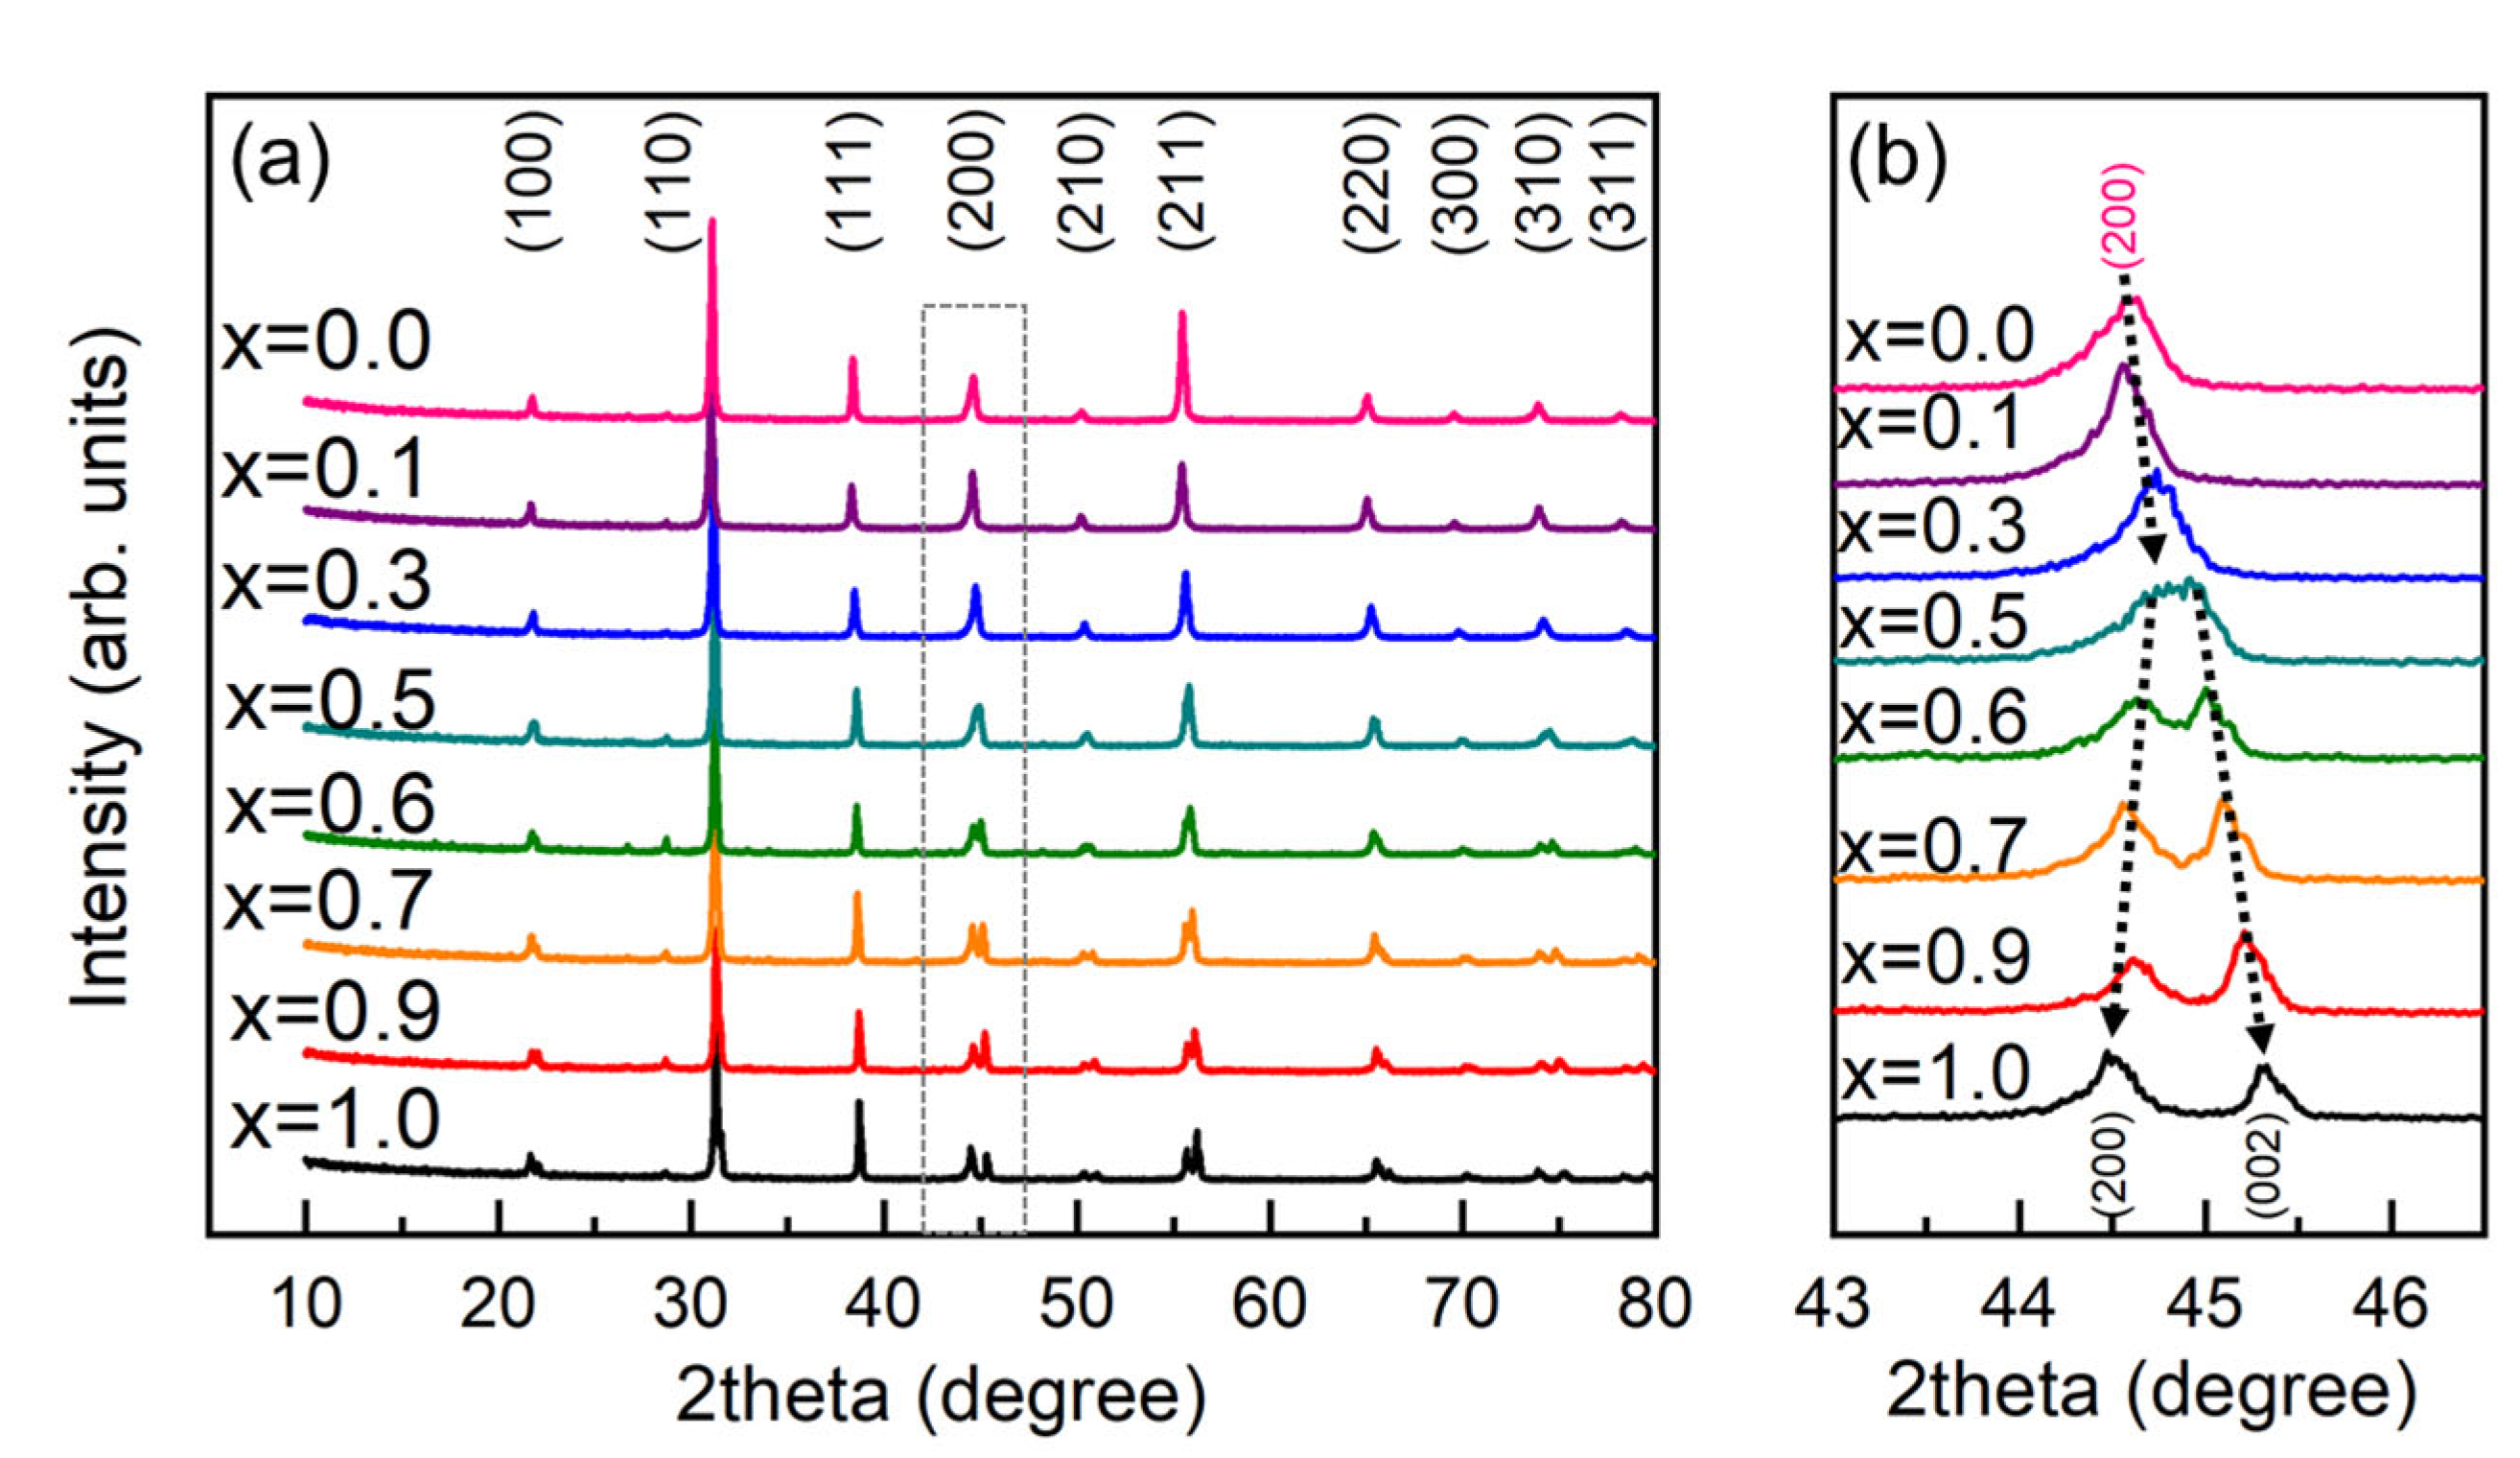
3.1. Structural Characterization

Figure 1a shows the X-ray diffraction (XRD) patterns for all the BZ0.18T–xBP0.22T samples. No reflections of a second phase appeared, demonstrating that all the samples possessed a pure perovskite ABO3 structure [17]. The XRD profile of (200) reflection is shown in Figure 1b. From x = 0 to 0.3, with the increase in BP0.22T content, the reflection of (200) moved toward a higher angle, revealing the lattice constant decreased, which was caused by the smaller ionic radius of Pb2+ [15]. No splitting of the (200) reflection suggested a rhombohedral crystal structure [17]. On the other hand, the (200) reflection moving toward a higher angle also implied that the BZ0.18T and BP0.22T formed into solid-solution; otherwise, the BP0.22T would distribute mainly at the grain boundary and would not change the lattice parameters [18]. From x = 0.6 to 1.0, the reflection of the (200) split into two peaks, agreeing well with the detected tetragonal crystal structure in Pb-doped BaTiO3 [15]. By contrast, the intermediate composition, x = 0.5, corresponded to the state with the coexistence of R and T phases, coined the MPB composition [8].

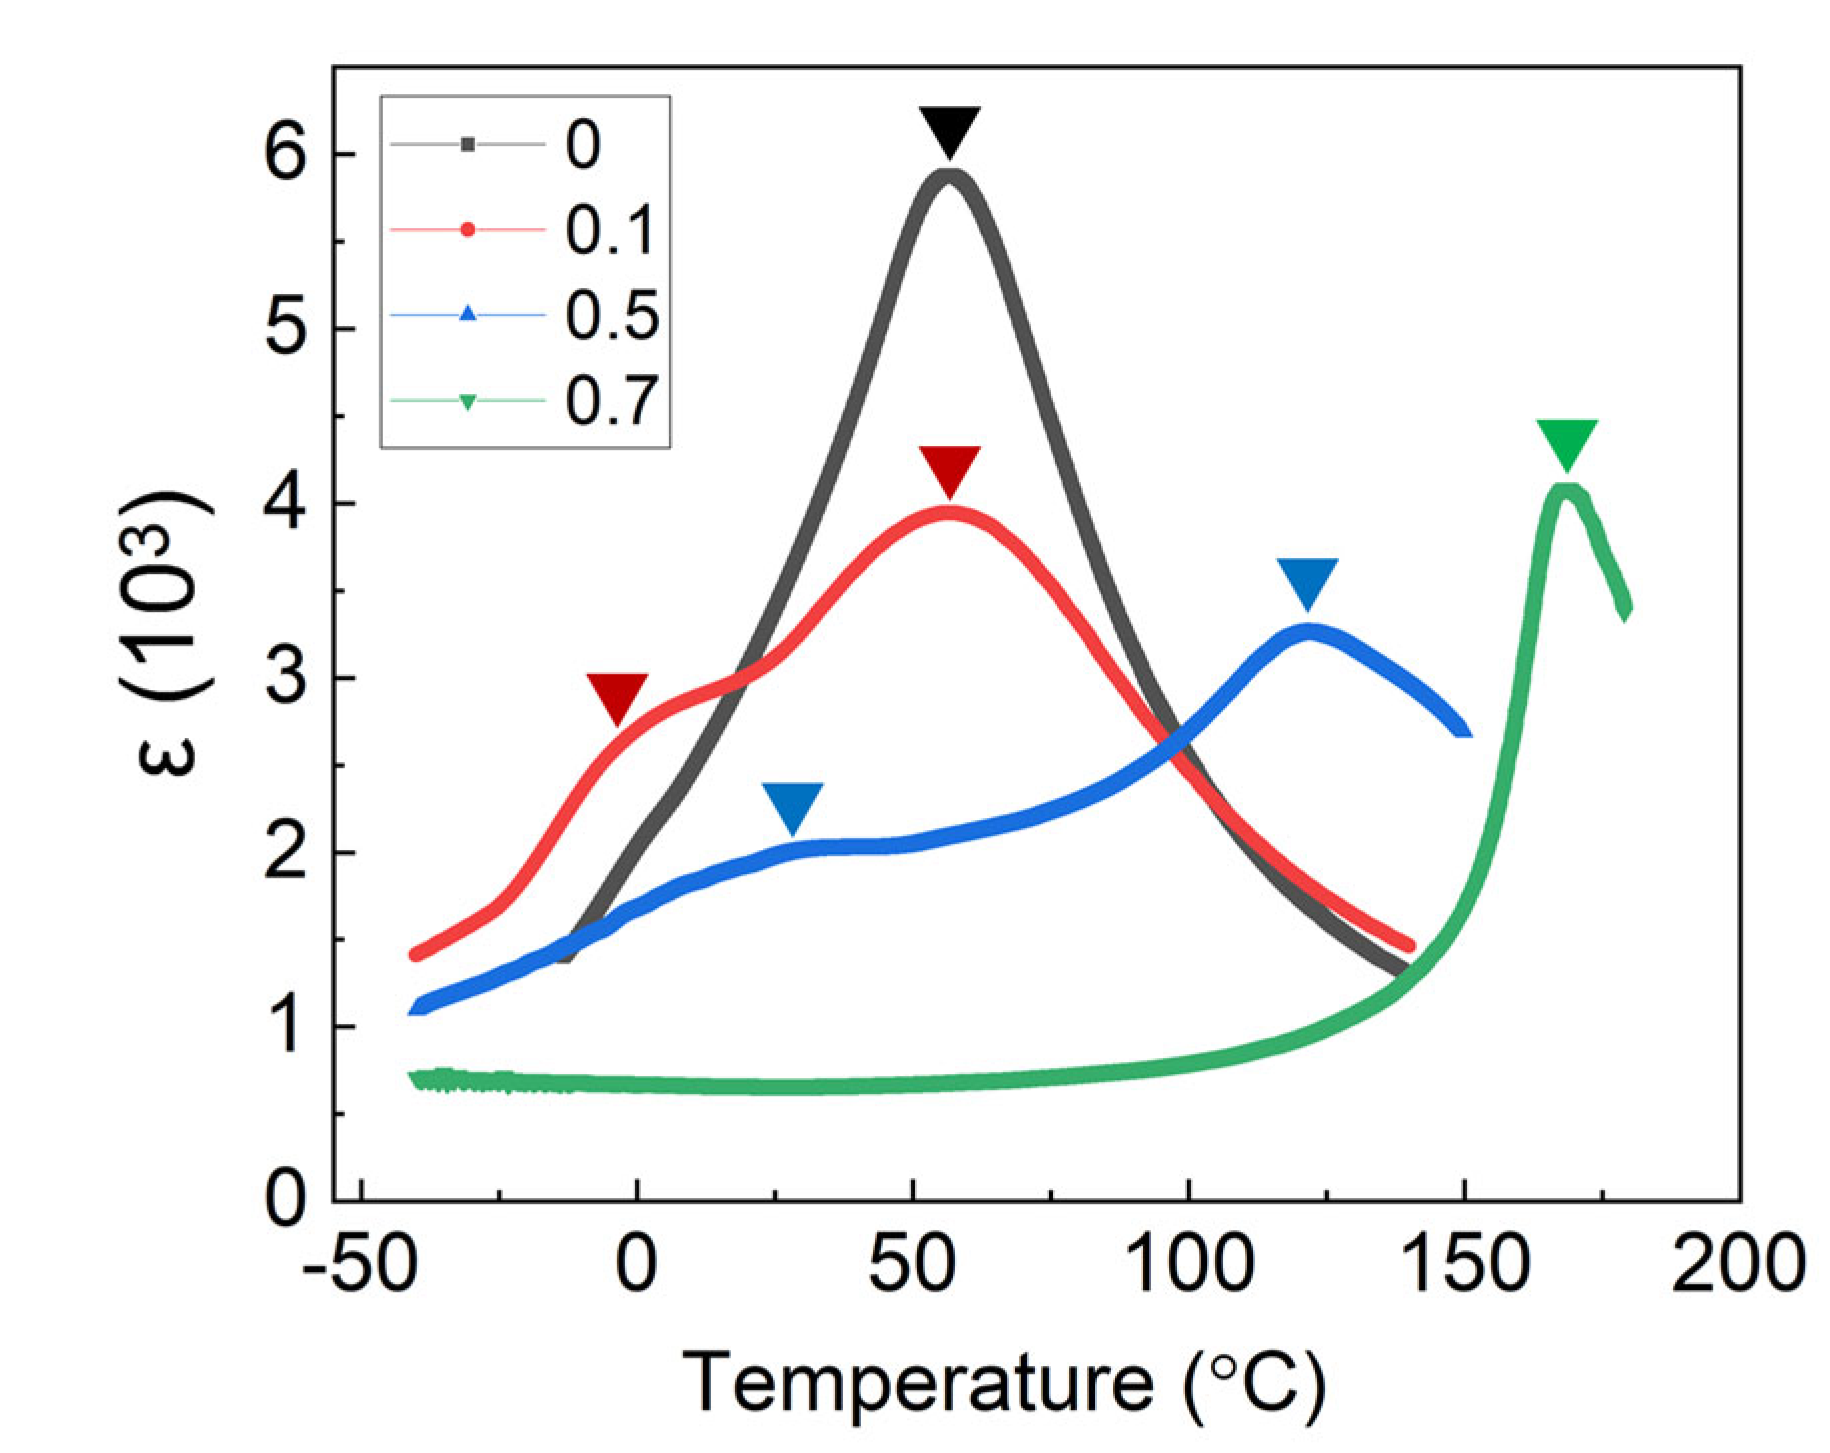
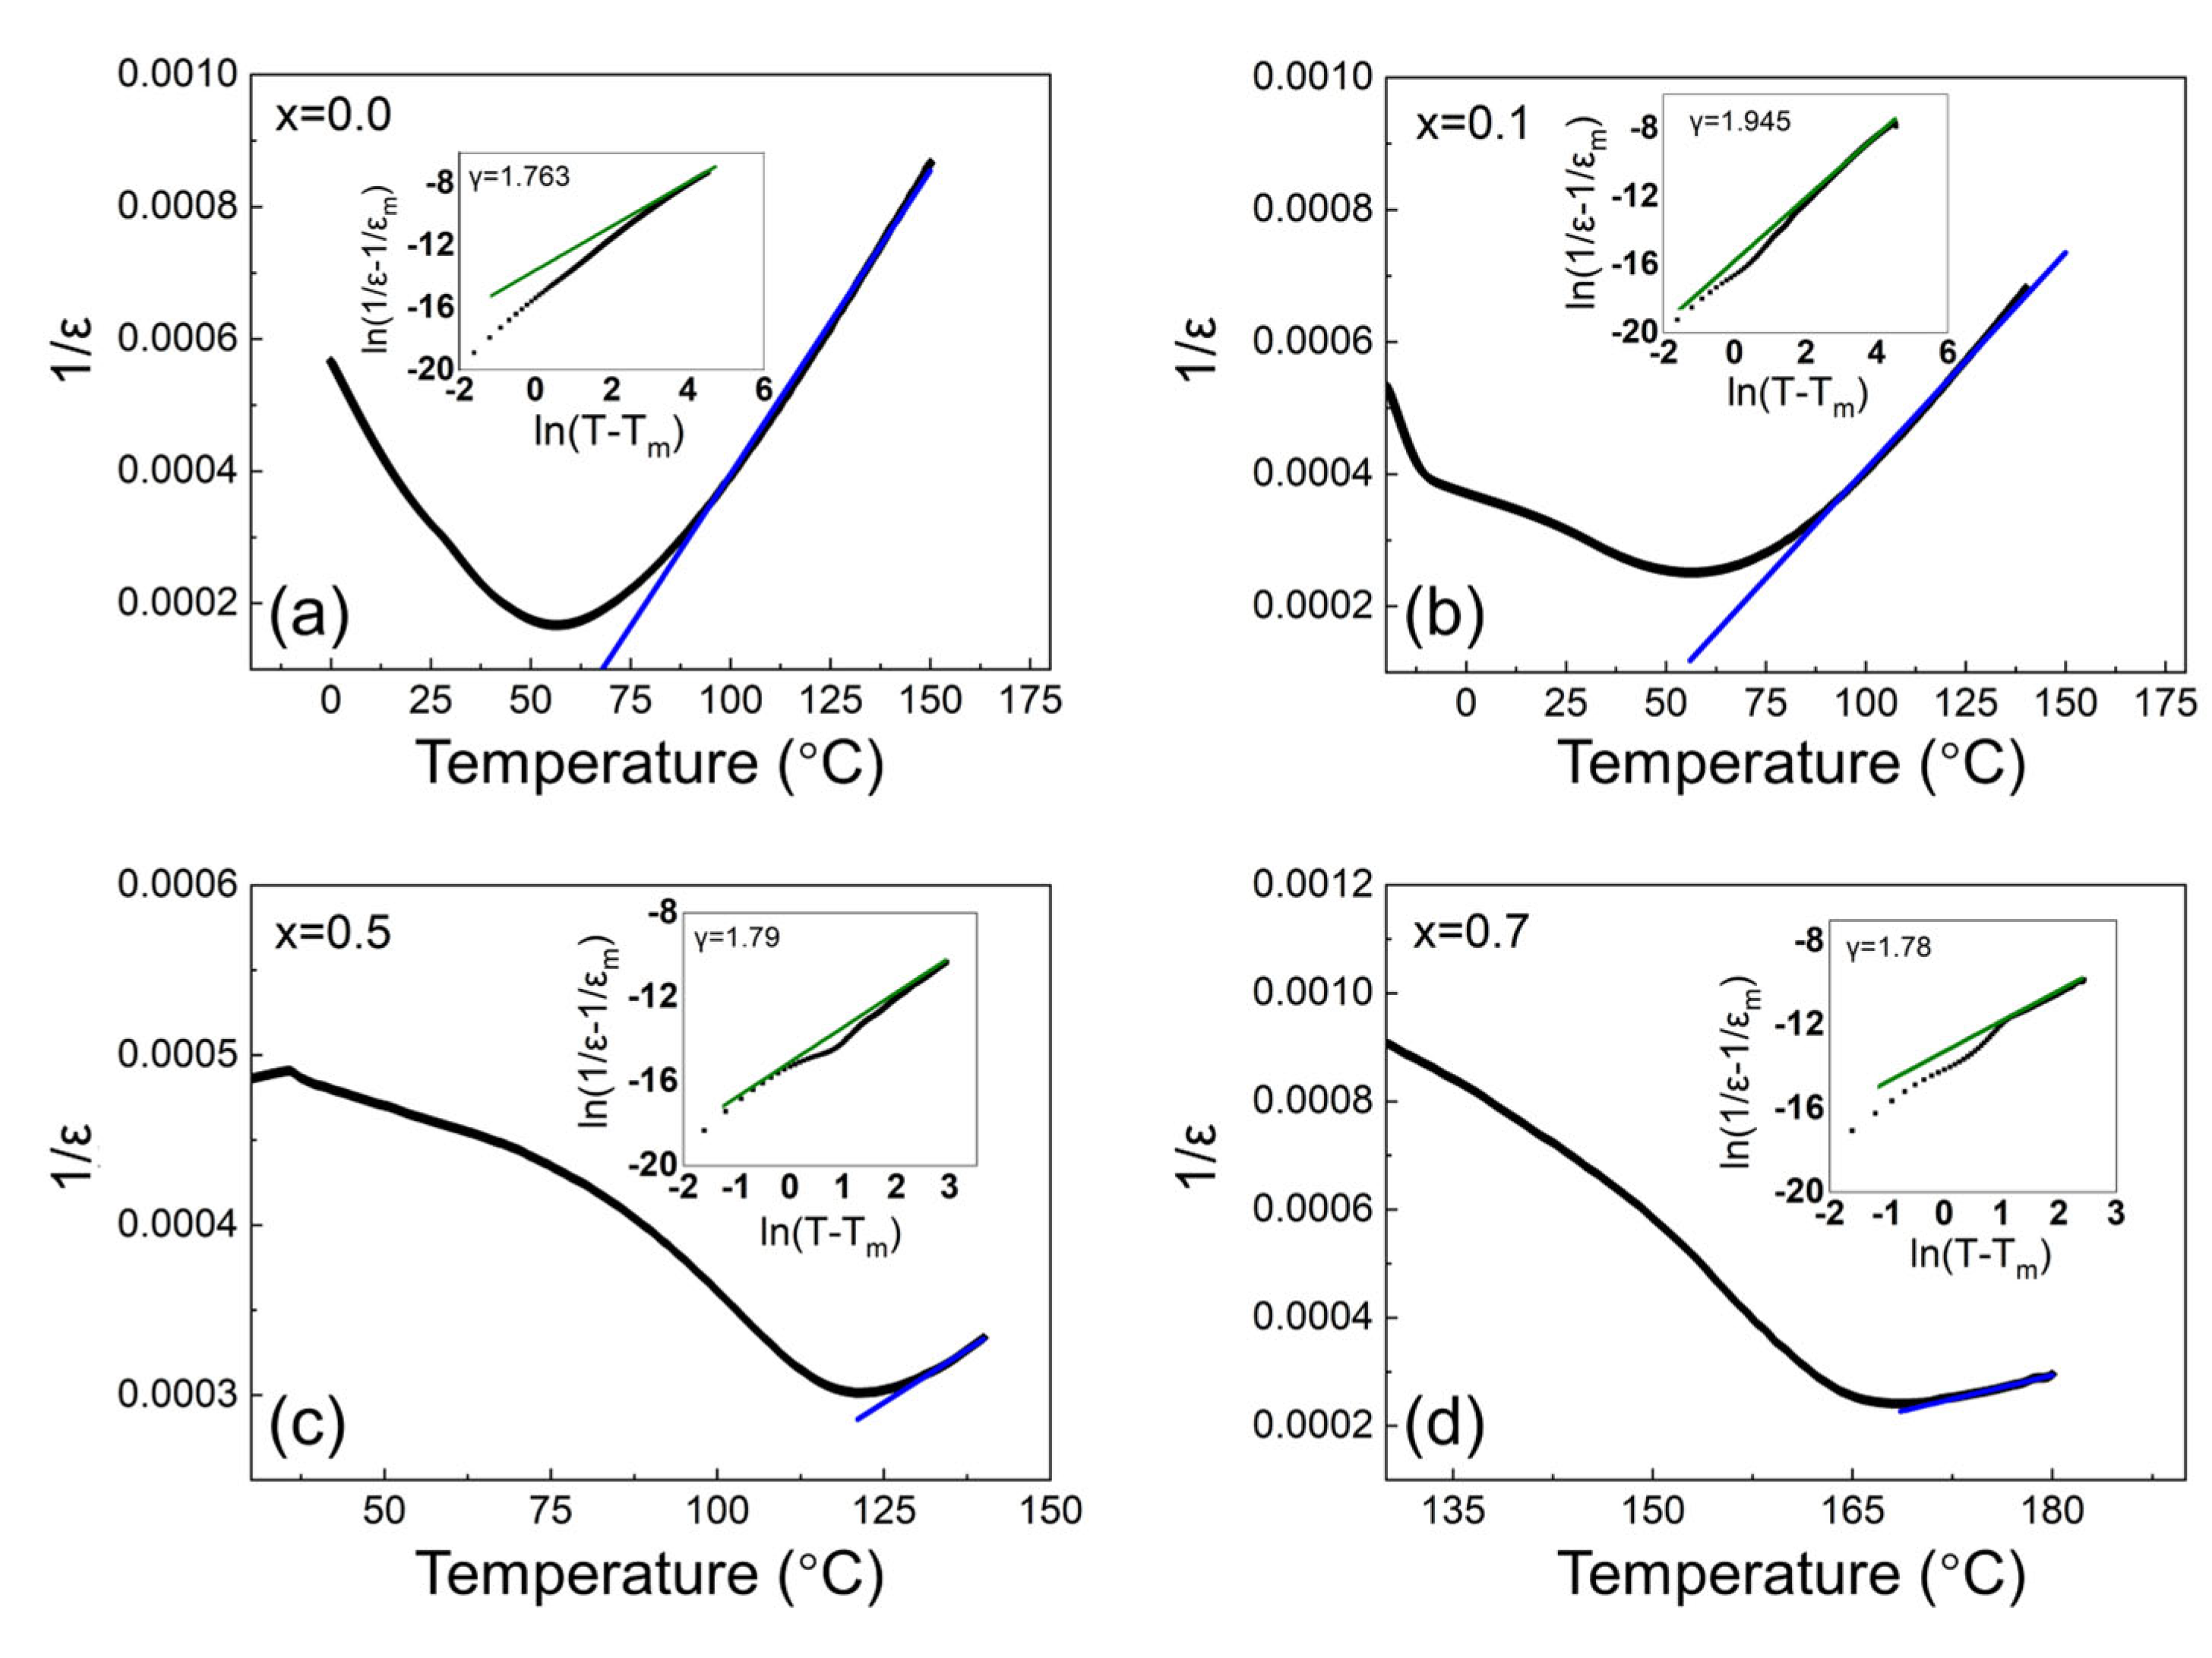
3.2. Dielectric Permittivity versus Temperature Spectrum

Based on the XRD results in Figure 1, several typical compositions were selected for further investigation, x = 0, 0.1, 0.5, and 0.7. Figure 2 shows the temperature spectrum of the dielectric permittivity (ε at 10kHz) for the selected typical compositions (for ε measured at multiple frequencies, please refer to Figures S1–S4). For x = 0.0 (BZ0.18T), which exhibited an R phase at room temperature, there appeared only one dielectric peak at 56.6°C, indicating the transition from the C to R phase and agreed well with a previous report [14]; for x = 0.7, which exhibited a T phase at room temperature, there also appeared only one peak indicating the transition from the C to T phase [15]. For the intermediate compositions x = 0.1 and x = 0.5, there appeared two dielectric peaks, of which the one at a higher temperature indicated the C-T transition, and the other one at a lower temperature indicated the T-R transition. The doped BP0.22T increased both the maximum dielectric temperature (Tm) and the T-R transition temperature. Compared with the other compositions, x = 0.5 possessed both relatively large dielectric permittivity and good temperature stability. The observed composition-dependent dielectric behavior was consistent with those of the previously reported ferroelectric MPB systems, i.e., BZT-BCT [8] and BHT-BCT [13].
Compared with a normal paraelectric–ferroelectric transition [15], the shapes of the dielectric peak at Tm for the BZ0.18T–xBP0.22T samples expanded to a broader temperature range, and this is the typical feature of a diffuse phase transition [19]. In the paraelectric phase, the inverse dielectric permittivity (1/ε) for ferroelectric materials obeys the Curie–Weiss Law [19]:
1 ε = T T C C
where TC is the Curie temperature, and C is the Curie–Weiss constant.
The inverse dielectric permittivity versus temperature curves of the typical compositions x = 0, 0.1, 0.5, and 0.7 are depicted in Figure 3. To investigate the diffuse phase transition behaviors of the BZ0.18T–xBP0.22T samples, the modified Curie–Weiss Law was employed [20]:
1 ε 1 ε m = T T m γ C
where γ denotes the degree of diffusion constant; γ = 1 indicates the normal ferroelectric transition behavior, and γ = 2 indicates the complete diffuse phase transition behavior, commonly regarded as relaxor behavior [19].
The plots of ln( 1 ε 1 ε m ) versus ln( T T m ) curves are shown in the insets of Figure 3. The fitted parameters, TC, Tm, and C and the estimated values of γ for x = 0, 0.1, 0.5, and 0.7 are listed in Table 1.
Materials 15 04760 g004
The composition x = 0.1 exhibited the strongest diffuse phase transition behavior, which can be understood from two aspects: (1) on one hand, as can be seen in Figure 2, the transition peak corresponded to the convergence of the C-T and T-R transitions; (2) on the other hand, for the solid-solution system (1−x)BZT–xBPT, while the content of the BPT was low (i.e., 0 < x ≤ 0.1), the solution can be regarded as Pb and Ti co-doped BZT. Although Pb2+ and Ba2+ are of equal valence, their ionic radii are different. Substitution of Zr4+ with Ti4+ is of the same type. Therefore, co-doping of Pb2+ and Ti4+ would probably result in a relaxor-like state [21].
It should be noted that the Tm of the MPB composition of the BZ0.18T–xBP0.22T system, x = 0.5, was 121.1°C, nearly thirty degrees higher than that of the famous MPB composition BZT-0.5BCT (93°C) [8]. This means that the upper limit of working temperature for BZ0.18T-0.5BP0.22T is higher than that of BZT-0.5BCT, proving the validity of designing low-Pb high-piezoelectric materials via the MPB mechanism.

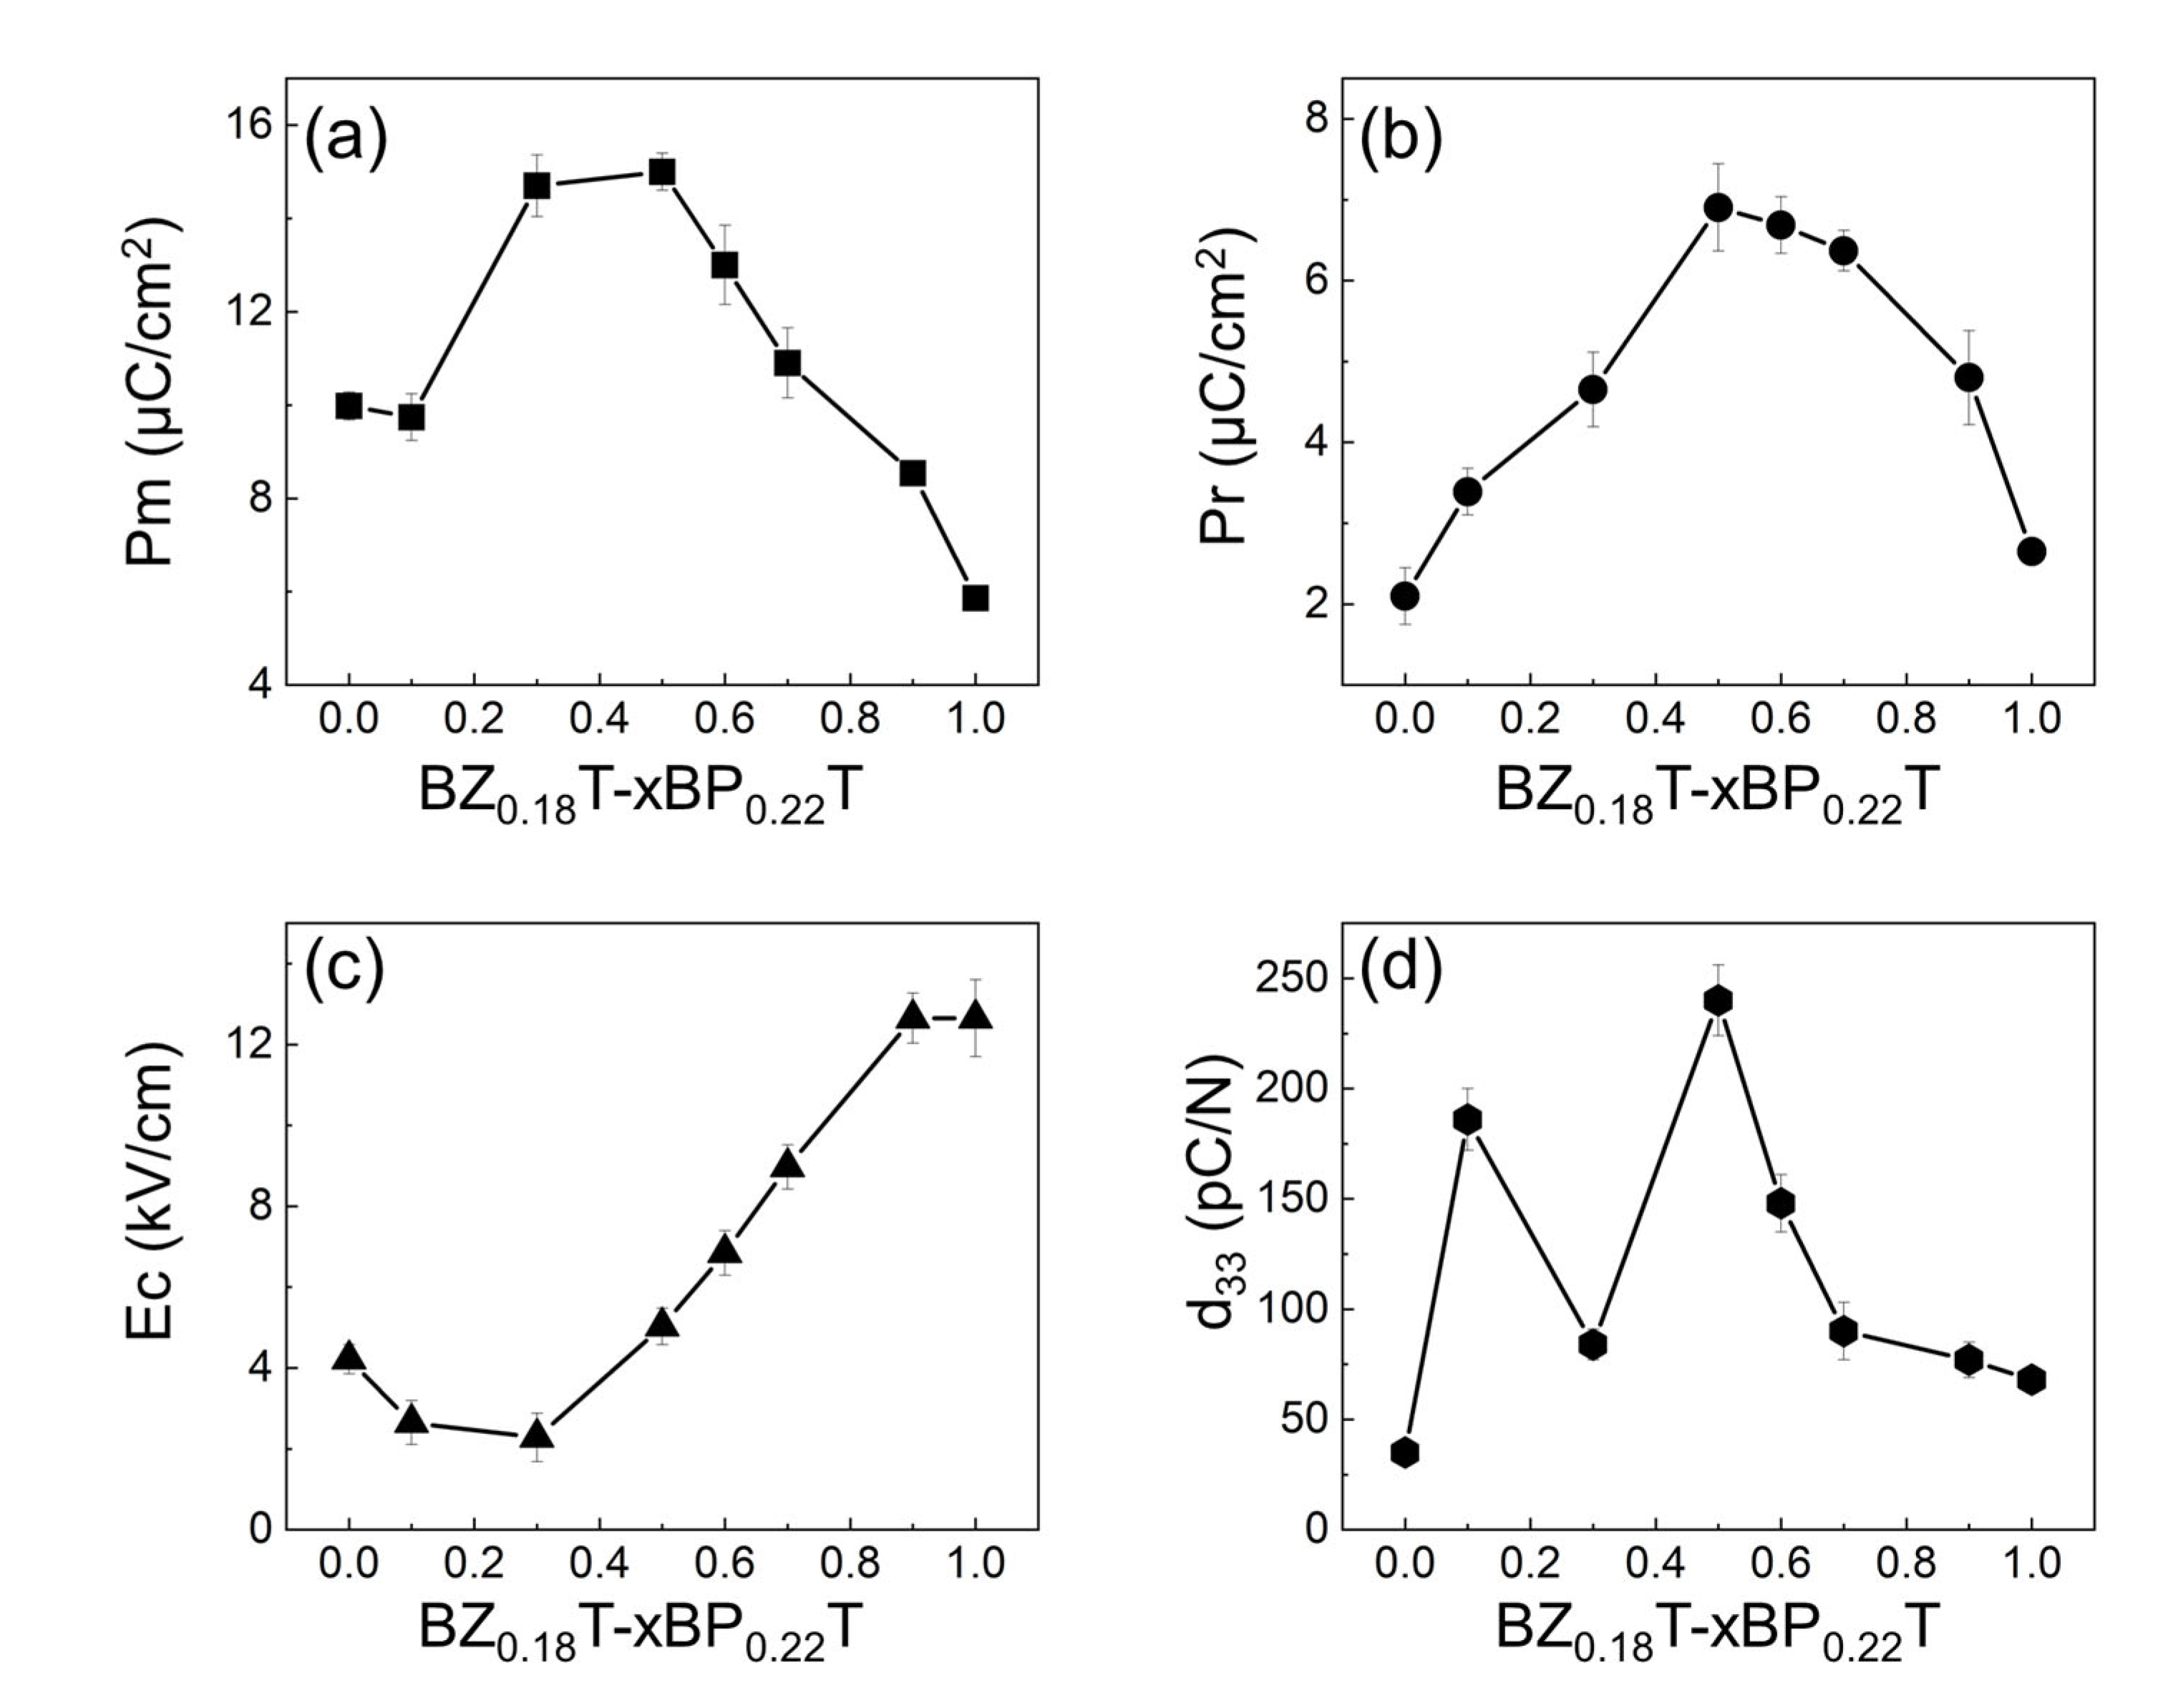
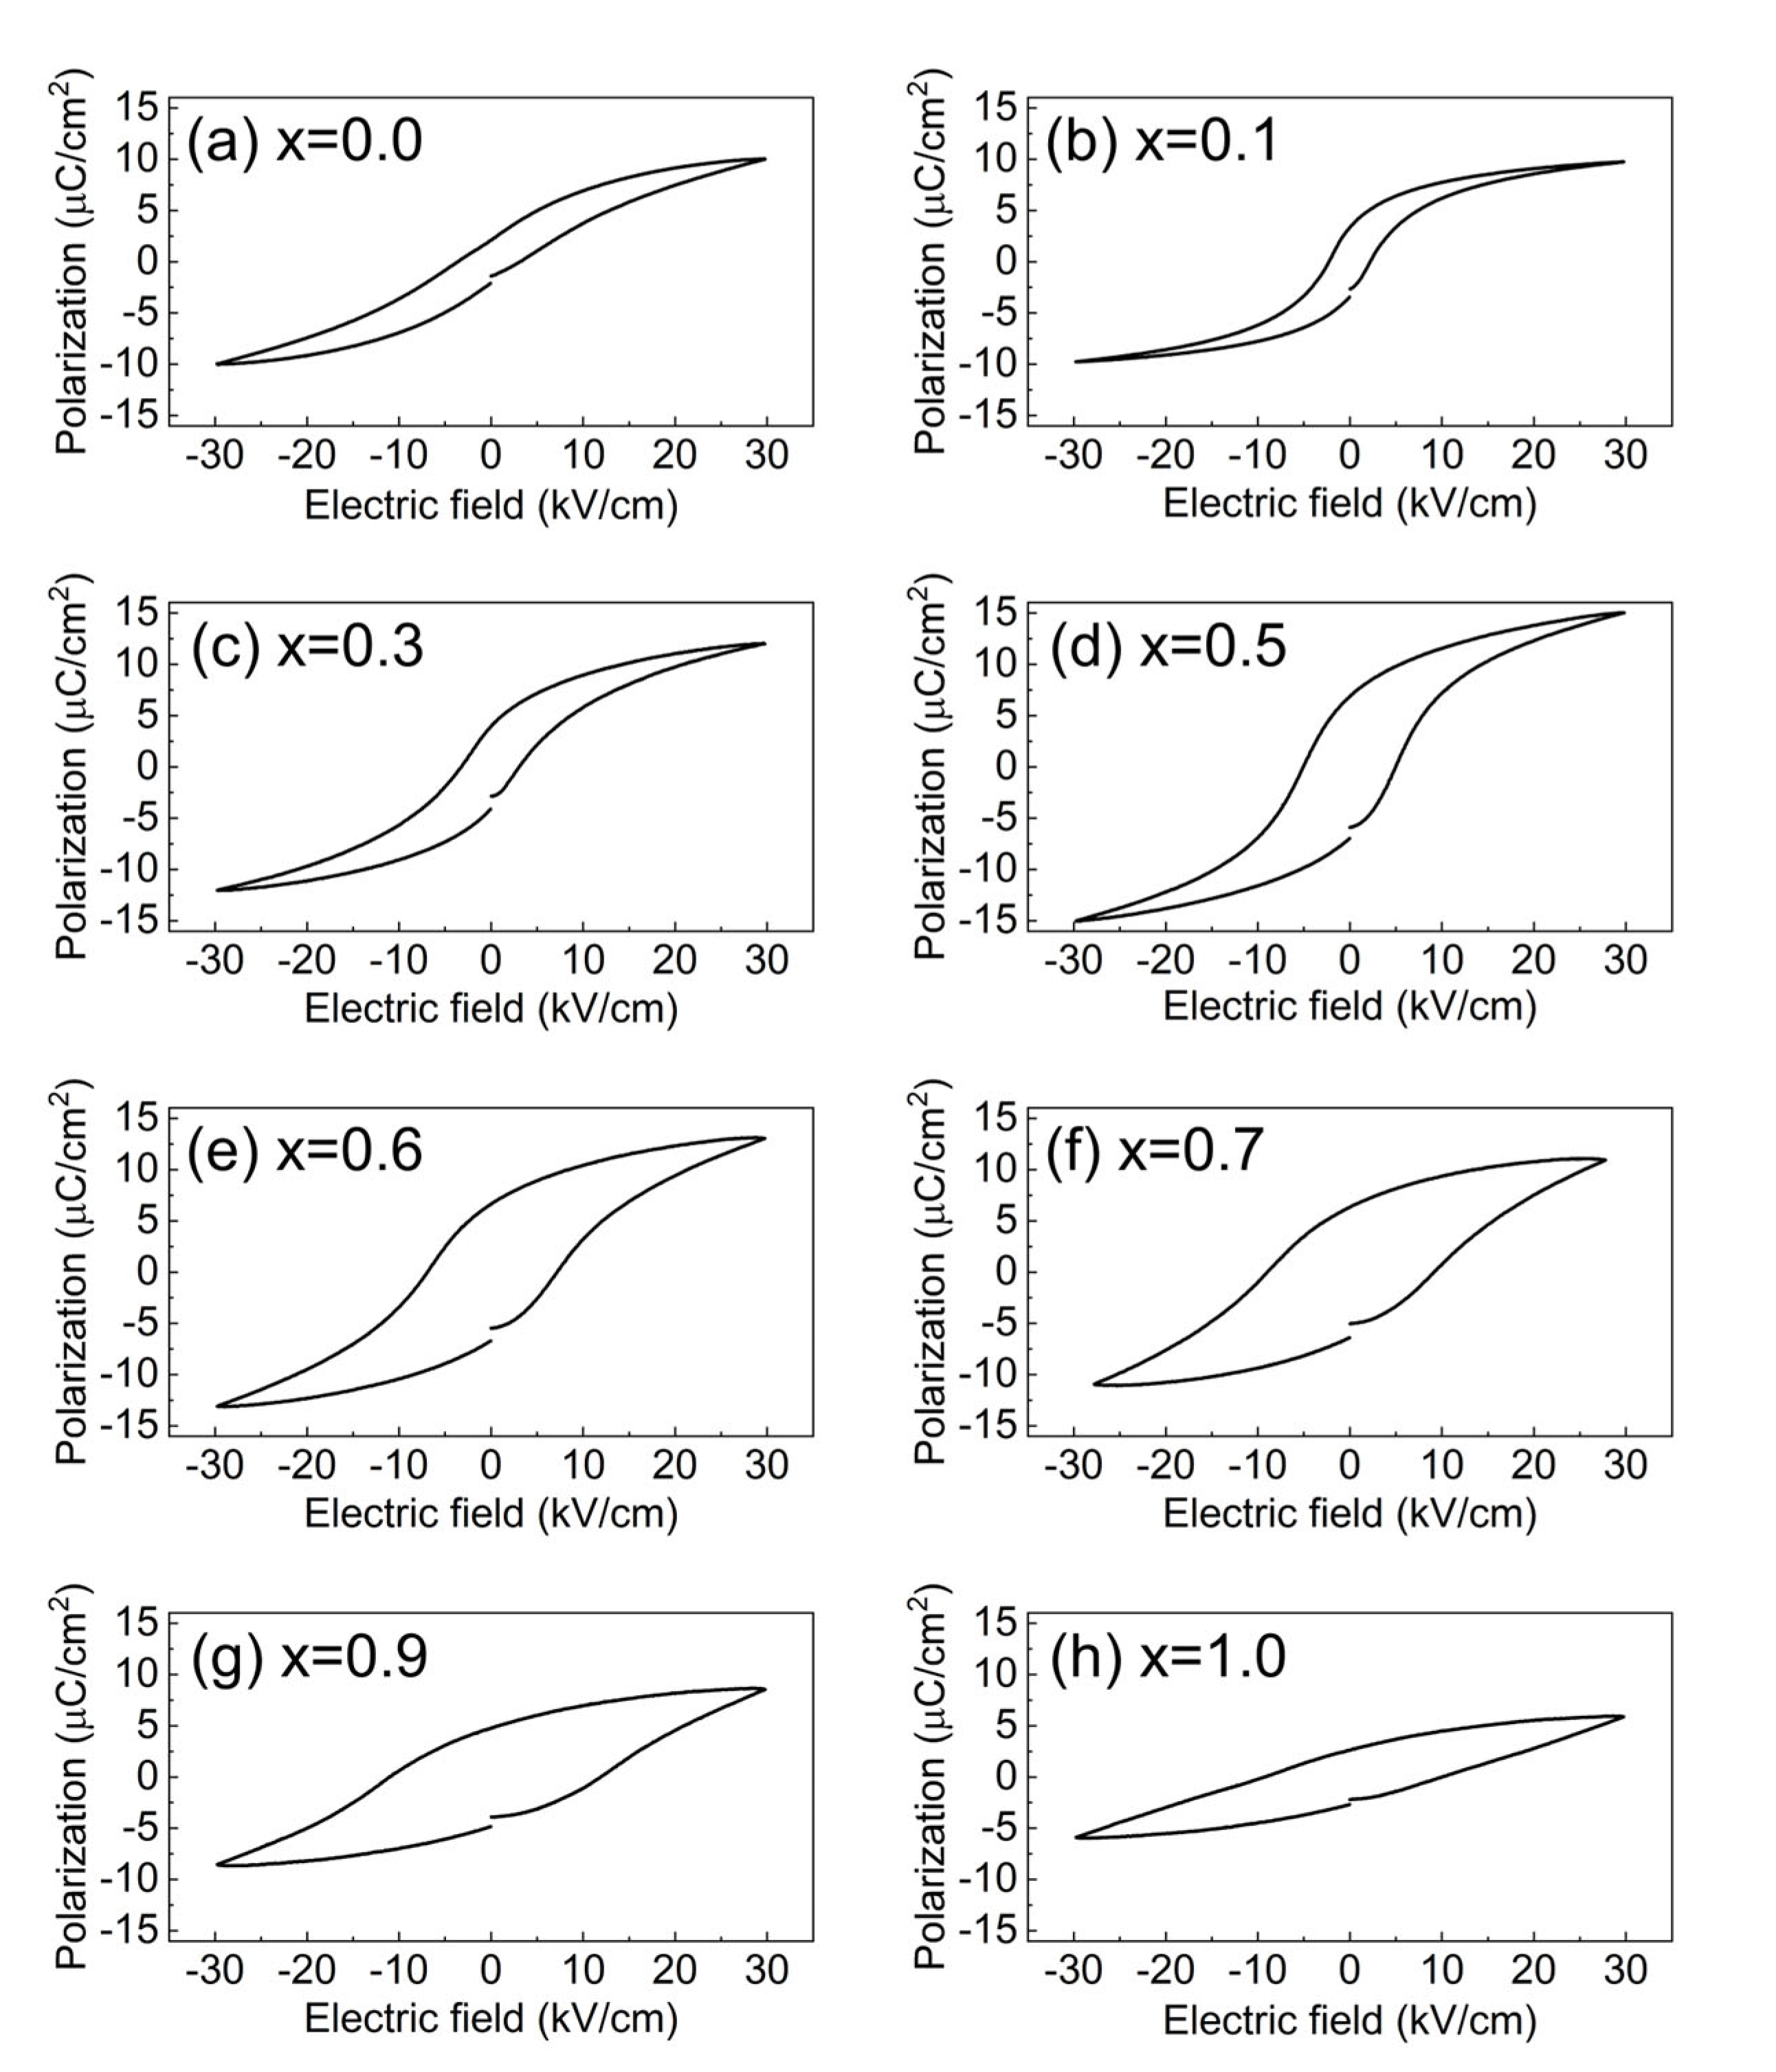
3.3. Ferroelectric and Piezoelectric Properties

The polarization (P)—ferroelectric field (E) hysteresis loops are shown in Figure 4. With the increase in BP0.22T content from x = 0 to x = 0.5, the maximum polarization Pm and remnant polarization Pr first increased and then decreased, both reaching the maximum value at x = 0.5, which is clearly seen in Figure 5a,b, respectively. Generally, the enhancement of polarization results mainly from two factors: (1) the increase in the intrinsic spontaneous polarization [22] and (2) the facilitation of the ferroelectric domain switching [23]. As for the BZ0.18T–xBP0.22T system, both factors may contribute to the observed increase in polarization. On one hand, the increasing content of BP0.22T is essentially equal to the increasing substitution of BaTiO3 by PbTiO3. PbTiO3 possesses a larger c/a ratio, which results in a larger ionic polarization [24]; so the introduction of BP0.22T (within a certain amount) leads to the increase in intrinsic spontaneous polarization [15]. On the other hand, when the volume fraction of BP0.22T reaches a certain content, as 50 at% (x = 0.5) in the present study, the material locates at the MPB that corresponds to the state where the R phase and T phase coexist. The thermodynamic state at MPB has been well illustrated as the flattening of the Landau energy landscape with near-zero energy barrier between different neighboring phases [25,26]. At MPB, the ferroelectric domain can be switched under a lower field (although the coercive field EC of x = 0.5 was not the minimum among all the compositions) [12]. Therefore, the maximum polarization was obtained at x = 0.5. From x = 0.5 to 1.0, the greater potential well depths of PbTiO3 gradually dominated and caused the domain switching to become more difficult as evidenced by the changing trend of EC (Figure 5c) [27]; so, the polarization decreased monotonously as the content increased from x = 0.5 to 1.0.
As for the minimum EC appearing at x = 0.3, it was probably due to the observed “invisible phase boundary” in such MPB-involved systems [28]. For the triple-point MPB involved system, the MPB derives from its starting point—the triple-point where three phases coexist [13]. Such phase coexistence naturally gives rise to the minimum energy barrier within the whole diagram; so, the MPB that derives from it yields a large response under small external fields. The minimum EC appearing at x = 0.3 suggested that the triple point of the system corresponded to the composition x = 0.3, similar to a previously reported (1−x)Ba(Ti0.8Hf0.2)O3–x(Ba0.7Ca0.3)TiO3 system [28,29]. In addition, from x = 0.3 to 1.0, EC increased monotonously; this phenomenon was ascribed to the abovementioned greater potential well depths of PbTiO3 [30].This could also explain the difference between the BZ0.18T–xBP0.22T system and the BZT-BCT system; for the BZT-BCT, the lowest EC was observed at the MPB composition BZT-0.5BCT [8].
The measured piezoelectric coefficients d33 of all the samples are shown in Figure 5d. Among all the available compositions, there were two peak values, one at x = 0.1 and the other at x = 0.5. The physical basis of the enhanced piezoelectricity at the MPB is the unique thermodynamic state with low energy barriers between neighboring ferroelectric states [12]. x = 0.5 was the MPB composition of the system, corresponding to the state of two-phase coexistence with a low energy barrier, which endowed it with a relatively low EC and high polarization, as well as transverse instability under external stimuli [26], thus exhibiting a large d33 value (240 pC/N), even exceeding that of the undoped PZT ceramics (160~190 pC/N) [31]. It should be emphasized that two-phase coexistence does not guarantee high piezoelectricity, although enhancement of piezoelectricity is usually observed, as evidenced in BNT-BT materials [10]. The increase in d33 of x = 0.5 compared with other off-MPB compositions originates from the thermodynamic feature of MPB, which inherits partly from the triple point where three phases coexist with near-zero energy barriers. Therefore, in principle, the energy barrier of the MPB is lower than that of the polymorphic boundary (PB), and naturally the piezoelectric properties at the MPB are superior to those at the PB [32].
It is interesting that when x = 0.1, neither the end member composition nor the composition at phase boundary also showed a peak value of d33 of 186 pC/N, comparable to the performance of undoped PZT ceramic. This should be attributed to the strongest diffuse phase transition behavior detected for the composition x = 0.1 (Table 1), as discussed above. In fact, tuning the normal ferroelectric transition to a diffuse phase transition has been regarded one of the efficient routes to obtain large piezoelectricity [33,34]. Overall, the composition x = 0.5 exhibited the optimum comprehensive properties regarding the polarization, the coercive field, and the piezoelectricity.
Finally, it should be noted that Pb has an increased migration ability during the formation of ferroelectric materials with their content, thus affecting the properties and microstructure of the samples [35,36,37]. Although the Pb-induced nonstoichiometric and imperfection factors are beyond the scope of the current work, this issue should and will be seriously considered in the future.

4. Conclusions

In conclusion, considering that the worldwide laws and regulations that restrict the content of Pb in functional materials are about to be implemented, and that the currently reported Pb-free piezoelectric materials are far from commercial fabrication, we propose to design low-Pb high-piezoelectric material as an effective alternative. Based on the MPB mechanism, a new MPB-involved system, BZ0.18T-xBP0.22T, was fabricated. The optimum composition (also the MPB composition), x = 0.5, exhibited a high piezoelectricity of 240 pC/N and a high Tm of 121.1°C. Our result verifies the validity of obtaining good piezoelectricity via fabricating a low-Pb MPB system with one end member of a Pb-free compound and the other end member of a Pb-based compound. We believe that low-Pb piezoelectric materials that can completely replace Pb-rich materials are coming soon.

Supplementary Materials

The following supporting information can be downloaded at: https://www.mdpi.com/article/10.3390/ma15144760/s1, Figure S1: Dielectric permittivity versus temperature curve (100 Hz, 1 kHz, 10 kHz, 100 kHz, 1 MHz) of x = 0. Figure S2: Dielectric permittivity versus temperature curve (100 Hz, 1 kHz, 10 kHz, 100 kHz, 1 MHz) of x = 0.1. Figure S3: Dielectric permittivity versus temperature curve (100 Hz, 1 kHz, 10 kHz, 100 kHz, 1 MHz) of x = 0.5. Figure S4: Dielectric permittivity versus temperature curve (100 Hz, 1 kHz, 10 kHz, 100 kHz, 1 MHz) of x = 0.7.

Author Contributions

Conceptualization, C.Z. and S.Y.; methodology, J.L.; investigation, J.L., X.Z. and T.Y.; writing—original draft preparation, C.Z., J.L. and Y.Z.; writing—review and editing, Y.Z. and C.Z.; supervision, S.Y.; funding acquisition; S.Y., C.Z. and J.L. contributed equally to this work. All authors have read and agreed to the published version of the manuscript.

Funding

This research was funded by the National Key R&D Program of China (Grant Number 2021YFB3501401), the National Natural Science Foundation of China (Grant Numbers 91963111, 51601140), the Key Scientific and Technological Innovation Team of Shaanxi Province (Grant Number 2020TD-001), the Innovation Capability Support Program of Shaanxi (Grant Numbers 2018PT-28, 2017KTPT-04), the Fundamental Research Funds for the Central Universities (China) and the World-Class Universities (Disciplines), and the Characteristic Development Guidance Funds for the Central Universities (China).

Institutional Review Board Statement

Not applicable.

Informed Consent Statement

Not applicable.

Data Availability Statement

Not applicable.

Conflicts of Interest

The authors declare no conflict of interest.

References

  1. Uchino, K. Ferroelectric Devices; Marcel Dekker: New York, NY, USA, 2000; Chapter 7. [Google Scholar]
  2. Jaffe, B.; Cook, W.R.; Jaffe, H. Piezoelectric Ceramics; Academic Press: Cambridge, MA, USA, 1971. [Google Scholar]
  3. Choi, S.W.; Shrout, T.R.; Jang, S.J.; Bhalla, A.S. Morphotropic phase boundary in Pb(Mg1/3Nb2/3)O3-PbTiO3 system. Mater. Lett. 1989, 8, 253–255. [Google Scholar] [CrossRef]
  4. Kuwata, J.; Uchino, K.; Nomura, S. Phase transitions in the Pb(Zn1/3Nb2/3)O3-PbTiO3 system. Ferroelectrics 1981, 37, 579–582. [Google Scholar] [CrossRef]
  5. Uchino, K. Piezoelectric Actuators and Ultrasonic Motors; Springer Science & Business Media: Berlin/Heidelberg, Germany, 1996; Volume 1. [Google Scholar]
  6. Saito, Y.; Takao, H.; Tani, T.; Nonoyama, T.; Takatori, K.; Homma, T.; Nagaya, T.; Nakamura, M. Lead-free piezoceramics. Nature 2004, 432, 84–87. [Google Scholar] [CrossRef] [PubMed]
  7. Takenaka, T.; Maruyama, K.I.M.K.I.; Sakata, K.S.K. (Bi1/2Na1/2)TiO3-BaTiO3 System for Lead-Free Piezoelectric Ceramics. Jpn. J. Appl. Phys. 1991, 30, 2236. [Google Scholar] [CrossRef]
  8. Liu, W.; Ren, X. Large Piezoelectric Effect in Pb-Free Ceramics. Phys. Rev. Lett. 2009, 103, 257602. [Google Scholar] [CrossRef] [Green Version]
  9. Safari, A.; Hejazi, M. Lead-free KNN-based piezoelectric materials. In Lead-Free Piezoelectrics; Springer: Berlin/Heidelberg, Germany, 2012; pp. 139–175. [Google Scholar]
  10. Zeng, W.; Zhou, X.; Chen, J.; Liao, J.; Zhou, C.; Cen, Z.; Yang, T.; Yang, H.; Zhou, Q.; Chen, G.; et al. Origin of high piezoelectric activity in perovskite ferroelectric ceramics. Appl. Phys. Lett. 2014, 104, 242910. [Google Scholar] [CrossRef]
  11. Newnham, R.E. Properties of Materials: Anisotropy, Symmetry, Structure; Oxford University Press: Oxford, UK, 2004. [Google Scholar]
  12. Rossetti, J.G.A., Jr.; Khachaturyan, A.G.; Akcay, G.; Ni, Y. Ferroelectric solid solutions with morphotropic boundaries: Vanishing polarization anisotropy, adaptive, polar glass, and two-phase states. J. Appl. Phys. 2008, 103, 114113. [Google Scholar] [CrossRef]
  13. Zhou, C.; Liu, W.; Xue, D.; Ren, X.; Bao, H.; Gao, J.; Zhang, L. Triple-point-type morphotropic phase boundary based large piezoelectric Pb-free material—Ba(Ti0.8Hf0.2)O3-(Ba0.7Ca0.3)TiO3. Appl. Phys. Lett. 2012, 100, 222910. [Google Scholar] [CrossRef] [Green Version]
  14. Yu, Z.; Ang, C.; Guo, R.; Bhalla, A.S. Piezoelectric and strain properties of Ba(Ti1-xZrx)O3 ceramics. J. Appl. Phys. 2002, 92, 1489–1493. [Google Scholar] [CrossRef]
  15. Shirane, G.; Suzuki, K. On the Phase Transition in Barium-Lead Titanate (1). J. Phys. Soc. Jpn. 1951, 6, 274–278. [Google Scholar] [CrossRef]
  16. Rojac, T.; Drnovsek, S.; Bencan, A.; Malic, B.; Damjanovic, D. Role of charged defects on the electrical and electromechanical properties of rhombohedral Pb(Zr,Ti)O3 with oxygen octahedra tilts. Phys. Rev. B 2016, 93, 014102. [Google Scholar] [CrossRef] [Green Version]
  17. Zhou, C.; Ke, X.; Yao, Y.; Yang, S.; Ji, Y.; Liu, W.; Yang, Y.; Zhang, L.; Hao, Y.; Ren, S.; et al. Evolution from successive phase transitions to “morphotropic phase boundary” in BaTiO3-based ferroelectrics. Appl. Phys. Lett. 2018, 112, 182903. [Google Scholar] [CrossRef] [Green Version]
  18. Lines, M.E.; Glass, A.M. Principles and Applications of Ferroelectrics and Related Materials; Clarendon: Oxford, UK, 1977. [Google Scholar]
  19. Maiti, T.; Guo, R.; Bhalla, A.S. The evolution of relaxor behavior in Ti4+ doped BaZrO3 ceramics. J. Appl. Phys. 2006, 100, 114109. [Google Scholar] [CrossRef]
  20. Chattopadhyay, S.; Ayyub, P.; Palkar, V.R.; Multani, M. Size-induced diffuse phase transition in the nanocrystalline ferroelectric PbTiO3. Phys. Rev. B 1995, 52, 13177–13183. [Google Scholar] [CrossRef]
  21. Jiang, Z.; Yuan, Y.; Yang, H.; Li, E.; Zhang, S. Relaxor regulation and improvement of breakdown strength for Bi0.5Na0.5TiO3-based ceramics by co-doping with Ca and Nb. Ceram. Int. 2022, 48, 9702–9709. [Google Scholar] [CrossRef]
  22. Wang, J.-J.; Wang, B.; Chen, L.-Q. Understanding, Predicting, and Designing Ferroelectric Domain Structures and Switching Guided by the Phase-Field Method. Annu. Rev. Mater. Sci. 2019, 49, 127–152. [Google Scholar] [CrossRef]
  23. Chen, Z.; Hong, L.; Wang, F.; Ringer, S.P.; Chen, L.-Q.; Luo, H.; Liao, X. Facilitation of Ferroelectric Switching via Mechanical Manipulation of Hierarchical Nanoscale Domain Structures. Phys. Rev. Lett. 2017, 118, 017601. [Google Scholar] [CrossRef] [Green Version]
  24. Datta, K.; Margaritescu, I.; Keen, D.A.; Mihailova, B. Stochastic Polarization Instability in PbTiO3. Phys. Rev. Lett. 2018, 121, 137602. [Google Scholar] [CrossRef]
  25. Heitmann, A.A.; Rossetti, G.A. Thermodynamics of Ferroelectric Solid Solutions with Morphotropic Phase Boundaries. J. Am. Ceram. Soc. 2014, 97, 1661–1685. [Google Scholar] [CrossRef]
  26. Khachaturyan, A. Ferroelectric solid solutions with morphotropic boundary: Rotational instability of polarization, metastable coexistence of phases and nanodomain adaptive states. Philos. Mag. 2010, 90, 37–60. [Google Scholar] [CrossRef]
  27. Yuk, S.F.; Pitike, K.C.; Nakhmanson, S.M.; Eisenbach, M.; Li, Y.W.; Cooper, V.R. Towards an accurate description of perovskite ferroelectrics: Exchange and correlation effects. Sci. Rep. 2017, 7, 43482. [Google Scholar] [CrossRef] [PubMed]
  28. Zhao, L.; Ke, X.; Wang, W.; Zhang, L.; Zhou, C.; Zhou, Z.; Zhang, L.; Ren, X. Electrostrain enhancement at an invisible boundary in a single ferroelectric phase. Phys. Rev. B 2017, 95, 020101. [Google Scholar] [CrossRef]
  29. Zhang, L.; Zhao, L.; He, L.; Wang, D.; Sun, Y.; Wang, D.; Lou, X.; Zhang, L.; Carpenter, M.A. New Degree of Freedom in Determining Superior Piezoelectricity at the Lead-Free Morphotropic Phase Boundary: The Invisible Ferroelectric Crossover. ACS Appl. Mater. Interfaces 2022, 14, 1434–1442. [Google Scholar] [CrossRef]
  30. Cohen, R.E.; Krakauer, H. Electronic structure studies of the differences in ferroelectric behavior of BaTiO3 and PbTiO3. Ferroelectrics 1992, 136, 65–83. [Google Scholar] [CrossRef]
  31. Jaffe, B.; Roth, R.S.; Marzullo, S. Piezoelectric Properties of Lead Zirconate-Lead Titanate Solid-Solution Ceramics. J. Appl. Phys. 1954, 25, 809–810. [Google Scholar] [CrossRef]
  32. Shrout, T.; Zhang, S. Lead-free piezoelectric ceramics: Alternatives for PZT? J. Electroceramics 2007, 19, 111–124. [Google Scholar] [CrossRef] [Green Version]
  33. Puli, V.S.; Pradhan, D.K.; Pérez, W.; Katiyar, R.S. Structure, dielectric tunability, thermal stability and diffuse phase transition behavior of lead free BZT–BCT ceramic capacitors. J. Phys. Chem. Solids 2013, 74, 466–475. [Google Scholar] [CrossRef]
  34. Yao, F.-Z.; Wang, K.; Jo, W.; Webber, K.G.; Comyn, T.P.; Ding, J.-X.; Xu, B.; Cheng, L.-Q.; Zheng, M.-P.; Hou, Y.-D.; et al. Diffused Phase Transition Boosts Thermal Stability of High-Performance Lead-Free Piezoelectrics. Adv. Funct. Mater. 2016, 26, 1217–1224. [Google Scholar] [CrossRef]
  35. Mukhin, N.V. Diffusion model of intrinsic defects in lead zirconate titanate films on heat treatment in air. Glas. Phys. Chem. 2014, 40, 238–242. [Google Scholar] [CrossRef]
  36. Mangum, J.S.; Podowitz-Thomas, S.; Nikkel, J.; Zhou, C.; Jones, J.L. Investigating Pb diffusion across buried interfaces in Pb(Zr0.2Ti0.8)O3 thin films via time-of-flight secondary ion mass spectrometry depth profiling. Surf. Interface Anal. 2017, 49, 973–977. [Google Scholar] [CrossRef]
  37. Mukhin, N.; Chigirev, D.; Bakhchova, L.; Tumarkin, A. Microstructure and Properties of PZT Films with Different PbO Content—Ionic Mechanism of Built-In Fields Formation. Materials 2019, 12, 2926. [Google Scholar] [CrossRef] [PubMed] [Green Version]
Figure 1. XRD profiles (a) and the (200) reflections (b) of the BZ0.18T–xBP0.22T ceramic powder samples at room temperature (22°C).
Materials 15 04760 g001
Figure 2. Dielectric permittivity versus temperature curves (10 kHz) for the selected compositions x = 0, 0.1, 0.5, and 0.7 of BZ0.18T–xBP0.22T.
Materials 15 04760 g002
Figure 3. The inverse dielectric permittivity (10 kHz) versus temperature curves and corresponding fitted ln( 1 ε 1 ε m ) versus ln( T T m ) curves (inset) for the selected compositions x = 0 (a), 0.1 (b), 0.5 (c), and 0.7 (d) of BZ0.18T-xBP0.22T. The blue lines denote the linear fitting of 1/ε~T above TC, and the green lines denote the linear fitting of ln( 1 ε 1 ε m ) ~ ln( T T m ) at high temperature regime.
Materials 15 04760 g003
Figure 4. Polarization (P)—electric field (E) hysteresis loops for BZ0.18T–xBP0.22T: (a) 0, (b) 0.1, (c) 0.3, (d) 0.5, (e) 0.6, (f) 0.7, (g) 0.9, and (h) 1.0.
Materials 15 04760 g004
Figure 5. Composition dependence of the maximum polarization Pm (a), remnant polarization Pr (b), coercive field Ec (c), and the piezoelectric coefficient d33 (d) for BZ0.18T–xBP0.22T. The lines in the figure are guide for the eye.
Materials 15 04760 g005
Table 1. The dielectric parameters of BZ0.18T–xBP0.22T (x = 0.0, 0.1, 0.5, 0.7) at 10 kHz.
CompositionTC (°C)Tm (°C)C (°C)γ
0.048.856.43.63 × 1061.763
0.154.656.01.14 × 1071.945
0.585.0121.16.10 × 1061.790
0.7130.0168.61.21 × 1061.780
Publisher’s Note: MDPI stays neutral with regard to jurisdictional claims in published maps and institutional affiliations.

