Article

Gel Evolution of Copper Tailing-Based Green Geopolymers in Marine Related Environments

1
Zijin School of Geology and Mining, Fuzhou University, Fuzhou 350108, China
2
School of Civil Engineering, Changsha University of Science and Technology, Changsha 410114, China
*
Authors to whom correspondence should be addressed.
Materials 2022, 15(13), 4599; https://doi.org/10.3390/ma15134599
Submission received: 15 May 2022 / Revised: 15 June 2022 / Accepted: 27 June 2022 / Published: 30 June 2022

Abstract

:
Geopolymers have attracted extensive attention in the marine environment because of its special reticulate nanostructure. Gel evolutions of copper tailing-based green geopolymers were studied under air, deionized water, seawater, freeze–thaw cycle and carbonization environments. Their mechanical properties and microstructures were characterized by compressive strength measurement, X-ray diffraction (XRD), Fourier-transform infrared spectroscopy (FTIR), nuclear magnetic resonance (NMR) and scanning electron microscopy (SEM). It was found that the deionized water and natural marine water exposure promoted the evolution degree of geopolymers and improved their compressive strength, while exposure to the carbonization environment weakened the gel evolution and decreased the cross-linking degree of the Sodium aluminosilicate hydrate (N-A-S-H)gel structure, resulting in a decline of compressive strength. The geopolymer exposed in the freeze–thaw cycle exhibited the worst deterioration due to the expansion caused by the crystallization in the geopolymer. These results are essential and beneficial to further understanding the gel formation process in various marine environments and could promote the investigation of green concrete.

1. Introduction

Geopolymer is an amorphous material of three-dimensional (3D) microstructure in the composition of M2O∙mAl2O3∙nSiO2, where M represents alkali metals, m ≈ 1 and 2 ≤ n ≤ 6 [1]. The reactions in the geopolymeric process include decomposition, recombination, polymerization, condensation and solidification. Although Davidovits defended that geopolymers differ from alkali-activated materials (AAMs) in chemistry, molecular structure, long-term durability, etc., plenty of works use the term geopolymer when dealing with AAMs, even in high-calcium alkali-activated systems [2,3]. Geopolymers are mainly studied in the application of green concrete materials for the replacement of ordinary Portland cement (OPC) material [4,5,6], although there are other particular applications of geopolymers that are also interesting, for example, the synthesis of waste-based materials into marine concrete geopolymers [7,8,9].
Compared with normal concrete, marine concrete endures damage from physical forces (e.g., wind load and the impact of waves and currents) and chemical corrosions, which are mainly from chloride and carbide penetration and the corrosion of steel bars, as well as the crystallization of salts in the marine environment. These effects cause cracking and deterioration of the steel bars under freeze–thaw circles [10]. Therefore, the geopolymer has attracted extensive attention due to its superior mechanical characteristics and higher resistance in the marine environment than OPC concrete. The 3D microstructure and compacted tetrahedral-silica and aluminum-structure inner geopolymers enables them to resist exotic physical force and chemical corrosion. Wu et al. [9] successfully synthesized geopolymers under the marine environment with metakaolin and copper slag reprocessing tailings; meanwhile, they found the chemical characteristics of geopolymers were much improved due to the changing Si/Al ratio in the micro-structure, promoting the geopolymerization process. Besides, Tennakoon et al. [11] pointed out that the Cl diffusion coefficient in geopolymers was much lower than in OPC concrete even under an extended test period. The reinforced bar embedded in geopolymers also displayed higher corrosion resistance than the OPC concrete. After investigating the impact of ions on the performances of geopolymers, Xie et al. [12,13,14] confirmed that the Cl, Mg2+ and SO42− had little influence on the rheological and mechanical properties of geopolymers as compared with OPC. Moreover, previous studies reported that the fly ash and slag among the aluminosilicate minerals and industrial wastes could effectively improve the compressive and freezing resistance of the geopolymer, and the slag performed better than the fly ash. This was attributed to the large amount of Ca in slag, which would generate a new hydration product, calcium silicate hydrate (C-A-S-H)gel, and fill in the geopolymer structure, giving the geopolymer a higher density and contributing to its strength development [15]. Thus, slag has attracted more and more attention in the area of geopolymer preparation and application. Recently, the fast development and utilization of mineral resources discharged amounts of tailings and slag, and China’s tailing and slag stockpile reached more than 19.5 billion tons according to China’s Mineral Resources Conservation and Comprehensive Utilization Report (2018) [16]. The massive amount of tailings and slag may cause environmental problems, including the contamination of surrounding air, water bodies and soil [17,18]. Therefore, it is urgent and necessary to reprocess the tailings and slag to reduce their adverse effects. Tailings and slag usually contain a large amount of aluminosilicate and Ca, making them high potential geopolymer raw materials to prepare marine concrete [8]. However, the previous studies always explored one certain special aspect of the tailings-based geopolymers [19,20,21]. Few works focused on their geopolymerization processes and microstructure differences under various exposure conditions [22], especially the natural marine environment. Thus, it is much meaningful and essential to study the gel evolution and microstructure variation of the geopolymer under different natural environments, e.g., in the marine environment, to prepare advanced marine concrete.
In this work, copper tailings (CT) and blast furnace slag (BFS) were used to synthesize the geopolymer. Then, an attempt was made to perform the following: (1) study the geopolymerization process and feasibility of using a copper-tailings-based geopolymer as marine concrete, (2) explore the evolution of the mechanical properties and microstructure of a mine-tailings-based geopolymer concrete in different marine related environments (and better study air and deionized water environments as reference phases), and (3) prepare green marine geopolymer concrete using two solid wastes, CT and BFS, through geopolymeric reaction technology(treating waste with waste provides a reference for realizing the consumption of bulk solid waste).

2. Experimental Section

2.1. Materials

CT was obtained from the copper slag reprocessing tailings of Zijin Shan, Longyan, Fujian province, China, BFS from Tangshan iron and Steel smelter in Tangshan, Hebei province, China. Size distribution of CT and BFS was measured by a laser diffraction analyzer (LS-CWM, Omec, Zhuhai, China), in which the d50 and d85 were 16.81 and 36.71 µm for CT, and 11.18 and 26.30 µm for BFS, respectively. Table 1 shows the chemical composition of CT and BFS analyzed by an X-ray fluorescence instrument (XRF, Axios advanced, PANalytical B.V., Almelo, The Netherlands). The CT mainly contains SiO2 (28.19%) and Fe2O3 (57.83%), while CaO (38.55%), SiO2 (30.57%) and Al2O3 (15.09%) are the main components of the BFS. Figure 1 shows the main phase of the CT and BFS characterized by X-ray diffraction (XRD, D8, Brucker, Karlsruhe, Germany). The CT mainly contains magnetite (Fe3O4, PDF: 01-075-1609) and fayalite (Fe2O4Si, PDF: 98-001-0116), while BFS shows an amorphous peak at 2θ of 35–45°. Sodium silicate (ACS reagent grade), employed as an alkali activator, was bought from Aladdin Chemical Reagent (Shanghai, China) in the geopolymeric process. Deionized water was used in the whole process.

2.2. Methods

To synthesize the geopolymer, sodium silicate solution (6.17 M) was used as an alkaline activator and mixed with raw materials for 10 min. The raw materials included 30 g of CT and BFS, in which BFS proportions varied from 30% to 70%. Subsequently, the mixture was poured into cubic steel molds (30 mm × 30 mm× 30 mm), vibrating to liberate air bubbles on a vibration table for 3 min. Next, the molds were sealed with plastic bags and cured at 60 °C for 6 h and left at room temperature for 7 days to complete the hydration process and obtain initial geopolymers. After that, the initial geopolymers were exposed to five typical environments for 28 days: (1) in the air; (2) in deionized water; (3) in seawater; (4) in freeze–thaw seawater cycles, i.e., geopolymers were alternately exposed to seawater at room temperature for 12 h and 12 h in a freezer (−18 °C), and (5) concrete carbonation box (Temperature ±20 °C, humidity ±70%, CO2 concentration ±20%). The compressive strength of the geopolymers was analyzed by a compression tester (YAW-300, Jinan, China).

2.3. Characterizations

The compressive strength of the geopolymers was analyzed by a YAW-300 compression and flexure machine from Jinan Tianchen manufacture (Jinan, China). The morphology and microstructure of the geopolymers were characterized using a scanning electron microscope (SEM, Quanta 250, FEI, Hillsboro, OR, USA) and XRD diffractometer. The geopolymer was ground to less than 75 μm to prepare specimens for XRD measurements, in which Cu-Ka1 radiation and a scanning rate of 0.1°/s from 5° to 90° of 2θ were used. The geopolymers were studied using a Fourier-transform infrared (FTIR, Nicolet, Thermo Fisher Scientific, Waltham, MA, USA) spectroscopy, of which transmittance spectra were obtained over a wavenumber of 400–4000 cm−1; the 29Si nuclear magnetic resonance (NMR) spectra of the geopolymers were obtained via NMR spectroscopy (Bruker AVANCE III), whereby powdered samples were packed into 7 mm ZrO2 rotors. The spectra were acquired at spinning speeds of 12 kHz with peak positions referenced to an external standard of tetra-methylsilane (TMS). The lack of spectral resolution for silicon in geopolymers was overcome by implementing Gaussian peak deconvolution to separate and quantify Qn (mAl) species (0 ≤ m ≤ n ≤ 4, m, n = integer).

3. Results and Discussion

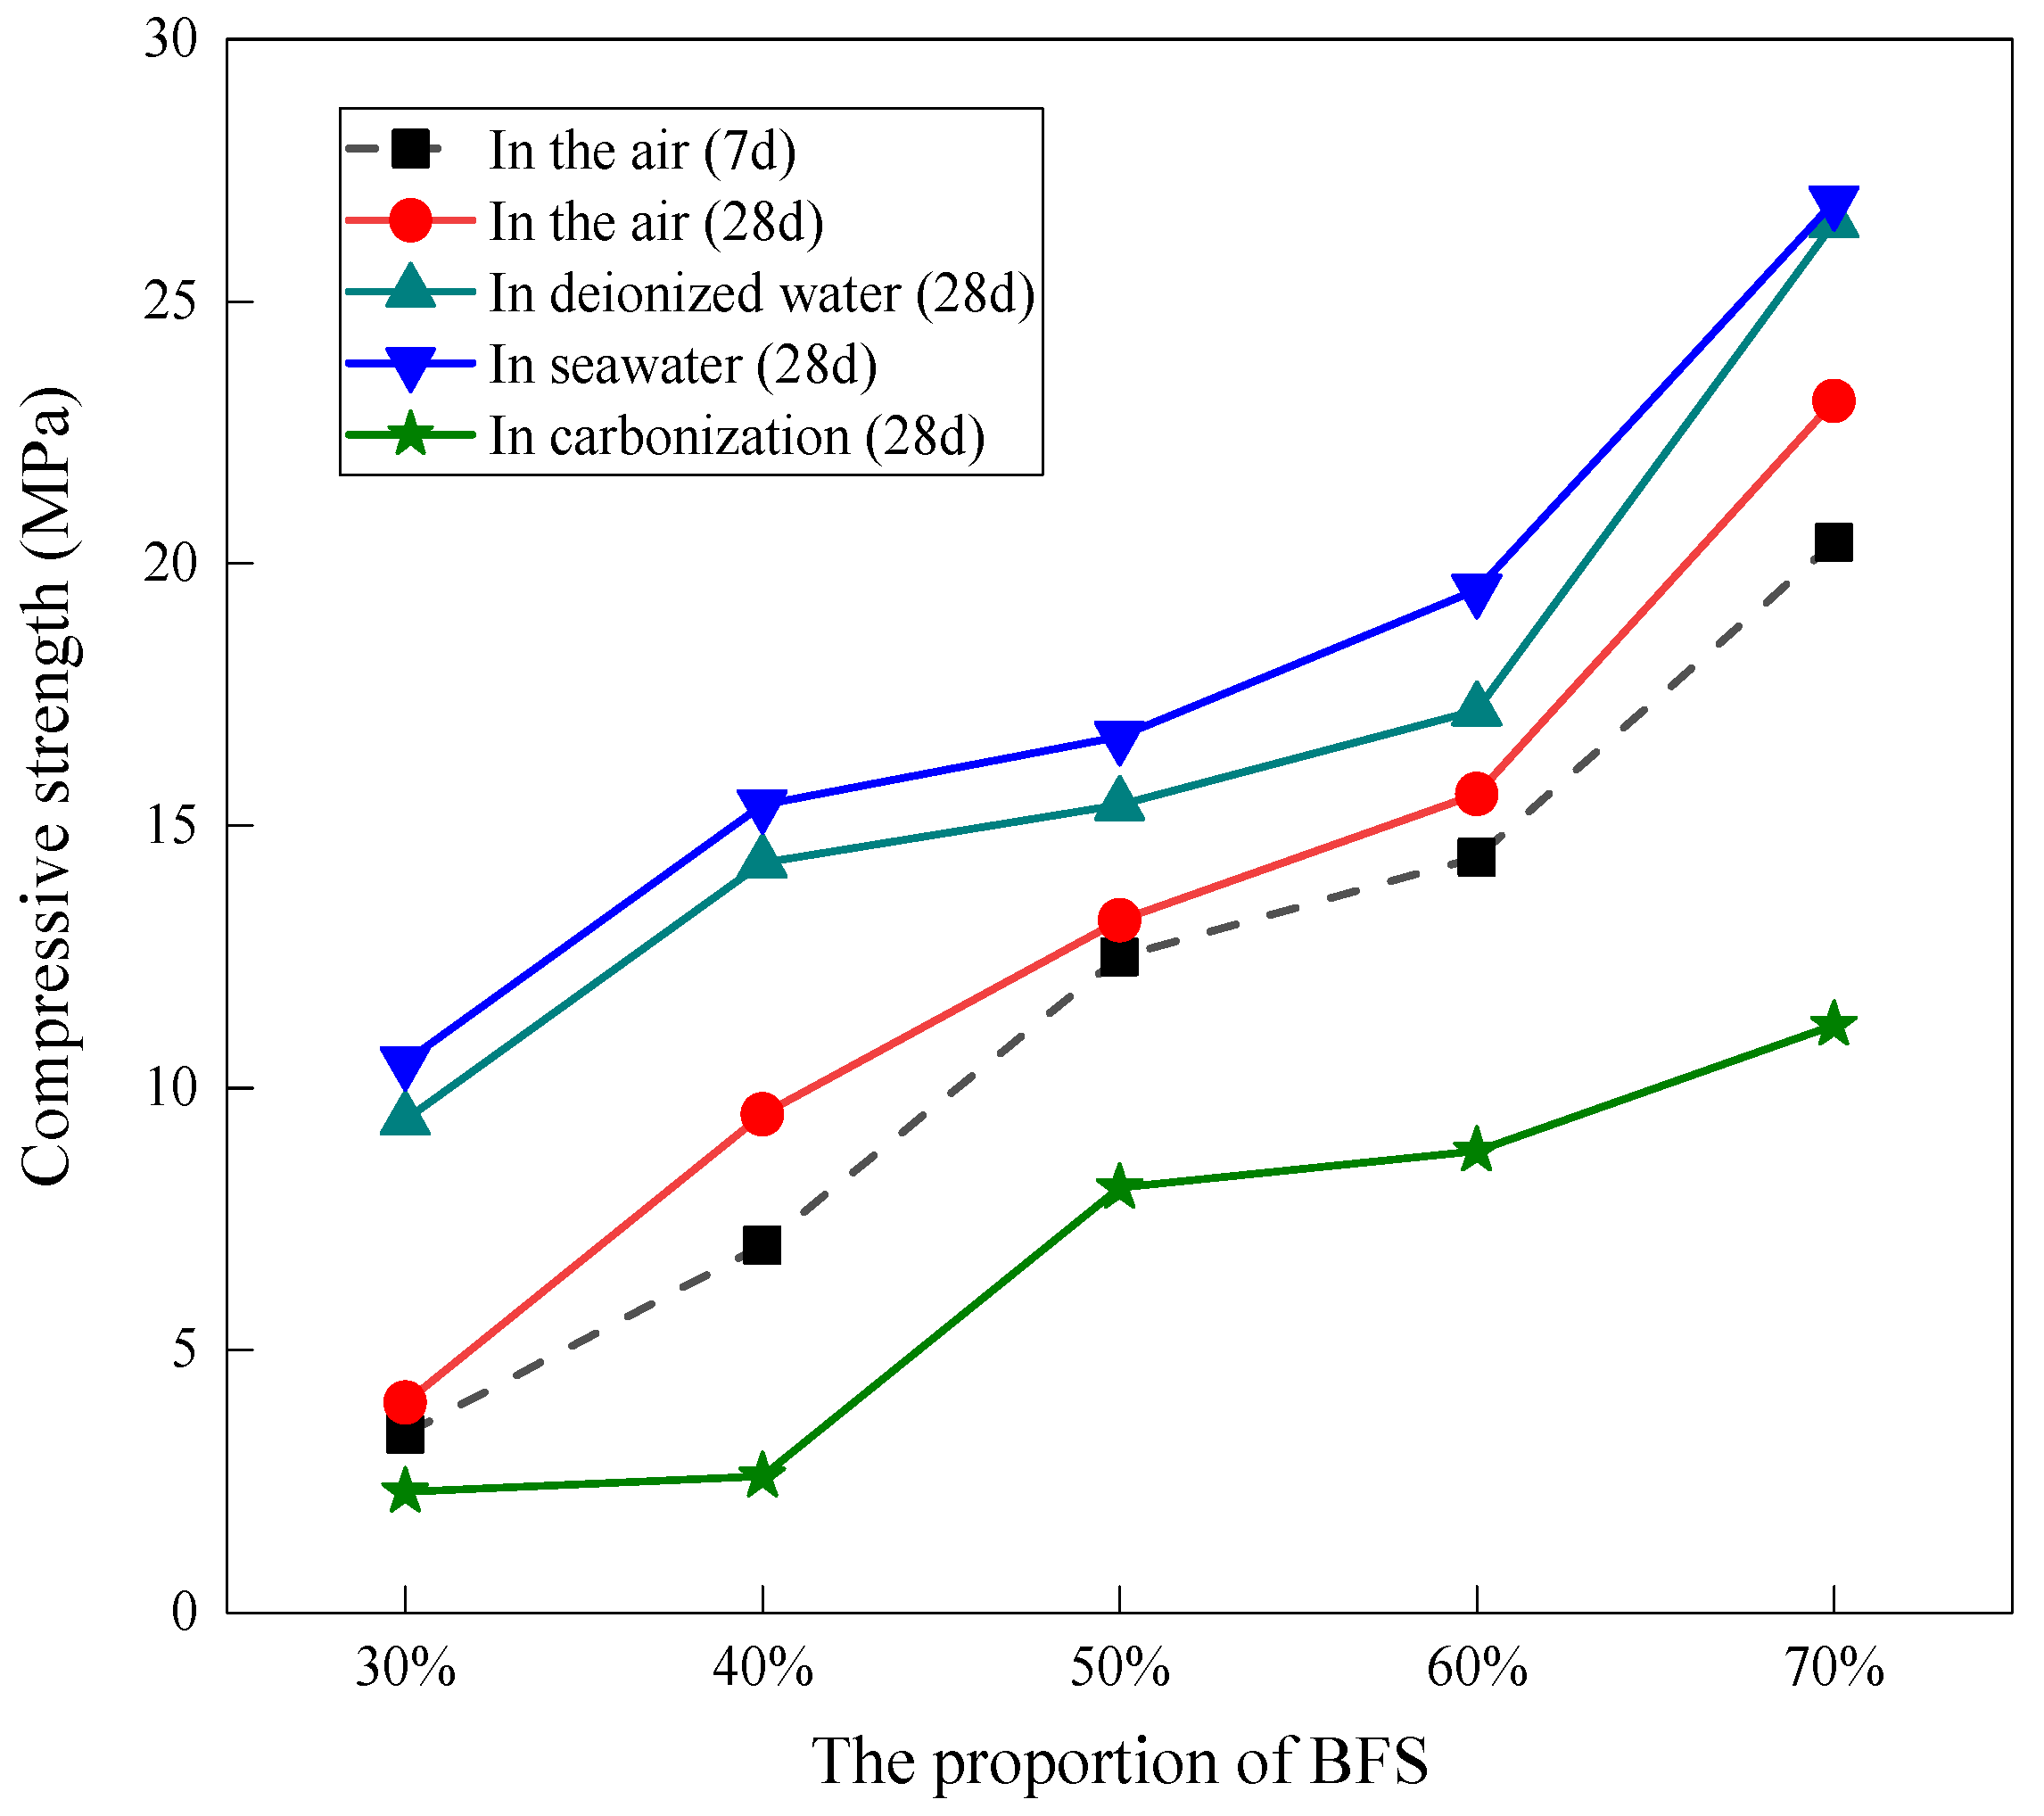
3.1. Compressive Strength

Figure 2 shows the compressive strength of geopolymers prepared with varying proportions of BFS in different exposure conditions. The initial geopolymers, cured for 7 days in the air, had compressive strengths of 3.4, 7, 12.5, 14.4 and 20.4 MPa as the proportion of BFS varied from 30 to 70%, respectively. This is attributed to the high pozzolanic reactivity of the aluminum and silicon components in the BFS, thus offering more precursors and generating more CaO-Al2O3-SiO2-H2O (C-A-S-H) and (Na, K)2O-Al2O3-SiO2-H2O (N-A-S-H) in the geopolymer with higher BFS content. Compared to the initial geopolymers, the compressive strength of the geopolymers, irrespective of the content of BFS, slightly increased after 28 days of exposure to air. This indicates that the geopolymeric reaction hydrated rapidly in the initial 7 days, which is consistent with a high early-age geopolymer compressive strength, as observed in other studies [22]. When geopolymers were exposed to deionized water for 28 days, the compressive strength increased significantly to 9.4, 14.3, 15.4, 17.2 and 26.5 MPa with 30, 40, 50, 60 and 70% BFS addition, respectively. Compared to exposure to deionized water, the compressive strength of the geopolymers exposed to seawater for 28 days further increased to 10.5, 15.4, 16.7, 19.5 and 26.9 MPa with 30, 40, 50, 60 and 70% BFS addition, respectively. However, the geopolymers exposed to the carbonized environment for 28 days exhibited the lowest compressive strength regardless of the curing age and BFS content. It is worth noting that the geopolymer exposed to the freeze–thaw seawater cycle showed the most severe deterioration, which failed to be subjected to a compressive strength measurement. Several factors could be responsible for these results. Firstly, the geopolymers exposed to an environment with water (deionized water and seawater) favored stability and mitigated the shrinkage of the geopolymers, thereby reducing the generation of harmful cracks and improving the compressive strength [23]. Secondly, in the carbonized environment, the intrusion of acidic CO2 decreased the alkalinity of the pore solution in the geopolymers since it reacted with the alkaline activator, hindering the geopolymeric reaction from further proceeding , thus lowering the compressive strength. The chemical equations can be expressed as Equation (1). Finally, the variation in the physicochemical environment may be related to the nanostructural and physical property changes, which governed the compressive strength changes of the geopolymers.
Ca ( OH ) 2 + H 2 O + CO 2 CaCO 3 + 2 H 2 O

3.2. Microstructure Characterizations

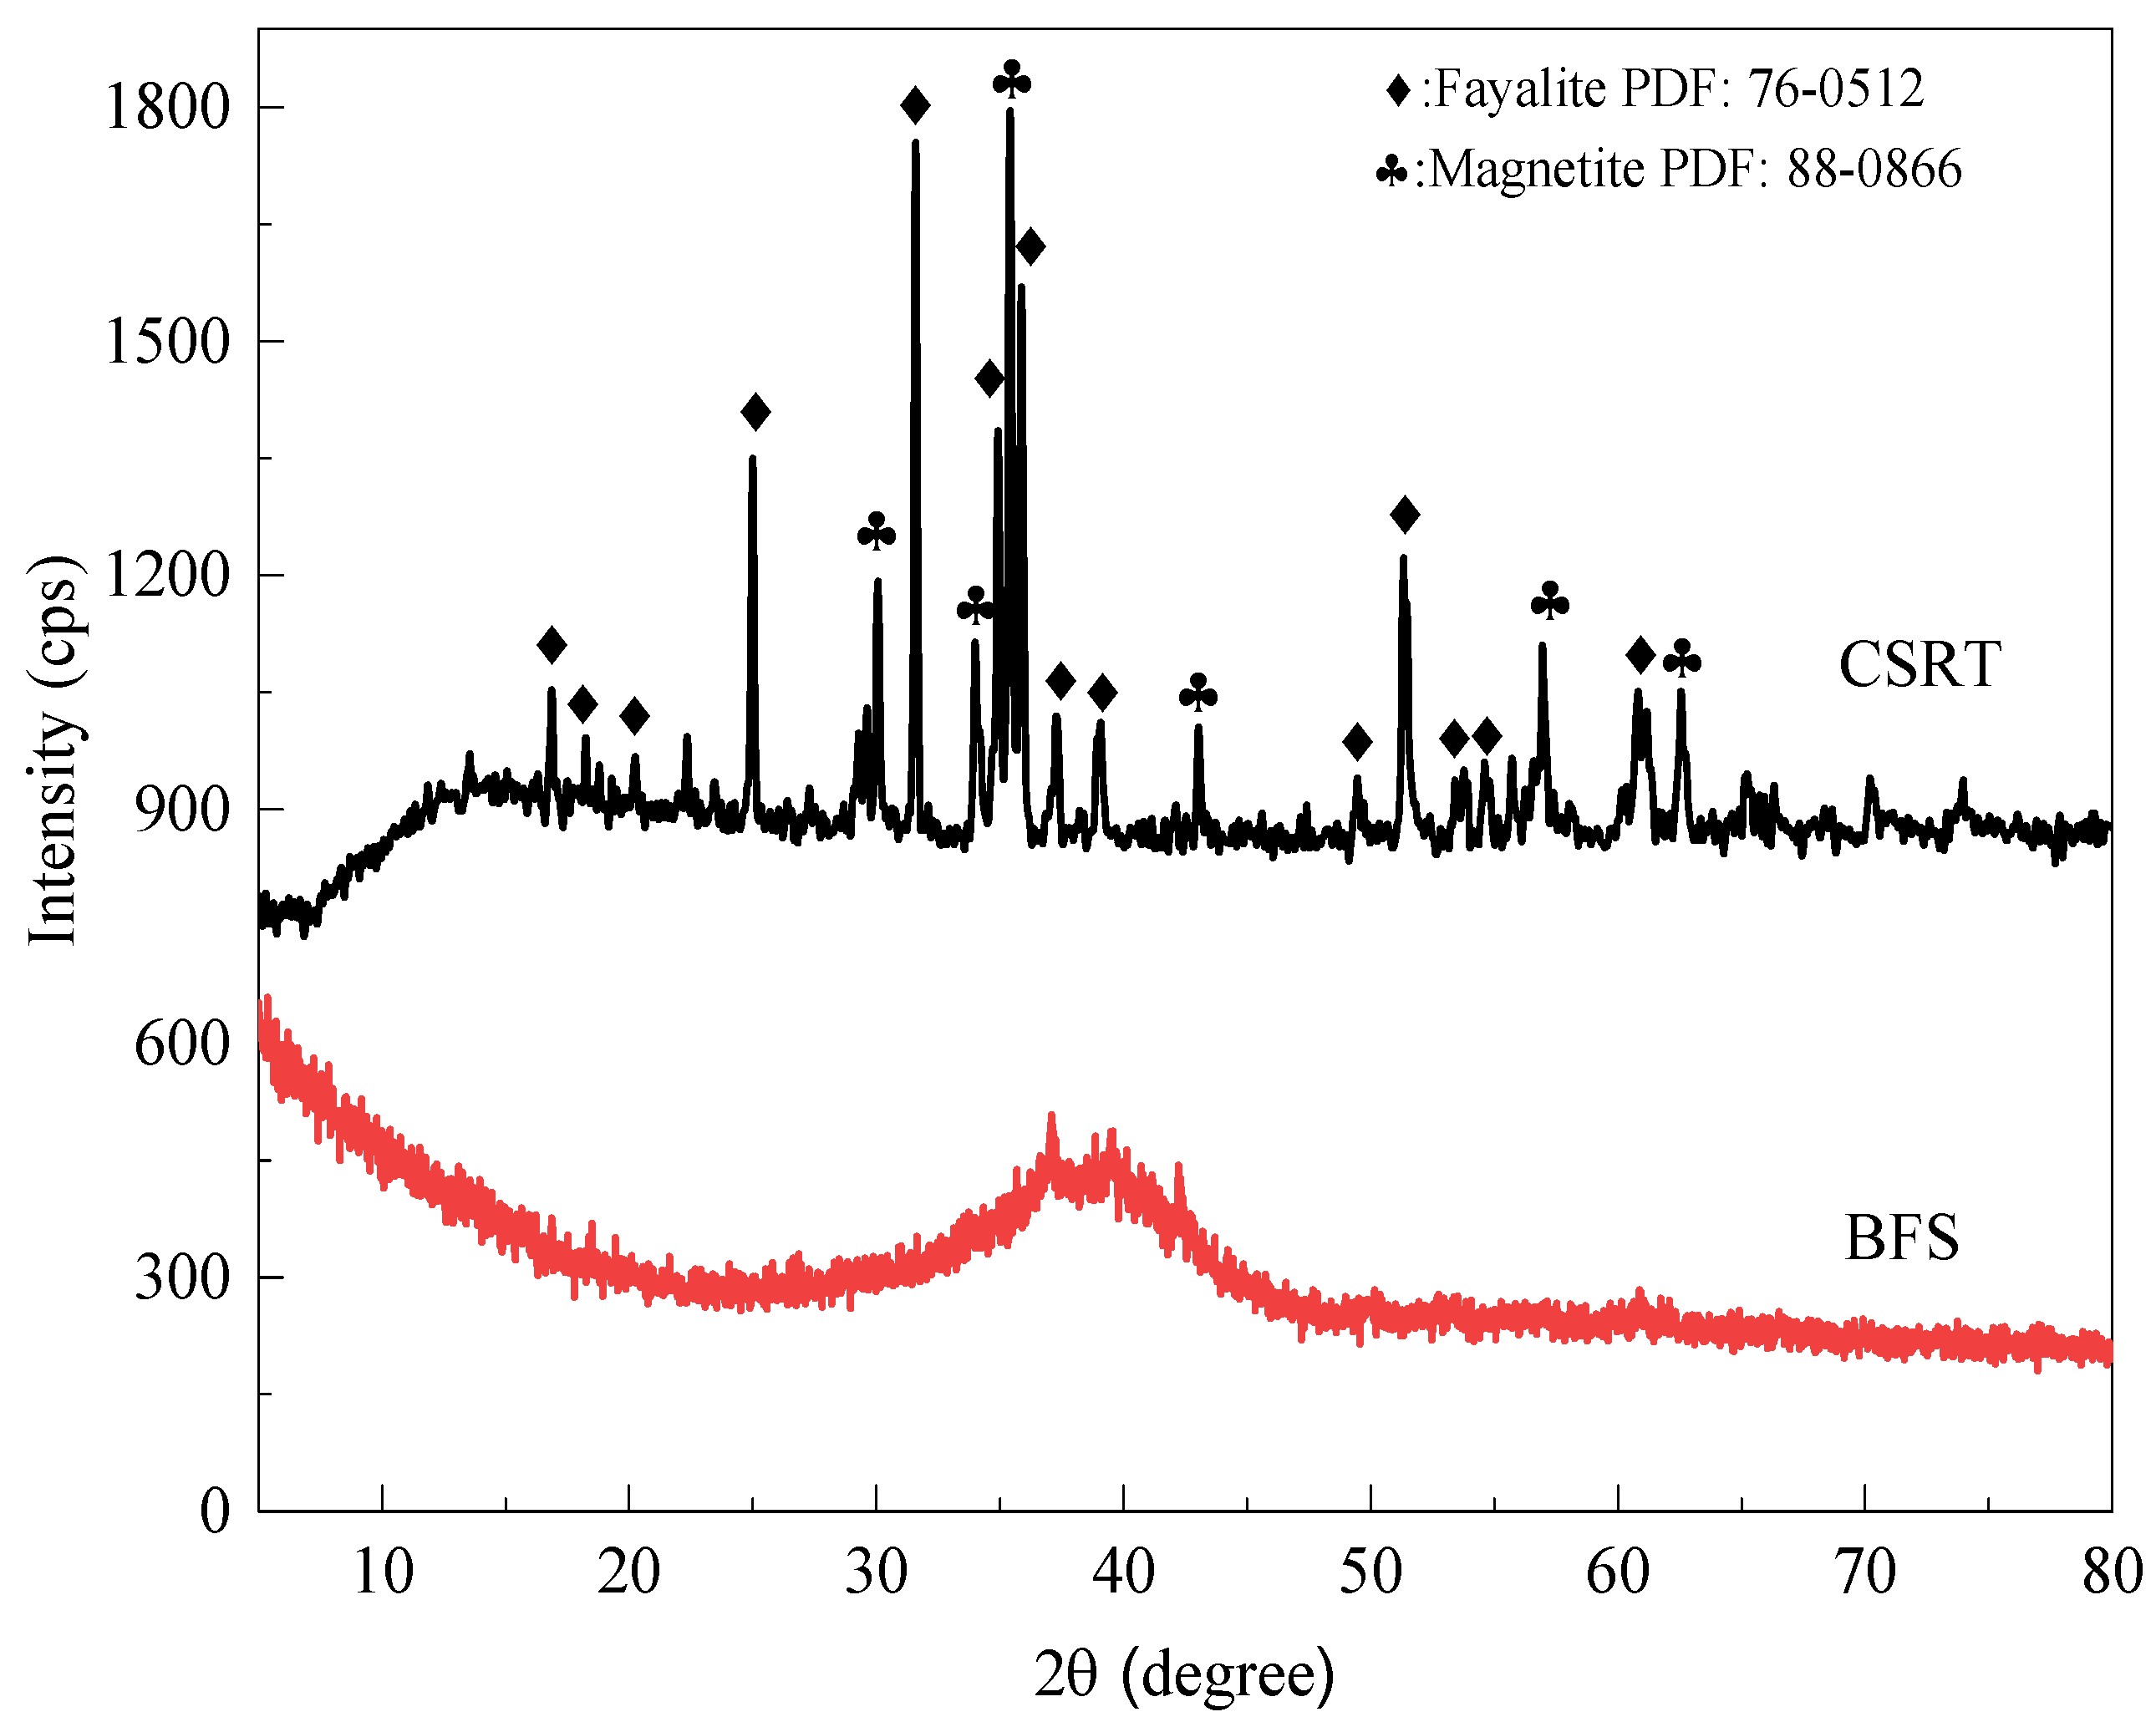
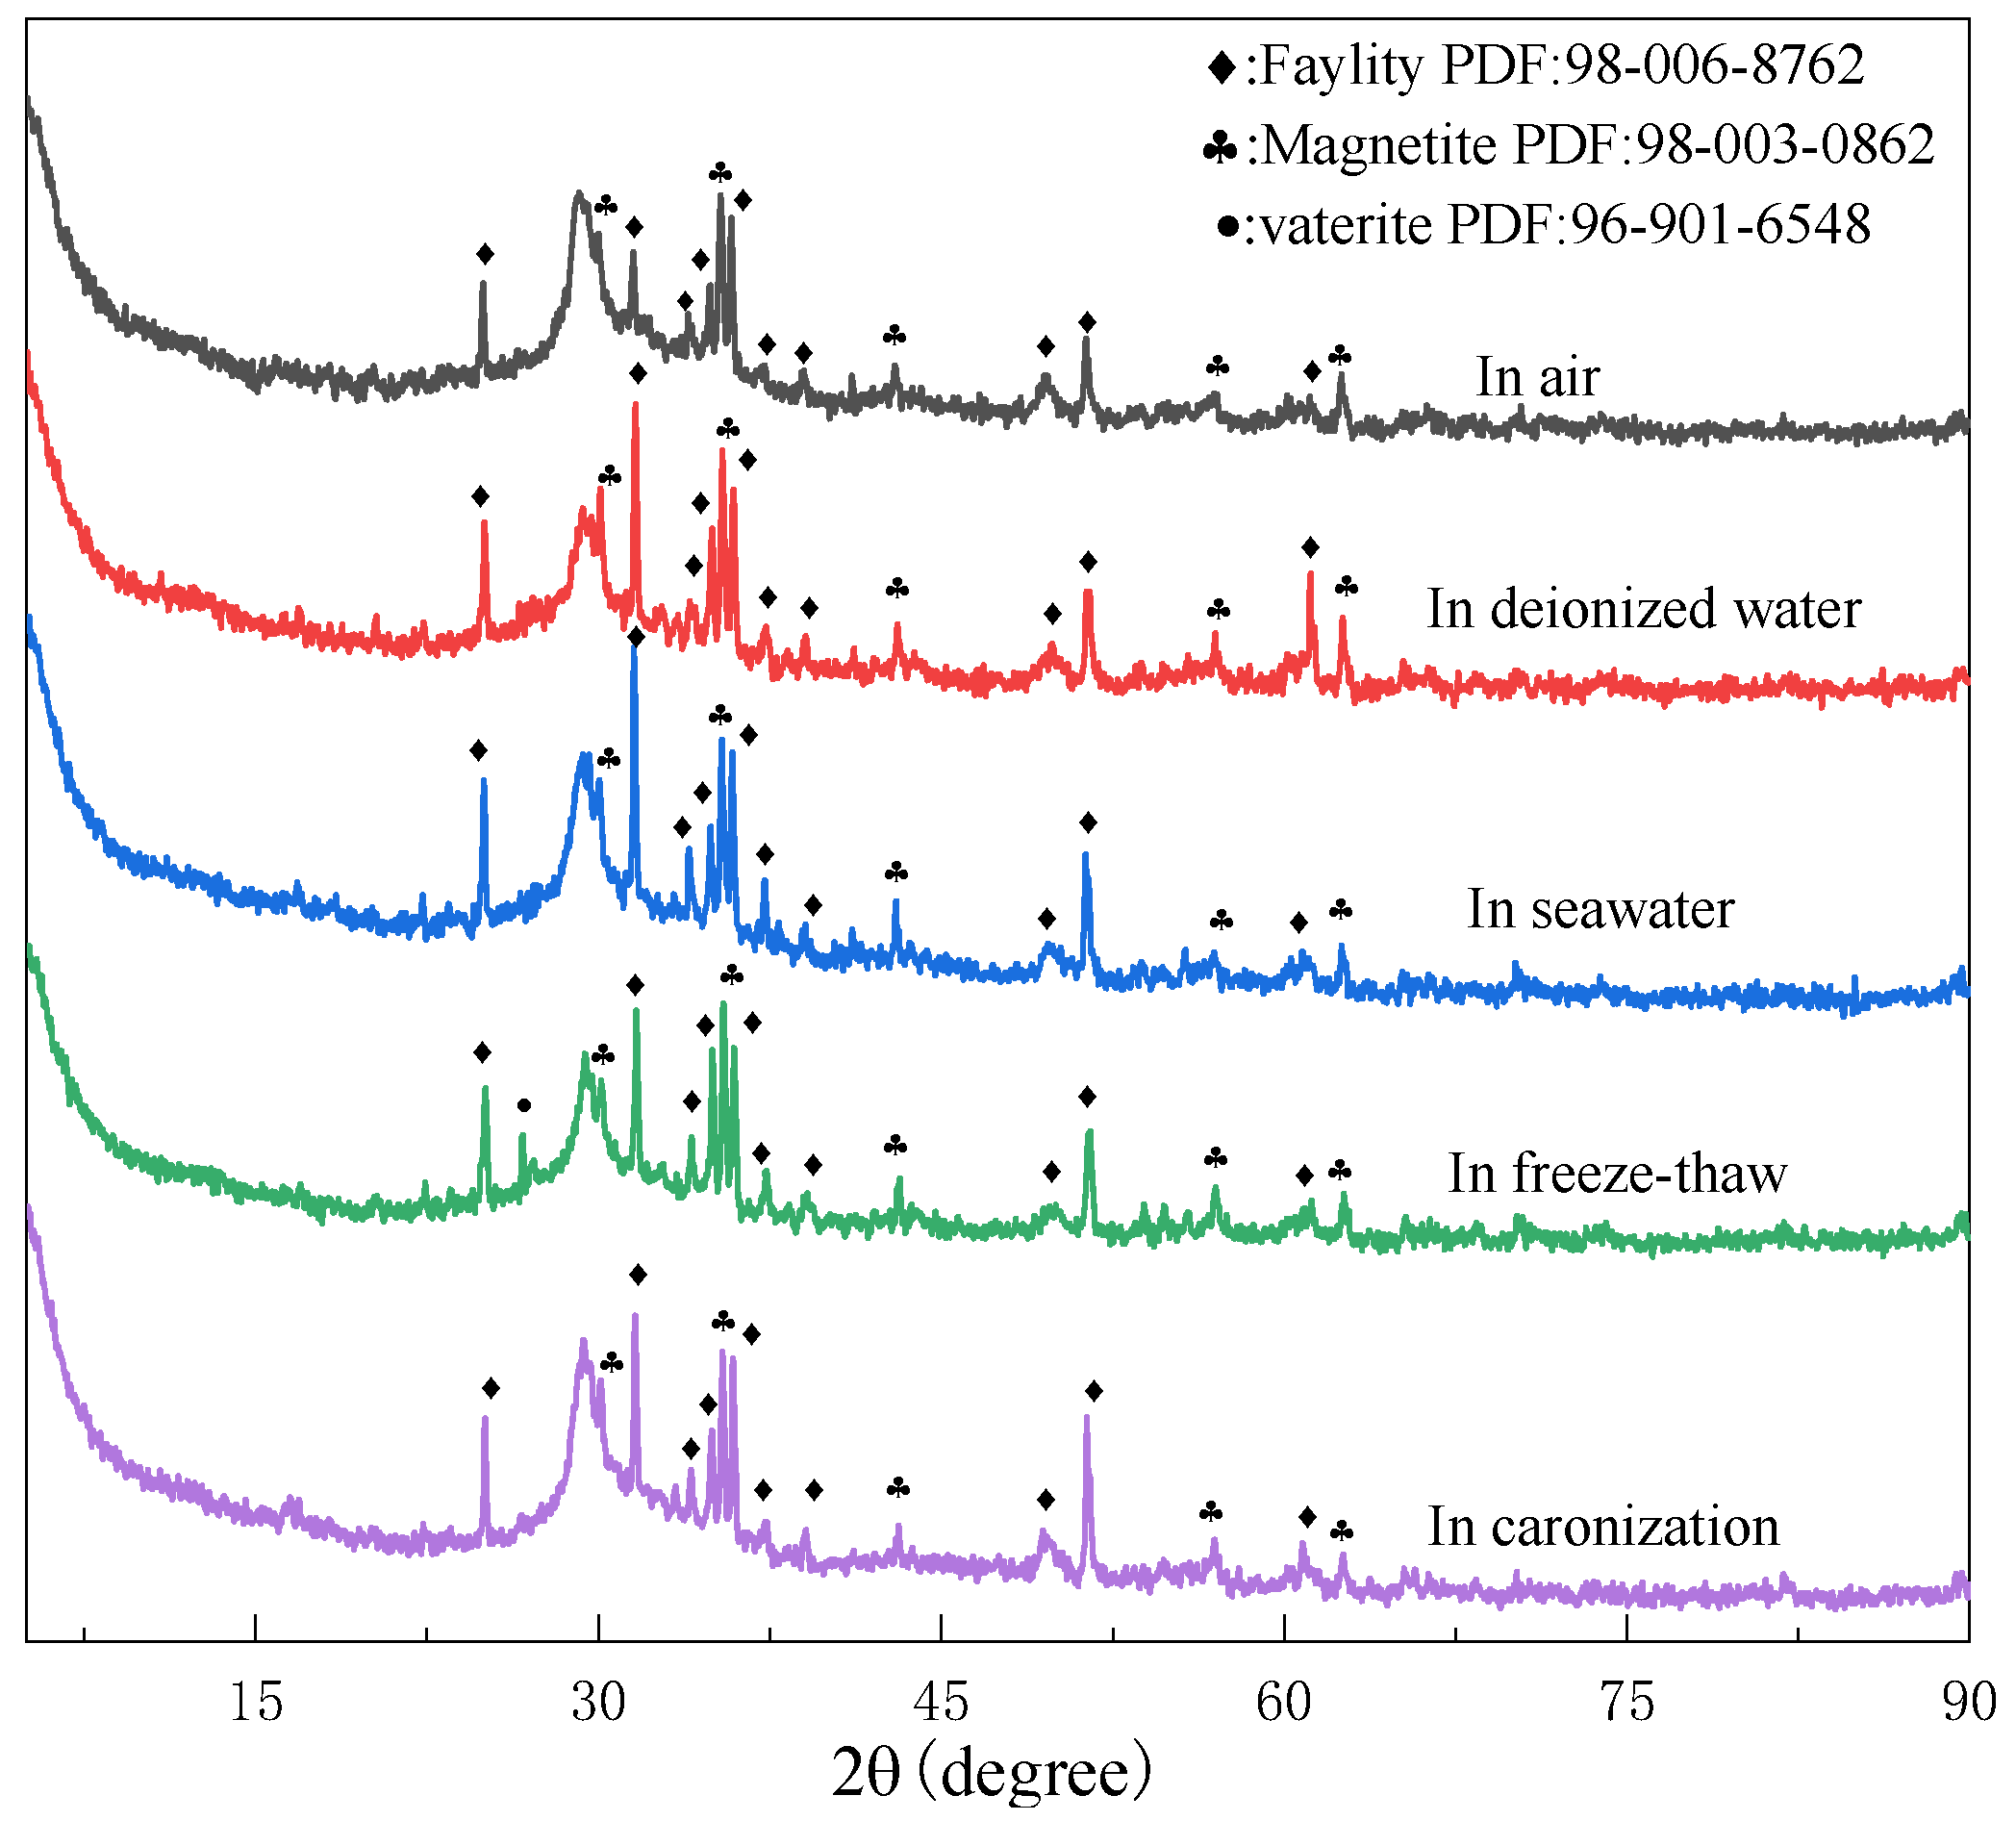
3.2.1. Phase Transformation

The XRD patterns of the geopolymers prepared with 60% BFS subjected to different exposures for 28 days are shown in Figure 3. Compared to the XRD patterns of the raw materials, the crystal phase from the CT remained in the geopolymers, whereas the amorphous peak (2θ of 35–45°) from the BFS disappeared. Instead, a semi-crystal phase at 2θ of 29.3 was formed, which is the characteristic peak of the C-(A)-S-H gel [24,25]. Differently, a newly formed phase at 2θ of 27°, which is assigned to vaterite (Ca4C4 O12, PDF: 96-901-6548), was found in the geopolymer exposed in the freeze–thaw cycle. This may be due to the dissolved matter in the seawater precipitating and crystallizing when the water freezes in the geopolymer capillaries in the process of the freeze–thaw cycle [26], which might be related to the severe deterioration of the geopolymer exposed to the freeze–thaw cycle. In our previous study [27], significant peaks for the NaCl crystal phase exhibited in the XRD of the geopolymer exposed to artificial seawater. However, in the present study, few peaks in the NaCl crystal phase were found. This may be because the natural seawater is of a lower salt concentration compared to the artificial seawater. To shorten the experiment period, a high concentration of NaCl solution (5–10 fold of standard seawater) was used to accelerate the corrosion of the geopolymer matrix. From the XRD analysis, one can conclude that the natural seawater has little influence on the phase transformation of the geopolymer matrix, which indicates the merit of the geopolymer matrix compared to the OPC matrix. When the OPC matrix was exposed to the marine environment, the Ca-bearing phase would react with ions in the seawater to form Friedel’s salt (3CaO·Al2O3·CaCl2·10H2O) [27], Kuzel’s salt (3CaO·Al2O3·0.5CaCl2·0.5CaSO4·10H2O) [28], Ettringite (3CaO·Al2O3·3CaSO4·32H2O) [29], calcium oxychloride (CaCl2·3Ca(OH)2·12H2O) [30], and magnesium-silicate-hydrate (M-S-H) [31], and subsequently deteriorate the OPC concrete.

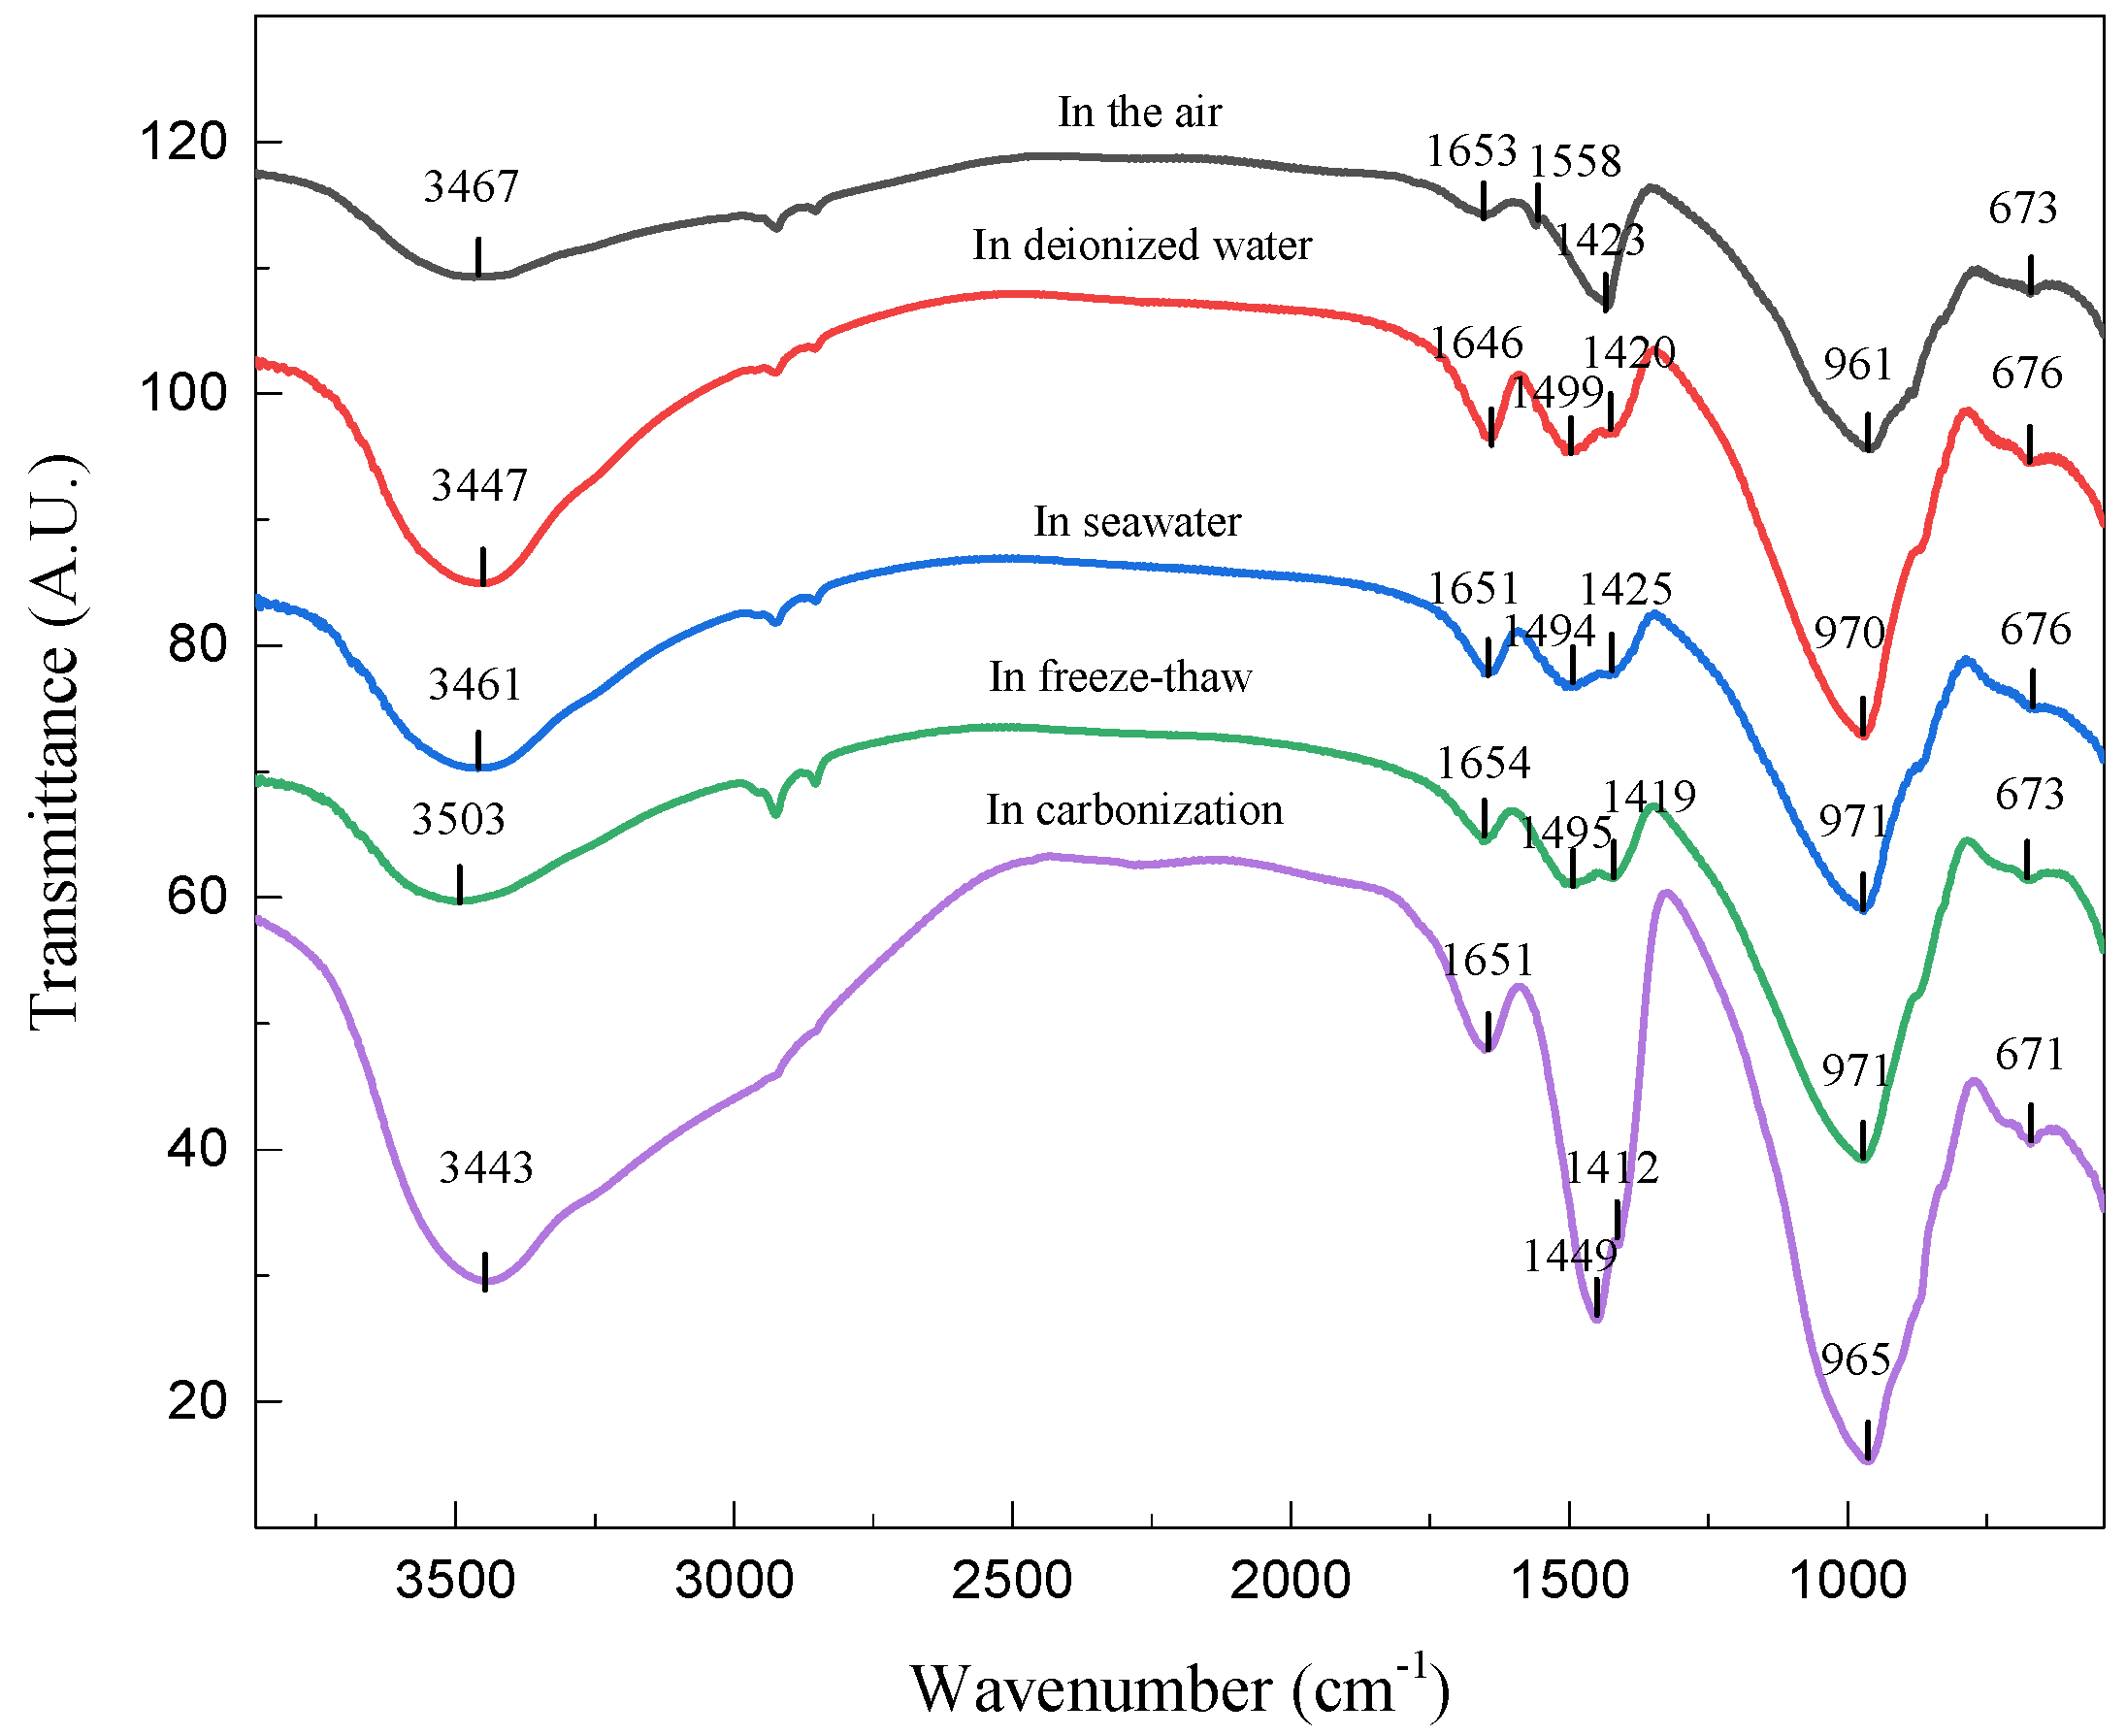
3.2.2. FTIR Analysis
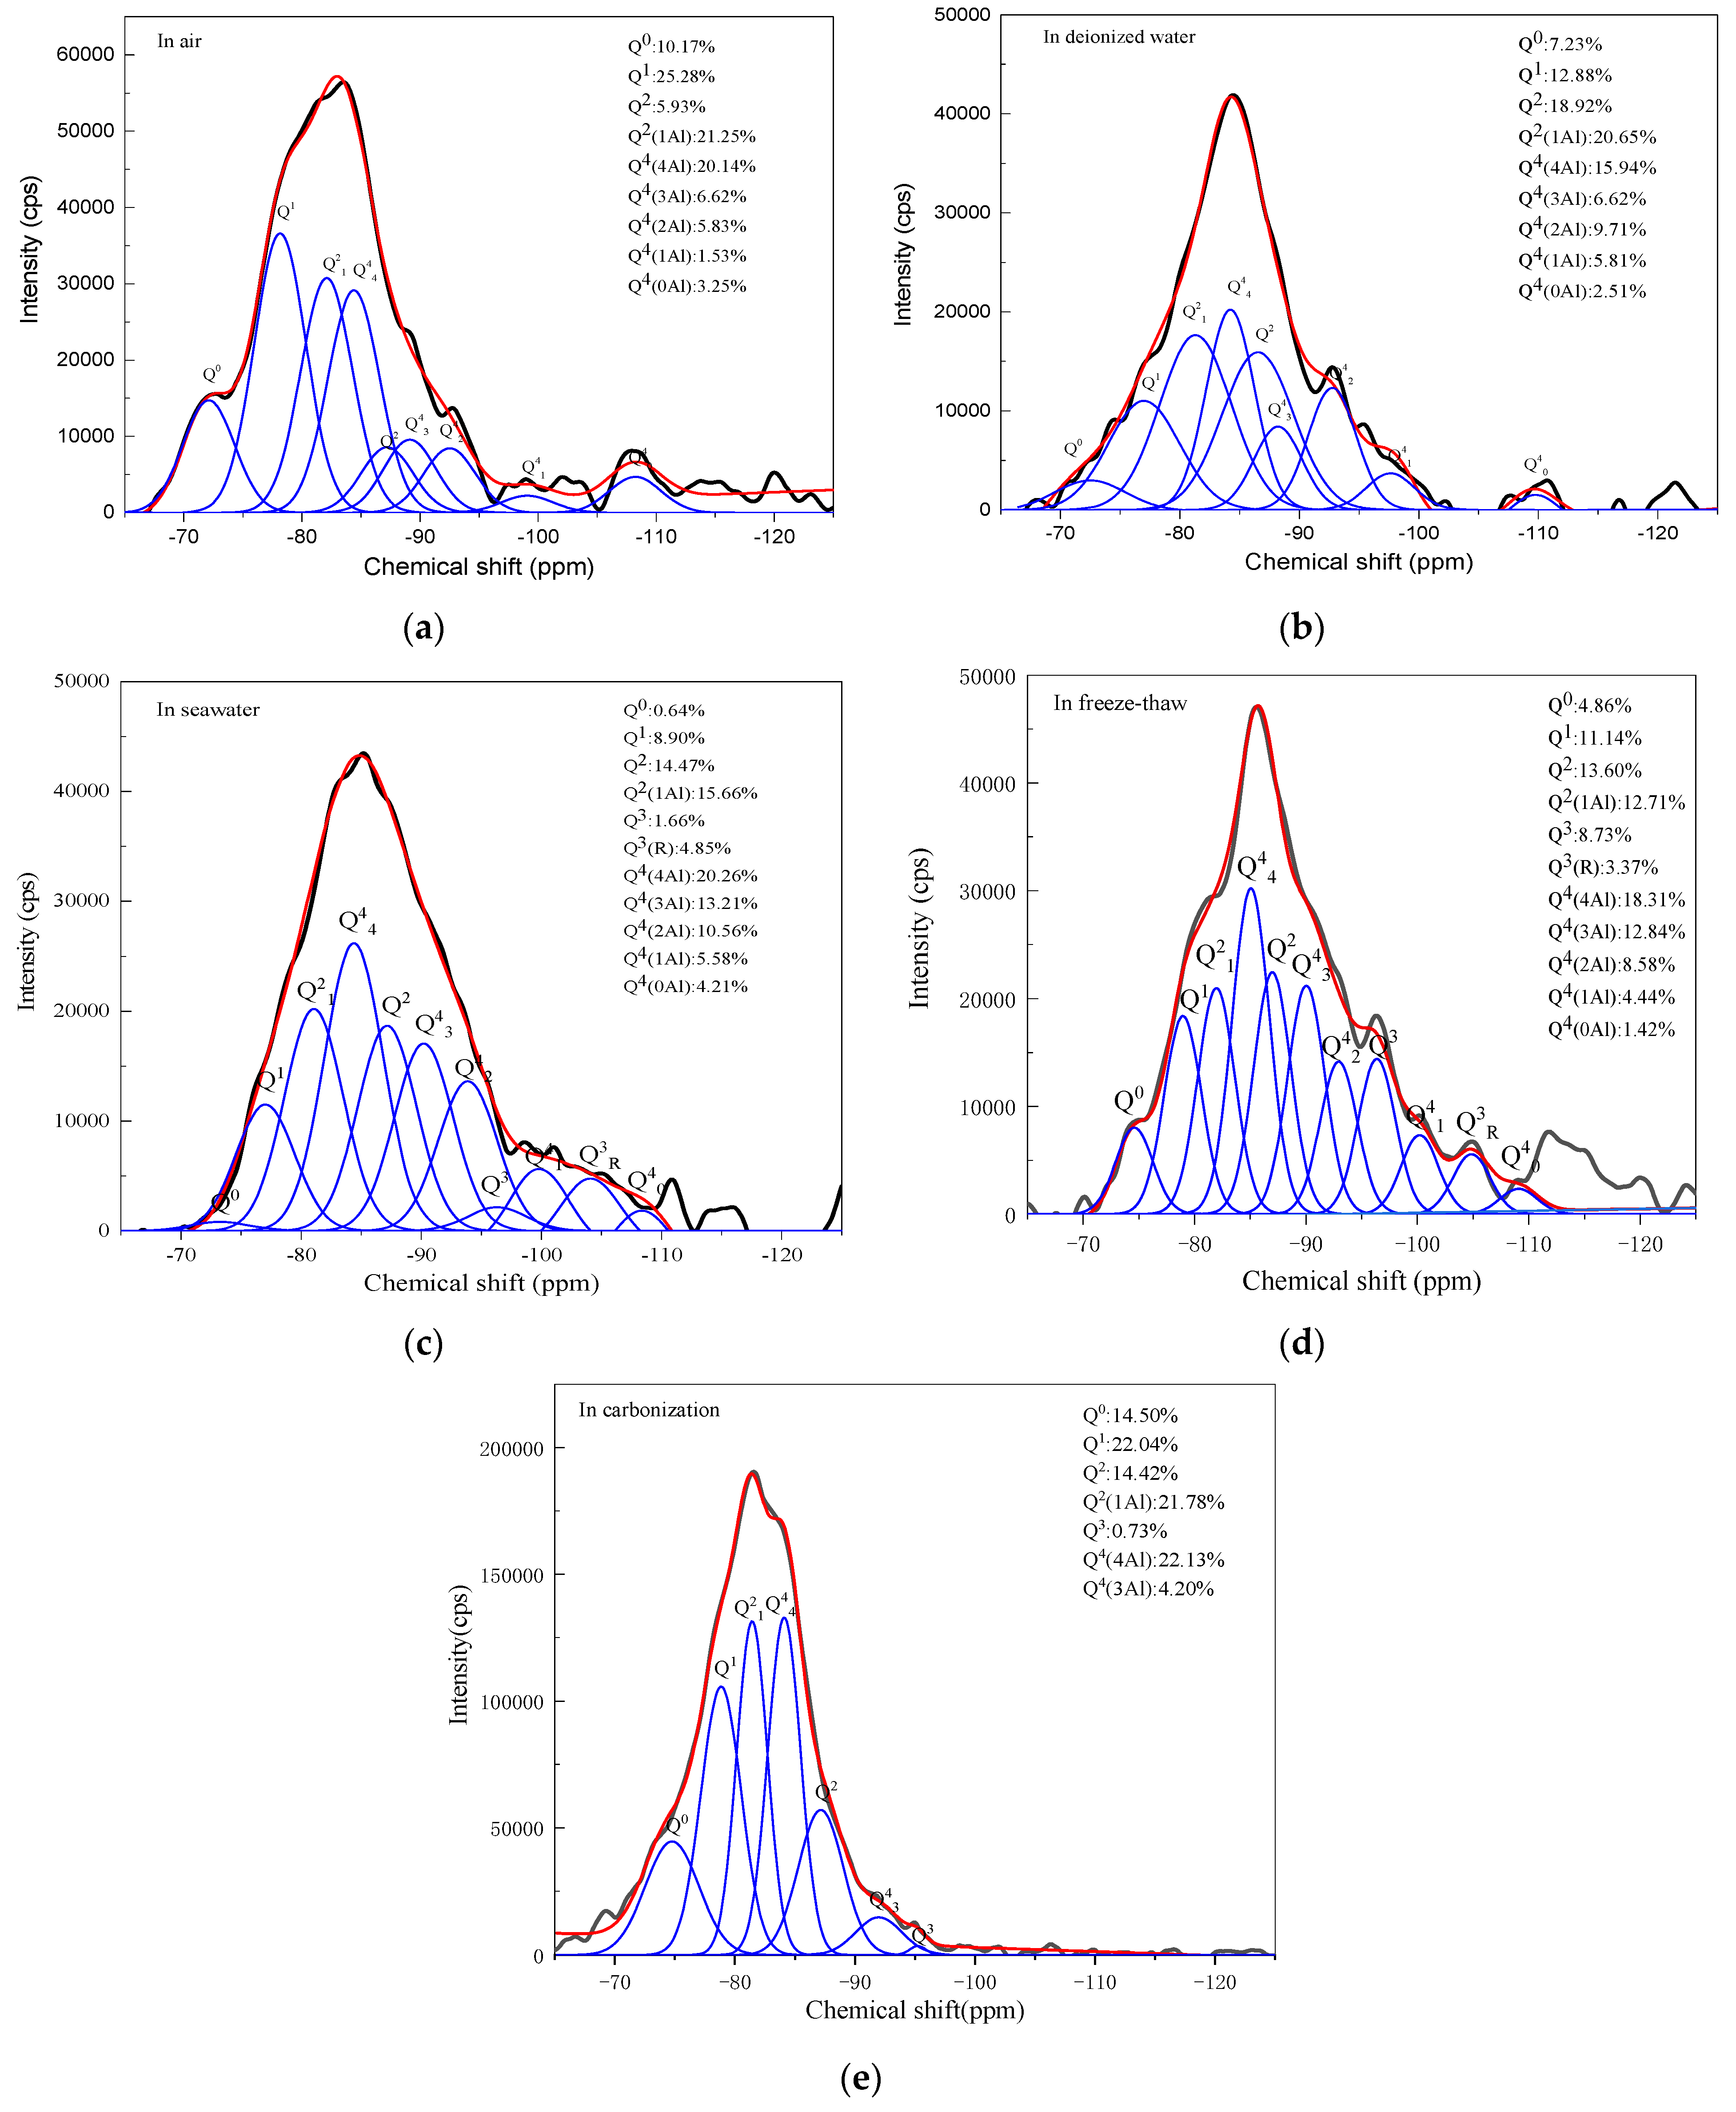
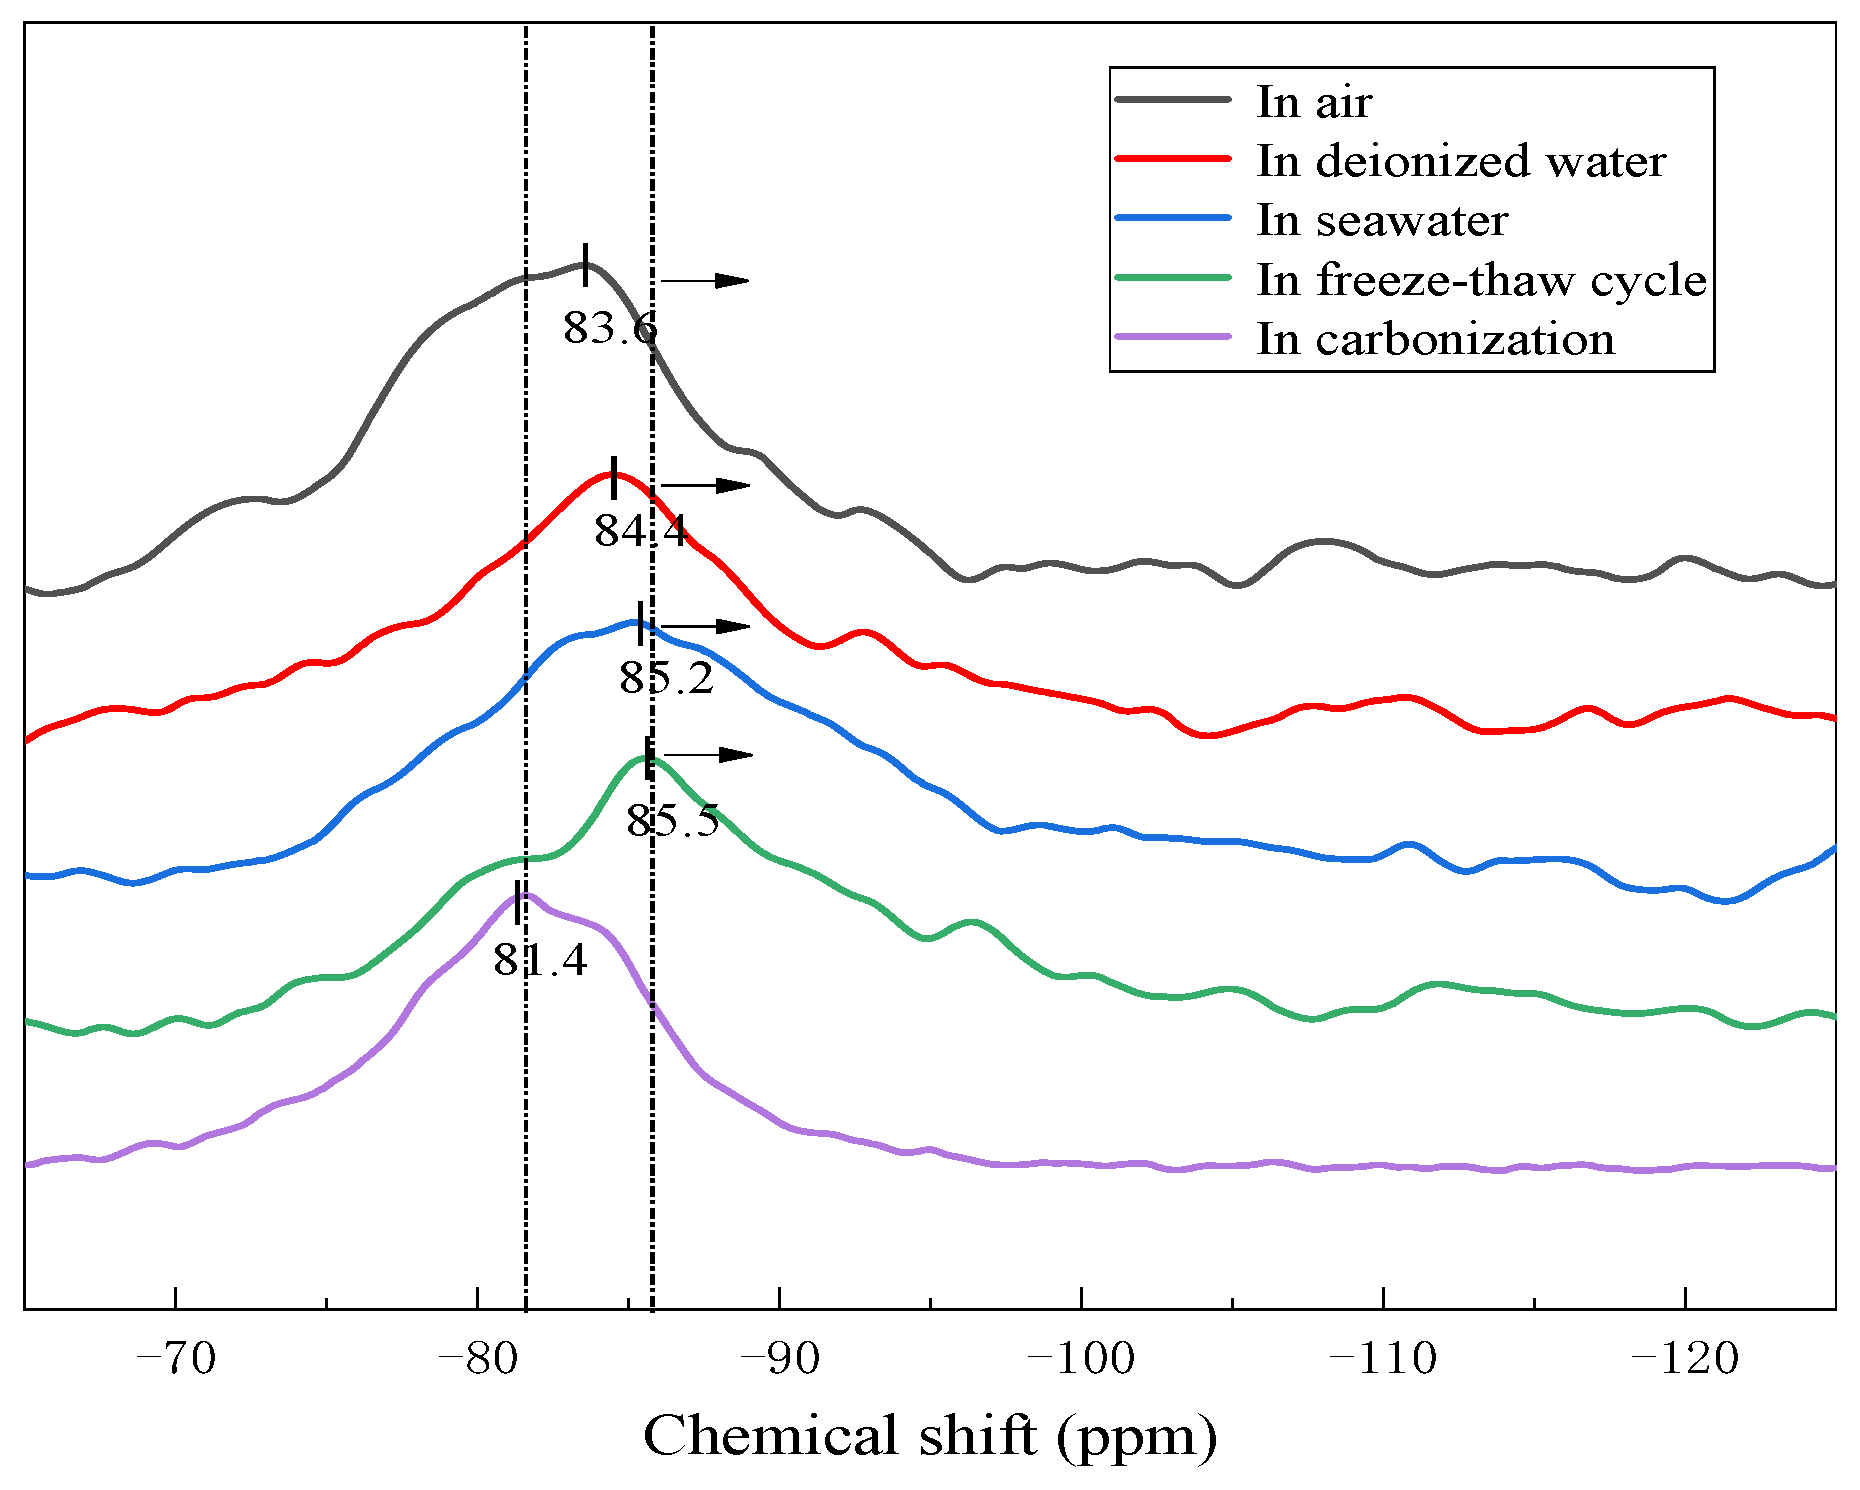
Figure 4 shows the FTIR spectra of the geopolymers prepared with 60% BFS subjected to different exposures for 28 days. The absorption peaks at 3440 cm−1 and 1650 cm−1 are related to the stretching vibrations of the OH and H-OH bonds in the free water, respectively, corresponding to adsorbed H2O in geopolymers [32]. The absorption peak around 1420 cm−1 is assigned to asymmetric stretching of the O-C-O bonds in CO32− groups due to carbonation in the curing and exposure process of the geopolymers [33]. As can be seen, the absorption peak for the O-C-O bond is much more intense in geopolymer exposed to the carbonized environment than those in other environments. The peak at 673 cm−1 is attributed to the Si-O bonds in quartz, suggesting the quartz particles are insoluble in the geopolymeric reaction [34]. The band at about 970 cm−1 is the Si-O-T bonds (T represents the tetrahedral Al or Si) in the geopolymer gel [35]. The wavenumber transformation indicates that the varying exposure changed the C(N)-A-S-H gel evolution.

3.2.3. NMR Analysis

For further characterization of the nanostructure change in the geopolymers with different exposures, NMR spectroscopy was used to characterize the short-range ordering and molecular structure of the geopolymer [6,36]. It employs Gaussian peak deconvolution to overcome the lack of spectra resolution and to separate and quantify Qn(mAl) species (0≤ m ≤ n ≤ 4, m, n = integer). The resonances at −74, −79, −87.8 and −96.4 ppm are assigned to Q0, Q1, Q2 and Q3, presented in the binder C-(A)-S-H, respectively [37]. In N-A-S-H gel, the Q4(4Al), Q4(3Al), Q4(2Al), Q4(1Al) and Q4(0Al) resonate at around −84, −89, −93, −99 and −108 ppm, respectively [25,38]. The resonance at −104 ppm represents Q3 (R) when the H in OH is substituted by an alkali metal ion (Na+ or K+) in Q3 [18]. Figure 5 gives the 29Si NMR spectra of the geopolymers prepared with 60% BFS that underwent different exposures. As can be seen, the 29Si NMR spectra of the geopolymers exhibited a broad resonance ranging from δiso −75 to −95 ppm. However, the line shapes of distribution are different. This suggests that the varying structures were exhibited in geopolymers with different exposures.
Figure 6 gives the deconvolution of 29Si NMR spectra of geopolymers prepared with 60% BFS subjected to different exposures. For the geopolymers exposed to air, deionized water and seawater, the Si sites in the silicate monomers (Q0) and silicate dimmer (Q1) are 35.45%, 20.11% and 9.54%, respectively; the Si sites in the C-(A)-S-H (Q2 and Q3) and N-A-S-H gel (Q4) are 64.55%, 79.89% and 90.46%, respectively. The sites in the monomer and dimmer, to some extent, represent the unreacted silica source in the raw materials. Therefore, exposure to the water environment promoted the reaction extent and generated more cementitious gel, thus increasing the compressive strength of the geopolymers exposed to the deionized water and seawater. Compared to air exposure, the geopolymer exposed to the freeze–thaw cycle also exhibited fewer Si sites in Q0 and Q1 (16.00%) and more Si sites in Q2, Q3 and Q4 (84.00%), which was expected to have higher compressive strength. However, the compressive strength exhibited the most severe deterioration. This indicates that the compressive strength deterioration had nothing to do with the change in the chemical properties of the geopolymer (this will be further discussed later). For the geopolymer exposed to the carbonization environment, less N-A-S-H gel was formed than with exposure to the air, deionized water, seawater and heat–cool cycle. On the other hand, Q4(2Al), Q4(1Al), and Q4(0Al) disappeared in the geopolymer exposed to the carbonation environment, whereas the proportion of Q0 and Q1 (36.54%) increased. This indicates that the carbonation environment weakened the geopolymer evolution and decreased the cross-linking degree of the Qn(mAl) species in the N-A-S-H gel. It is worth noting that the proportion of Q4(4Al) (22.13%) still retained a high level in the geopolymer exposed to the carbonation environment, which may be due to the earlier formation of Q4(4Al) than Q4(2Al), Q4(1Al) and Q4(0Al). It has been reported that aluminum has a higher initial dissolution rate than silicon, resulting in the formation of an Al-rich gel in the initial stage of geopolymeric reaction [39], followed by the formation of Si-rich gel as the stoichiometric release of silicon. However, the carbonation environment decreased the alkalinity of the pore solution in the geopolymers due to the CO2 reacting with the alkaline activator, hindering the geopolymeric reaction from proceeding and the formation of Si-rich gel (Q4(2Al), Q4(1Al), as well as Q4(0Al)) in the later stage. Therefore, the compressive strength decreased when the geopolymer was exposed to the carbonation environment, as demonstrated in the results shown in Figure 2.

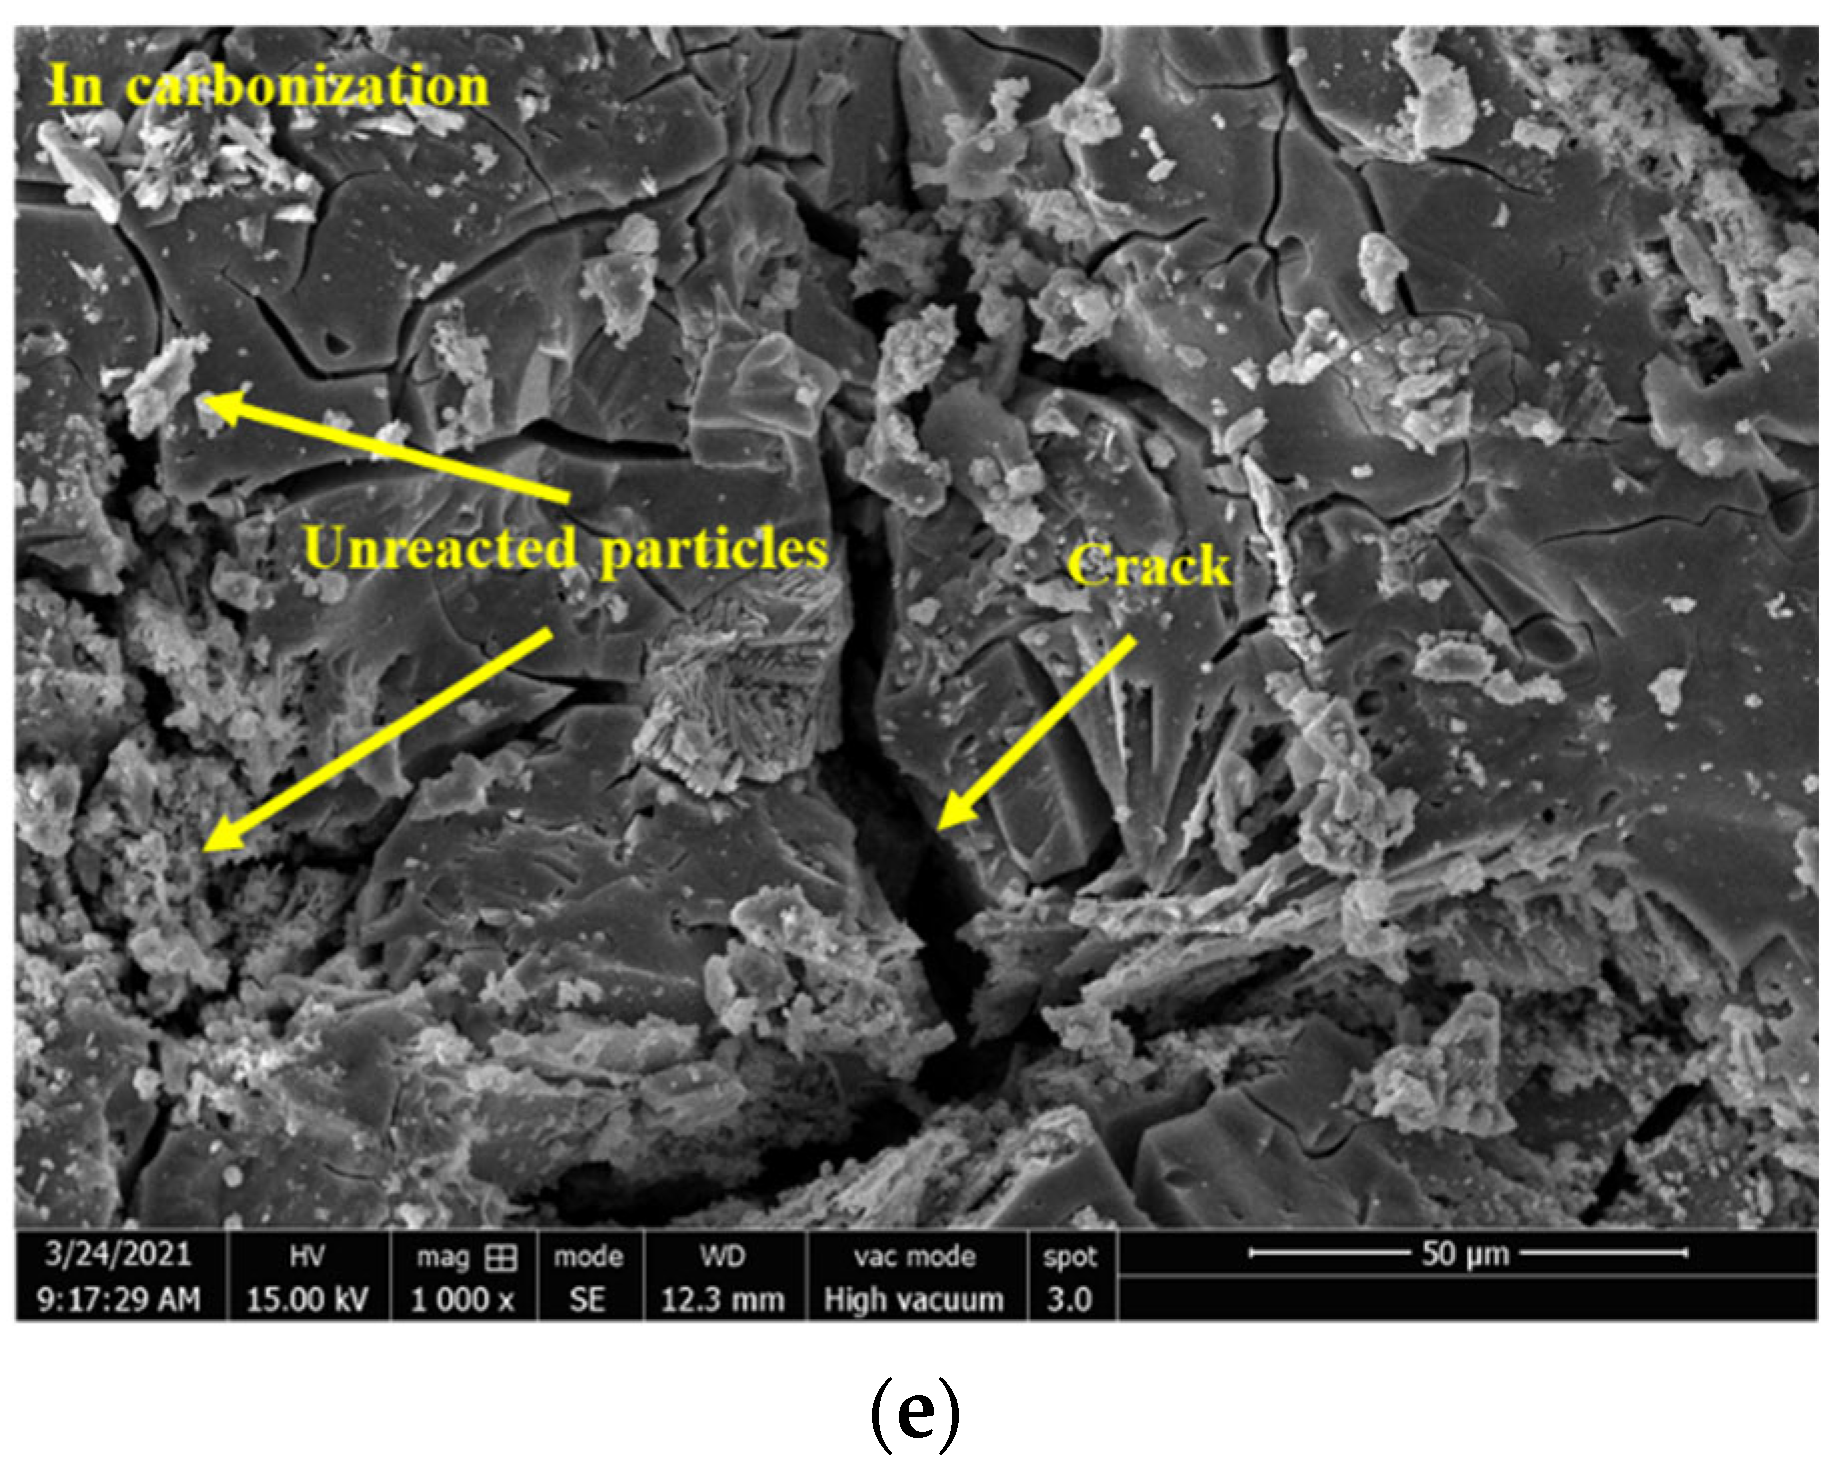
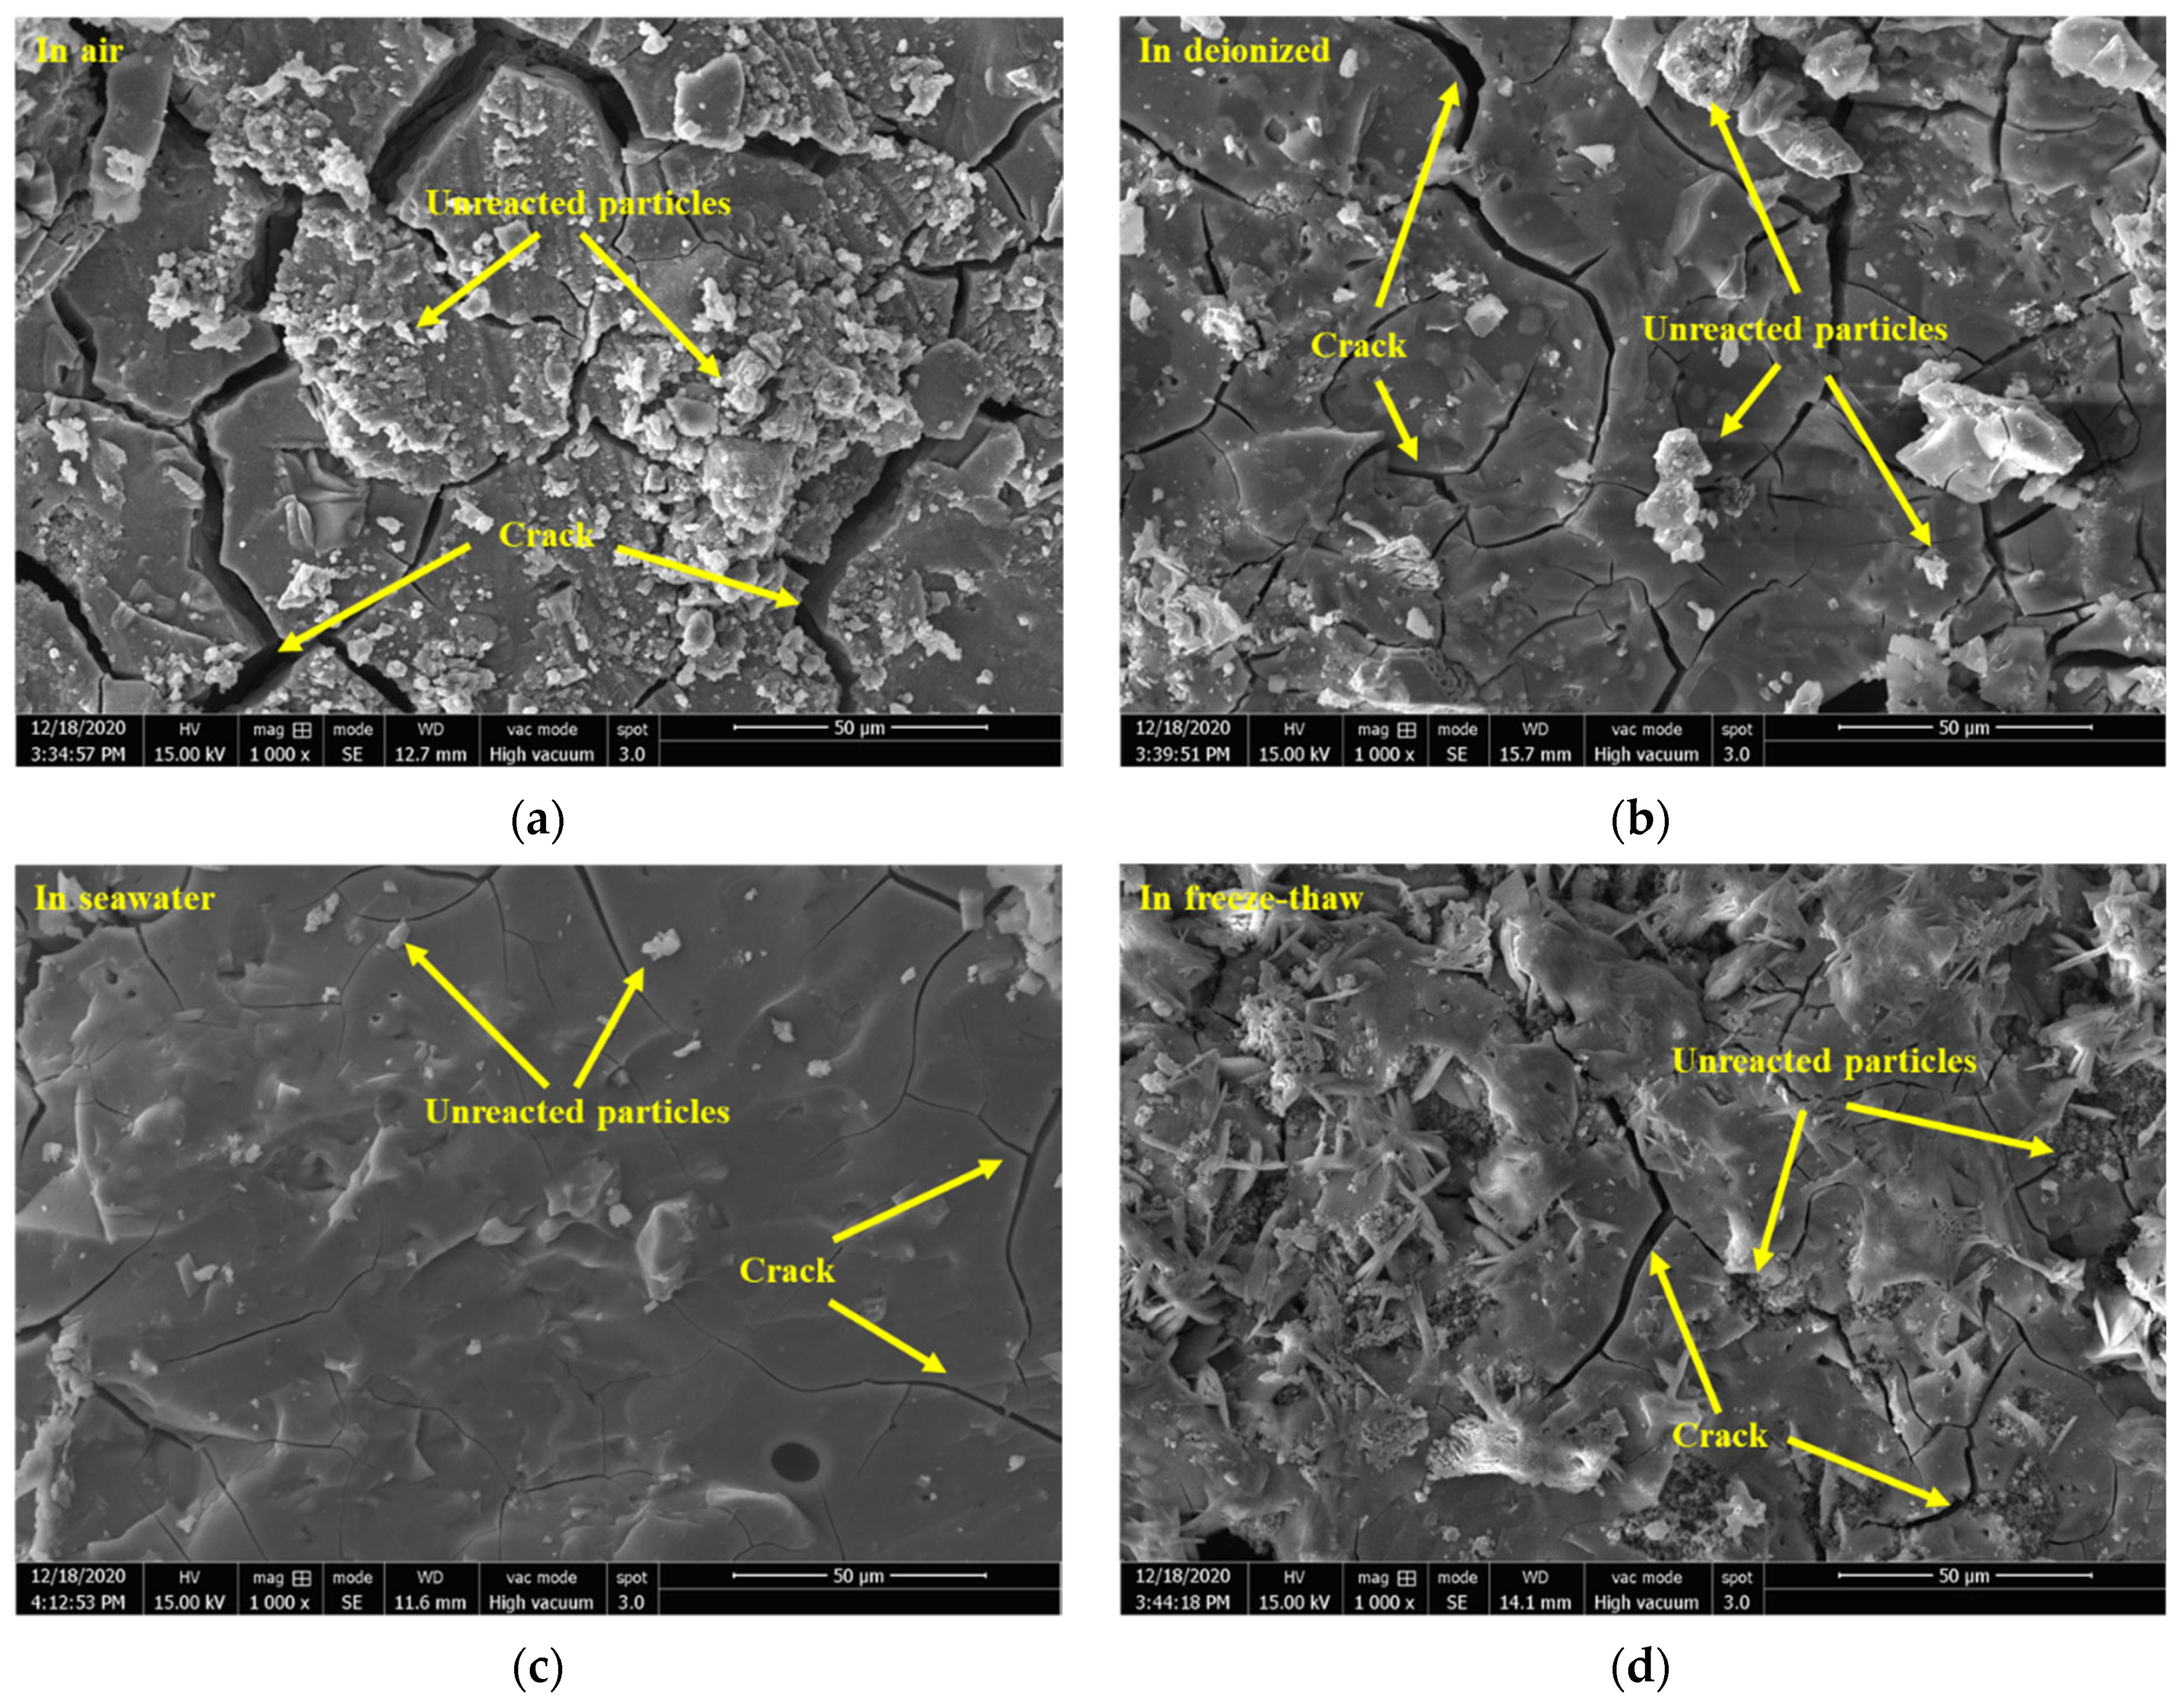
3.2.4. Morphological Analysis by SEM

Figure 7 gives the SEM images of the geopolymers prepared with 60% BFS subjected to different exposure. The geopolymers exposed to carbonization and air show numerous deep cracks and unreacted particles, in which the cracks are more severe in the geopolymer exposed to carbonization than exposed to air. Cracks and unreacted particles were decreased in the geopolymer exposed to deionized water. The geopolymer exposed to seawater exhibited the slightest cracks and particles and homogenous and compact structures. This is related to the self-shrinkage of the BFS-based geopolymers. Due to the migration and dissipation of water inside the test piece to the outside world and the reduction of escapable water in the structural system during the hydration reaction, shrinkage, cracking and incomplete reaction of the test occurred. The two water environments, ionized water and seawater, provided good conditions for the subsequent polymerization reaction of the specimens, resulting in a smoother and more uniform matrix, as well as a higher reaction level. These results were consistent with the results of the compressive strength, as shown in Figure 2. Additionally, when the geopolymer was exposed to the freeze–thaw cycles, some star-shaped substances were formed in the matrix. This may be related to the crystallization of the geopolymers exposed to the freeze–thaw cycles, as shown in Figure 3.

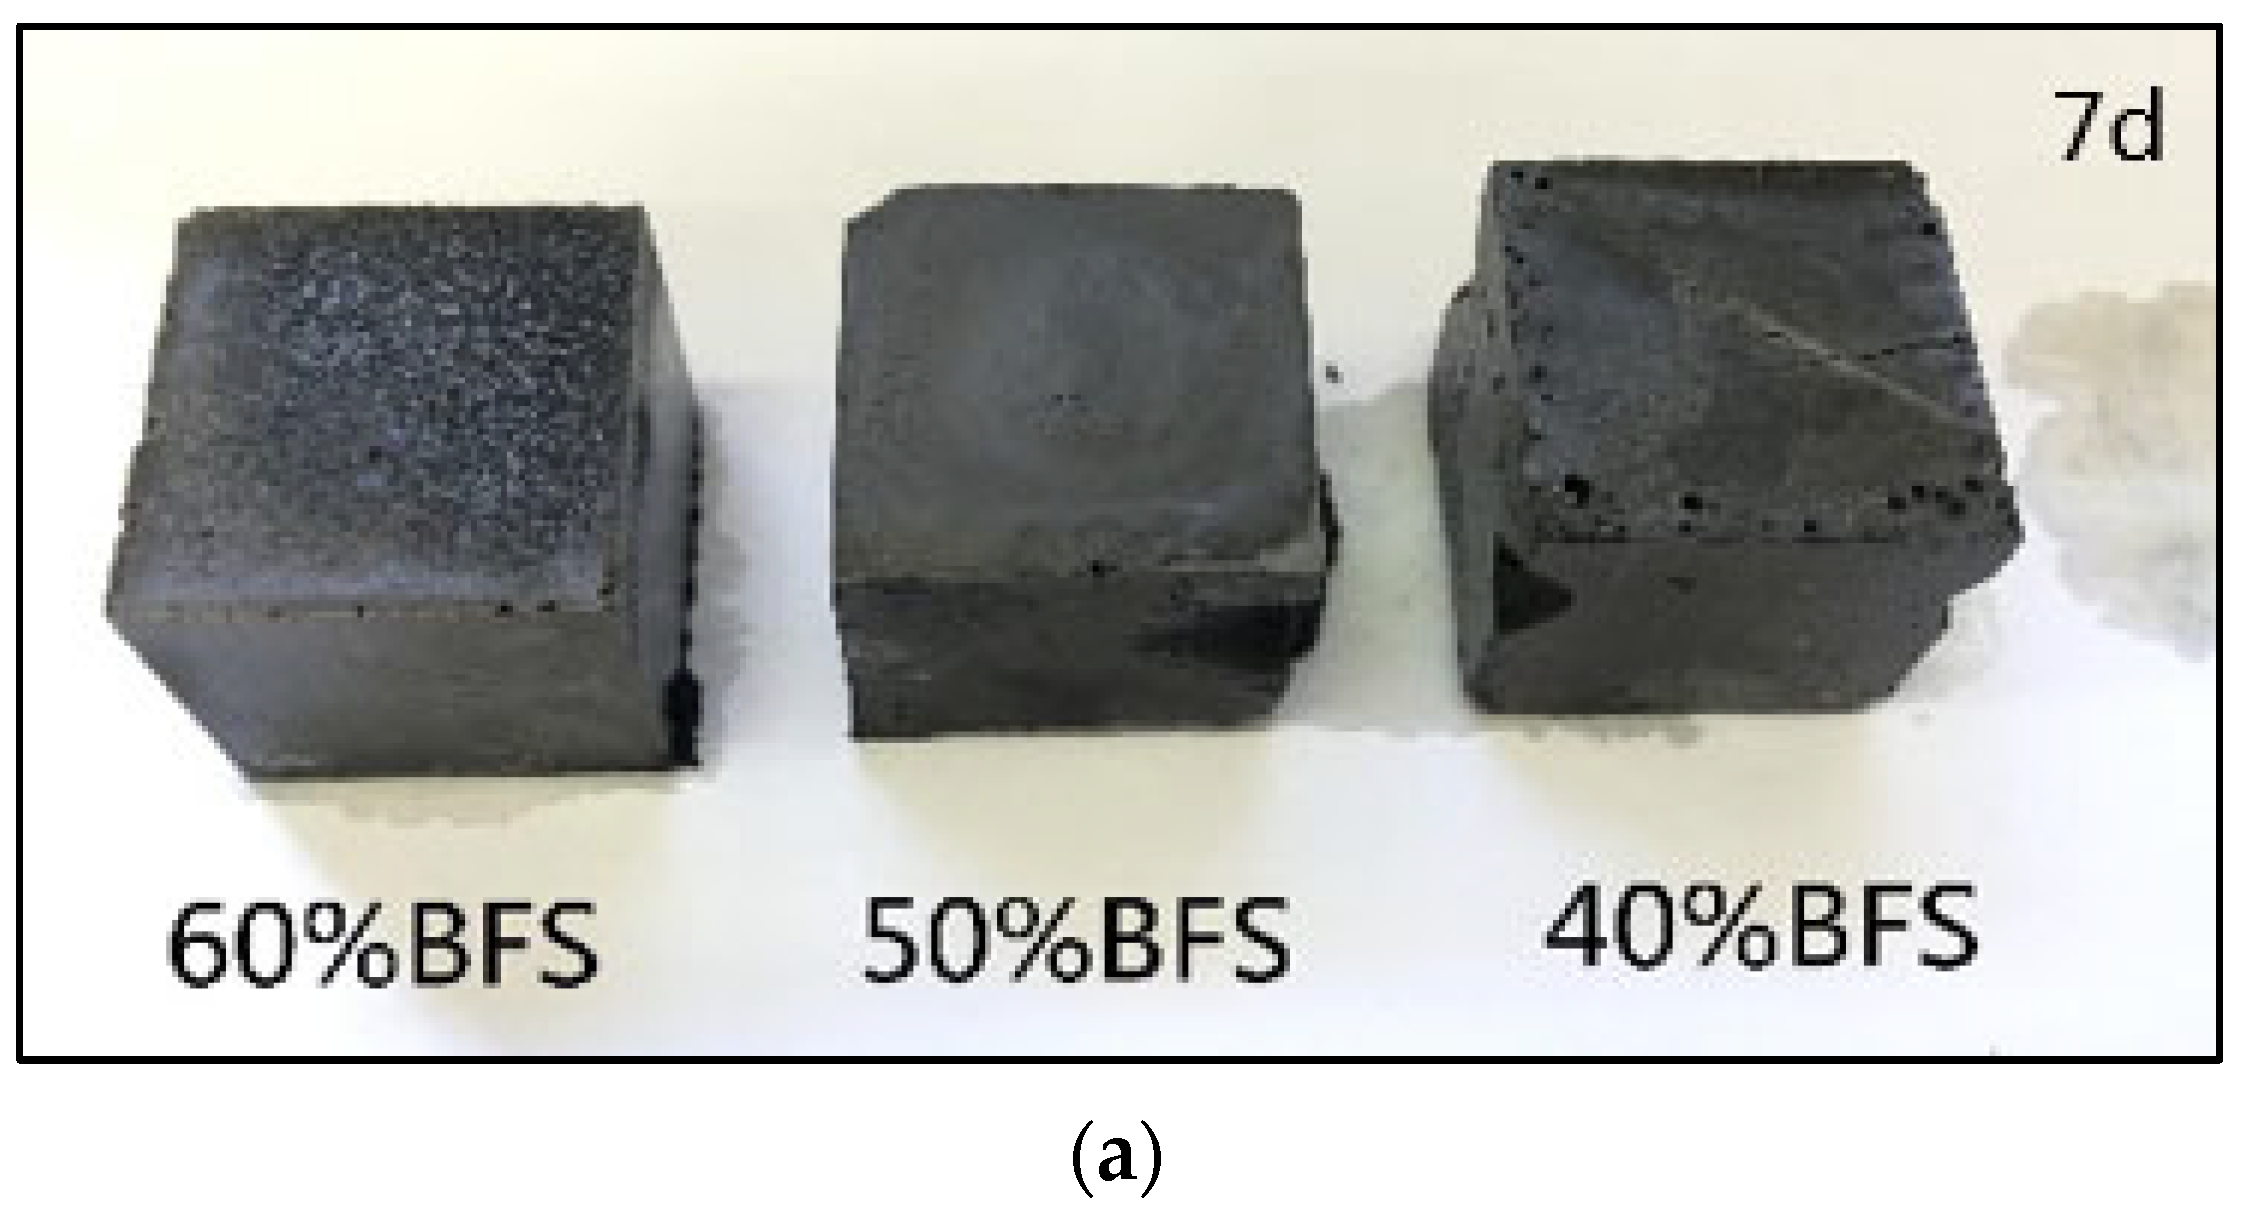
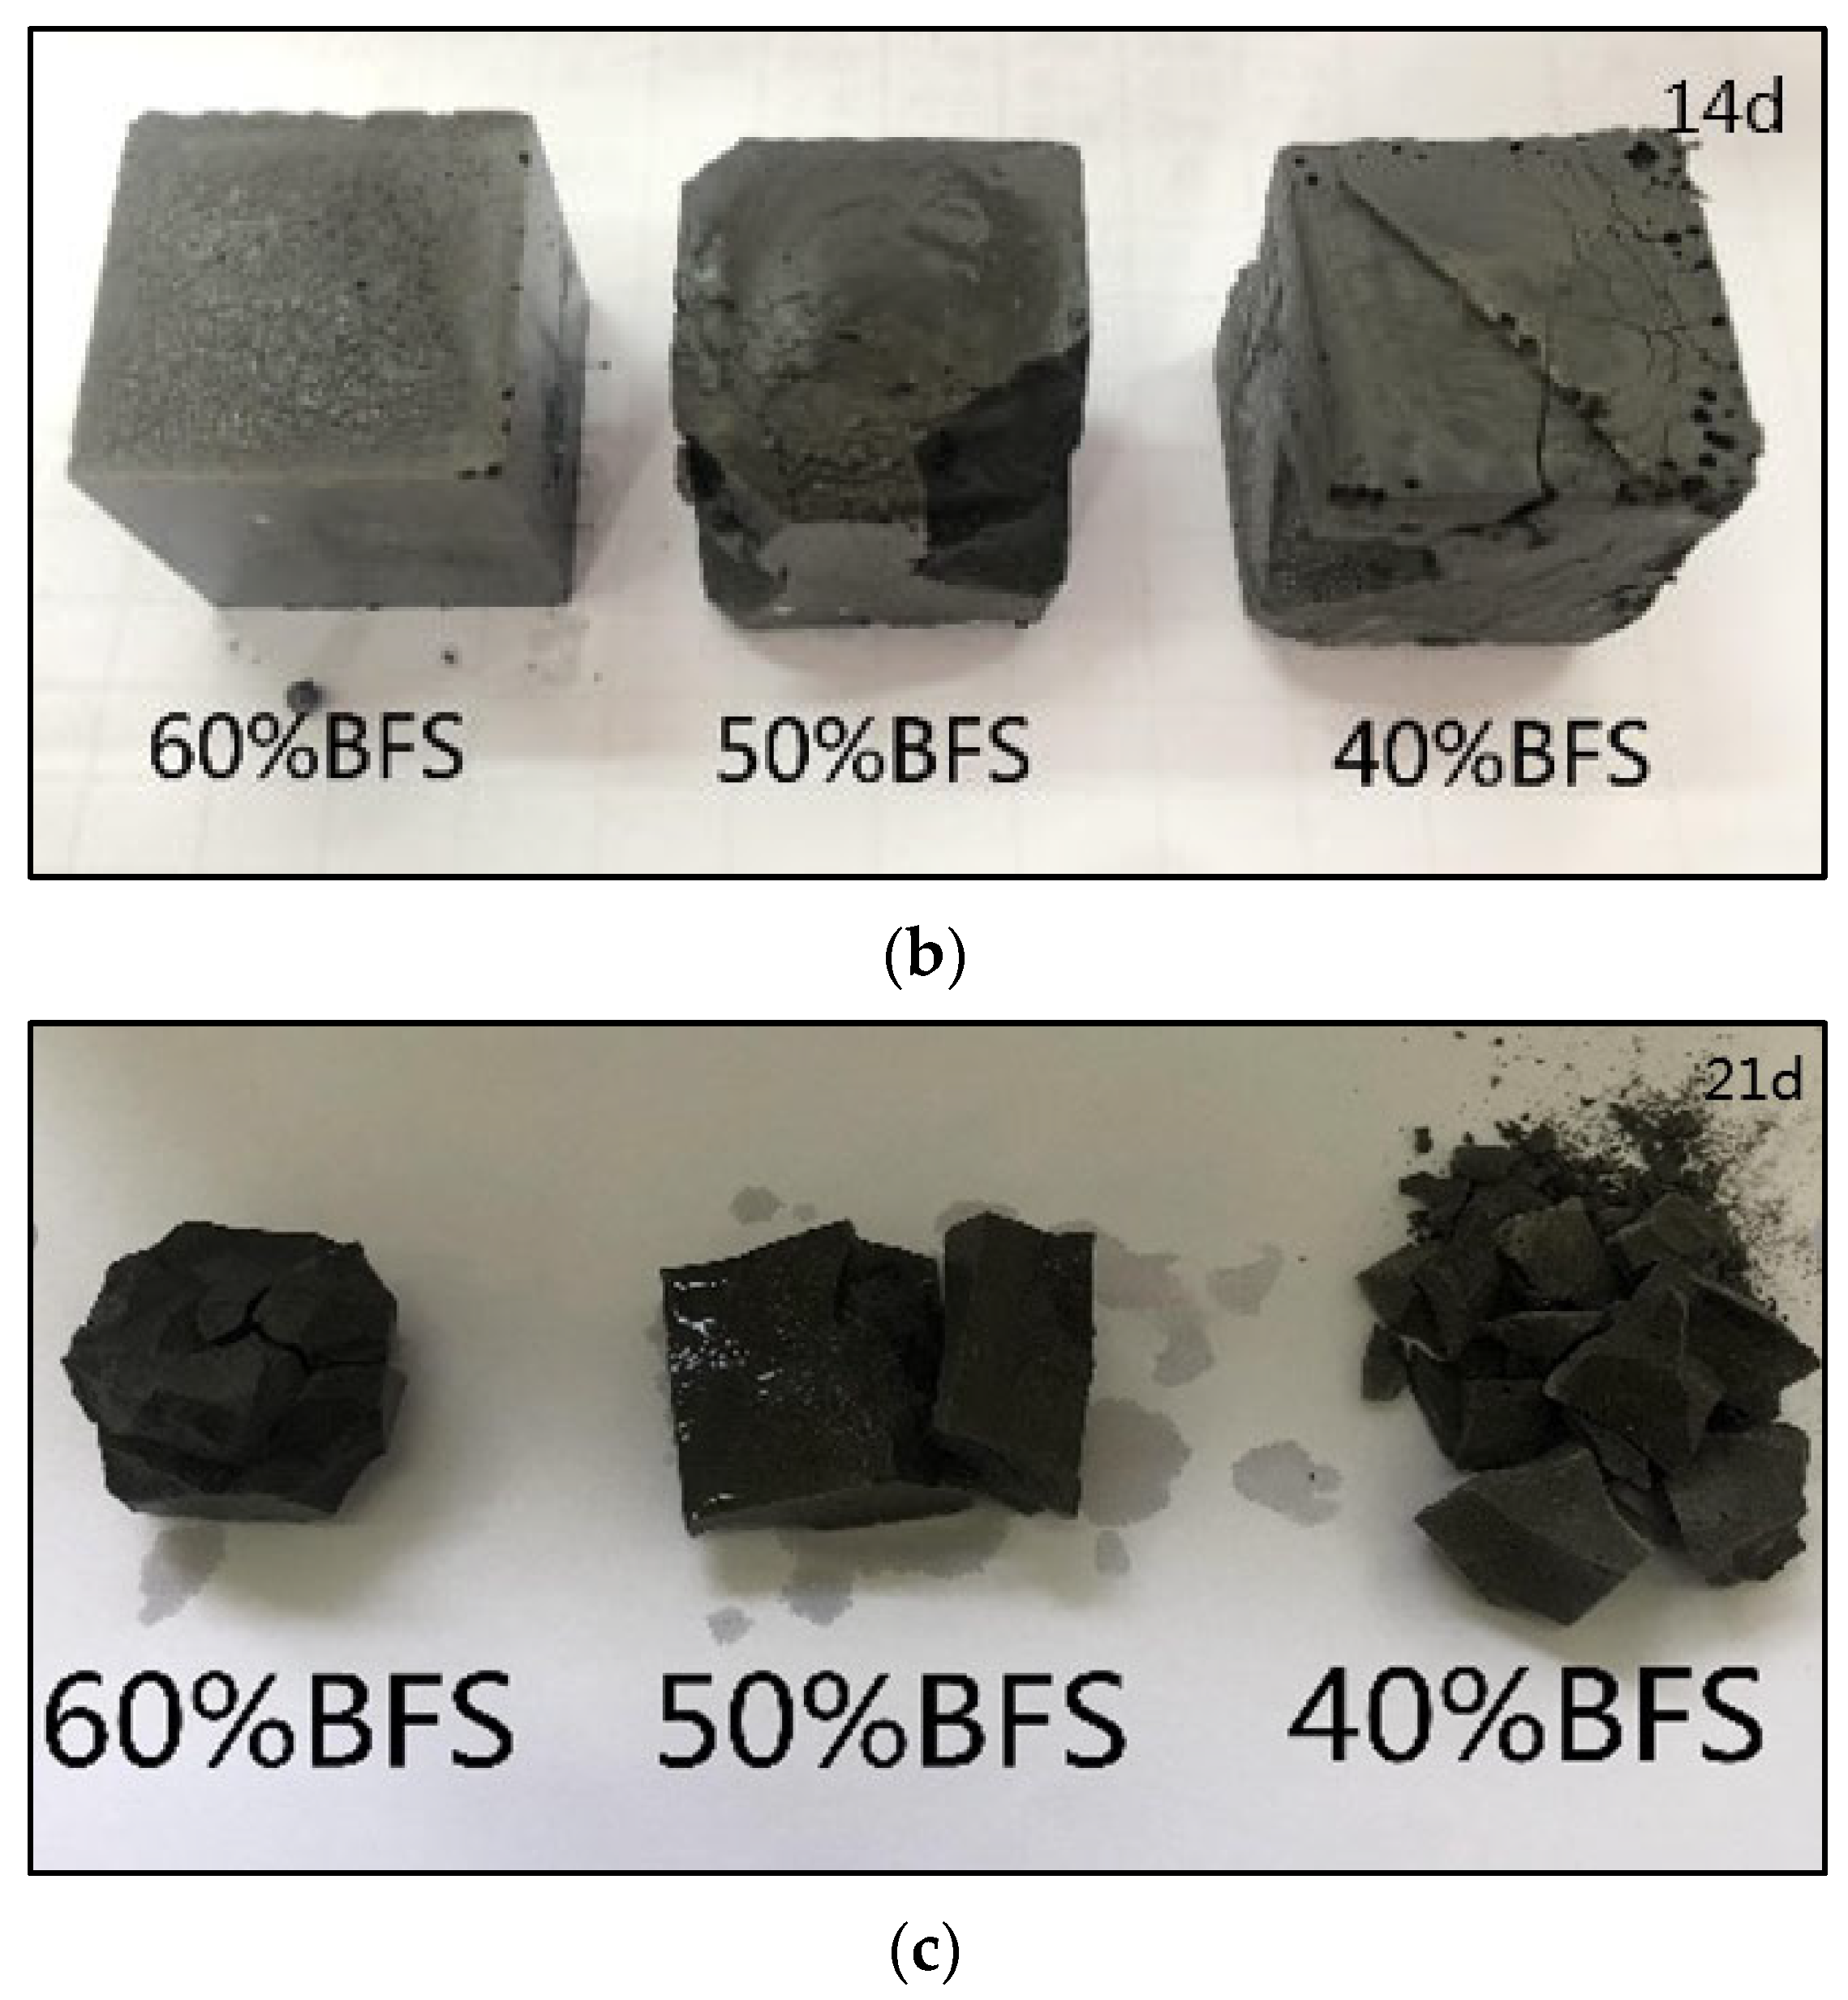
3.2.5. Macromorphology Analysis of Geopolymer Exposed to Freeze–Thaw Cycle

The geopolymer exposed to the freeze–thaw cycle exhibited the most severe deterioration. Figure 8 gives the macro changes of the geopolymer prepared with different proportions of BFS over time under the freeze–thaw cycle. Compared with the freeze–thaw cycle of 7 days, the 14-day geopolymer started to show cracks and edge peeling. On the other hand, after 21 days of curing the geopolymer, all the blocks collapsed and the geopolymers showed an unconsolidated matrix. In the freeze–thaw cycle, water saturating, freezing, swelling and melting in the cracks take place reduplicative, thus accelerating the decomposition of the geopolymer matrix. Therefore, it failed to obtain the 28-days compressive strength value. Compared to the three samples with different BFS content, the anti-freeze–thaw effect is better when the BFS content is 60%. The addition of BFS increases the content of CaO and generates more C-(A)-S-H gels. The NMR analysis found that geopolymers exposed to the freeze–thaw cycle have fewer Si sites in Q1 and Q2 and more Si sites in Q2, Q3 and Q4 compared to that exposed to the air, which had a similar evolution trend to those exposed to air, deionized water and seawater. Geopolymers exposed to deionized water and seawater exhibited higher compressive strength than those exposed to the air. In contrast, the geopolymer exposed to the freeze–thaw cycle showed the most severe deterioration. This result indicates that the deterioration had nothing to do with the evolution of the chemical nanostructures but rather with the changes in physical property. From the XRD analysis, it was found that an additional crystal phase (vaterite) was formed in the geopolymer exposed to the freeze–thaw cycle, which may have resulted in the deterioration of the geopolymer due to the formation of cracks caused by the crystallization degree exceeding the ultimate tensile strength of the geopolymer [40].

4. Conclusions

This work studied the gel evolution of the CT-based geopolymer in the marine environment. It was found that deionized water and natural seawater exposure promoted the evolution degree of the geopolymers, in which the seawater exhibited a greater promotion effect. The increased gel formation improved the compressive strength of the geopolymer. The carbonization environment exposure weakened the gel evolution and decreased the cross-linking degree of the N-A-S-H gel nanostructure, resulting in decreased compressive strength. The geopolymer exposed to the freeze–thaw cycle exhibited the worst deterioration due to the expansion caused by crystallization in the geopolymer. On the other hand, geopolymer concrete shows excellent properties in marine-related environments. This provides the possibility for the practical application of geopolymer concrete in coastal breakwaters and other buildings, as well as the opportunity to transform solid waste from conventional consumption and disposal and low-value-added brick-making into a high-value utility.

Author Contributions

Writing—original draft, J.L.; Conceptualization, F.R.; Writing—Review & editing, Performed data interpretation, X.T.; Supervision, Resources, L.Y. All authors have read and agreed to the published version of the manuscript.

Funding

This research was funded by the National Natural Science Foundation of China (Project No. 51974093 and Project No. 52104244) and the Minjiang Scholar Talent Foundation of Fujian Province (Grant No. GXRC-20067)

Institutional Review Board Statement

Not applicable.

Informed Consent Statement

Not applicable.

Data Availability Statement

Not applicable.

Conflicts of Interest

The authors declare no conflict of interest.

References

  1. Wan, Q.; Rao, F.; Song, S.; García, R.E.; Estrella, R.M.; Patiño, C.L.; Zhang, Y. Geopolymerization Reaction, Microstructure and Simulation of Metakaolin-Based Geopolymers at Extended Si/Al Ratios. Cem. Concr. Compos. 2017, 79, 45–52. [Google Scholar] [CrossRef]
  2. Duxson, P.; Fernández-Jiménez, A.; Provis, J.L.; Lukey, G.C.; Palomo, A.; van Deventer, J.S.J. Geopolymer Technology: The Current State of the Art. J. Mater. Sci. 2007, 42, 2917–2933. [Google Scholar] [CrossRef]
  3. Davidovits, J. Geopolymer Cement. A Rev. Geopolymer. Inst. Tech. Pap. 2013, 21, 1–11. [Google Scholar]
  4. Turner, L.K.; Collins, F.G. Carbon Dioxide Equivalent (CO2-e) Emissions: A Comparison between Geopolymer and OPC Cement Concrete. Constr. Build. Mater. 2013, 43, 125–130. [Google Scholar] [CrossRef]
  5. Duxson, P.; Provis, J.L.; Lukey, G.C.; Van Deventer, J.S.J. The Role of Inorganic Polymer Technology in the Development of ‘Green Concrete’. Cem. Concr. Res. 2007, 37, 1590–1597. [Google Scholar] [CrossRef]
  6. Tian, X.; Rao, F.; Estrella, R.M.; Song, S. Effects of Aluminum Dosage on Gel Formation and Heavy Metals Immobilization in Alkali-Activated MSWI Fly Ash. Energy Fuels 2020, 34, 4727–4733. [Google Scholar] [CrossRef]
  7. Li, X.; Rao, F.; Song, S.; Ma, Q. Deterioration in the Microstructure of Metakaolin-Based Geopolymers in Marine Environment. J. Mater. Res. Technol. 2019, 8, 2747–2752. [Google Scholar] [CrossRef]
  8. Li, X.; Rao, F.; Song, S.; Ma, Q. Effect of Cristobalite on the Mechanical Behaviour of Metakaolin-Based Geopolymer in Artificial Seawater. Adv. Appl. Ceram. 2020, 119, 29–36. [Google Scholar] [CrossRef]
  9. Wu, J.; Li, J.; Rao, F.; Yin, W. Characterization of Slag Reprocessing Tailings-Based Geopolymers in Marine Environment. Minerals 2020, 10, 832. [Google Scholar] [CrossRef]
  10. De Weerdt, K.; Justnes, H.; Geiker, M.R. Changes in the Phase Assemblage of Concrete Exposed to Sea Water. Cem. Concr. Compos. 2014, 47, 53–63. [Google Scholar] [CrossRef]
  11. Tennakoon, C.; Shayan, A.; Sanjayan, J.G.; Xu, A. Chloride Ingress and Steel Corrosion in Geopolymer Concrete Based on Long Term Tests. Mater. Des. 2017, 116, 287–299. [Google Scholar] [CrossRef]
  12. Xie, L.; Zhan, Z.; Li, Z.; She, J.; Peng, H. Effect of Sulfate on Rheological Properties of Inorganic Polymers. Guangdong Build. Mater. 2017, 33, 6–9. [Google Scholar]
  13. She, J.; Zhan, Z.; Li, Z.; Yang, Y.; Xie, L.; Peng, H. Effect of Sodium Chloride on Rheological Properties of Silicate Cement Slurry. Guangdong Build. Mater. 2017, 33, 3–6. [Google Scholar]
  14. Xie, L.; Zhan, Z.; Li, Z.; Yang, Y.; She, J.; Peng, H. Effect of Chloride Ion on Hydration Properties and Hardening Properties of Inorganic Polymers and Portland Cement. Concrete 2017, 5, 86–89, 93. [Google Scholar] [CrossRef]
  15. Zhao, R.; Yuan, Y.; Cheng, Z.; Wen, T.; Li, J.; Li, F.; Ma, Z.J. Freeze-Thaw Resistance of Class F Fly Ash-Based Geopolymer Concrete. Constr. Build. Mater. 2019, 222, 474–483. [Google Scholar] [CrossRef]
  16. Yi, L.; Mi, H.; Wu, Q.; Xia, J.; Zhang, B. Current Situation of Comprehensive Utilization of Tailings Resources in China. Conserv. Util. Miner. Resour. 2020, 40, 79–84. [Google Scholar] [CrossRef]
  17. Park, I.; Tabelin, C.B.; Jeon, S.; Li, X.; Seno, K.; Ito, M.; Hiroyoshi, N. A Review of Recent Strategies for Acid Mine Drainage Prevention and Mine Tailings Recycling. Chemosphere 2019, 219, 588–606. [Google Scholar] [CrossRef]
  18. Tian, X.; Xu, W.; Song, S.; Rao, F.; Xia, L. Effects of Curing Temperature on the Compressive Strength and Microstructure of Copper Tailing-Based Geopolymers. Chemosphere 2020, 253, 126754. [Google Scholar] [CrossRef]
  19. Yang, T.; Yao, X.; Zhang, Z. Quantification of Chloride Diffusion in Fly Ash–Slag-Based Geopolymers by X-ray Fluorescence (XRF). Constr. Build. Mater. 2014, 69, 109–115. [Google Scholar] [CrossRef]
  20. Nawab, L.; Ghani, U. Synthesis and Characterization of Chloride Resistant Cement from Industrial Waste through Geopolymerization. J. Clean. Prod. 2017, 156, 577–580. [Google Scholar] [CrossRef]
  21. Ma, Q.; Nanukuttan, S.V.; Basheer, P.A.M.; Bai, Y.; Yang, C. Chloride Transport and the Resulting Corrosion of Steel Bars in Alkali Activated Slag Concretes. Mater. Struct. 2016, 49, 3663–3677. [Google Scholar] [CrossRef] [Green Version]
  22. Tian, X.; Zhang, H.; Zhang, T.; Fernández, C.A. Alkali-Activated Copper Tailings-Based Pastes: Compressive Strength and Microstructural Characterization. J. Mater. Res. Technol. 2020, 9, 6557–6567. [Google Scholar] [CrossRef]
  23. Zhang, Z.; Yao, X.; Zhu, H. Potential Application of Geopolymers as Protection Coatings for Marine Concrete: I.Basic Properties. Appl. Clay Sci. 2010, 49, 1–6. [Google Scholar] [CrossRef]
  24. Tian, X.; Rao, F.; Li, C.; Ge, W.; Lara, N.O.; Song, S.; Xia, L. Solidification of Municipal Solid Waste Incineration Fly Ash and Immobilization of Heavy Metals Using Waste Glass in Alkaline Activation System. Chemosphere 2021, 283, 131240. [Google Scholar] [CrossRef]
  25. Tian, X.; Rao, F.; León-Patiño, C.A.; Song, S. Co-Disposal of MSWI Fly Ash and Spent Caustic through Alkaline-Activation Consolidation. Cem. Concr. Compos. 2021, 116, 103888. [Google Scholar] [CrossRef]
  26. Ting, M.Z.Y.; Wong, K.S.; Rahman, M.E.; Meheron, S.J. Deterioration of Marine Concrete Exposed to Wetting-Drying Action. J. Clean. Prod. 2021, 278, 123383. [Google Scholar] [CrossRef]
  27. Suryavanshi, A.K.; Scantlebury, J.D.; Lyon, S.B. Mechanism of Friedel’s Salt Formation in Cements Rich in Tri-Calcium Aluminate. Cem. Concr. Res. 1996, 26, 717–727. [Google Scholar] [CrossRef]
  28. Birnin-Yauri, U.A.; Glasser, F.P. Friedel’s Salt, Ca2Al (OH) 6 (Cl, OH)·2H2O: Its Solid Solutions and Their Role in Chloride Binding. Cem. Concr. Res. 1998, 28, 1713–1723. [Google Scholar] [CrossRef]
  29. De Weerdt, K.; Lothenbach, B.; Geiker, M.R. Comparing Chloride Ingress from Seawater and NaCl Solution in Portland Cement Mortar. Cem. Concr. Res. 2019, 115, 80–89. [Google Scholar] [CrossRef]
  30. Farnam, Y.; Dick, S.; Wiese, A.; Davis, J.; Bentz, D.; Weiss, J. The Influence of Calcium Chloride Deicing Salt on Phase Changes and Damage Development in Cementitious Materials. Cem. Concr. Compos. 2015, 64, 1–15. [Google Scholar] [CrossRef] [Green Version]
  31. Tumidajski, P.J.; Chan, G.W. Durability of High Performance Concrete in Magnesium Brine. Cem. Concr. Res. 1996, 26, 557–565. [Google Scholar] [CrossRef]
  32. Bernal, S.A.; Provis, J.L.; Rose, V.; De Gutierrez, R.M. Evolution of Binder Structure in Sodium Silicate-Activated Slag-Metakaolin Blends. Cem. Concr. Compos. 2011, 33, 46–54. [Google Scholar] [CrossRef]
  33. Yang, T.; Yao, X.; Zhang, Z.; Zhu, H. Effects of NaOH Solution Concentration and Reaction Time on Metakaolin Geopolymerization. J. Nanjing Univ. Technol. 2013, 35, 21–25. [Google Scholar] [CrossRef]
  34. Wan, Q.; Rao, F.; Song, S.; Cholico-González, D.F.; Ortiz, N.L. Combination Formation in the Reinforcement of Metakaolin Geopolymers with Quartz Sand. Cem. Concr. Compos. 2017, 80, 115–122. [Google Scholar] [CrossRef]
  35. Palomo, A.; Blanco-Varela, M.T.; Granizo, M.L.; Puertas, F.; Vazquez, T.; Grutzeck, M.W. Chemical Stability of Cementitious Materials Based on Metakaolin. Cem. Concr. Res. 1999, 29, 997–1004. [Google Scholar] [CrossRef]
  36. Klinowski, J. Nuclear Magnetic Resonance Studies of Zeolites. Prog. Nucl. Magn. Reson. Spectrosc. 1984, 16, 237–309. [Google Scholar] [CrossRef]
  37. Singh, P.S.; Bastow, T.; Trigg, M. Structural Studies of Geopolymers by 29Si and 27Al MAS-NMR. J. Mater. Sci. 2005, 40, 3951–3961. [Google Scholar] [CrossRef]
  38. Engelhardt, G.; Michel, D. High-Resolution Solid-State NMR of Silicates and Zeolites; John Wiley and Sons: New York, NY, USA, 1987. [Google Scholar]
  39. Duxson, P.; Lukey, G.C.; Separovic, F.; Van Deventer, J.S.J. Effect of Alkali Cations on Aluminum Incorporation in Geopolymeric Gels. Ind. Eng. Chem. Res. 2005, 44, 832–839. [Google Scholar] [CrossRef]
  40. Zhang, Z.; Provis, J.L.; Ma, X.; Reid, A.; Wang, H. Efflorescence and Subflorescence Induced Microstructural and Mechanical Evolution in Fly Ash-Based Geopolymers. Cem. Concr. Compos. 2018, 92, 165–177. [Google Scholar] [CrossRef]
Figure 1. XRD patterns of the CT and BFS.
Materials 15 04599 g001
Figure 2. Compressive strength of the geopolymers prepared with varying proportions of BFS in different exposure conditions.
Materials 15 04599 g002
Figure 3. XRD patterns of geopolymers prepared with 60% BFS that underwent different exposures for 28 days.
Materials 15 04599 g003
Figure 4. FTIR spectra of the geopolymers prepared with 60% BFS subjected to different exposures for 28 days.
Materials 15 04599 g004
Figure 5. 29Si NMR spectra of the geopolymers prepared with 60% BFS subjected to different exposures.
Materials 15 04599 g005
Figure 6. The deconvolution of 29Si NMR spectra of geopolymers prepared with 60% BFS subjected to different exposure.
Materials 15 04599 g006
Figure 7. SEM images of the geopolymers prepared with 60% BFS subjected to different exposure.
Materials 15 04599 g007aMaterials 15 04599 g007b
Figure 8. Macro changes in geopolymer prepared with different proportions of BFS overtime under freeze–thaw cycle.
Materials 15 04599 g008aMaterials 15 04599 g008b
Table 1. Chemical composition of the CT and BFS.
Components (%)SiO2Al2O3Fe2O3MgOCaOTiO2Na2OK2O
CT28.194.2457.831.1011.9060.3030.5250.81
BFS30.5715.090.331.30538.551.600.500.37
Publisher’s Note: MDPI stays neutral with regard to jurisdictional claims in published maps and institutional affiliations.

