
Evaluation and Numerical Investigations of the Cyclic Behavior of Smart Composite Steel–Concrete Shear Wall: Comprehensive Study of Finite Element Model

 ,
,  ,
,  ,
,  ,
,
Abstract
:1. Introduction
2. Smart Structure Technology
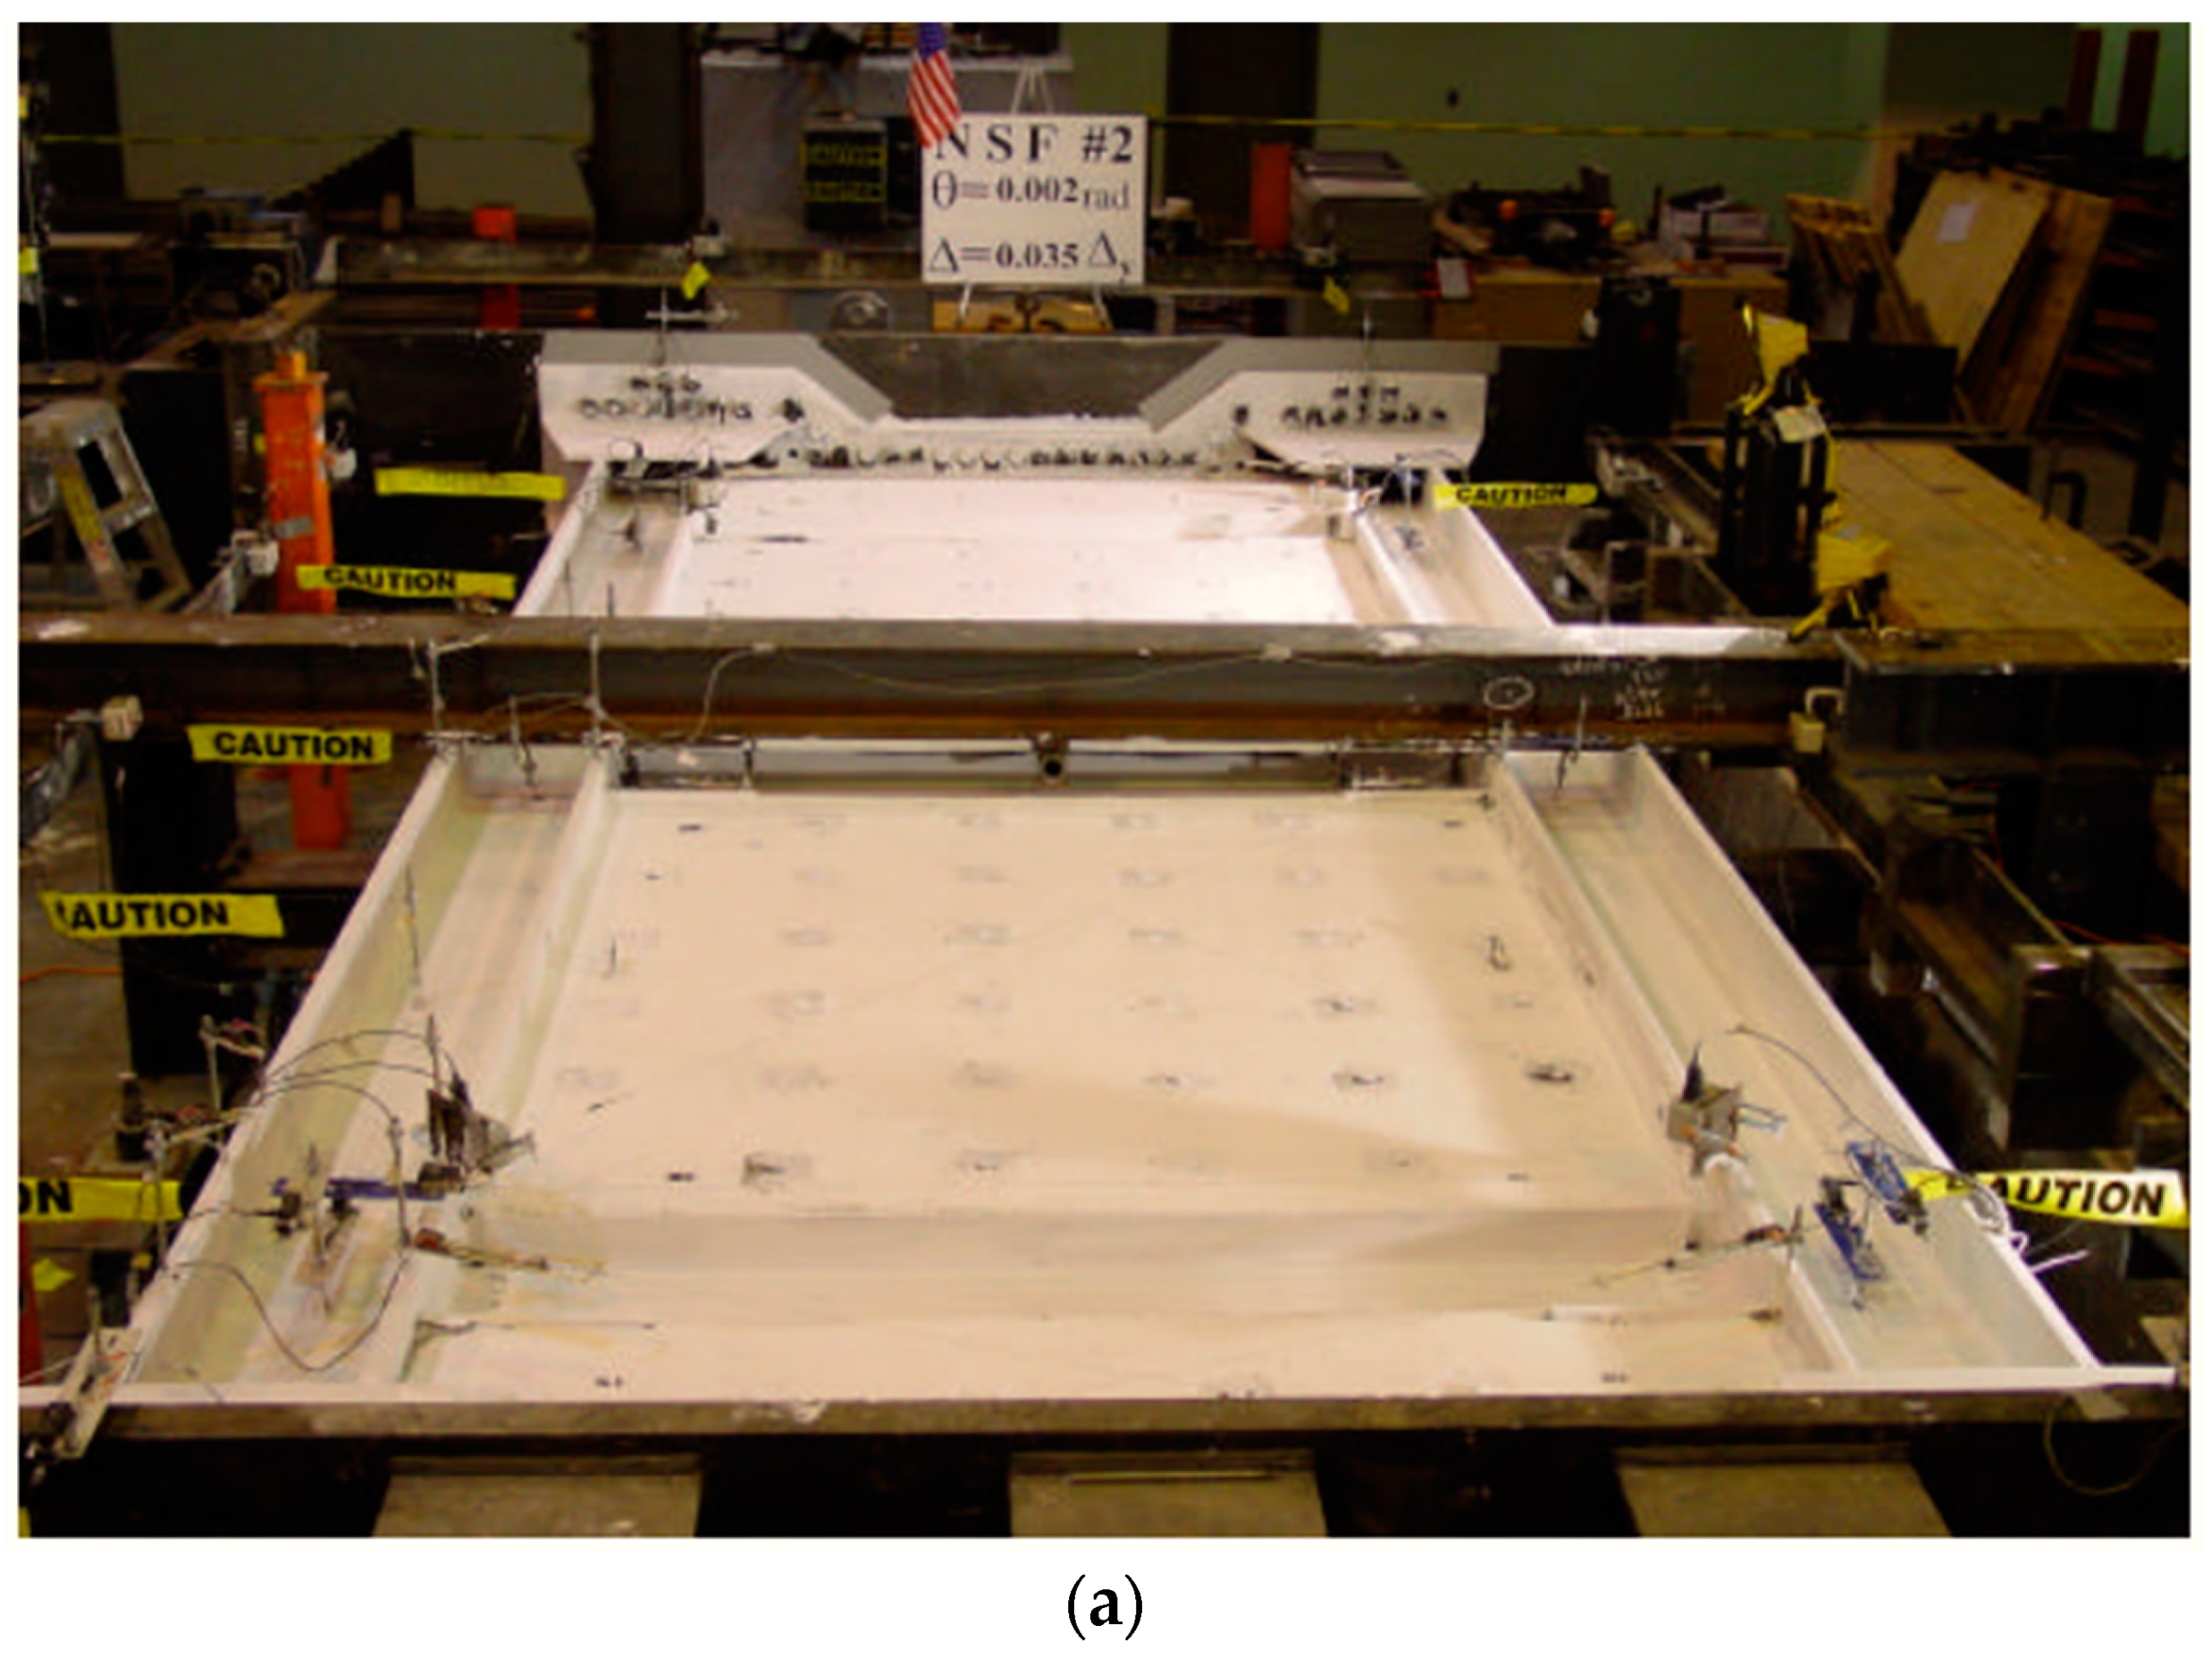
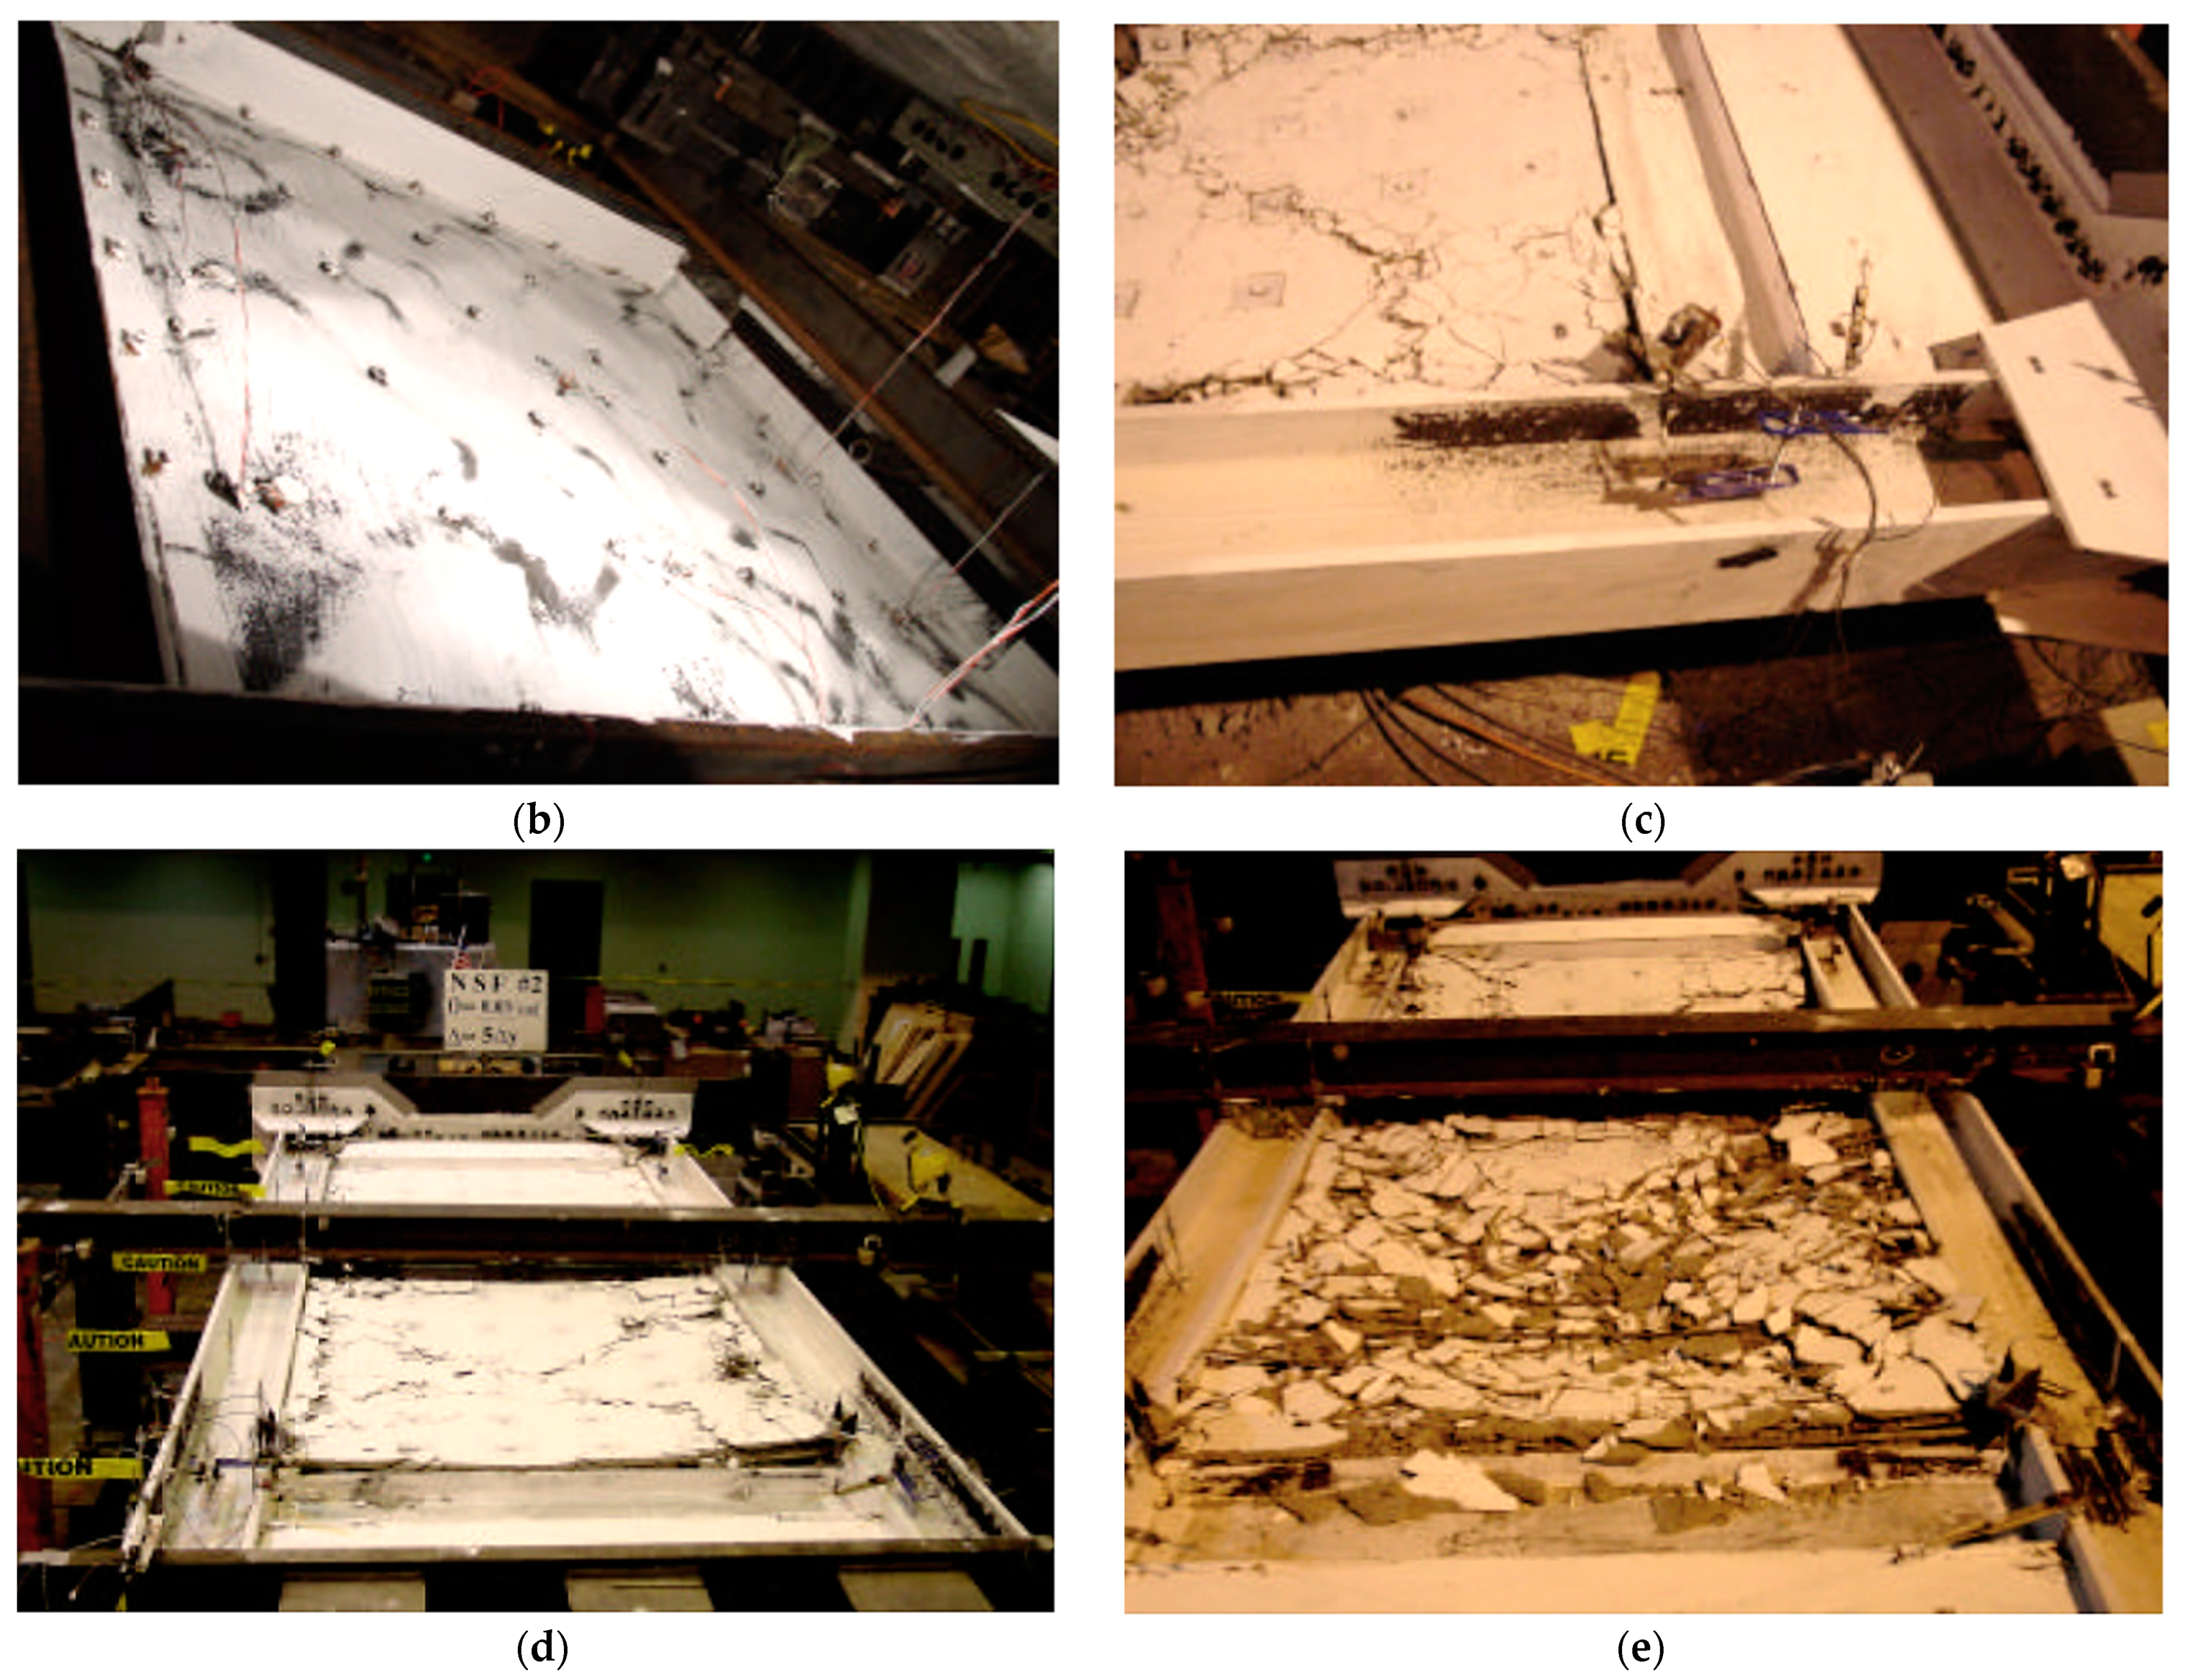
3. Experimental Program
3.1. Sample Design
3.2. Loading Program and Test Setup
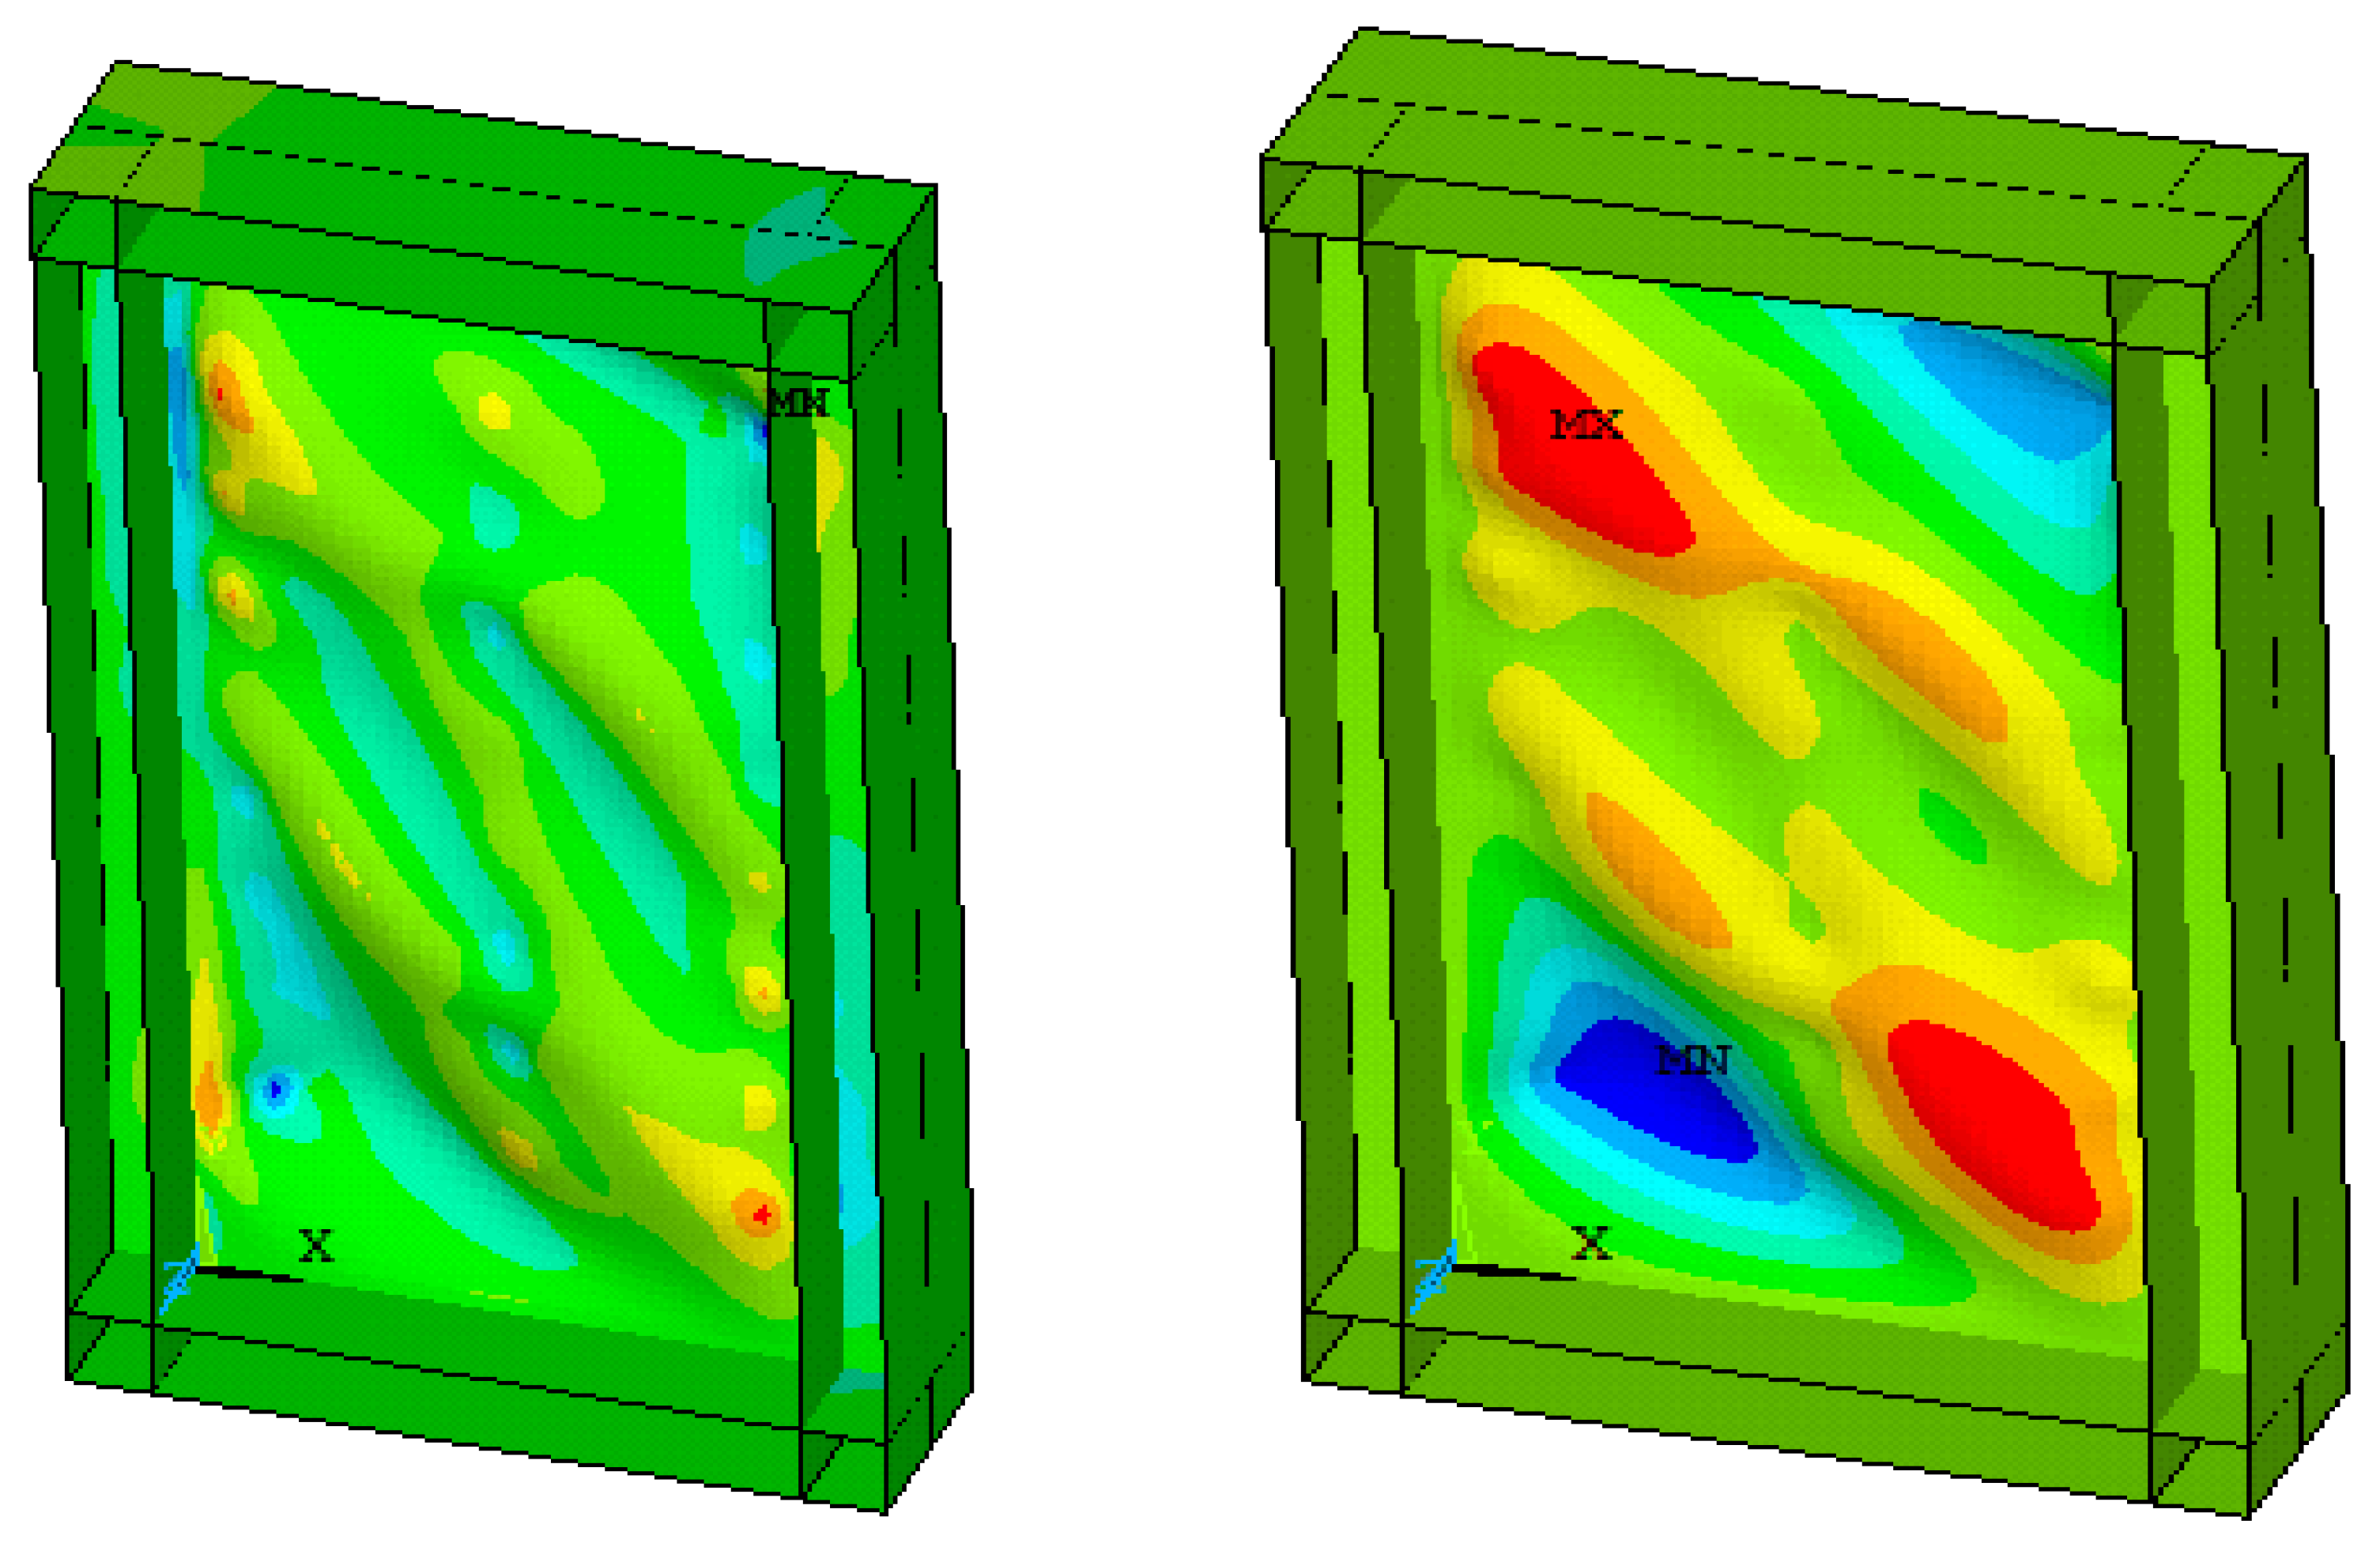
4. Finite Element Model (FEM)
4.1. Model Overview
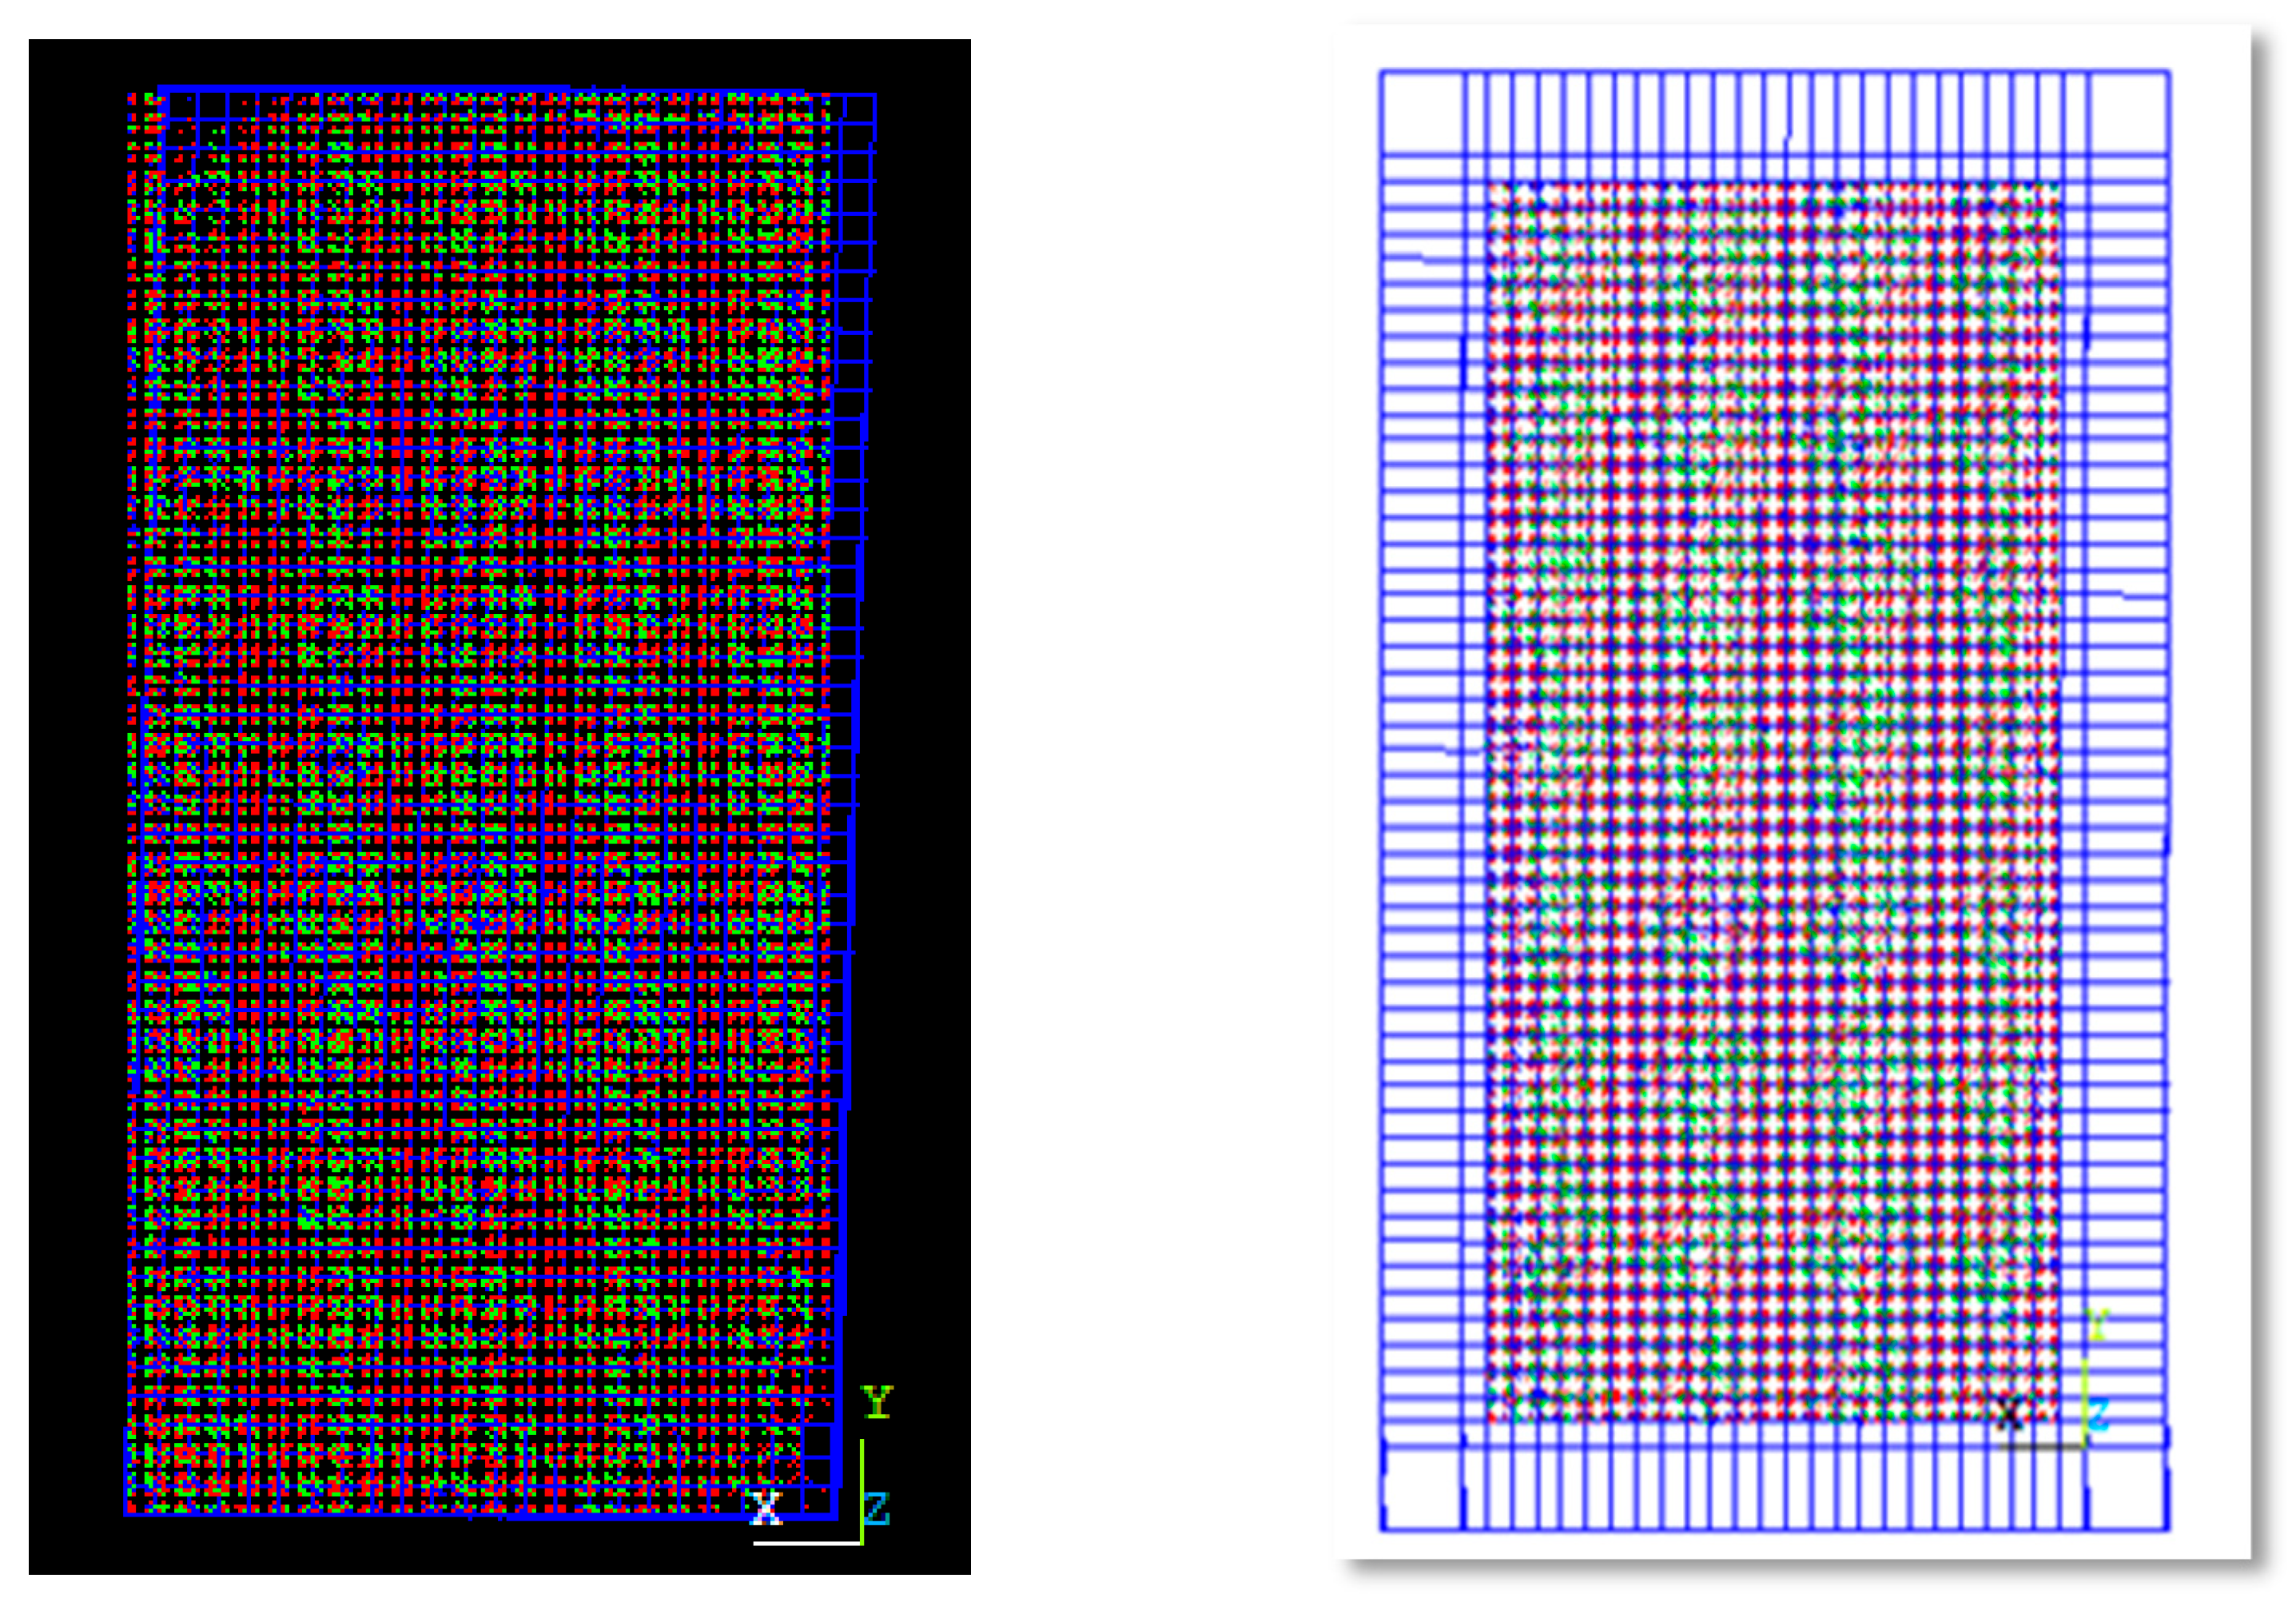
4.1.1. Part and Element of the FE Model
4.1.2. Contact of FE Mode
4.1.3. Boundary Conditions
4.1.4. Steel Constitutive Model
4.1.5. Concrete Constitutive Model
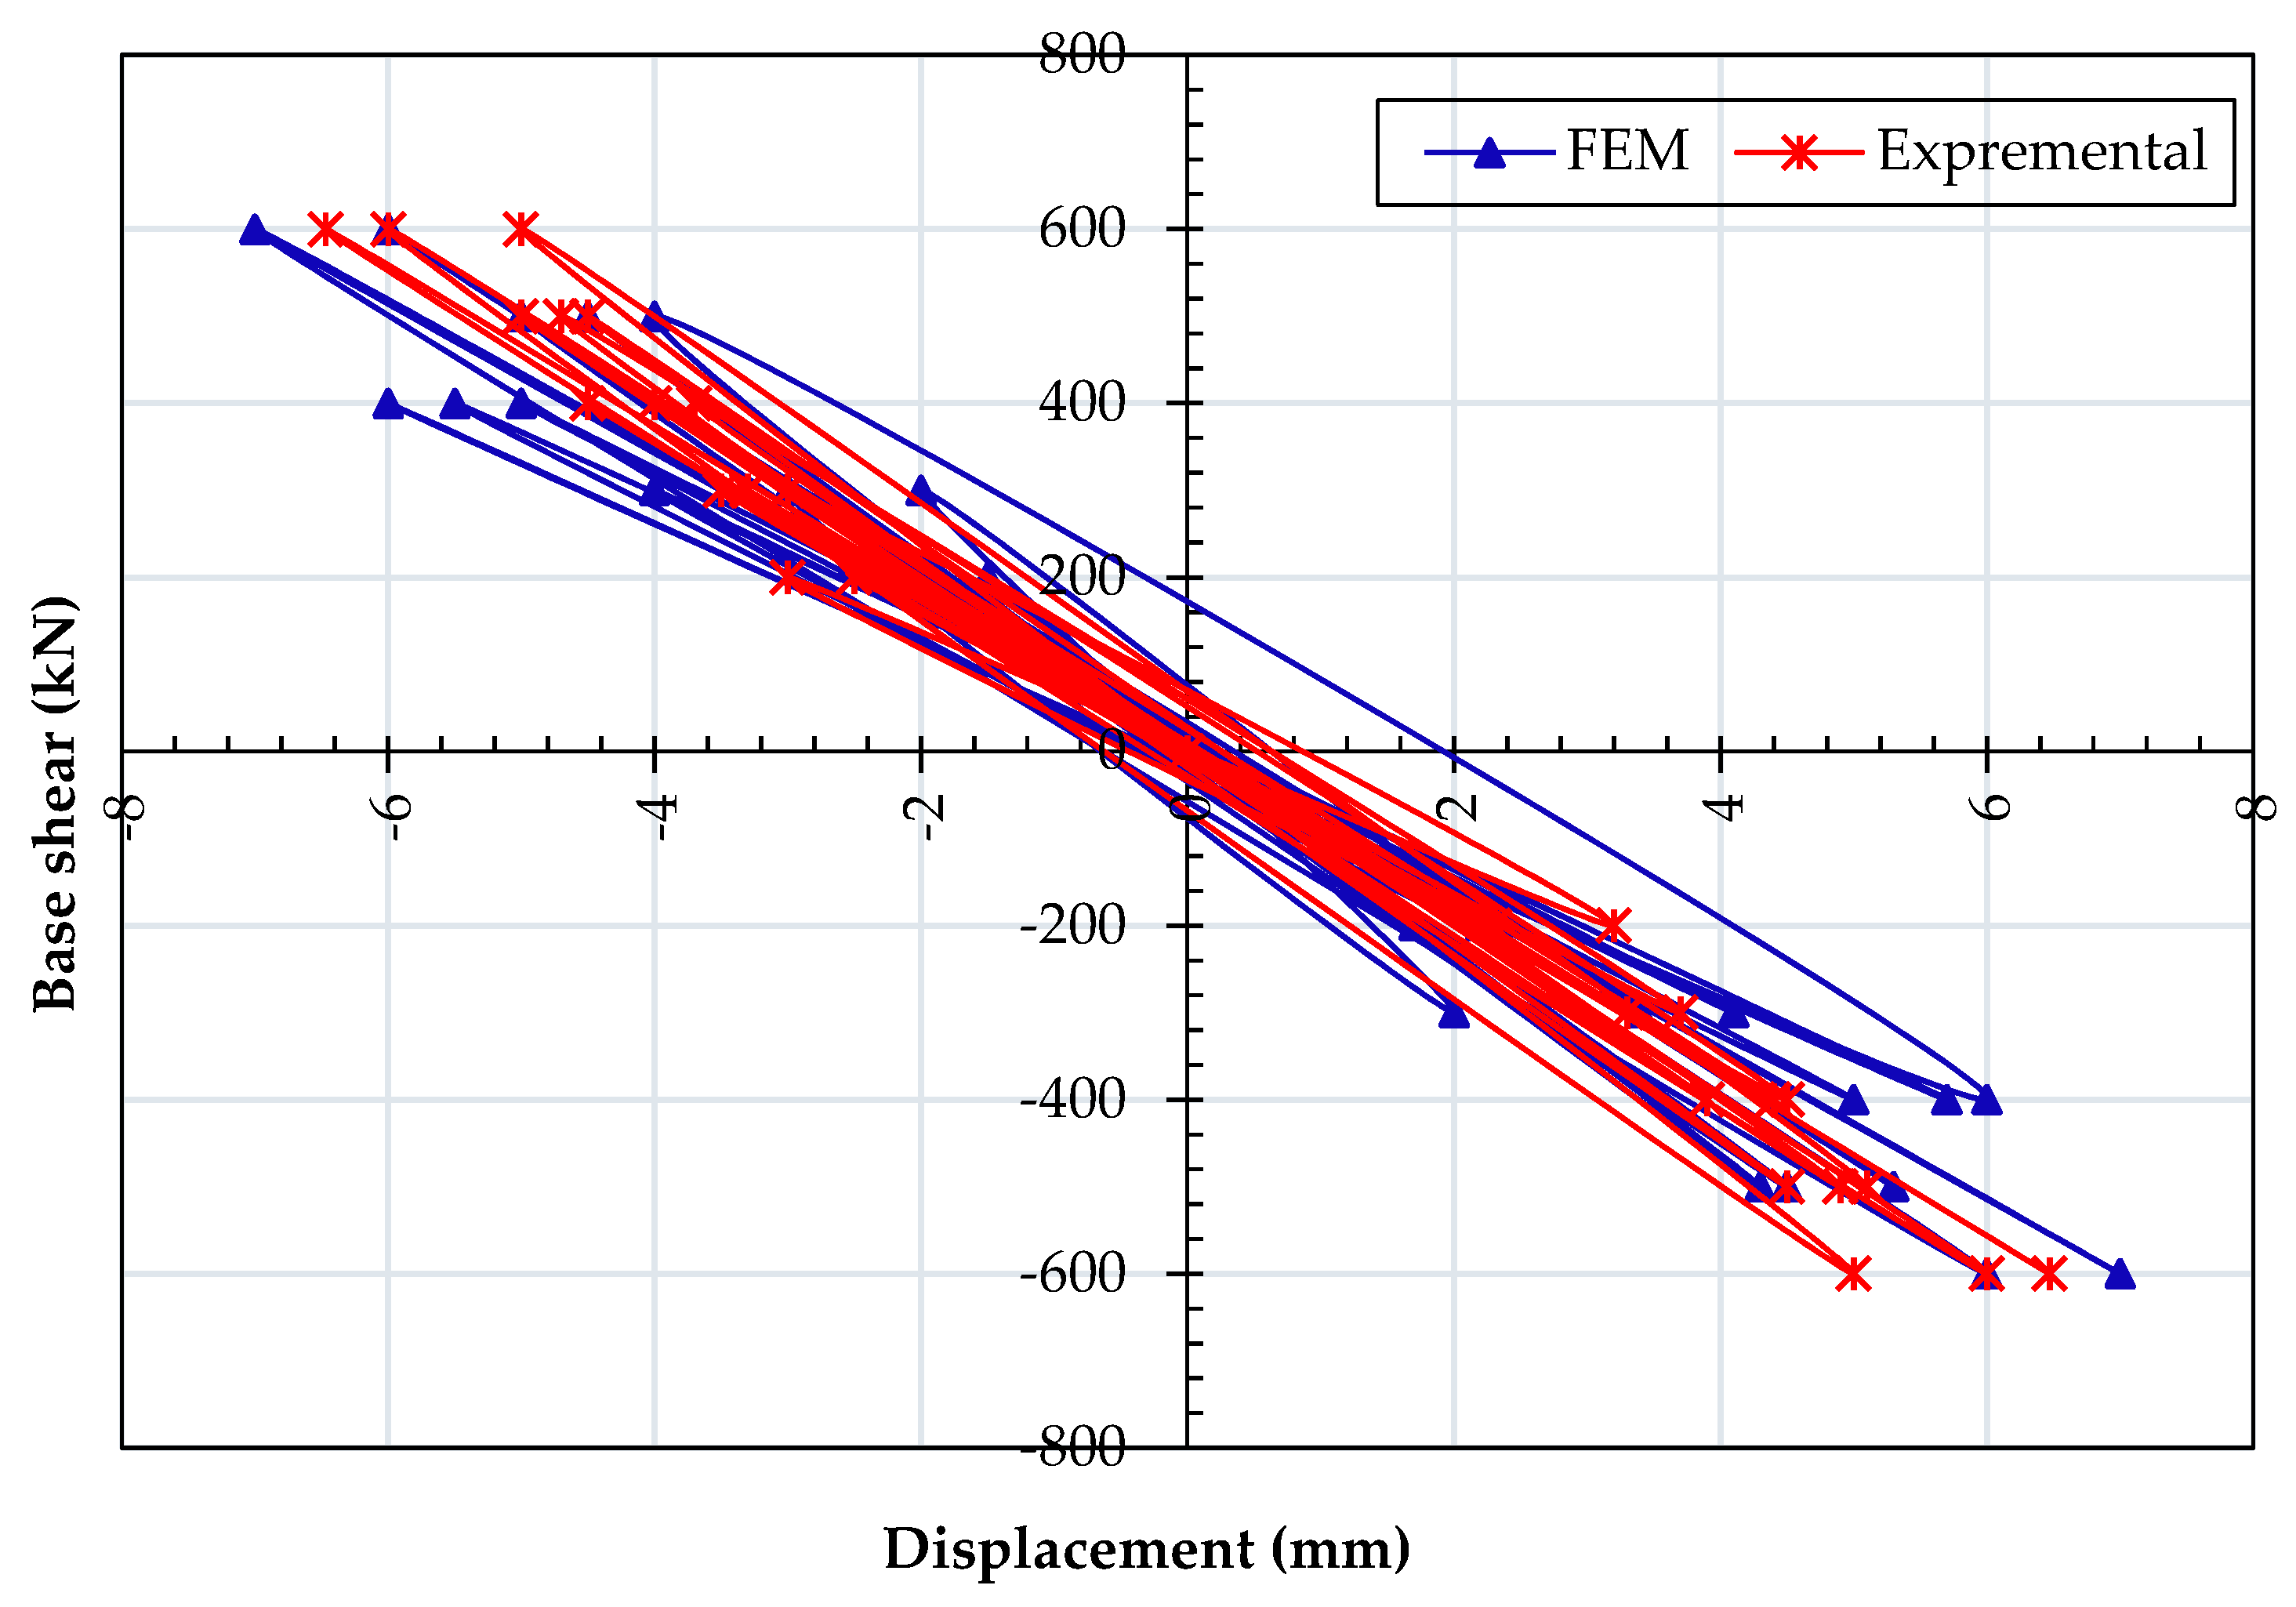
4.2. Validation of Finite Element Model
5. Parametric Analysis
5.1. Influence Rules of the Parameters
- The initial elastic stiffness phase;
- The shear yielding stiffness phase;
- The post-yielding stiffness phase;
- The pre-failure stiffness phase.
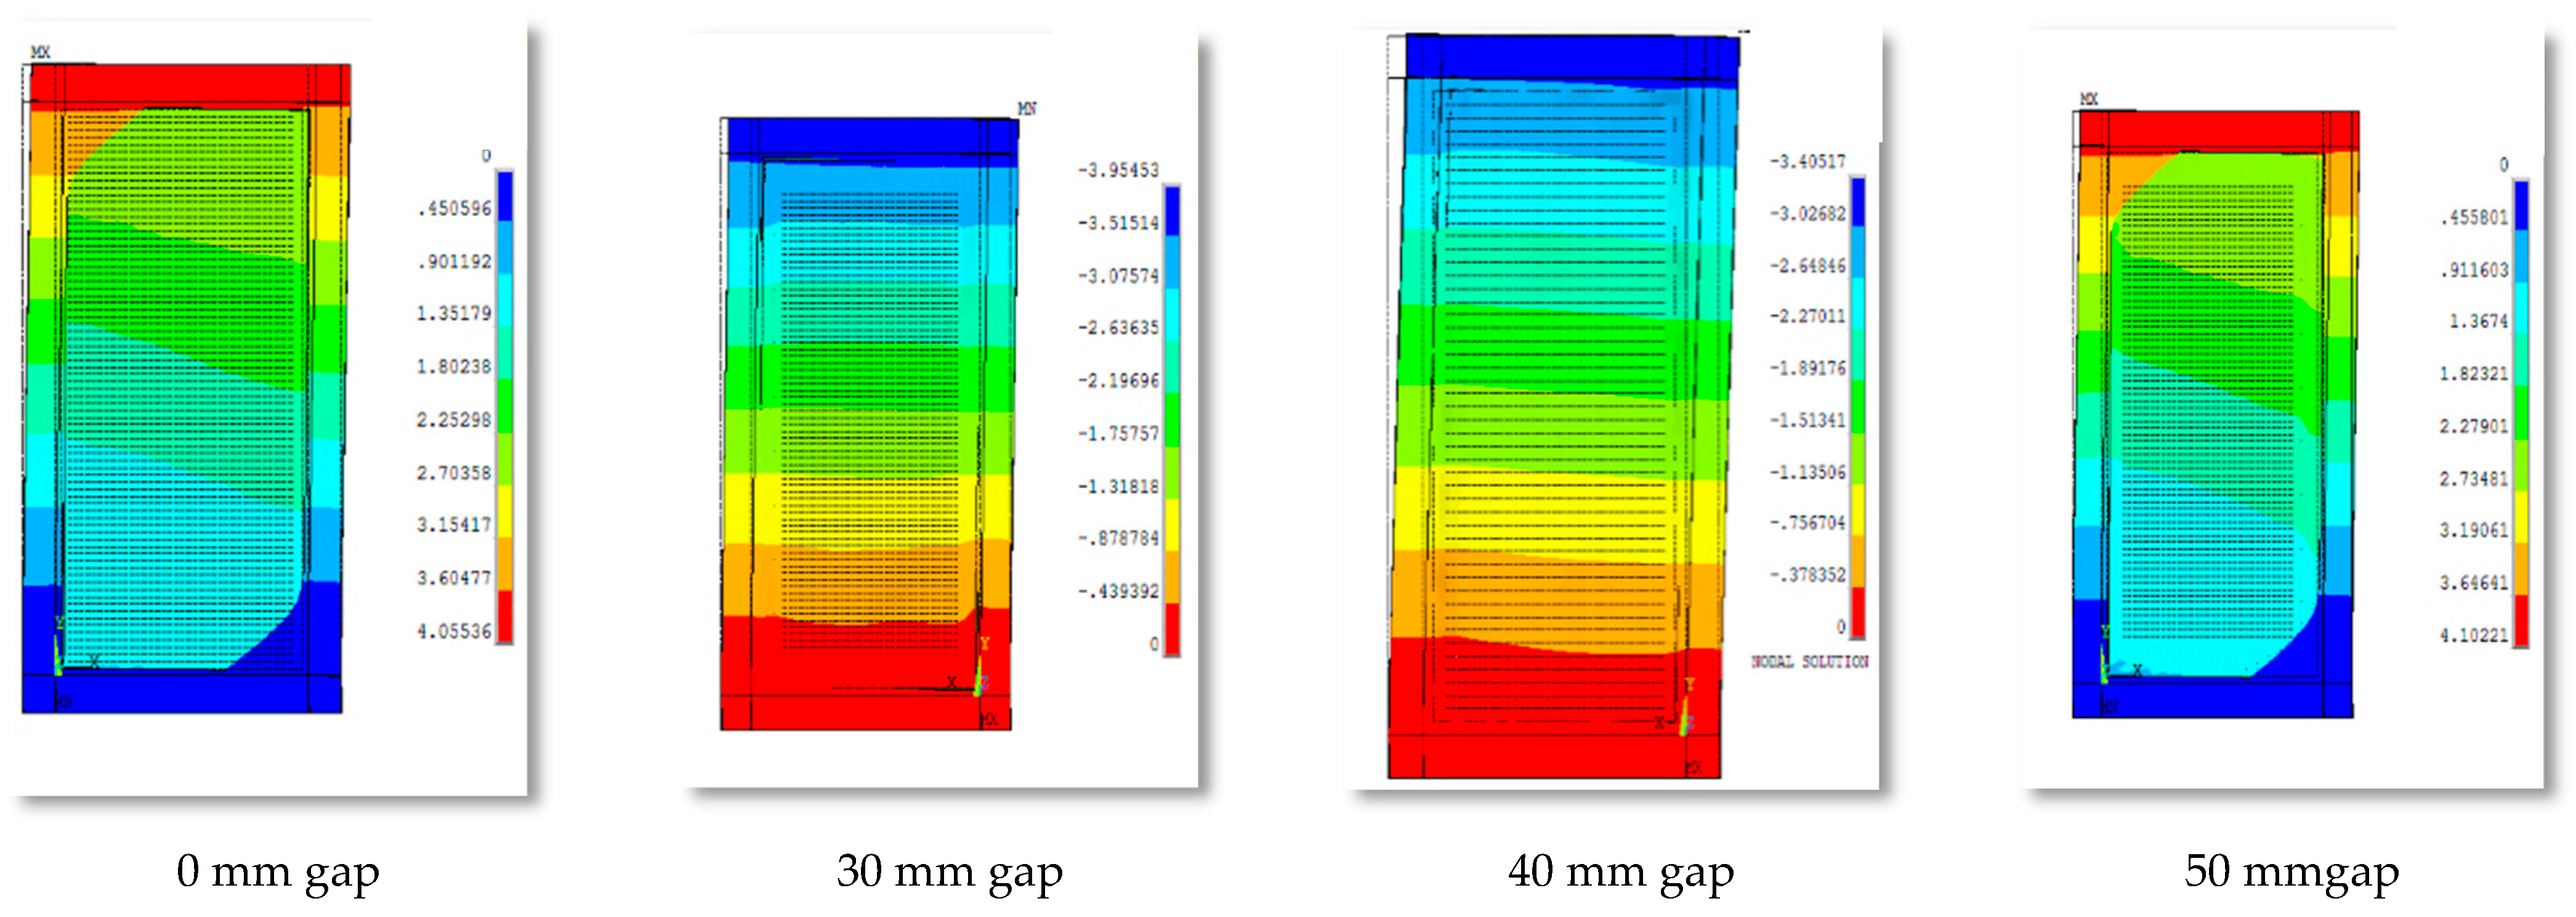
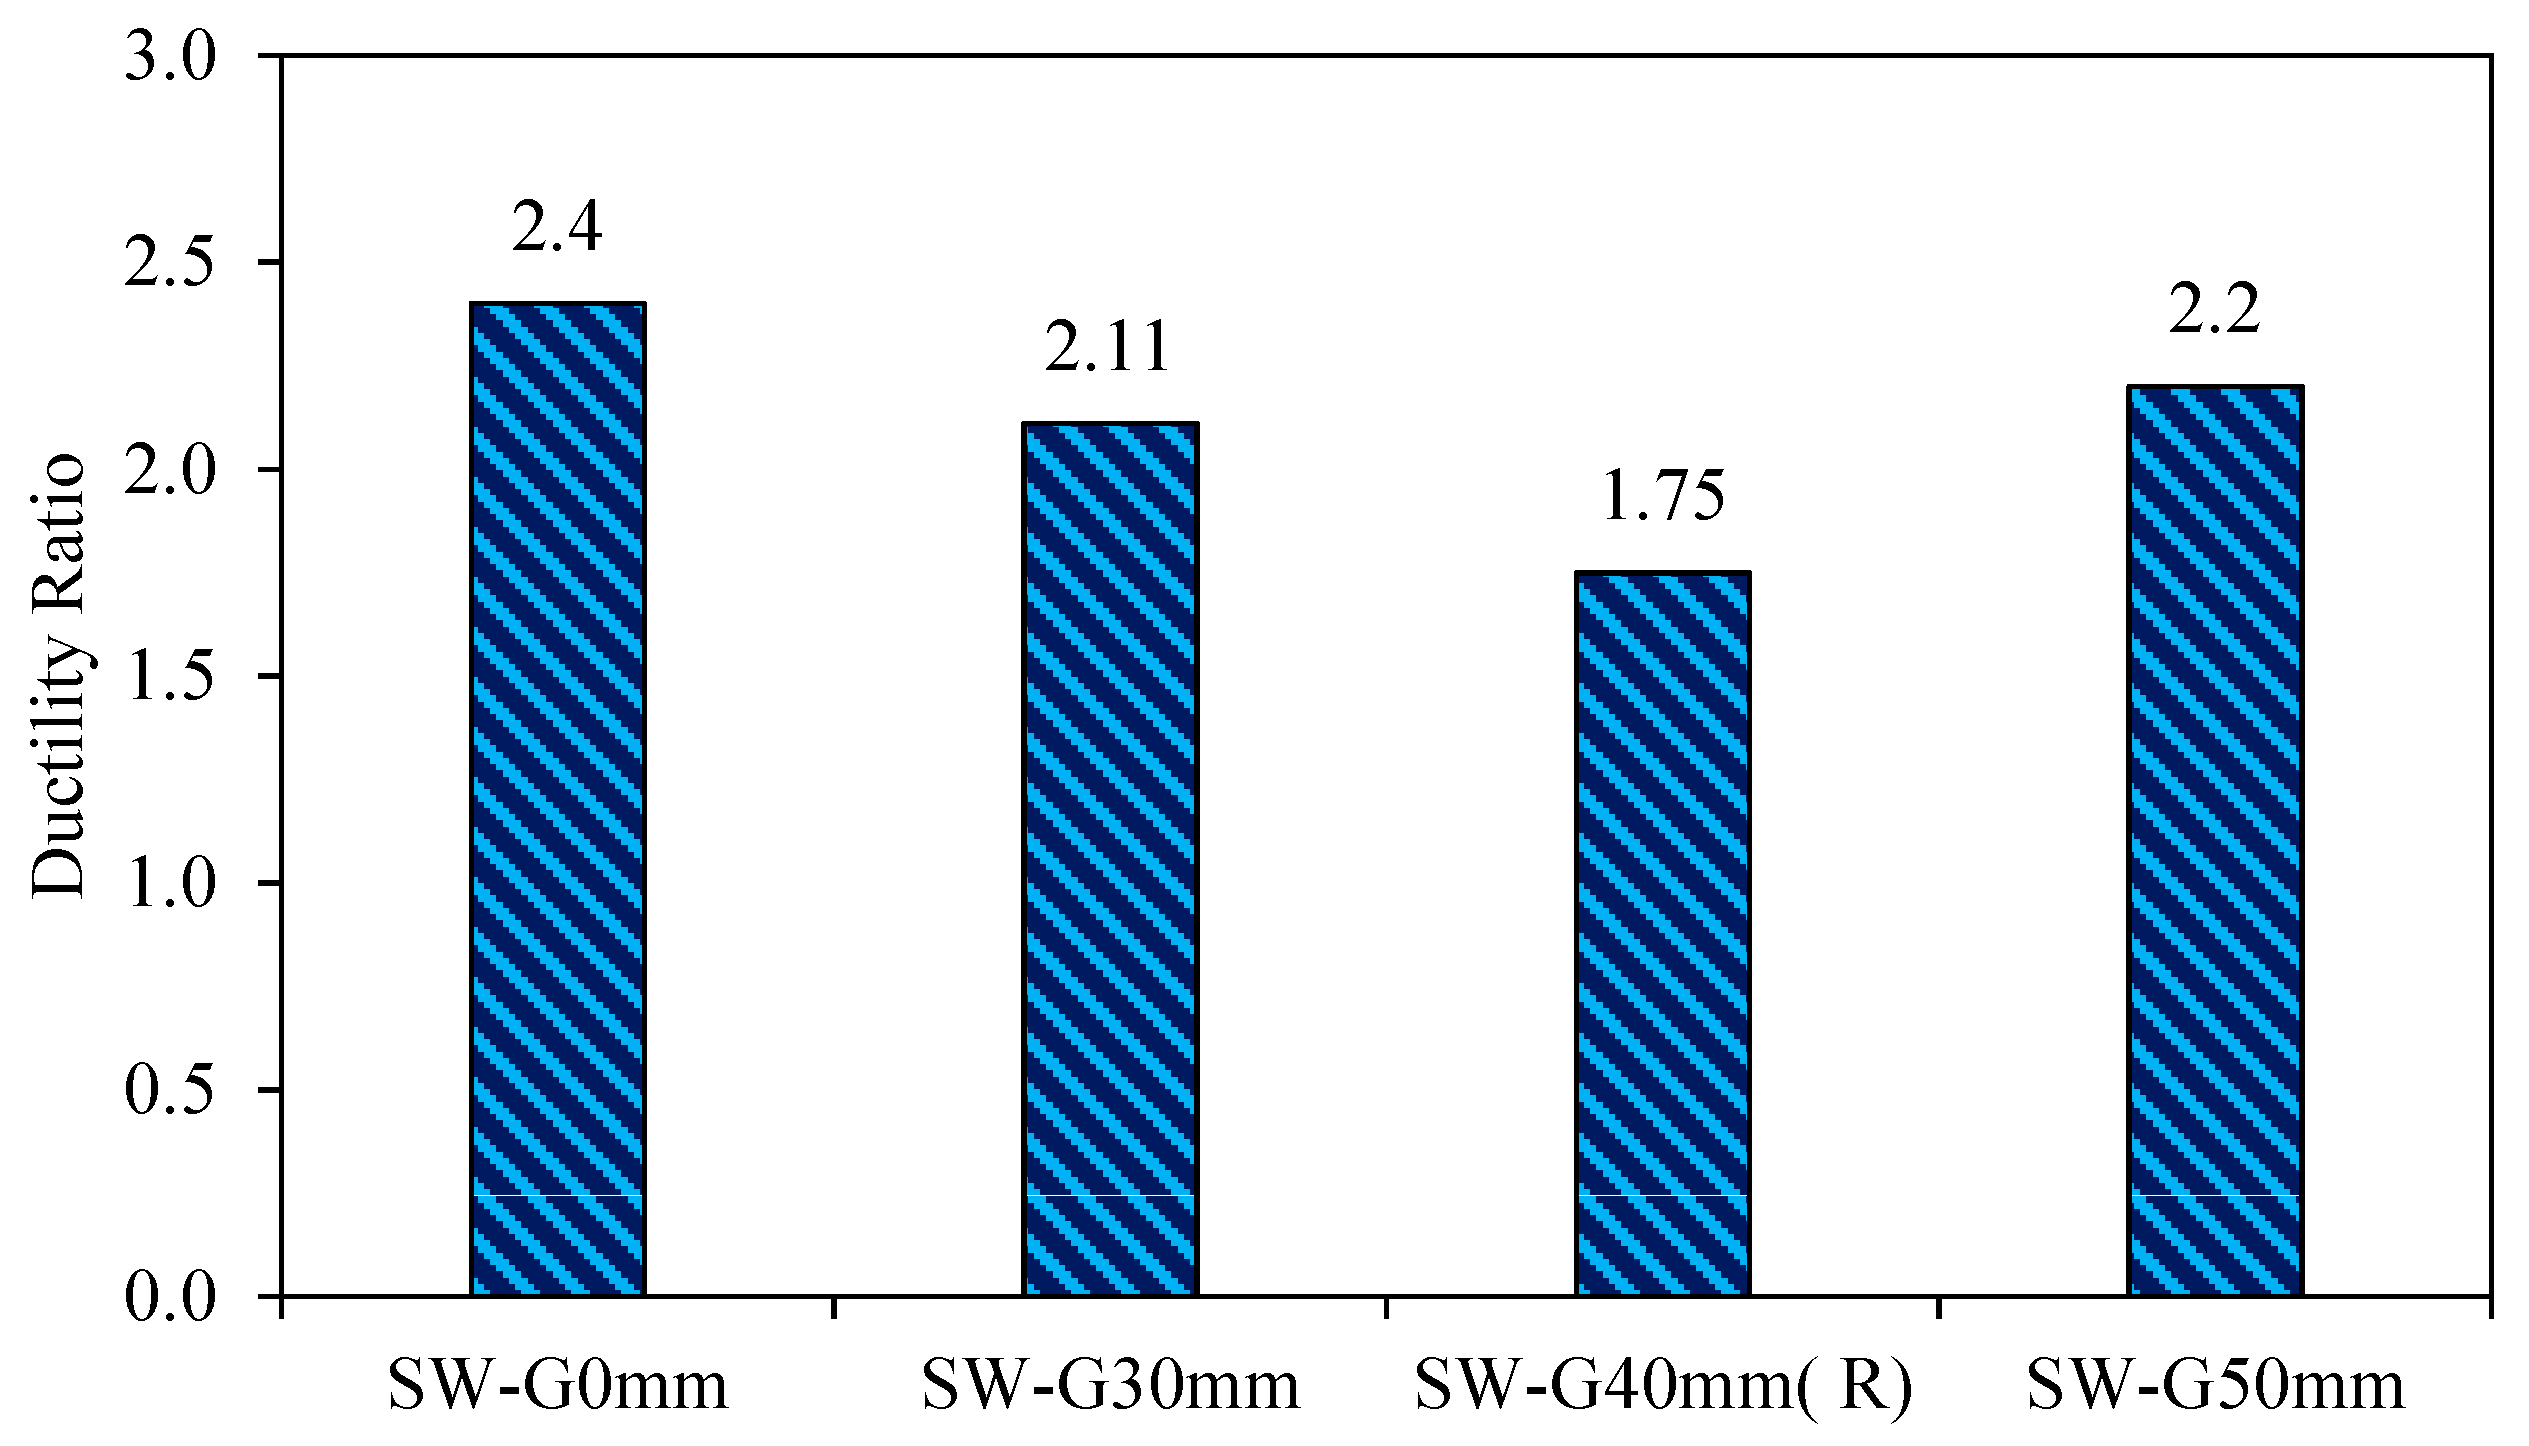
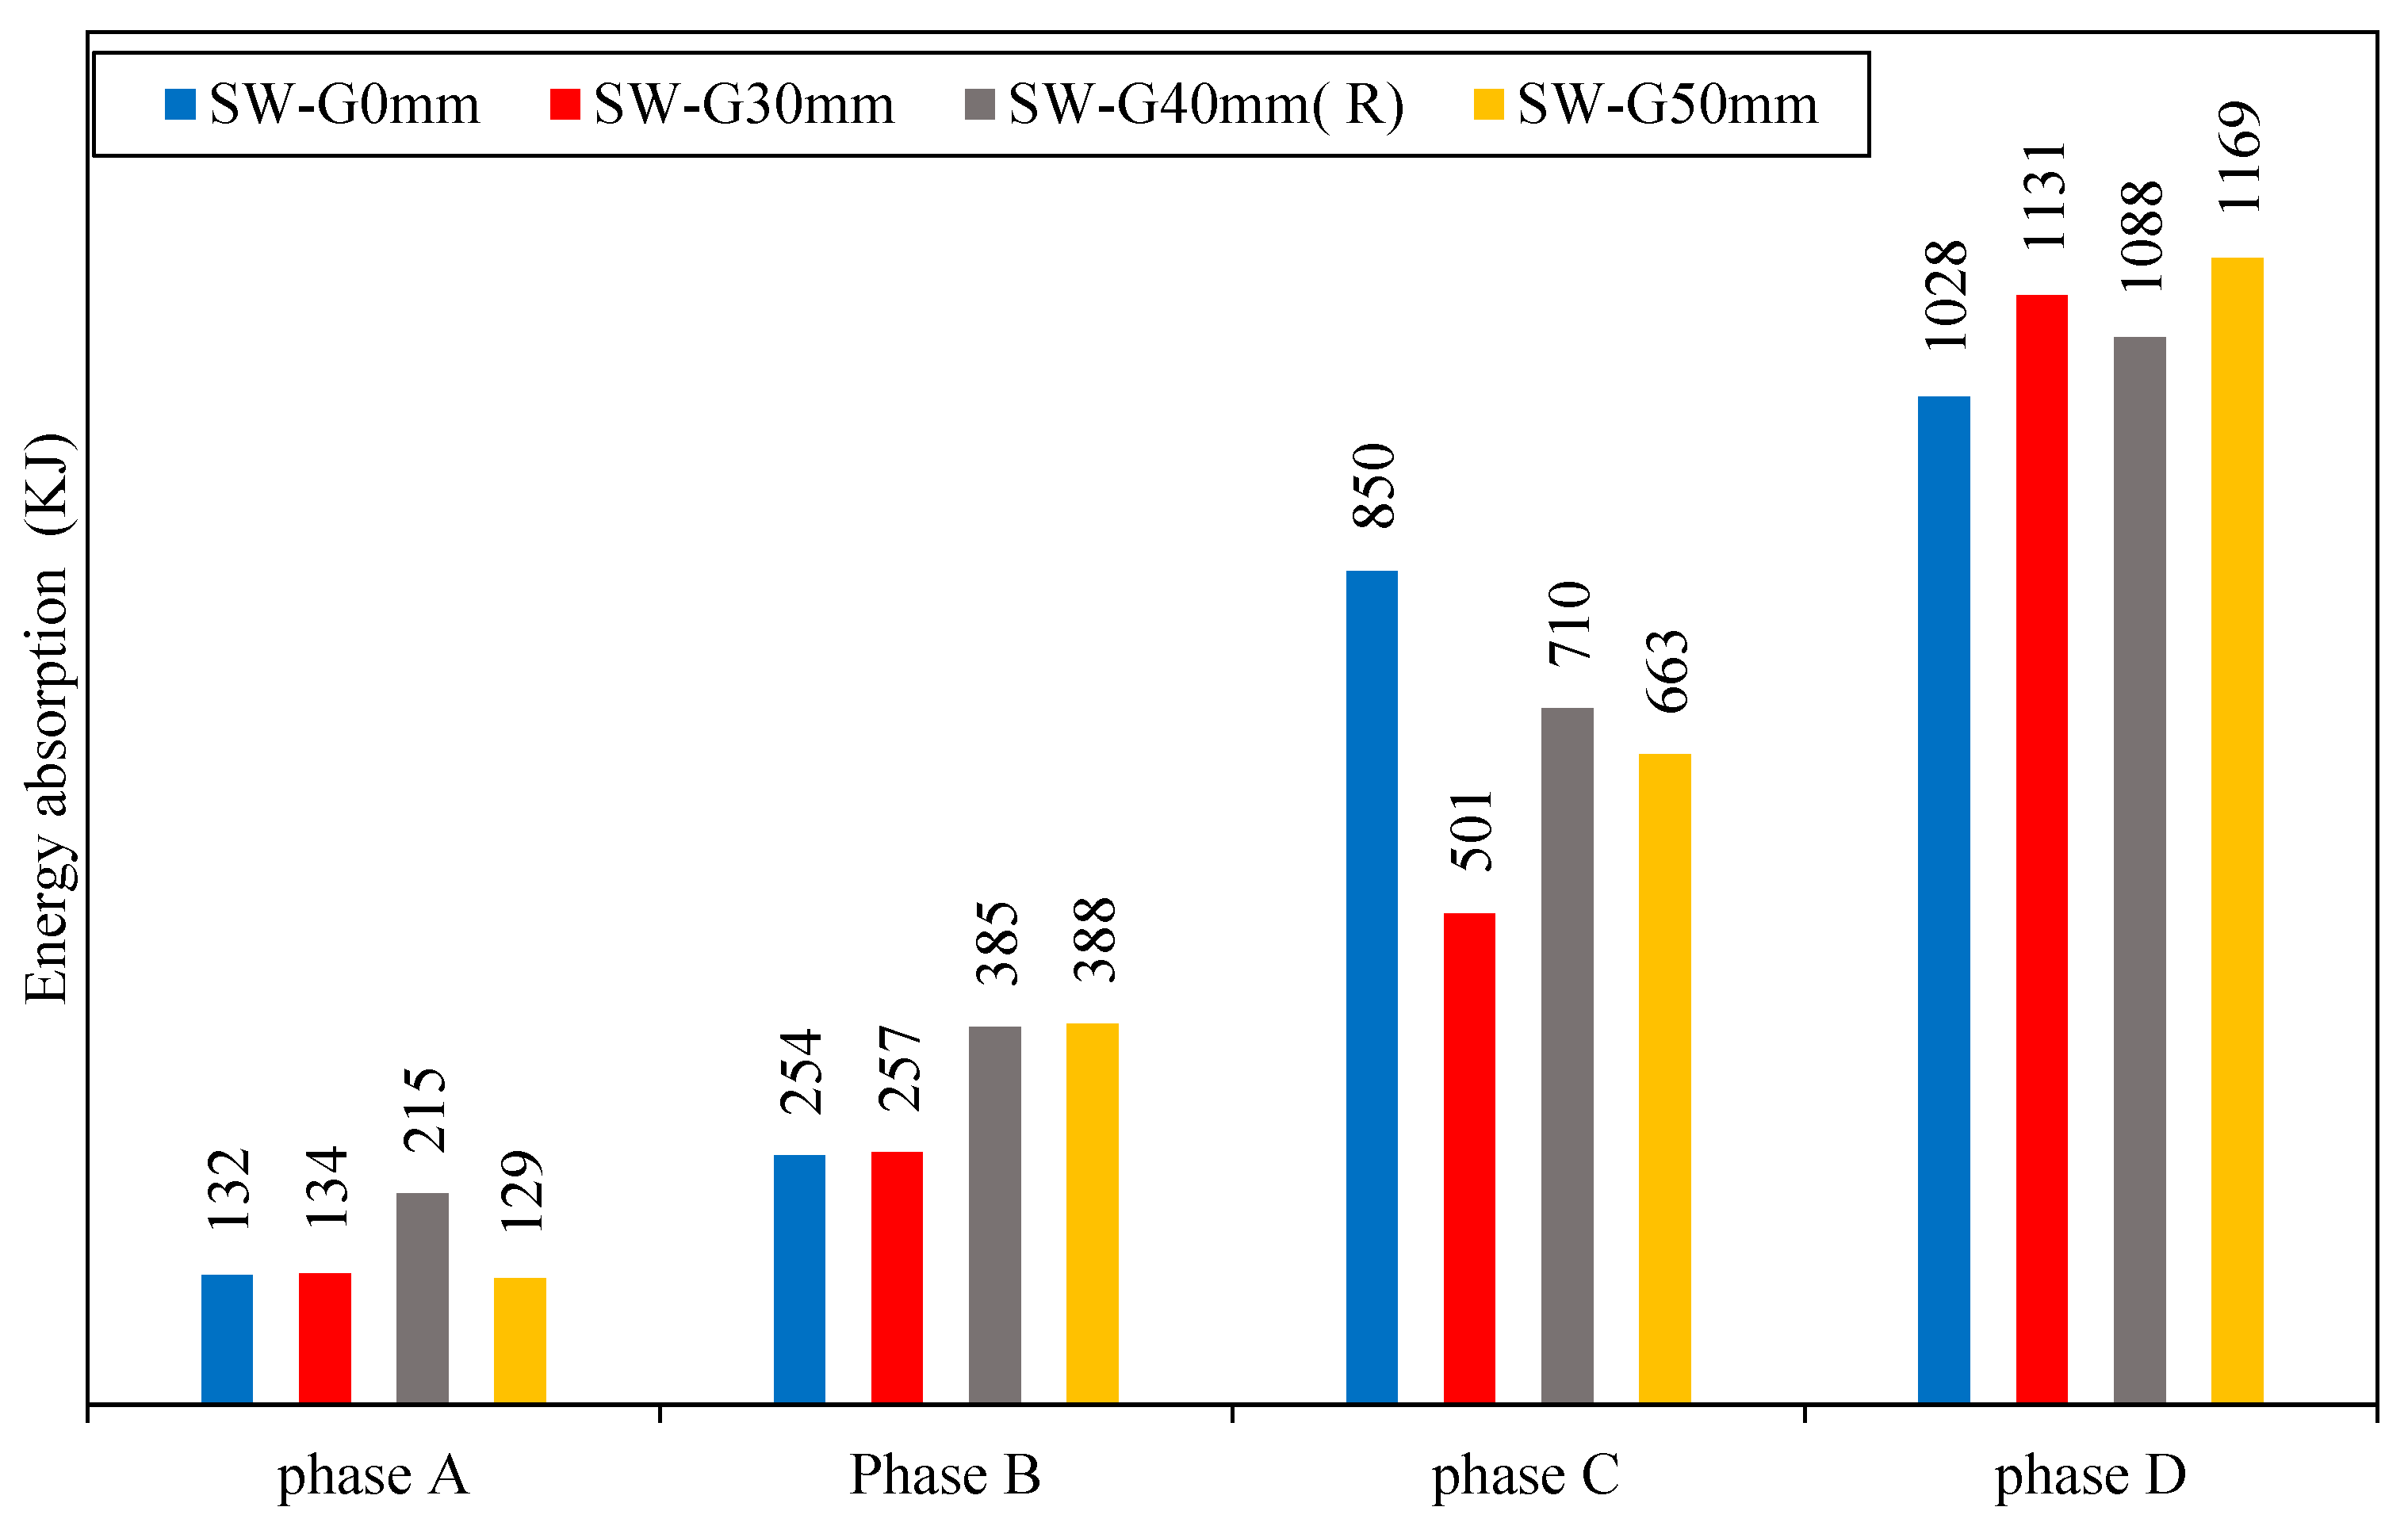
5.1.1. The First-Group Models (Influence of Gap between Concrete Wall and Steel Frame)
- 1.
- Lateral displacement
- Phase A:
- Phase B:
- Phase C:
- Phase D:
- 2.
- Stiffness
- 3.
- Ductility
- 4.
- Energy Absorption
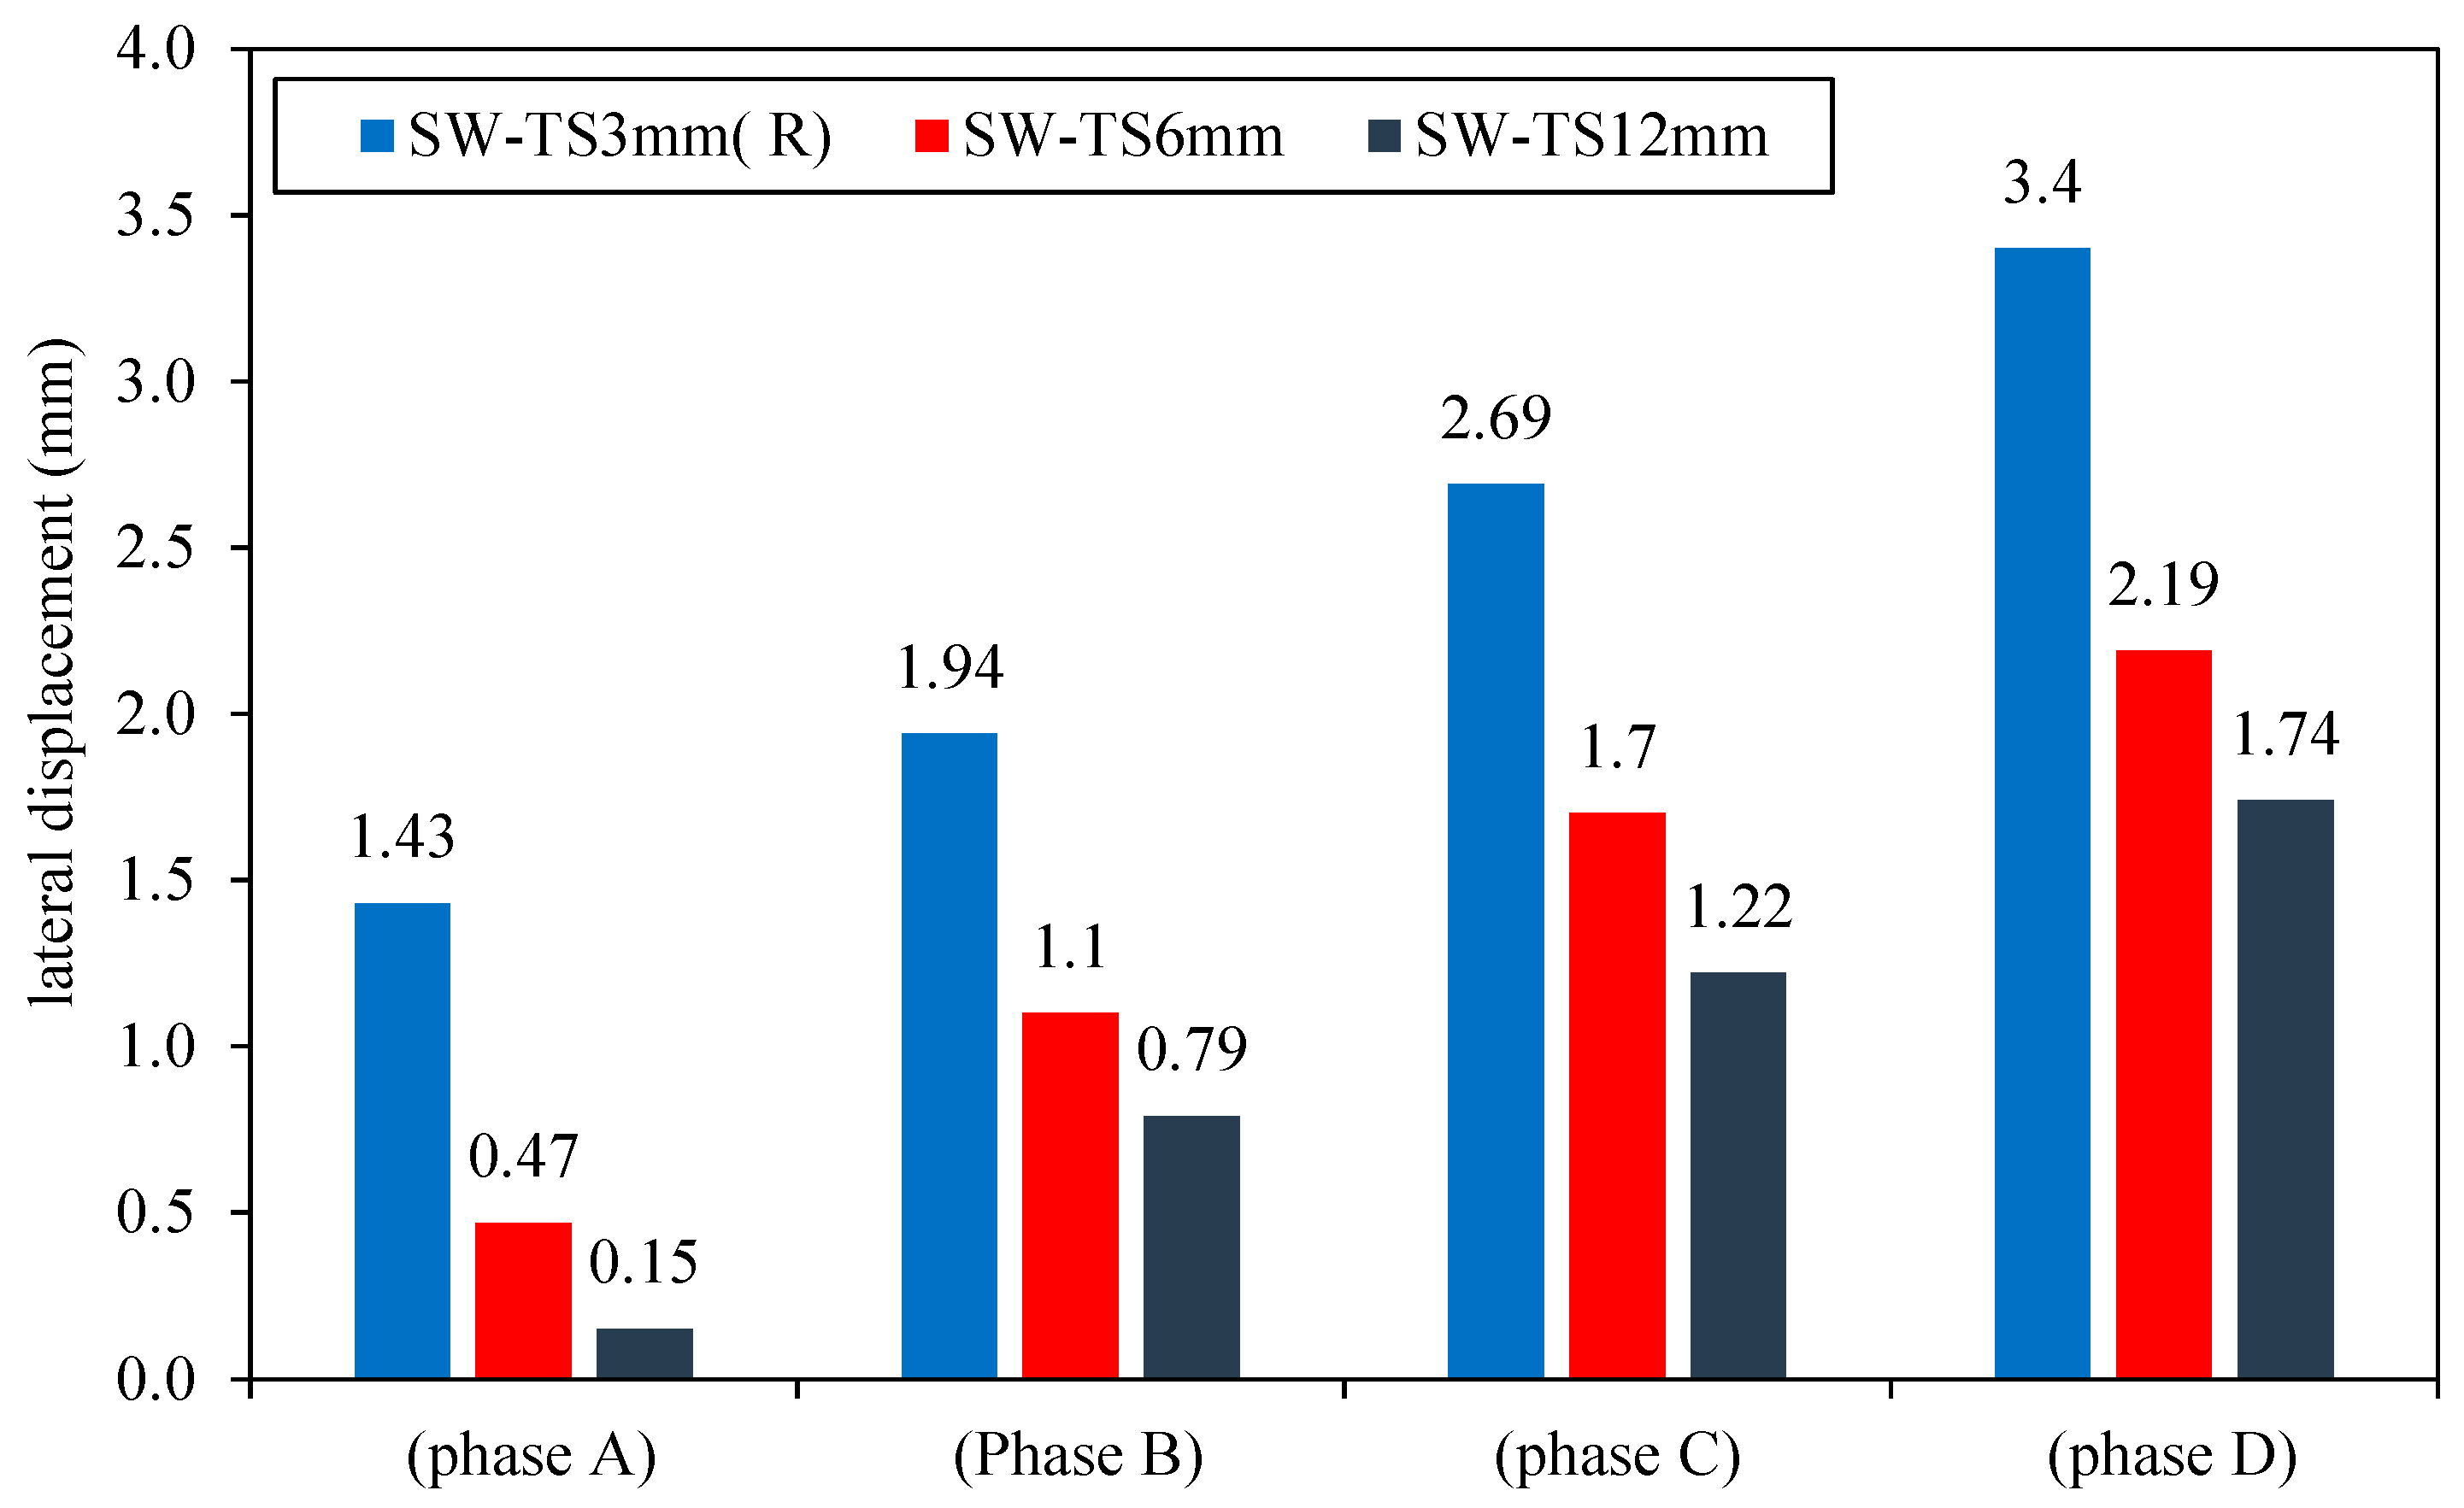
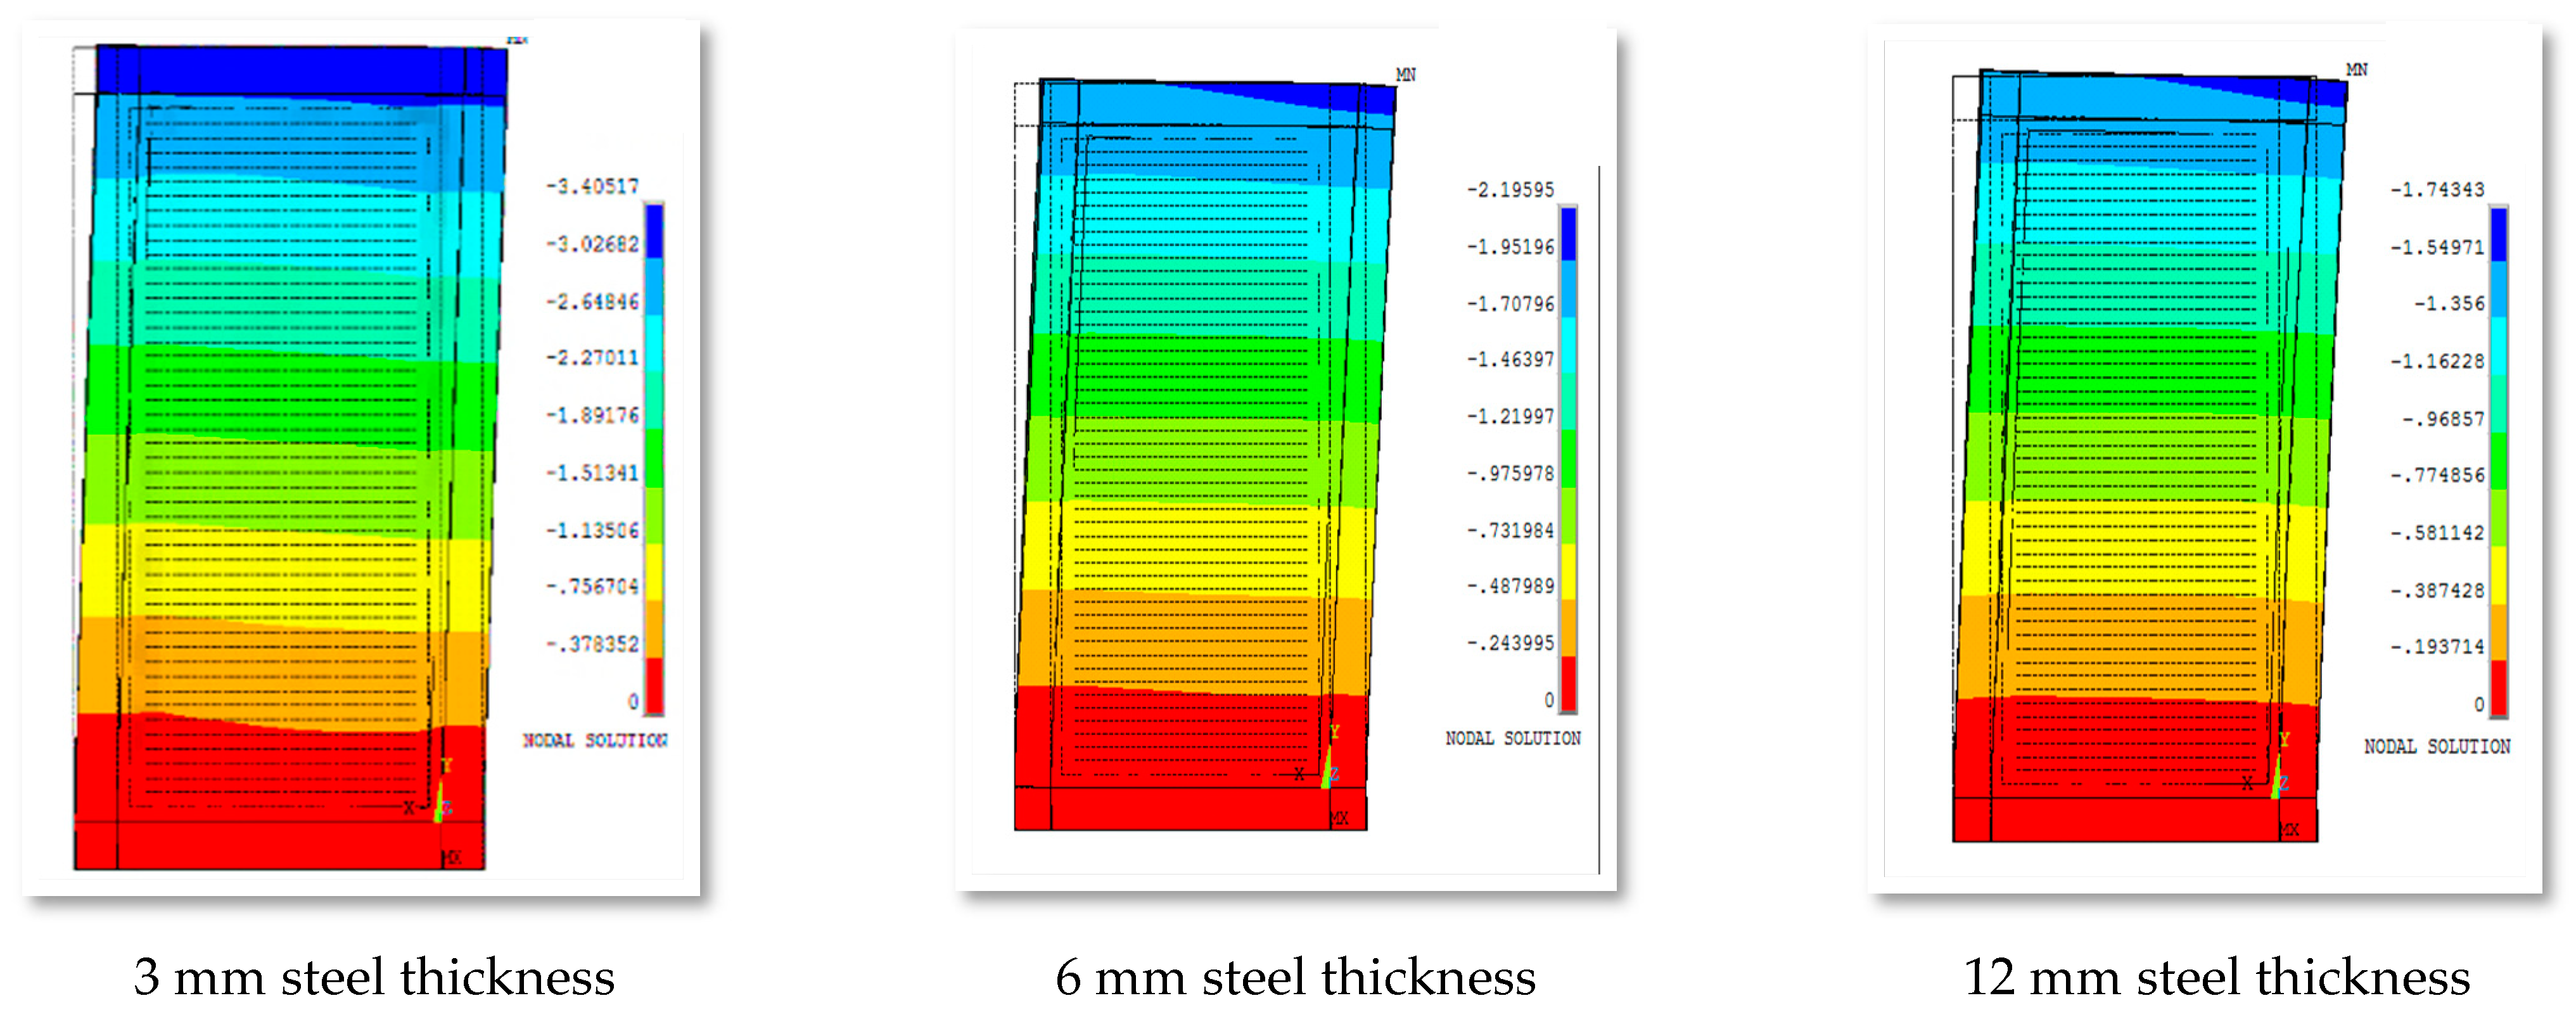
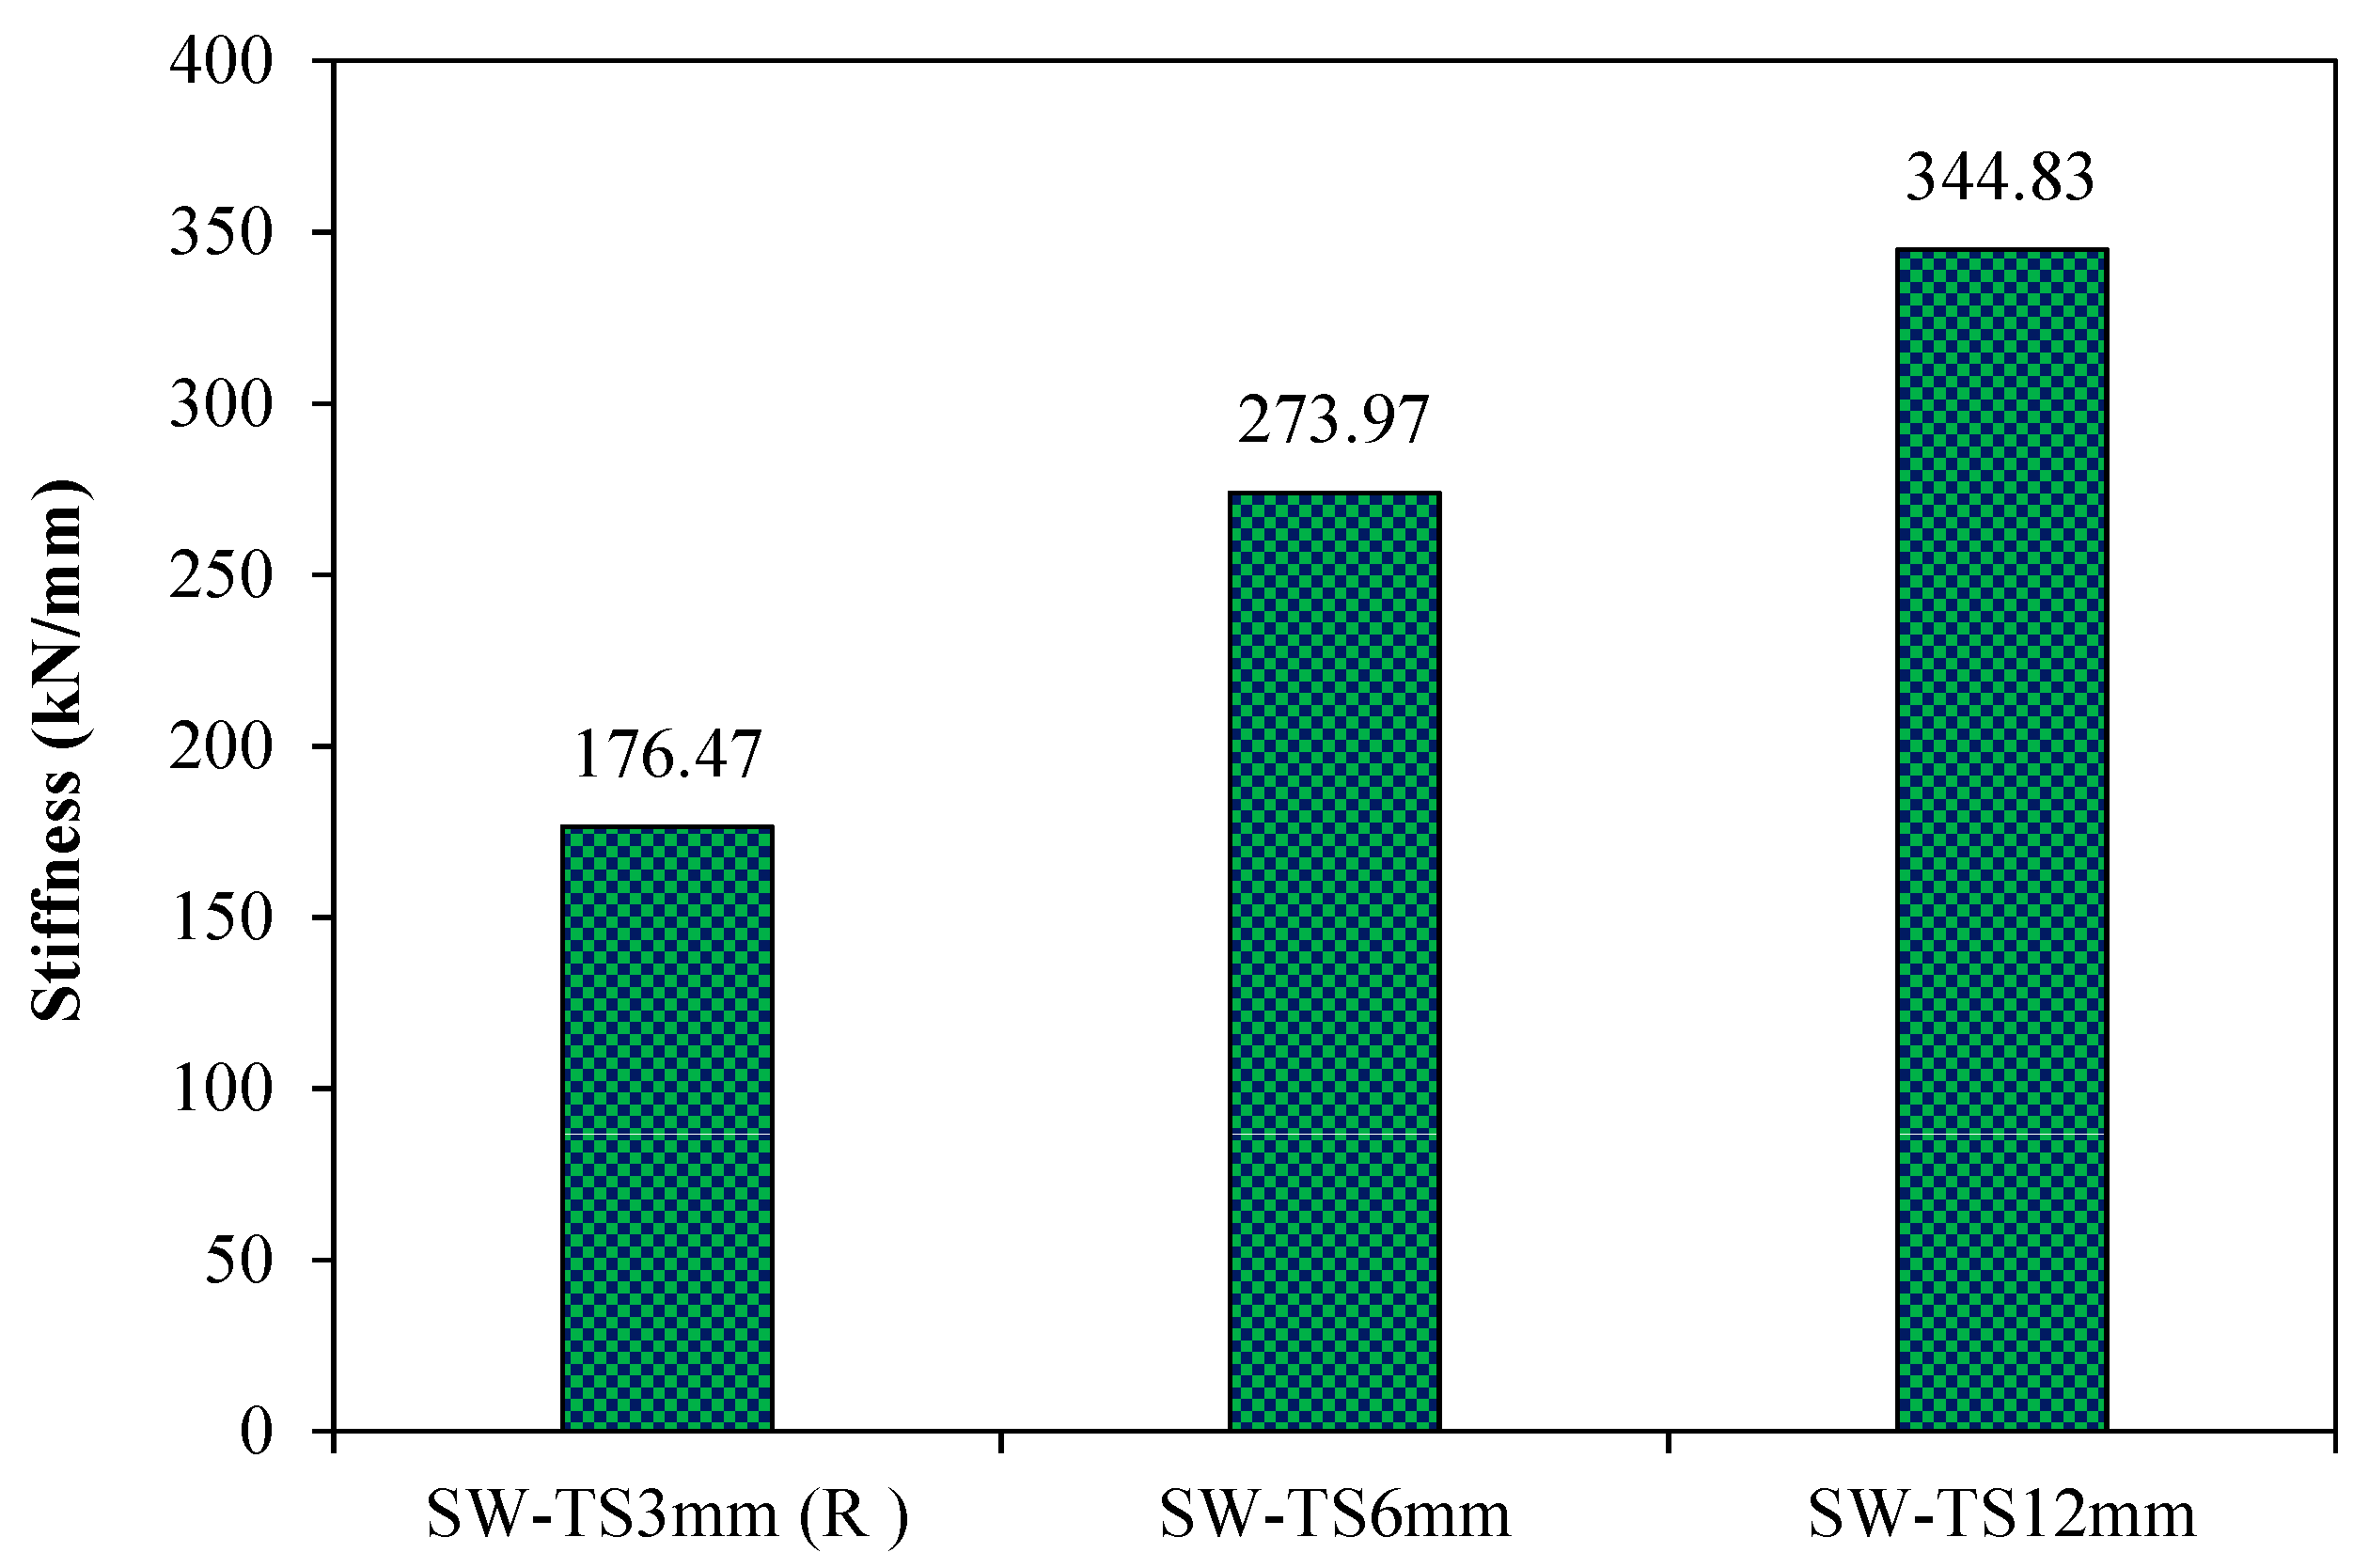
5.1.2. The Second-Group Models (Influence of Infill Steel Plate Thickness)
- 1.
- Lateral displacement
- Phase A:
- Phase B:
- Phase C:
- Phase D:
- 2.
- Stiffness
- 3.
- Ductility
- 4.
- Energy Absorption
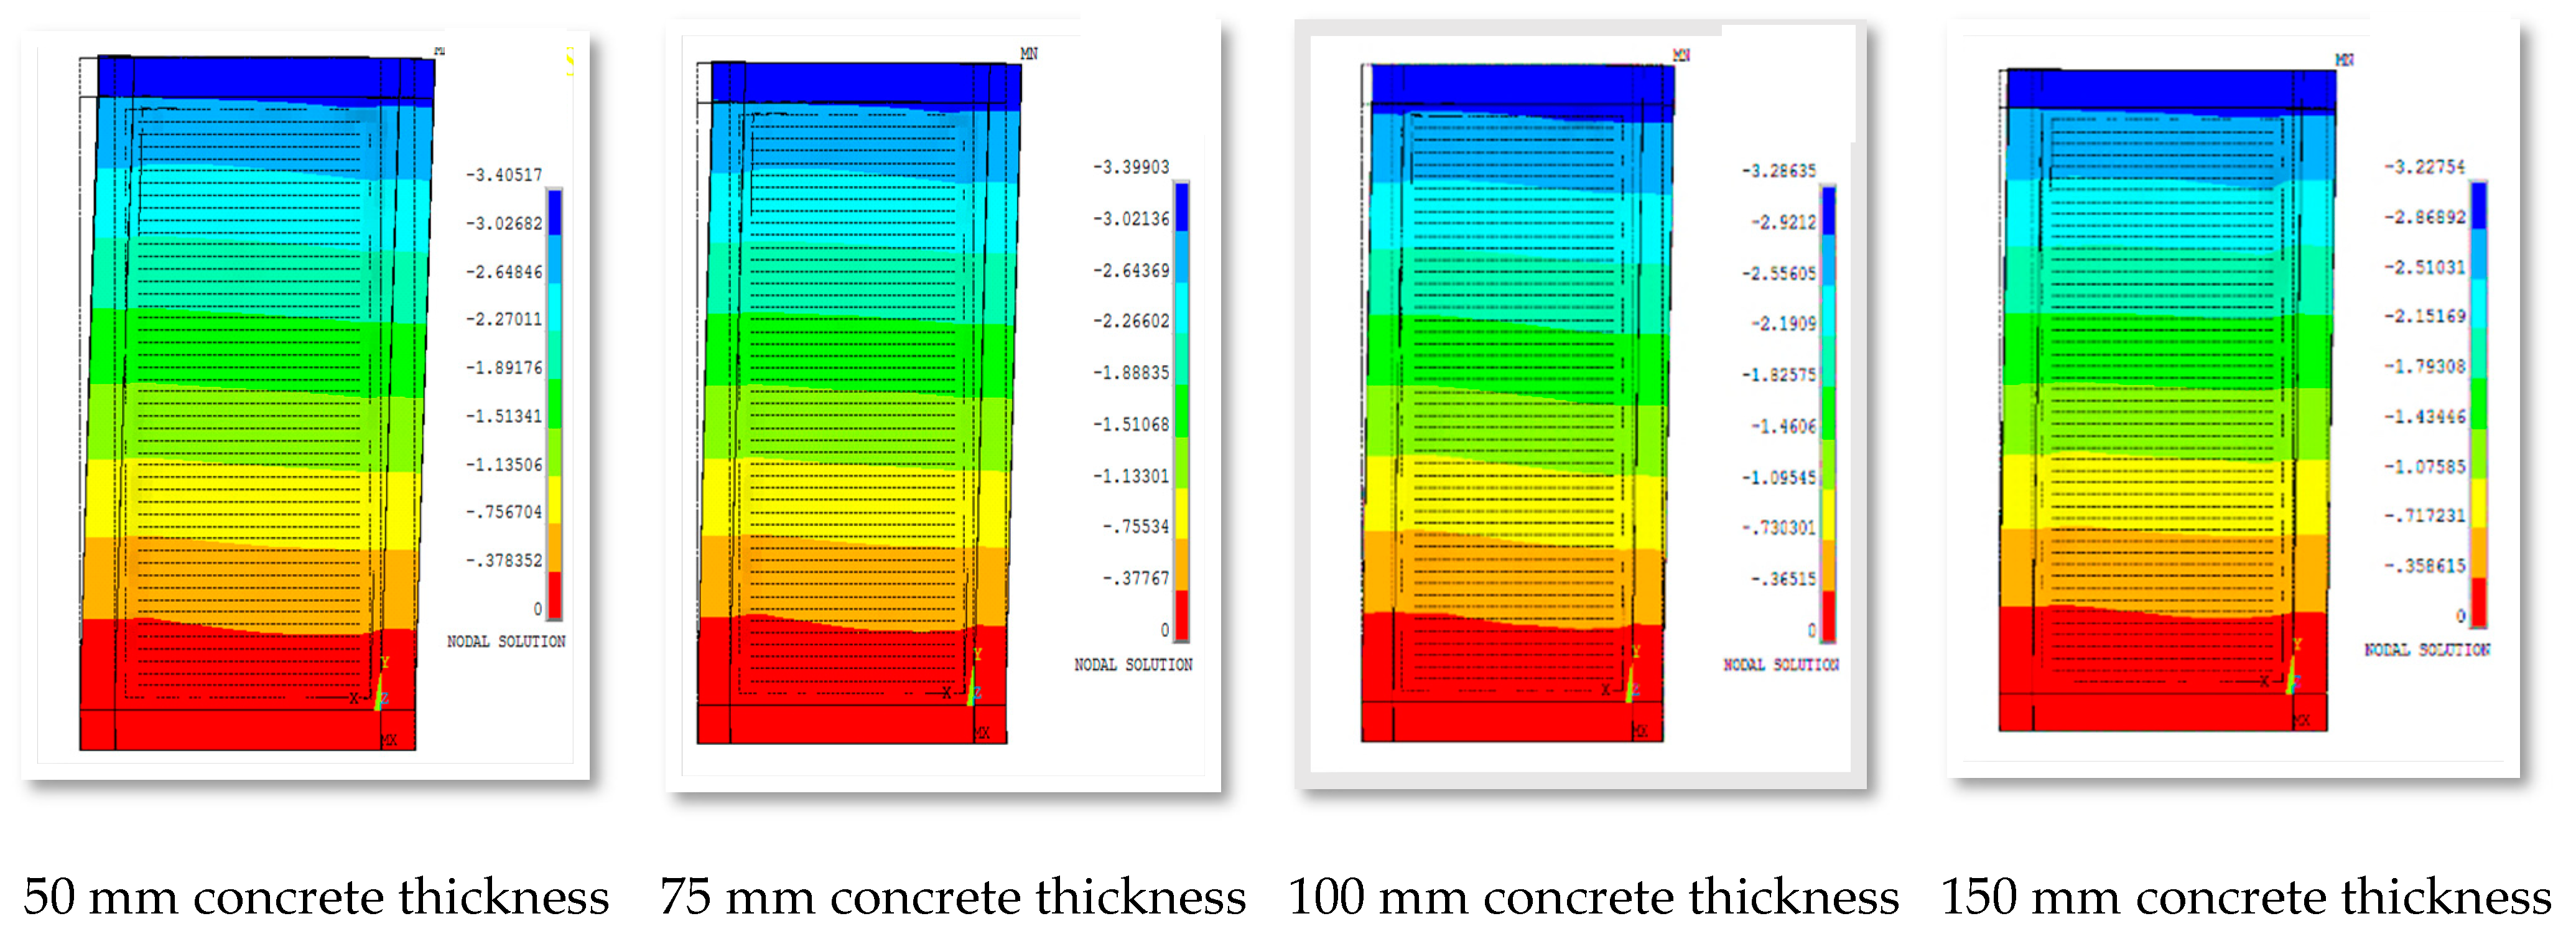
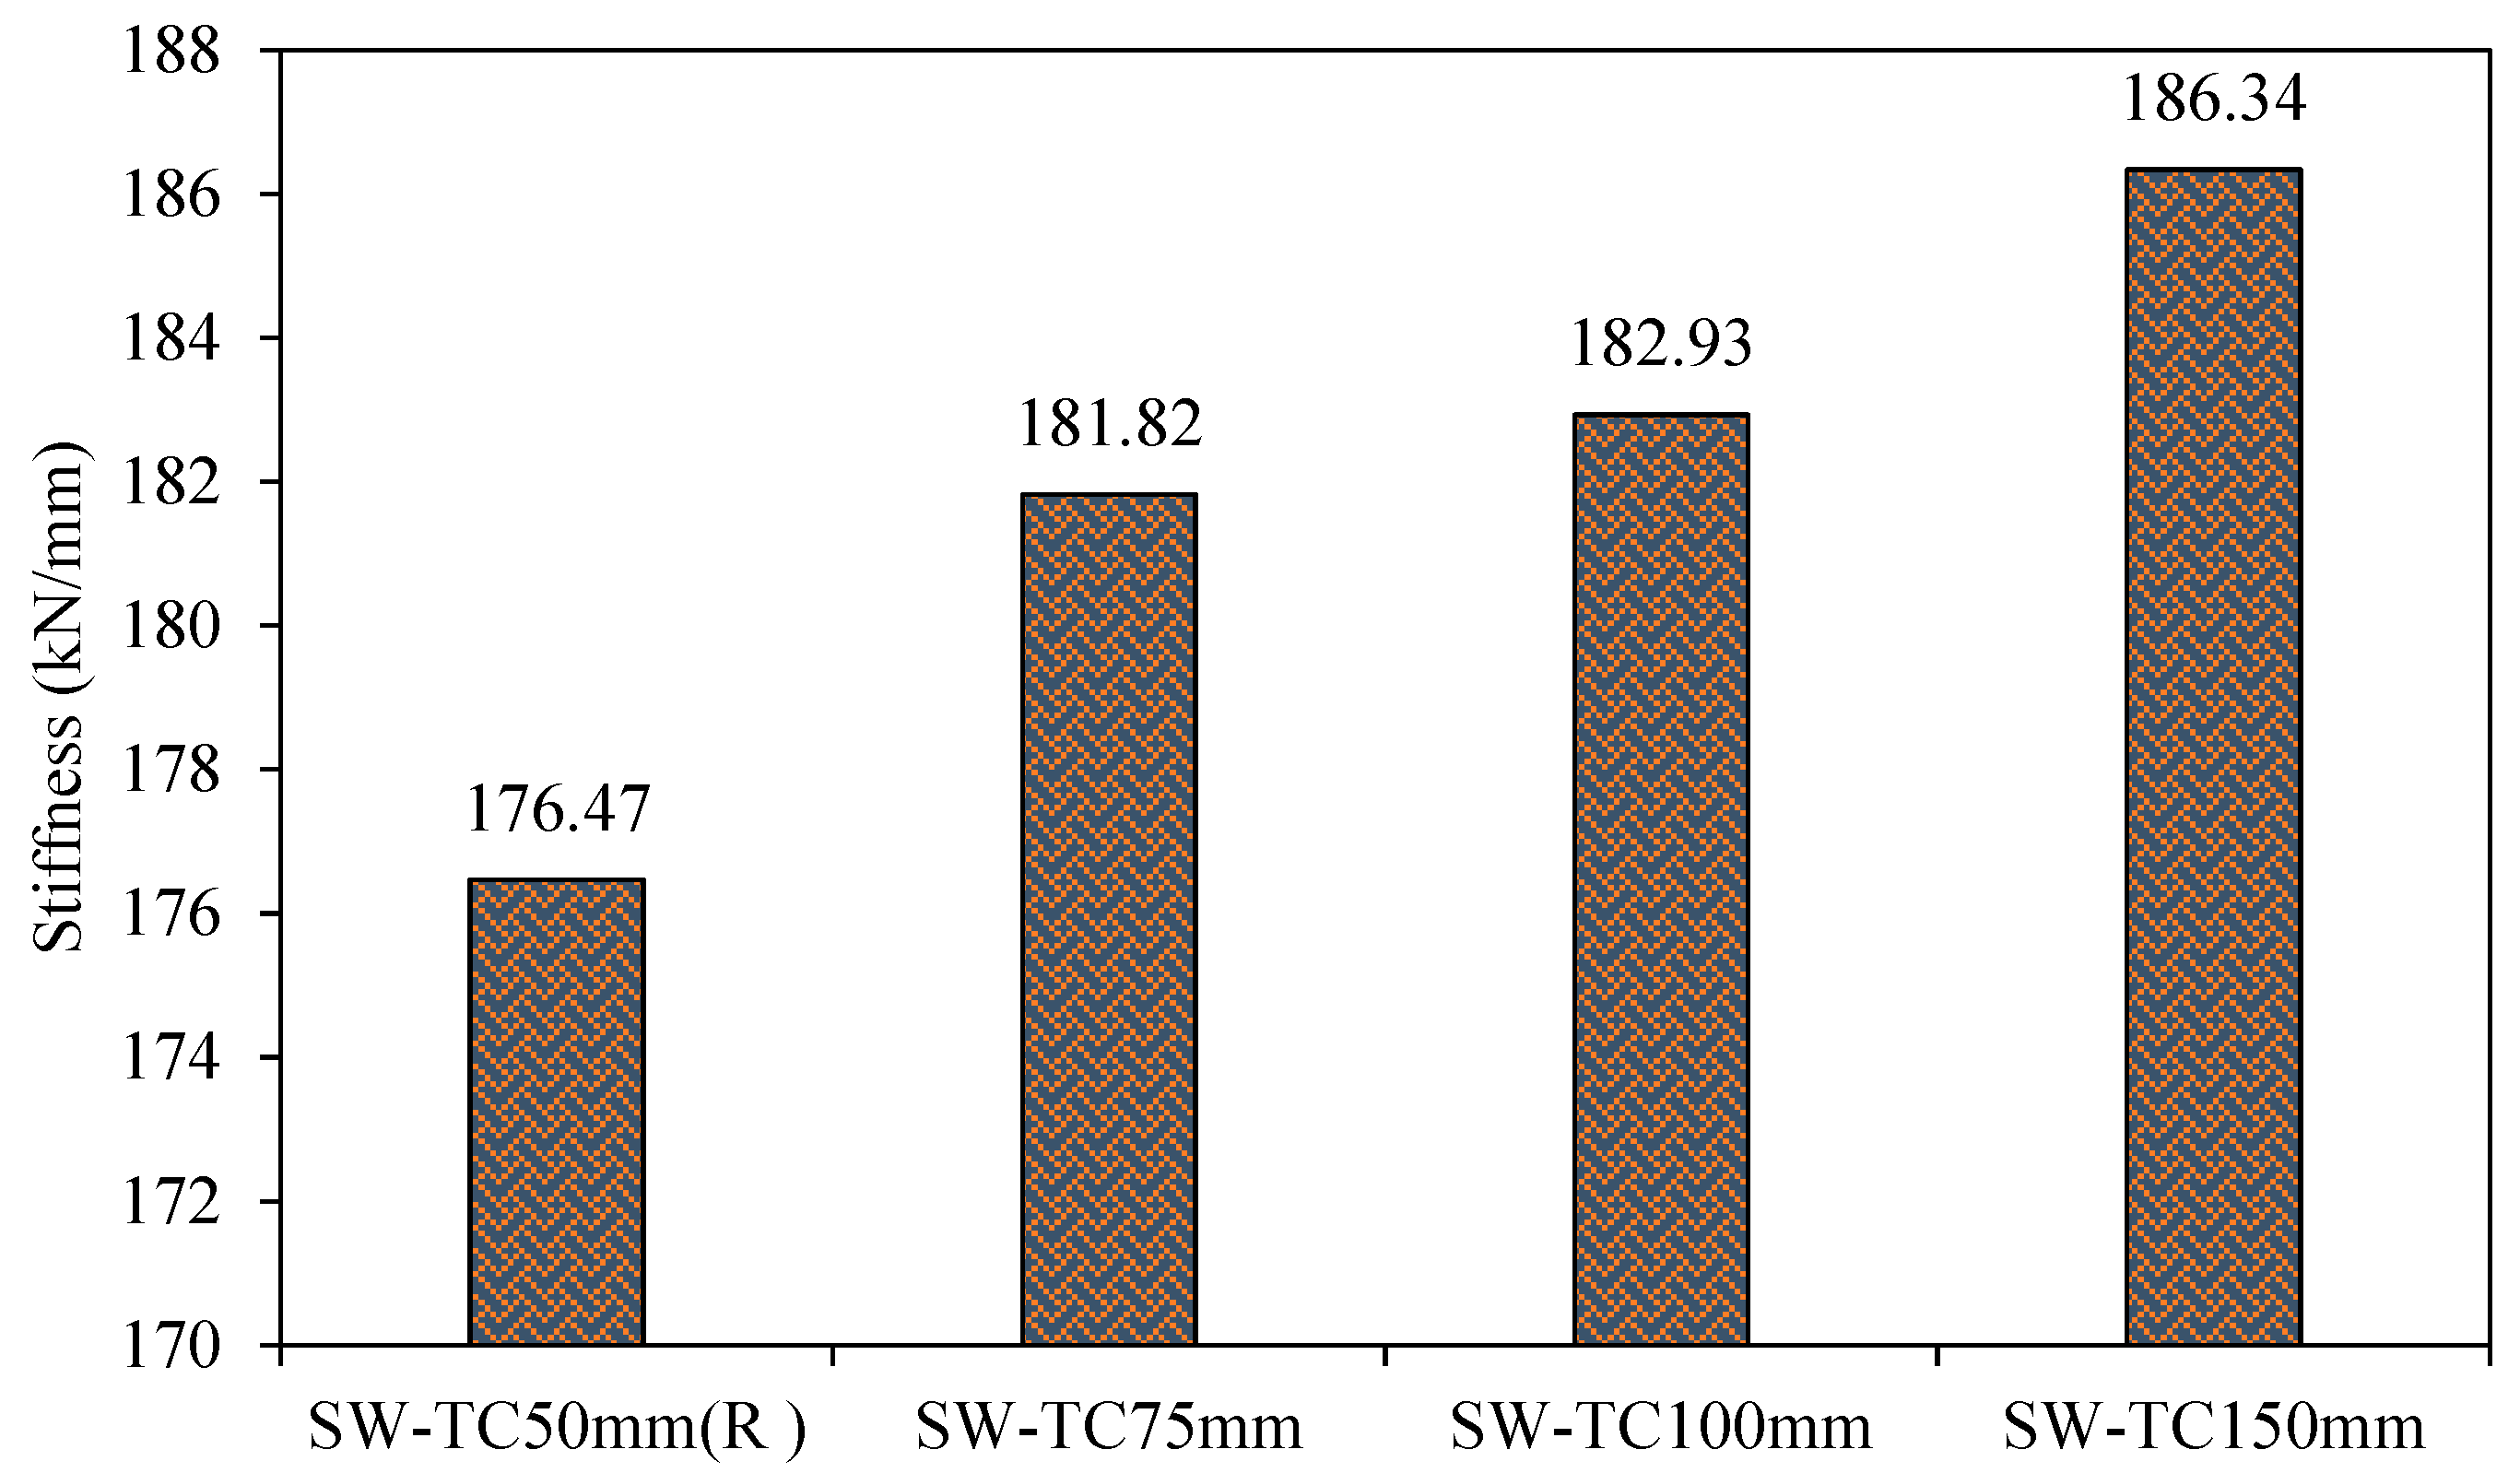
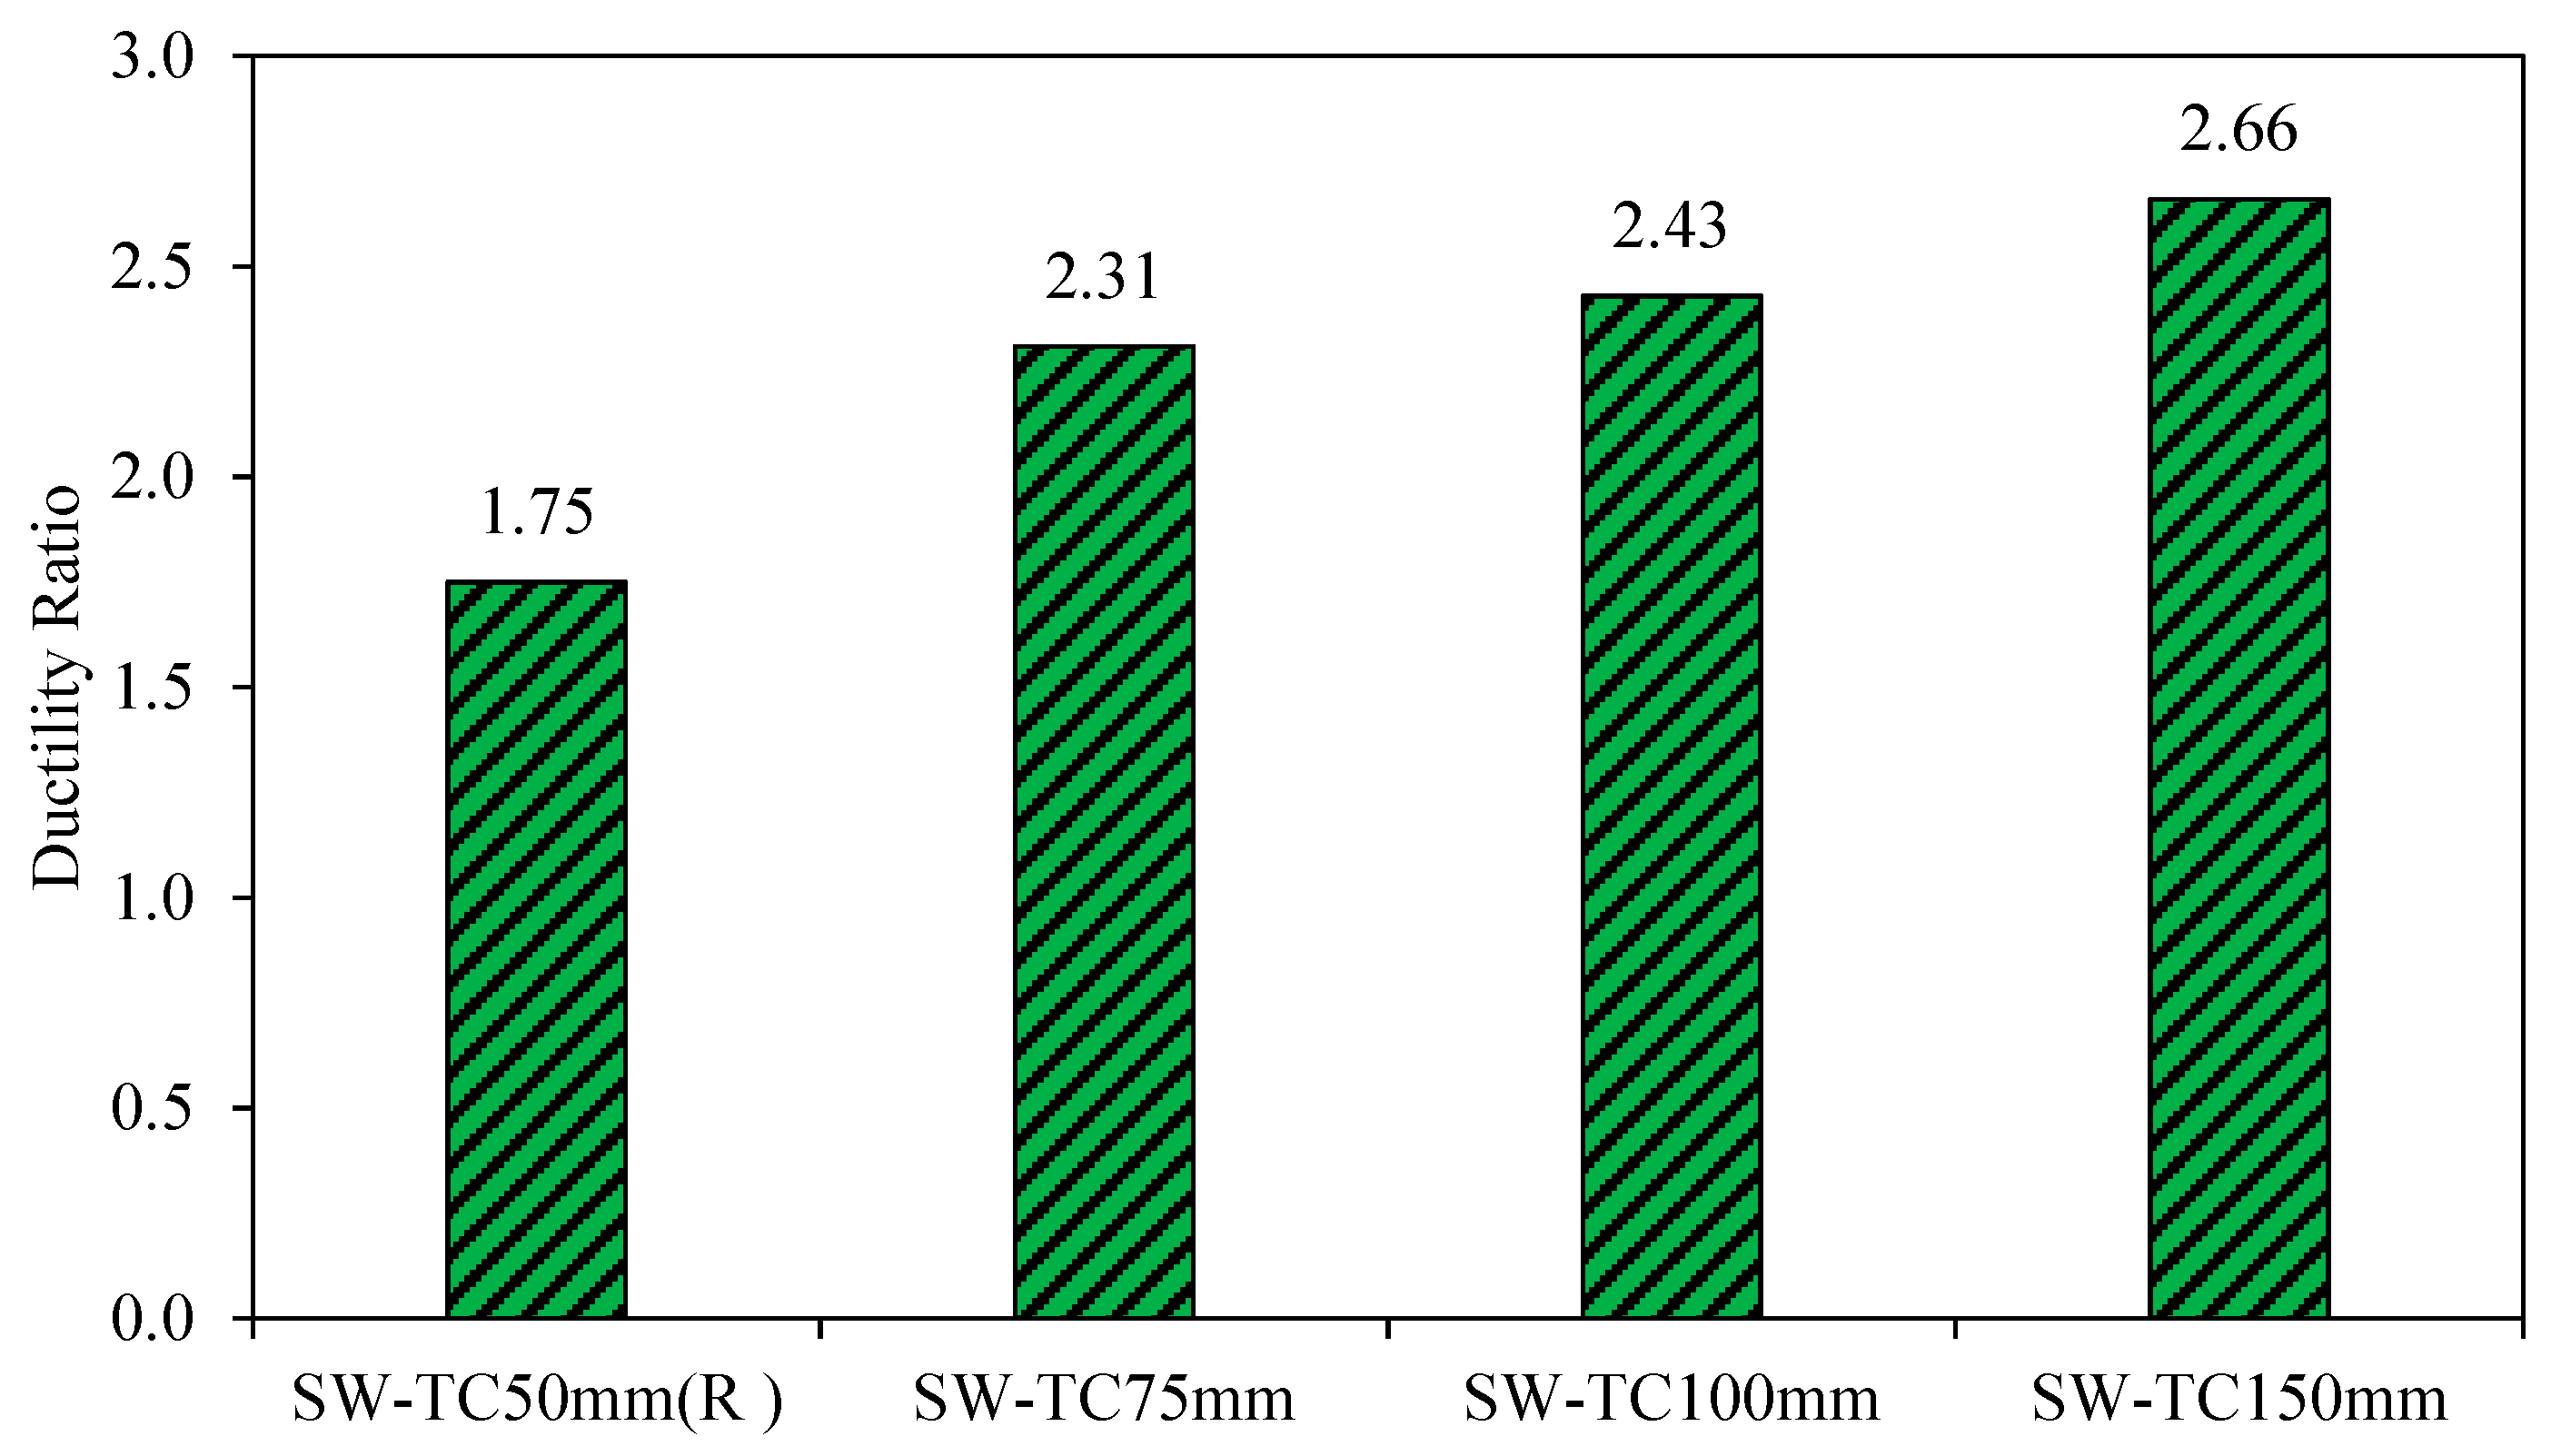
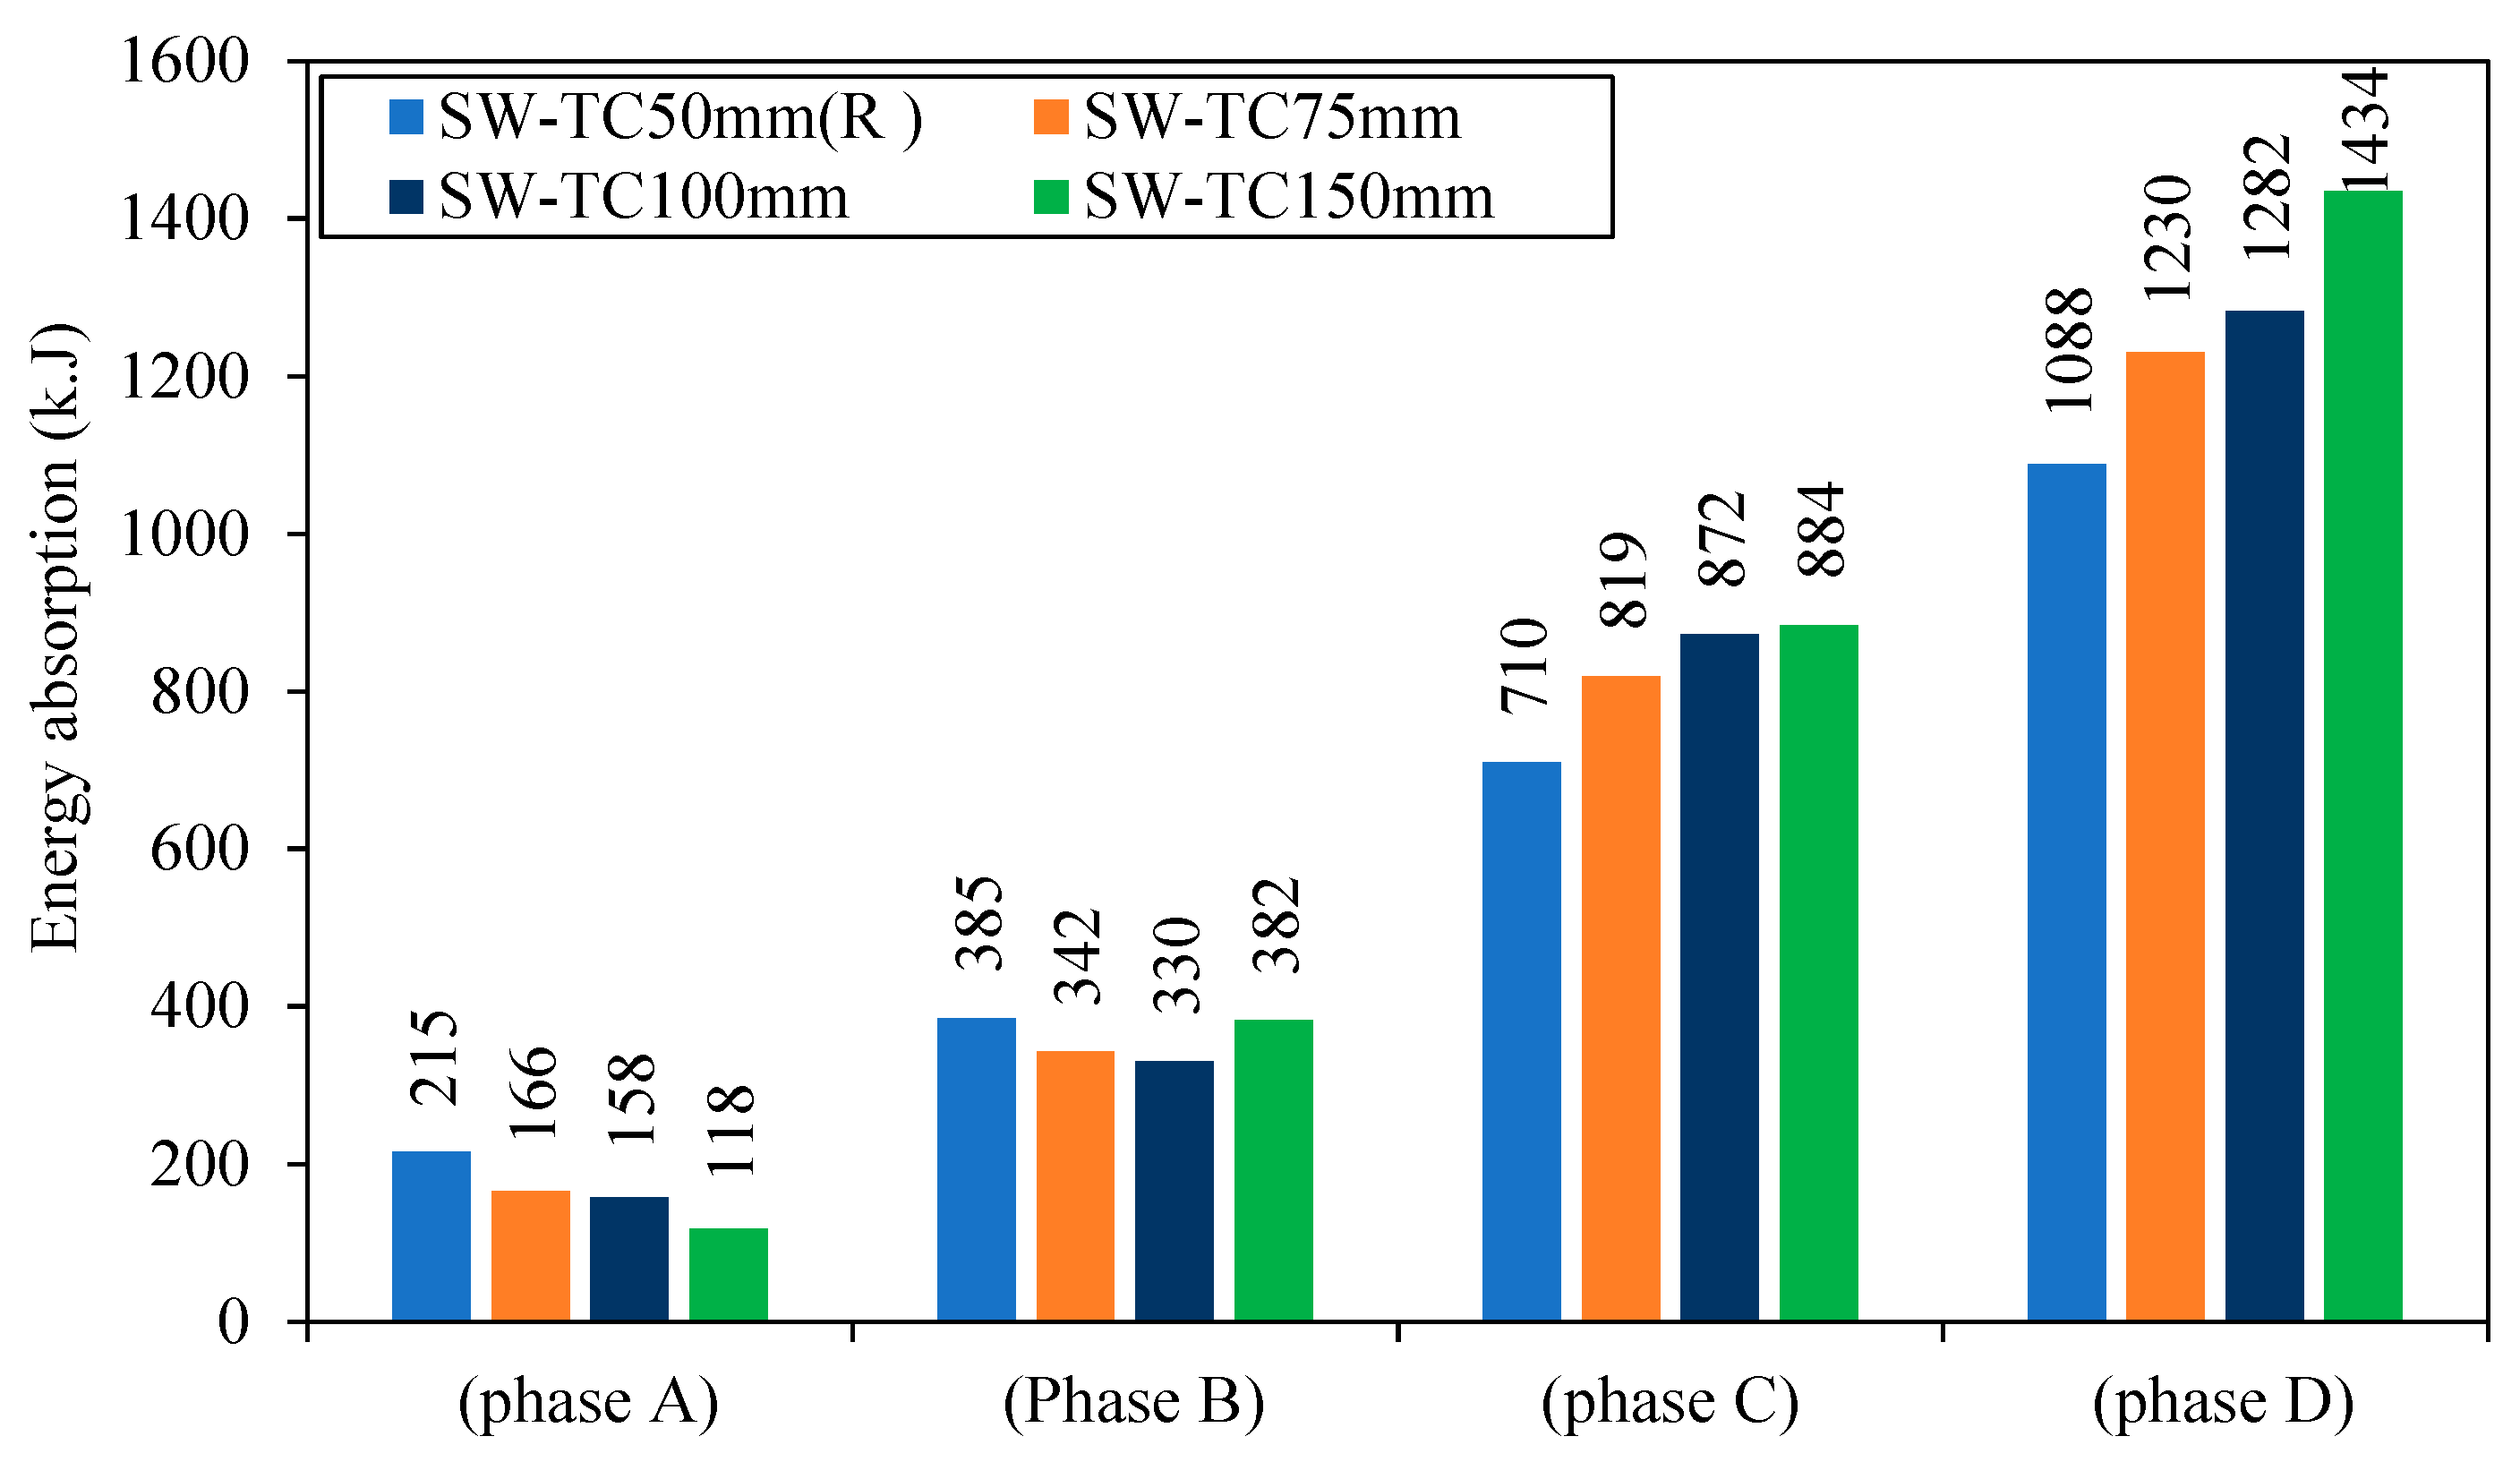
5.1.3. The Third-Group Models (Influence of Concrete Wall Thickness)
- 1.
- Lateral displacement
- Phase A:
- Phase B:
- Phase C:
- Phase D:
- 2.
- Stiffness
- 3.
- Ductility
- 4.
- Energy Absorption
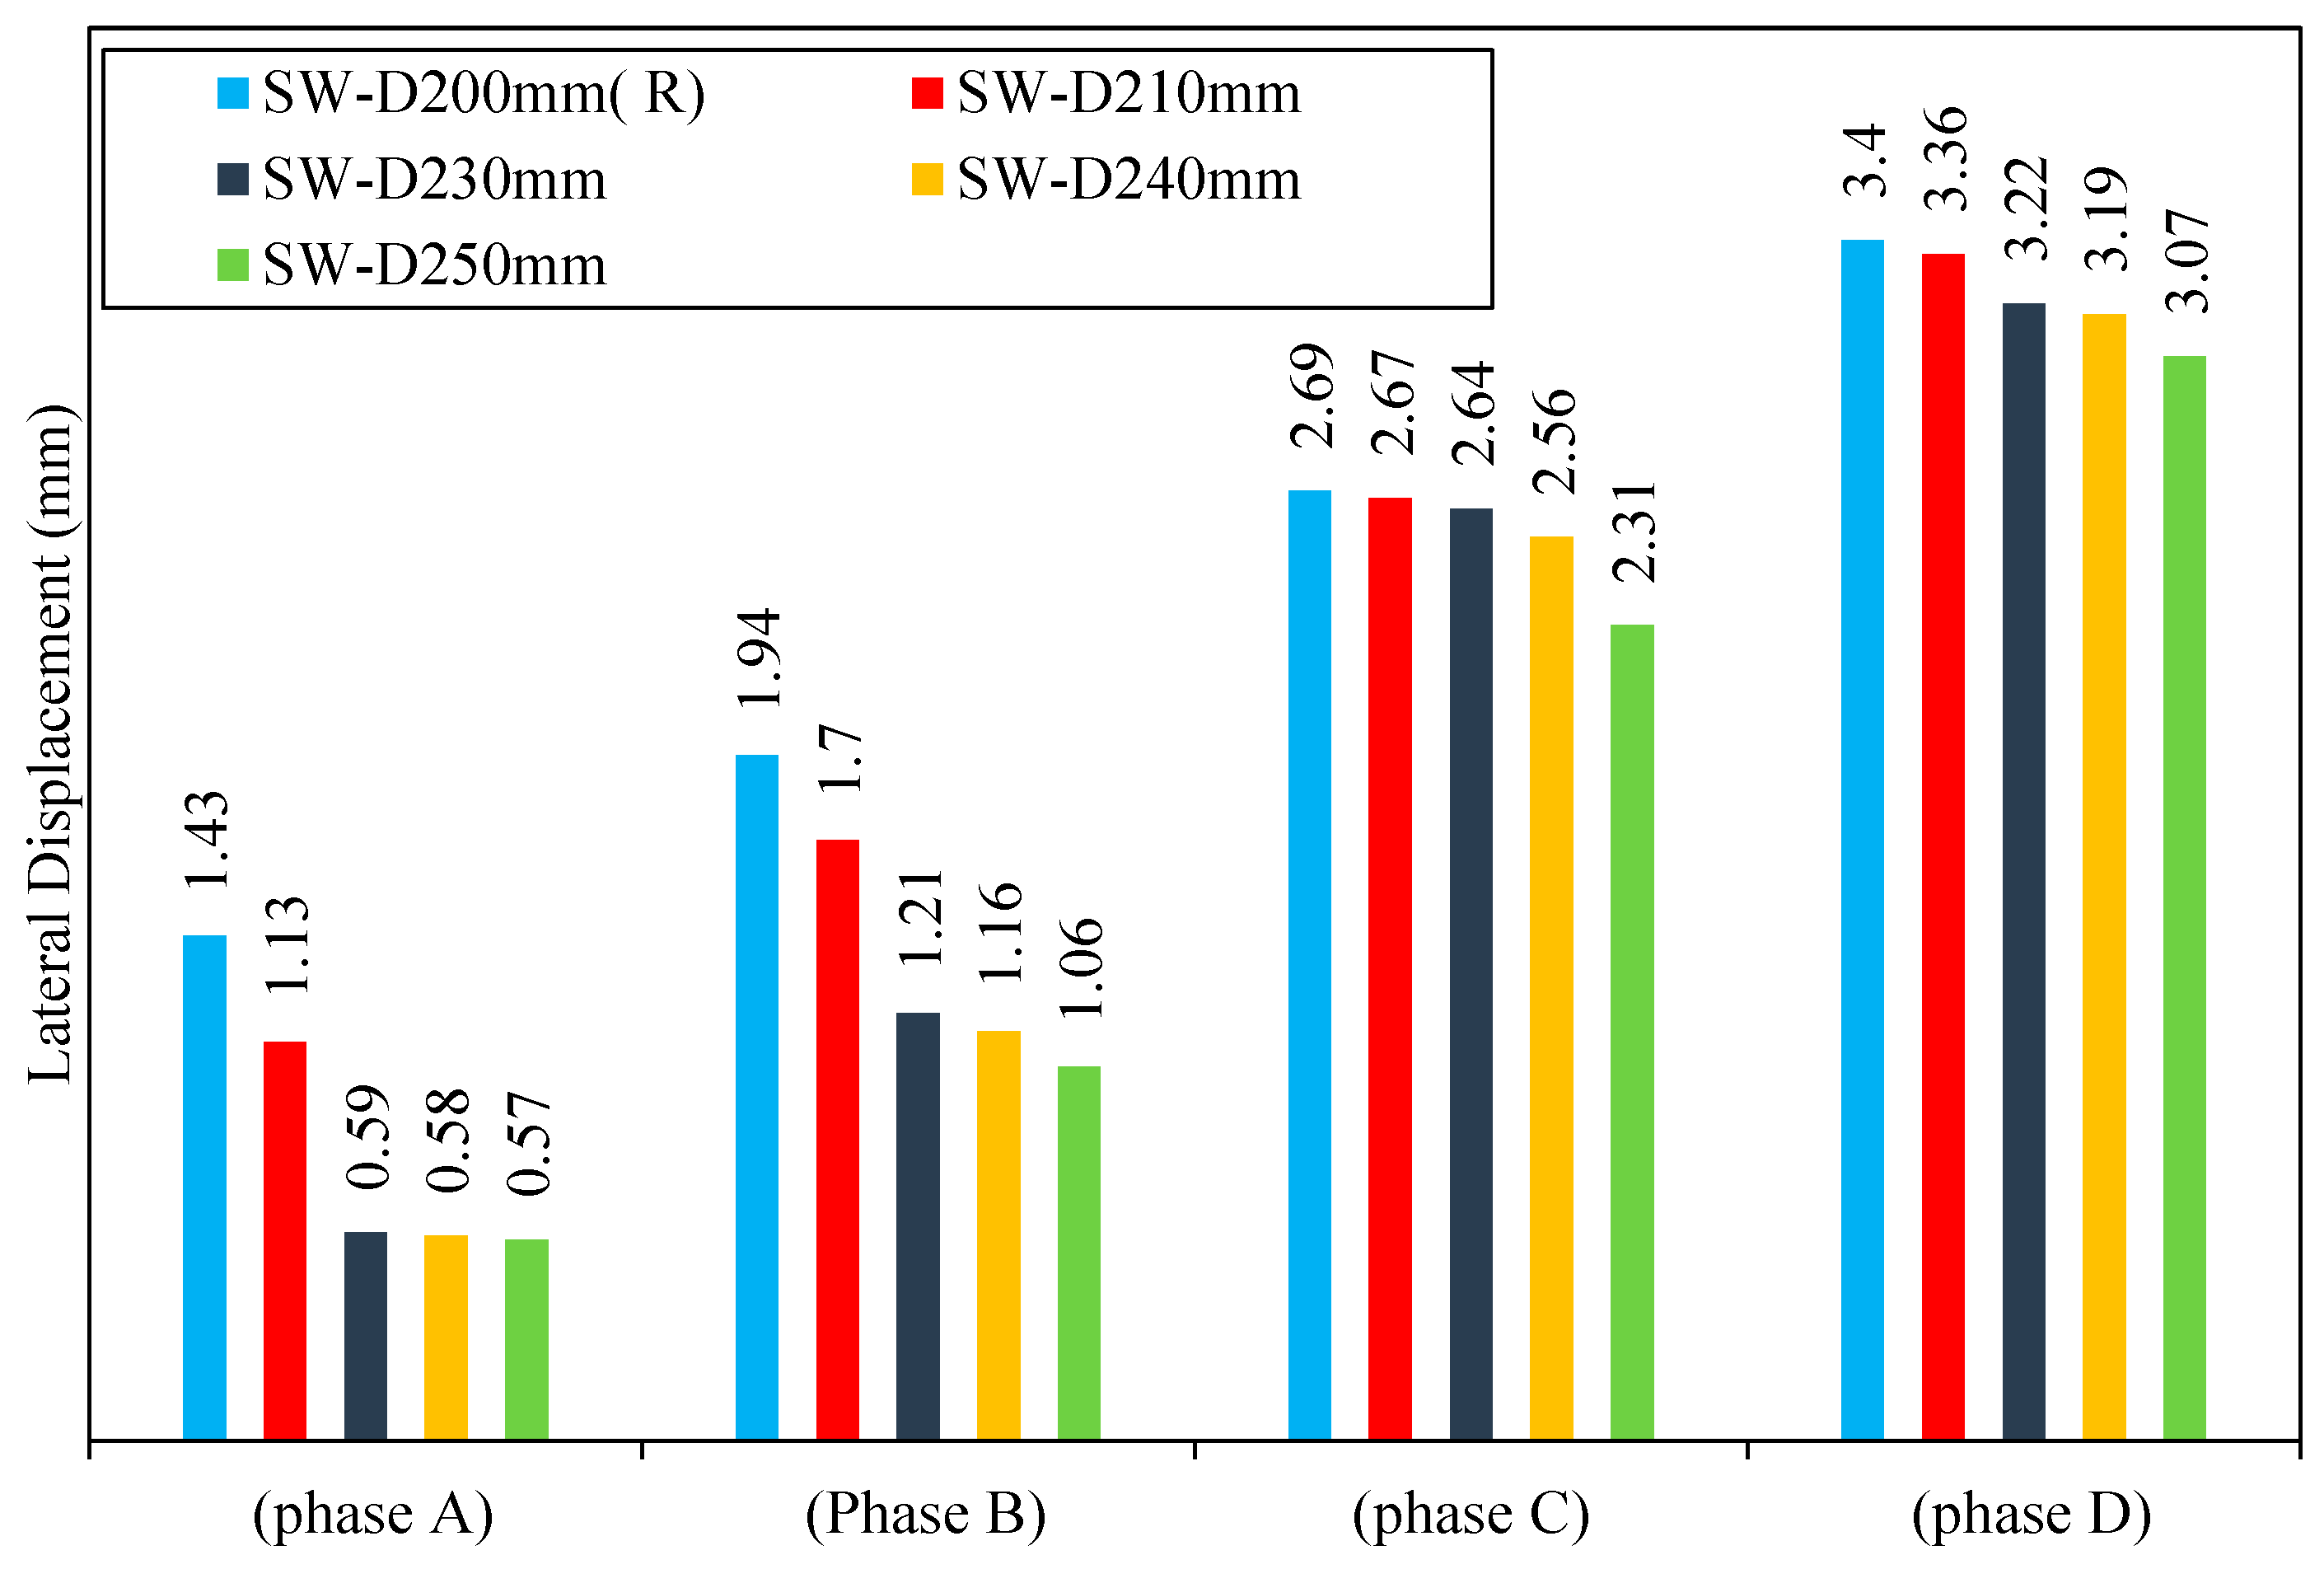
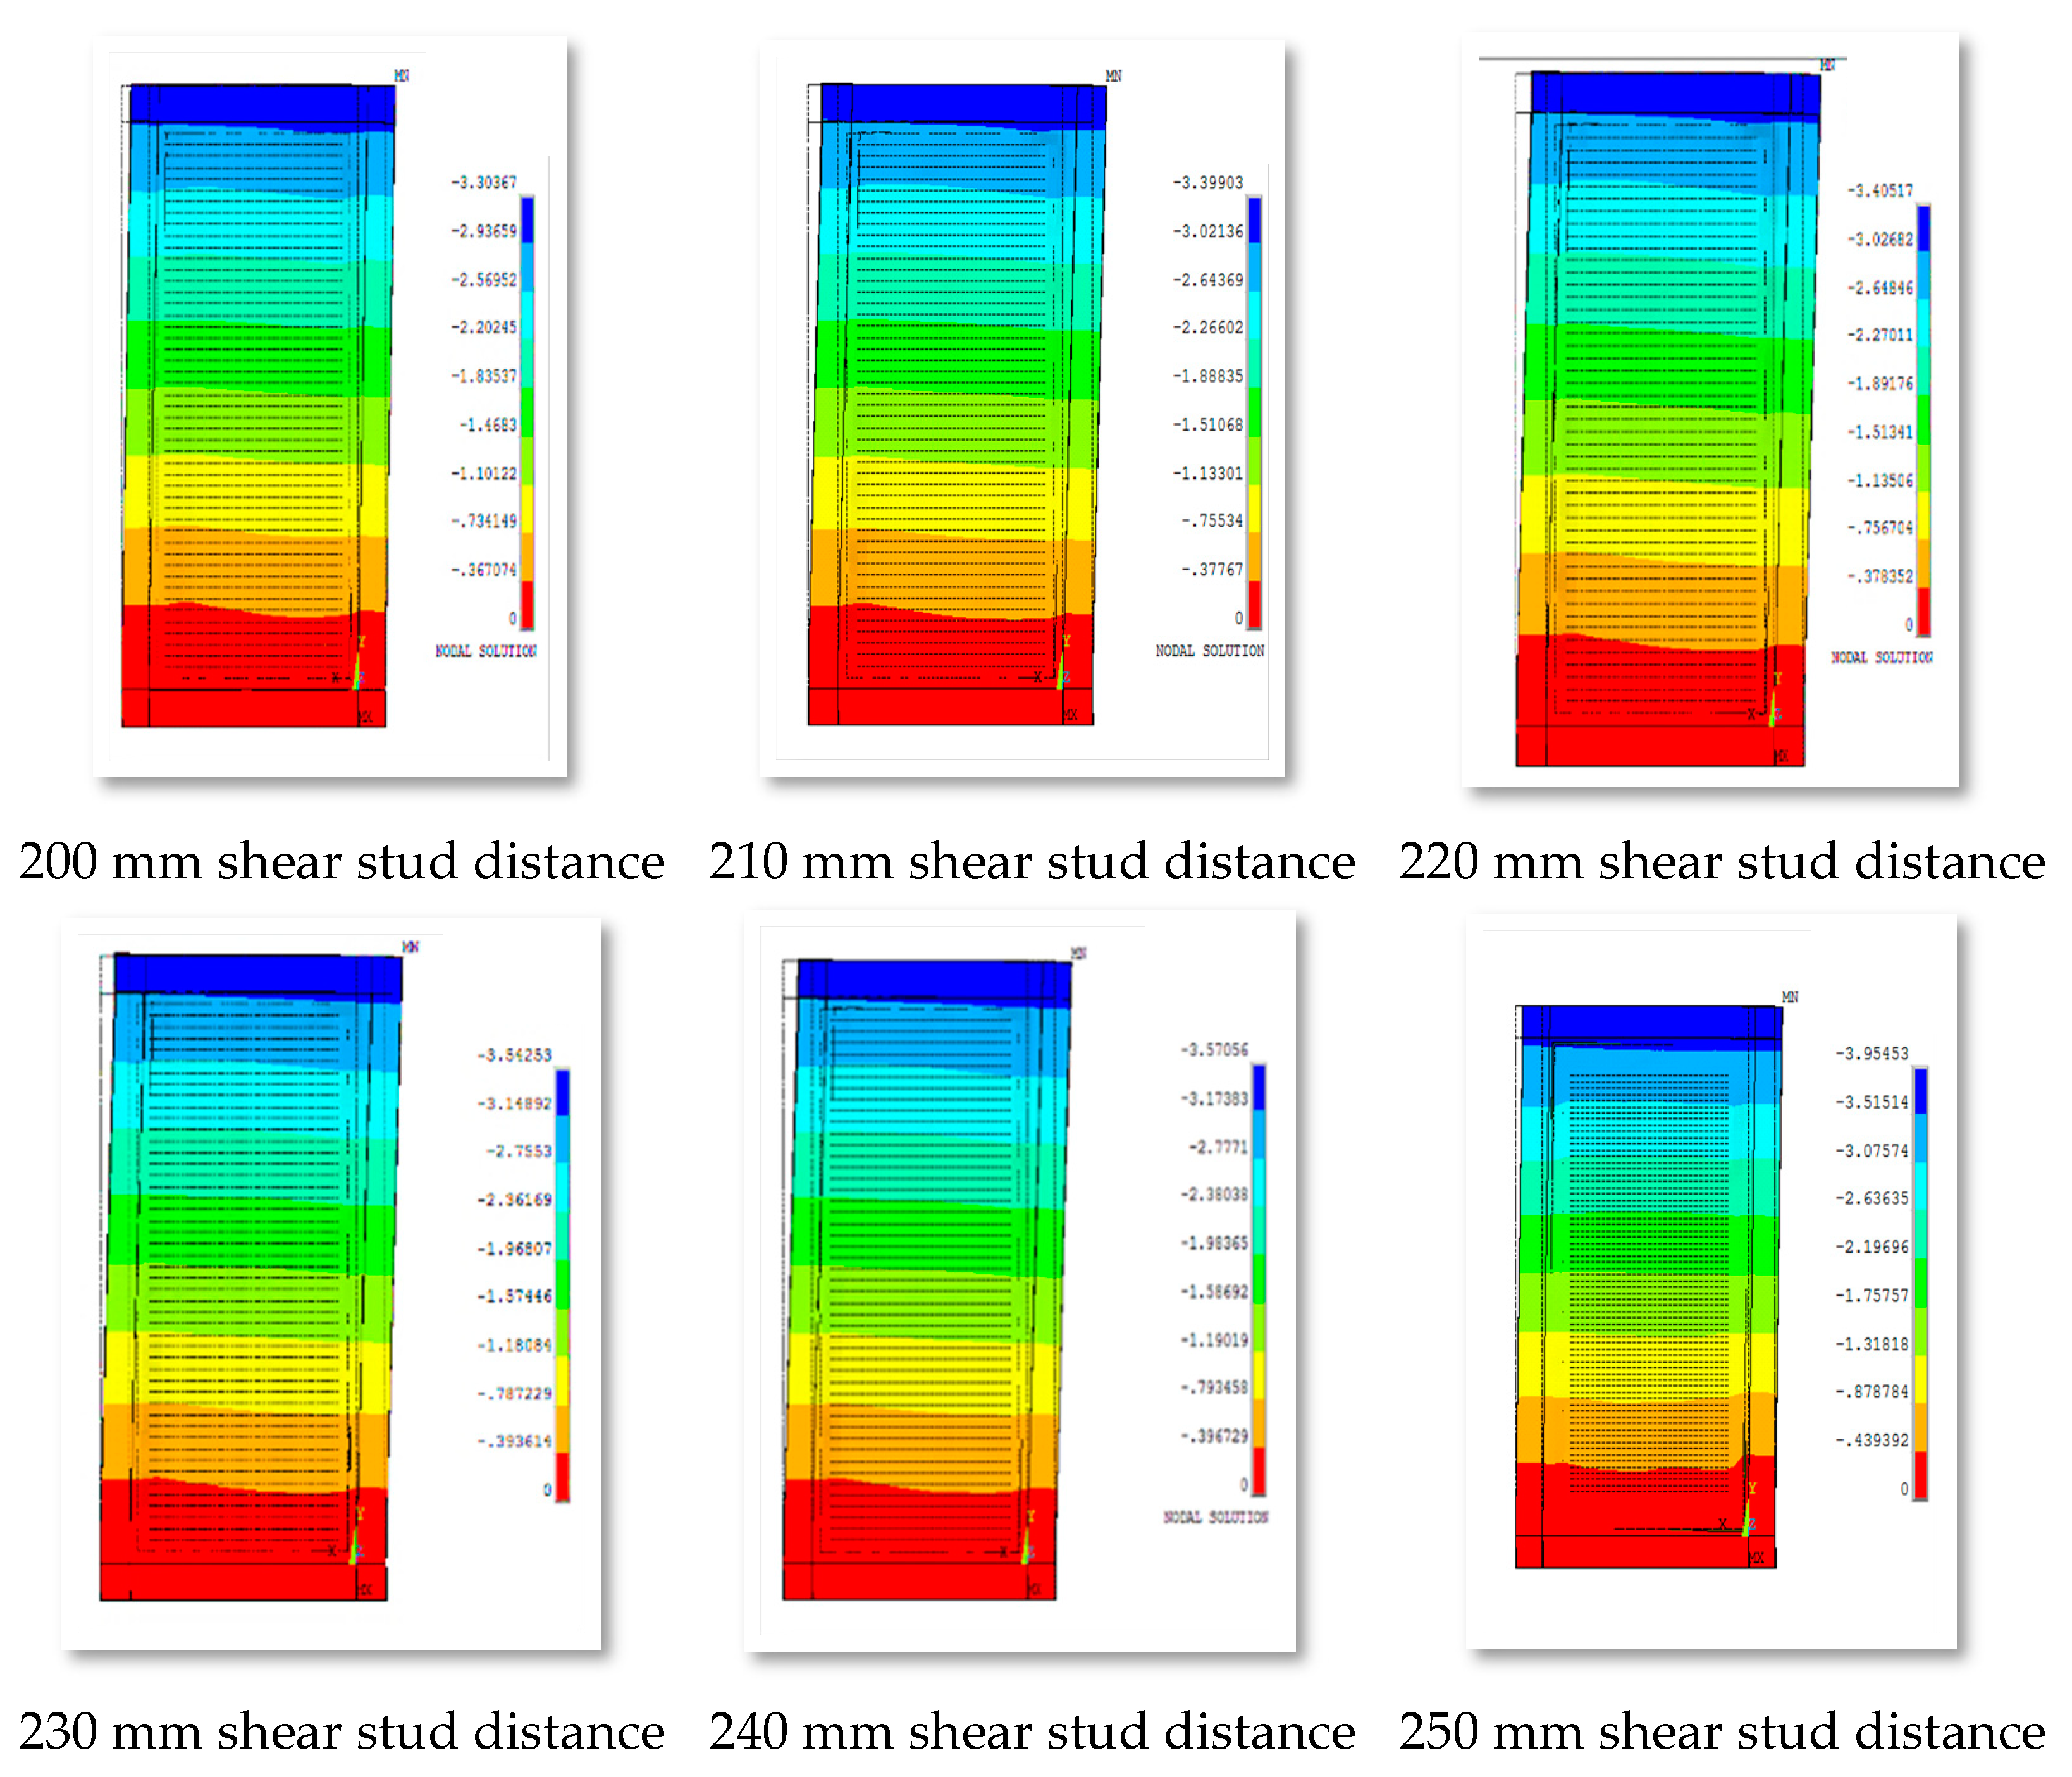
5.1.4. The Fourth-Group Models (Influence of Distance between Shear Studs)
- 1.
- Lateral displacement
- Phase A:
- Phase B:
- Phase C:
- Phase D:
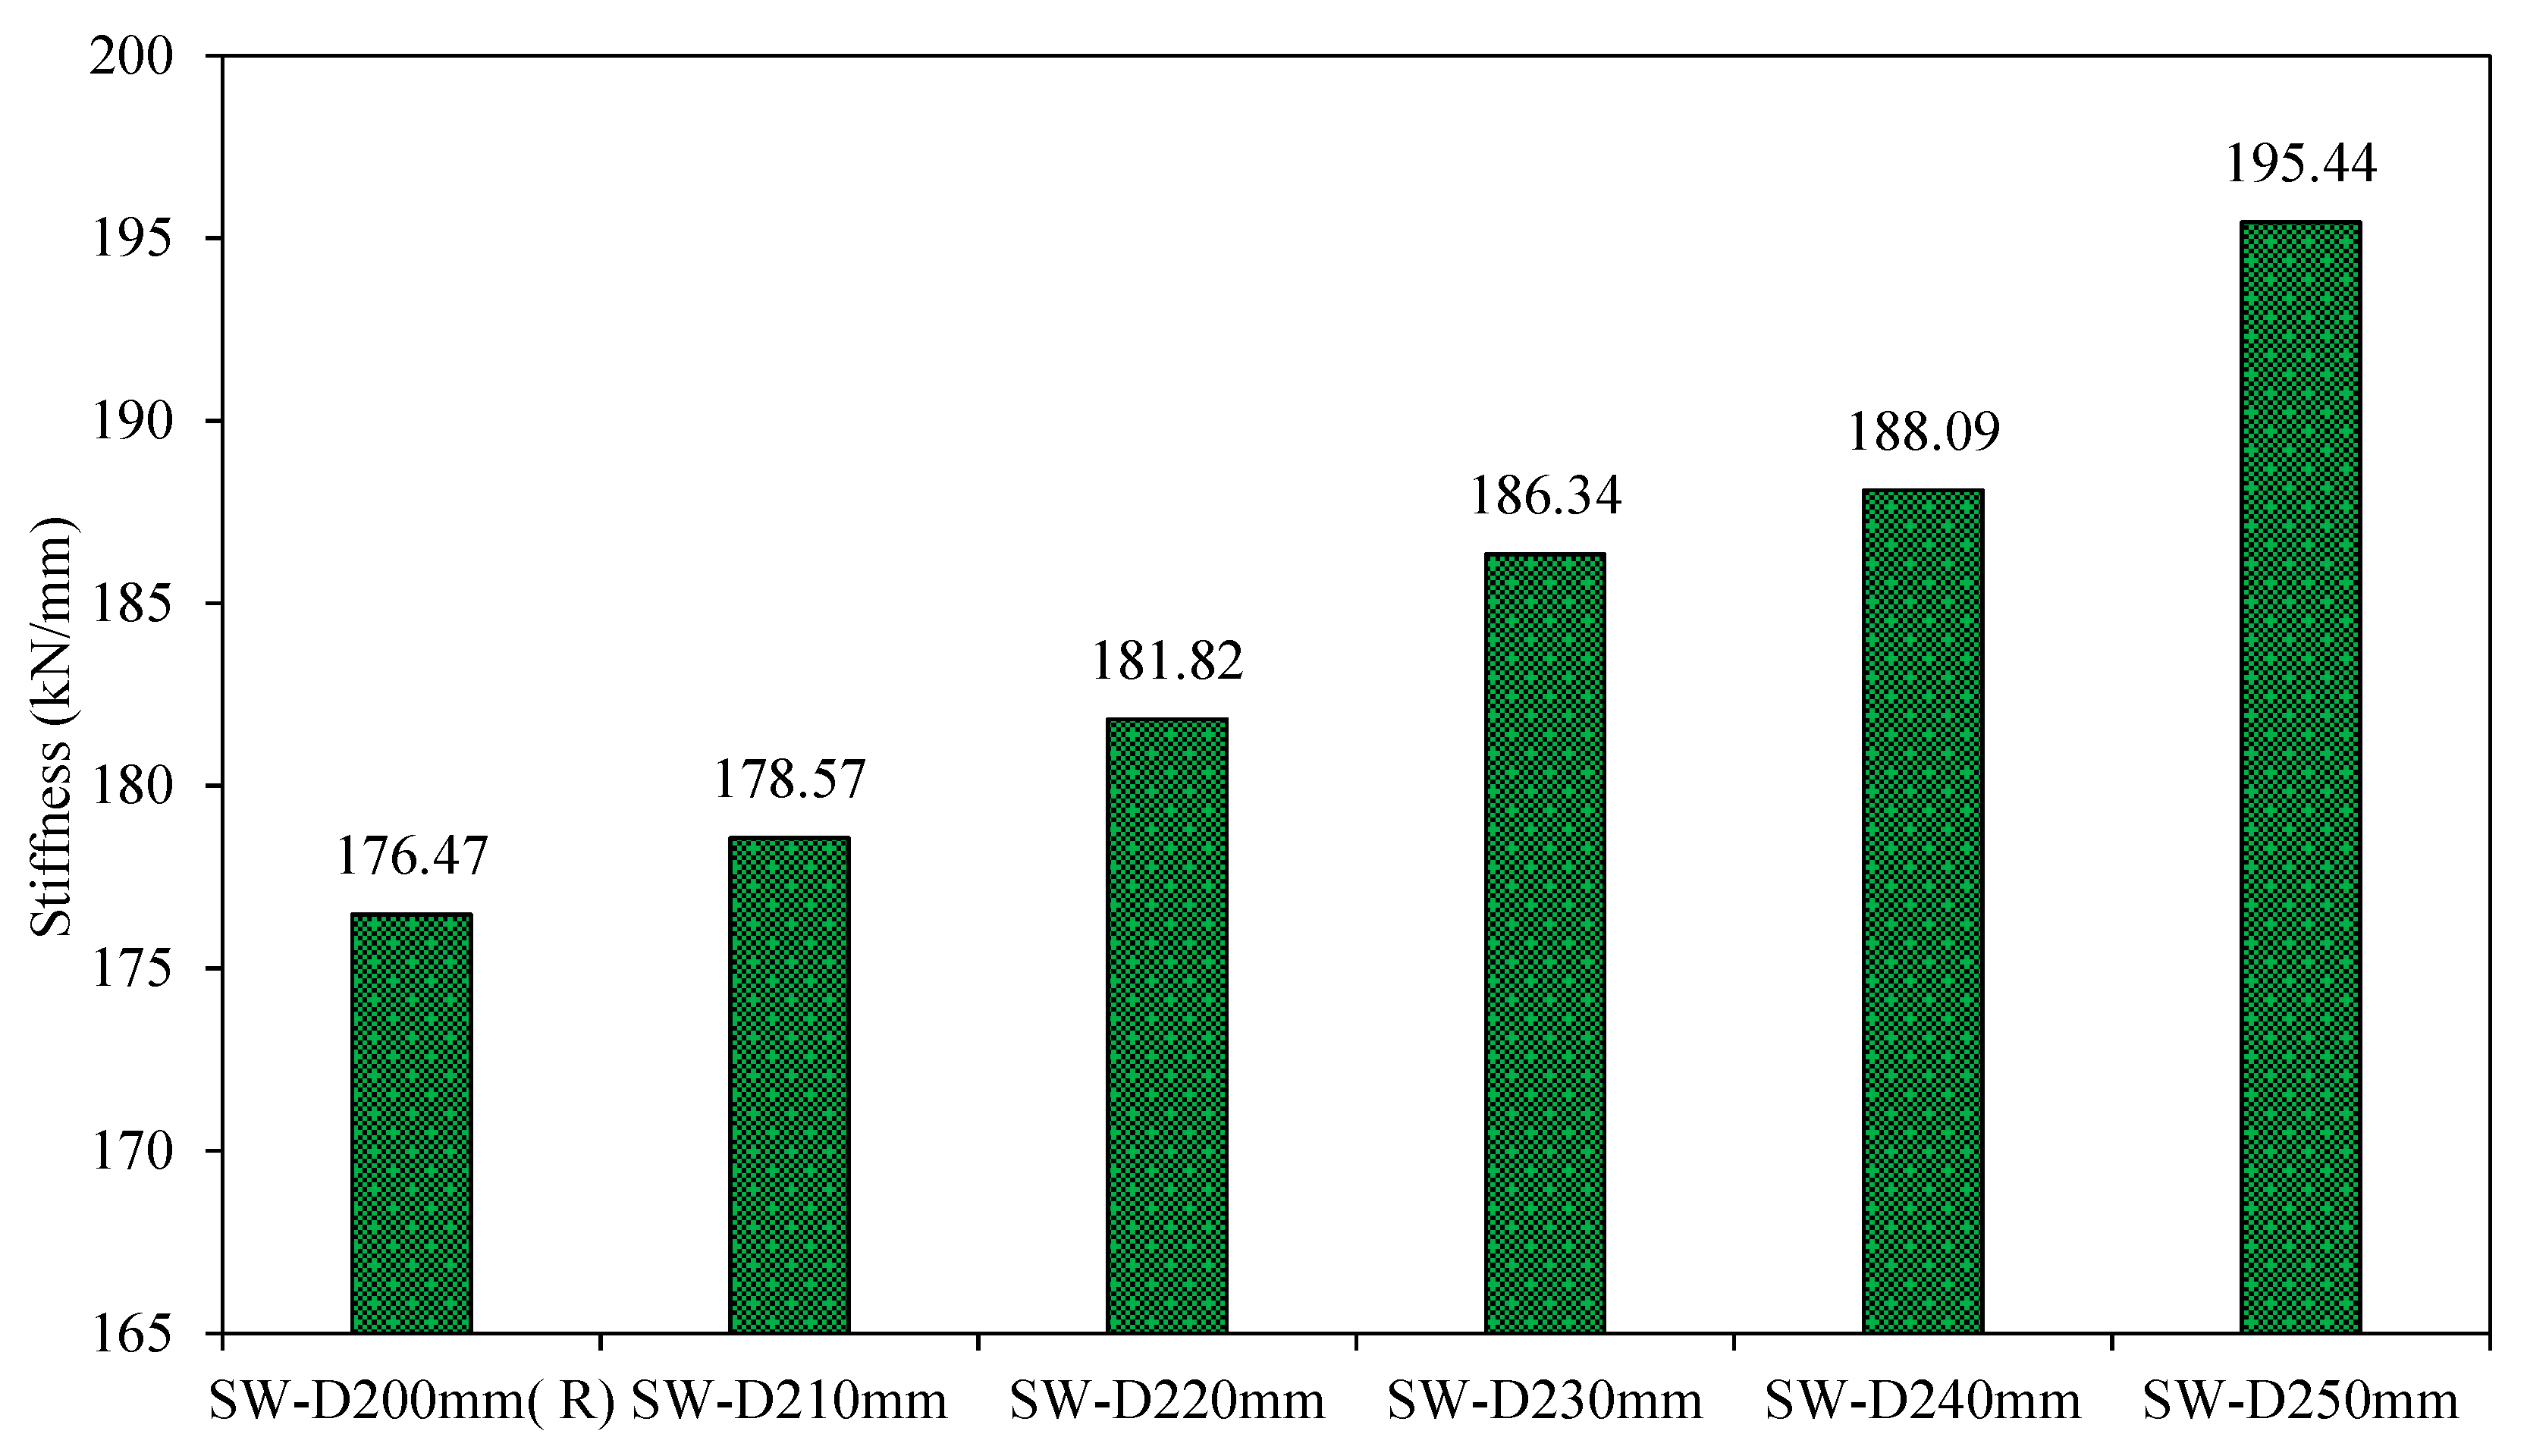
- 2.
- Stiffness
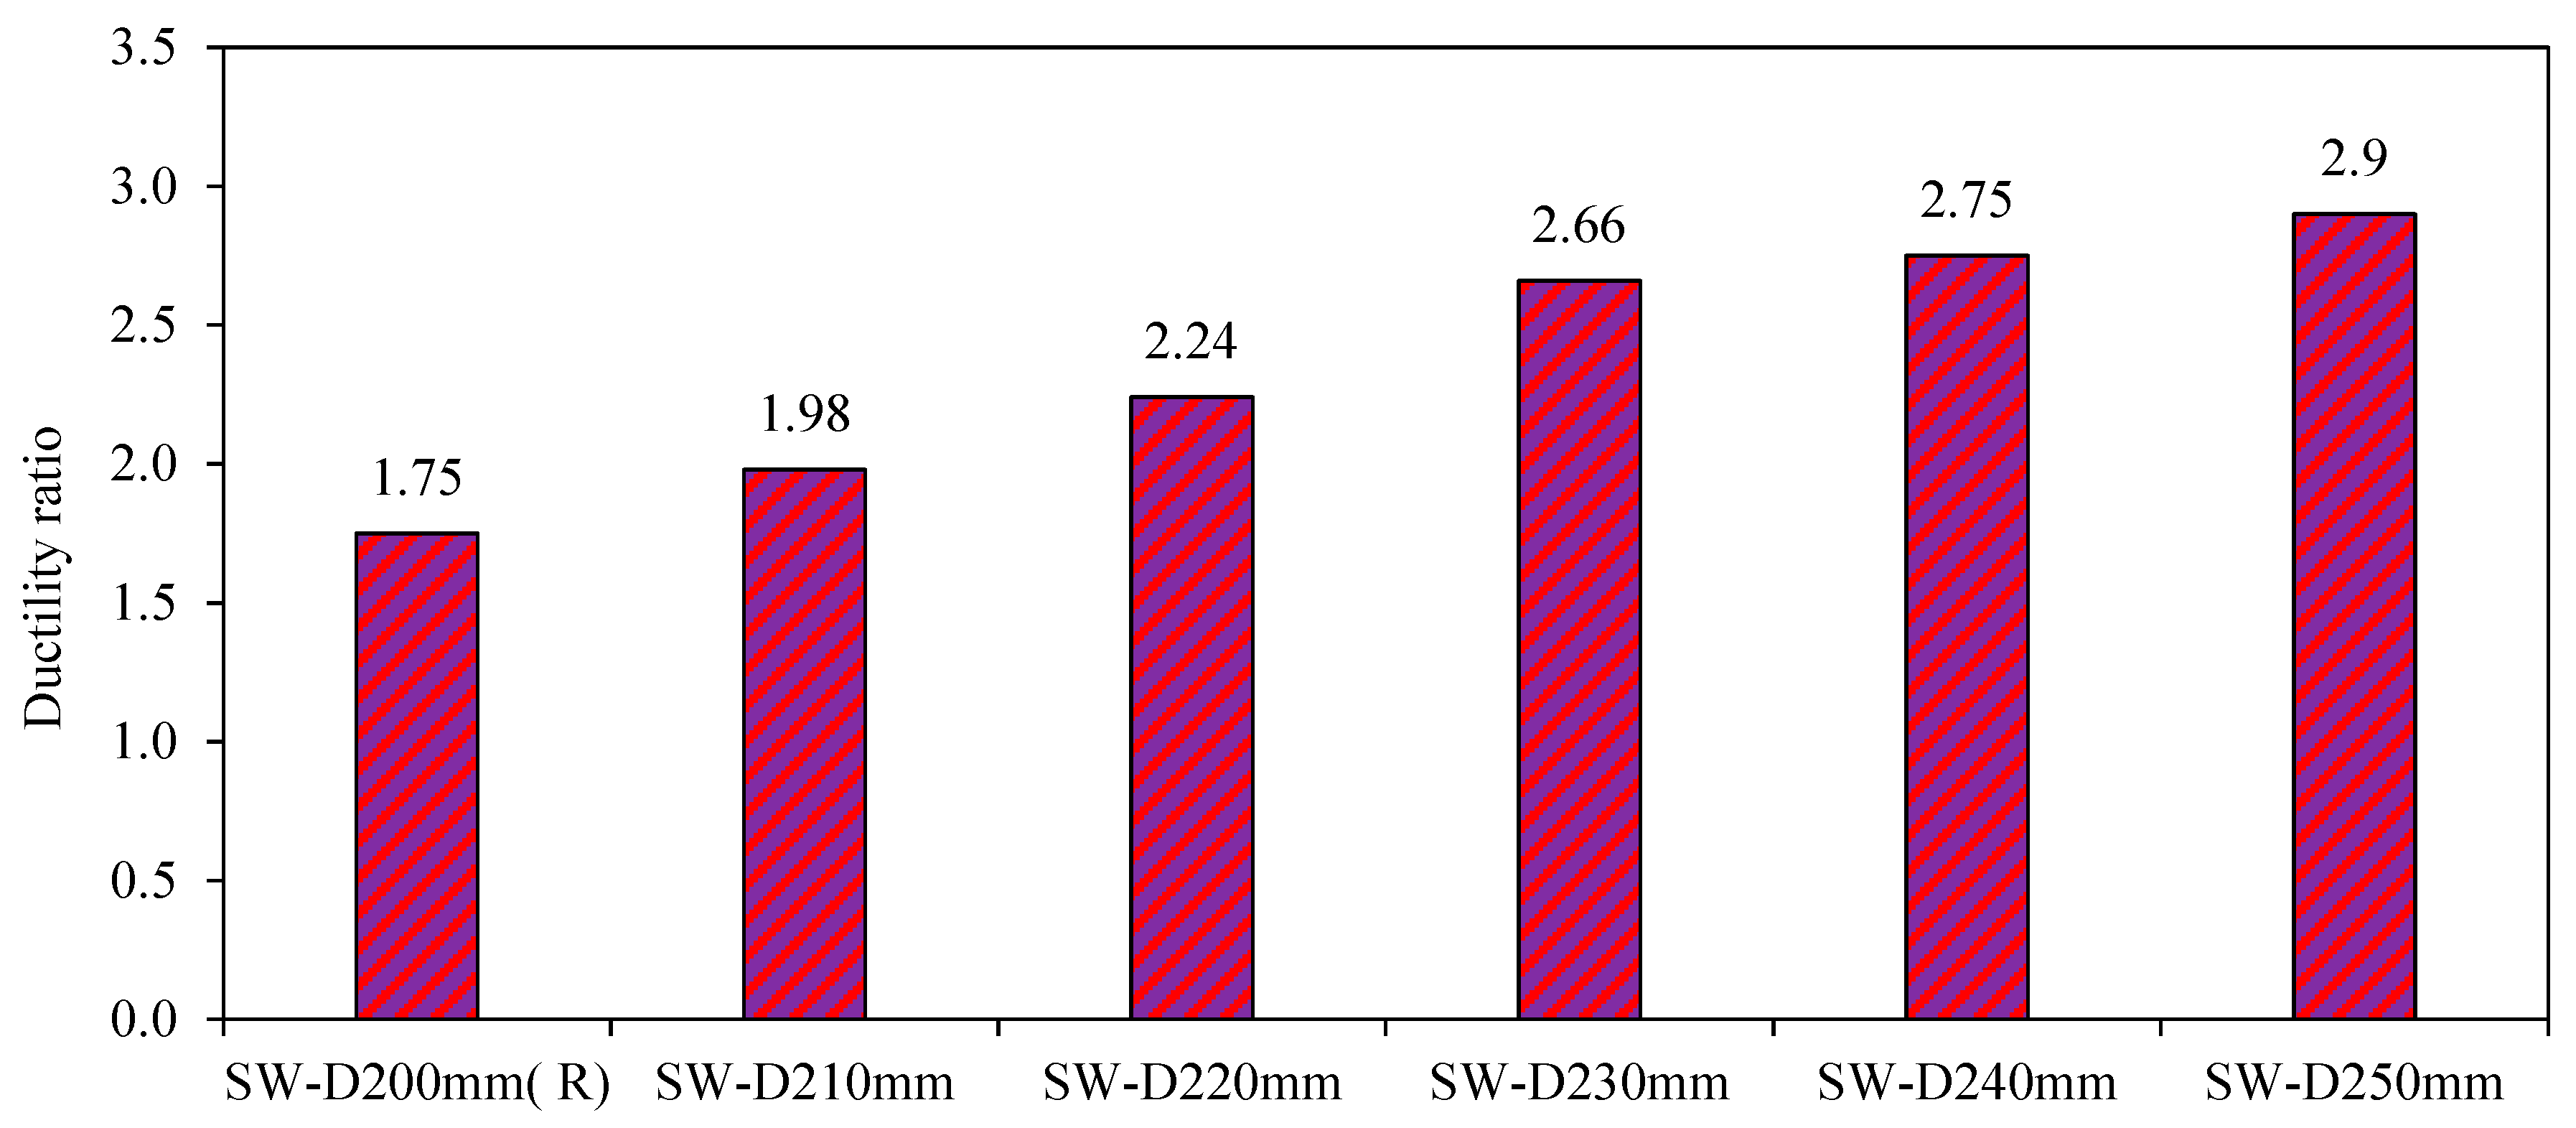
- 3.
- Ductility
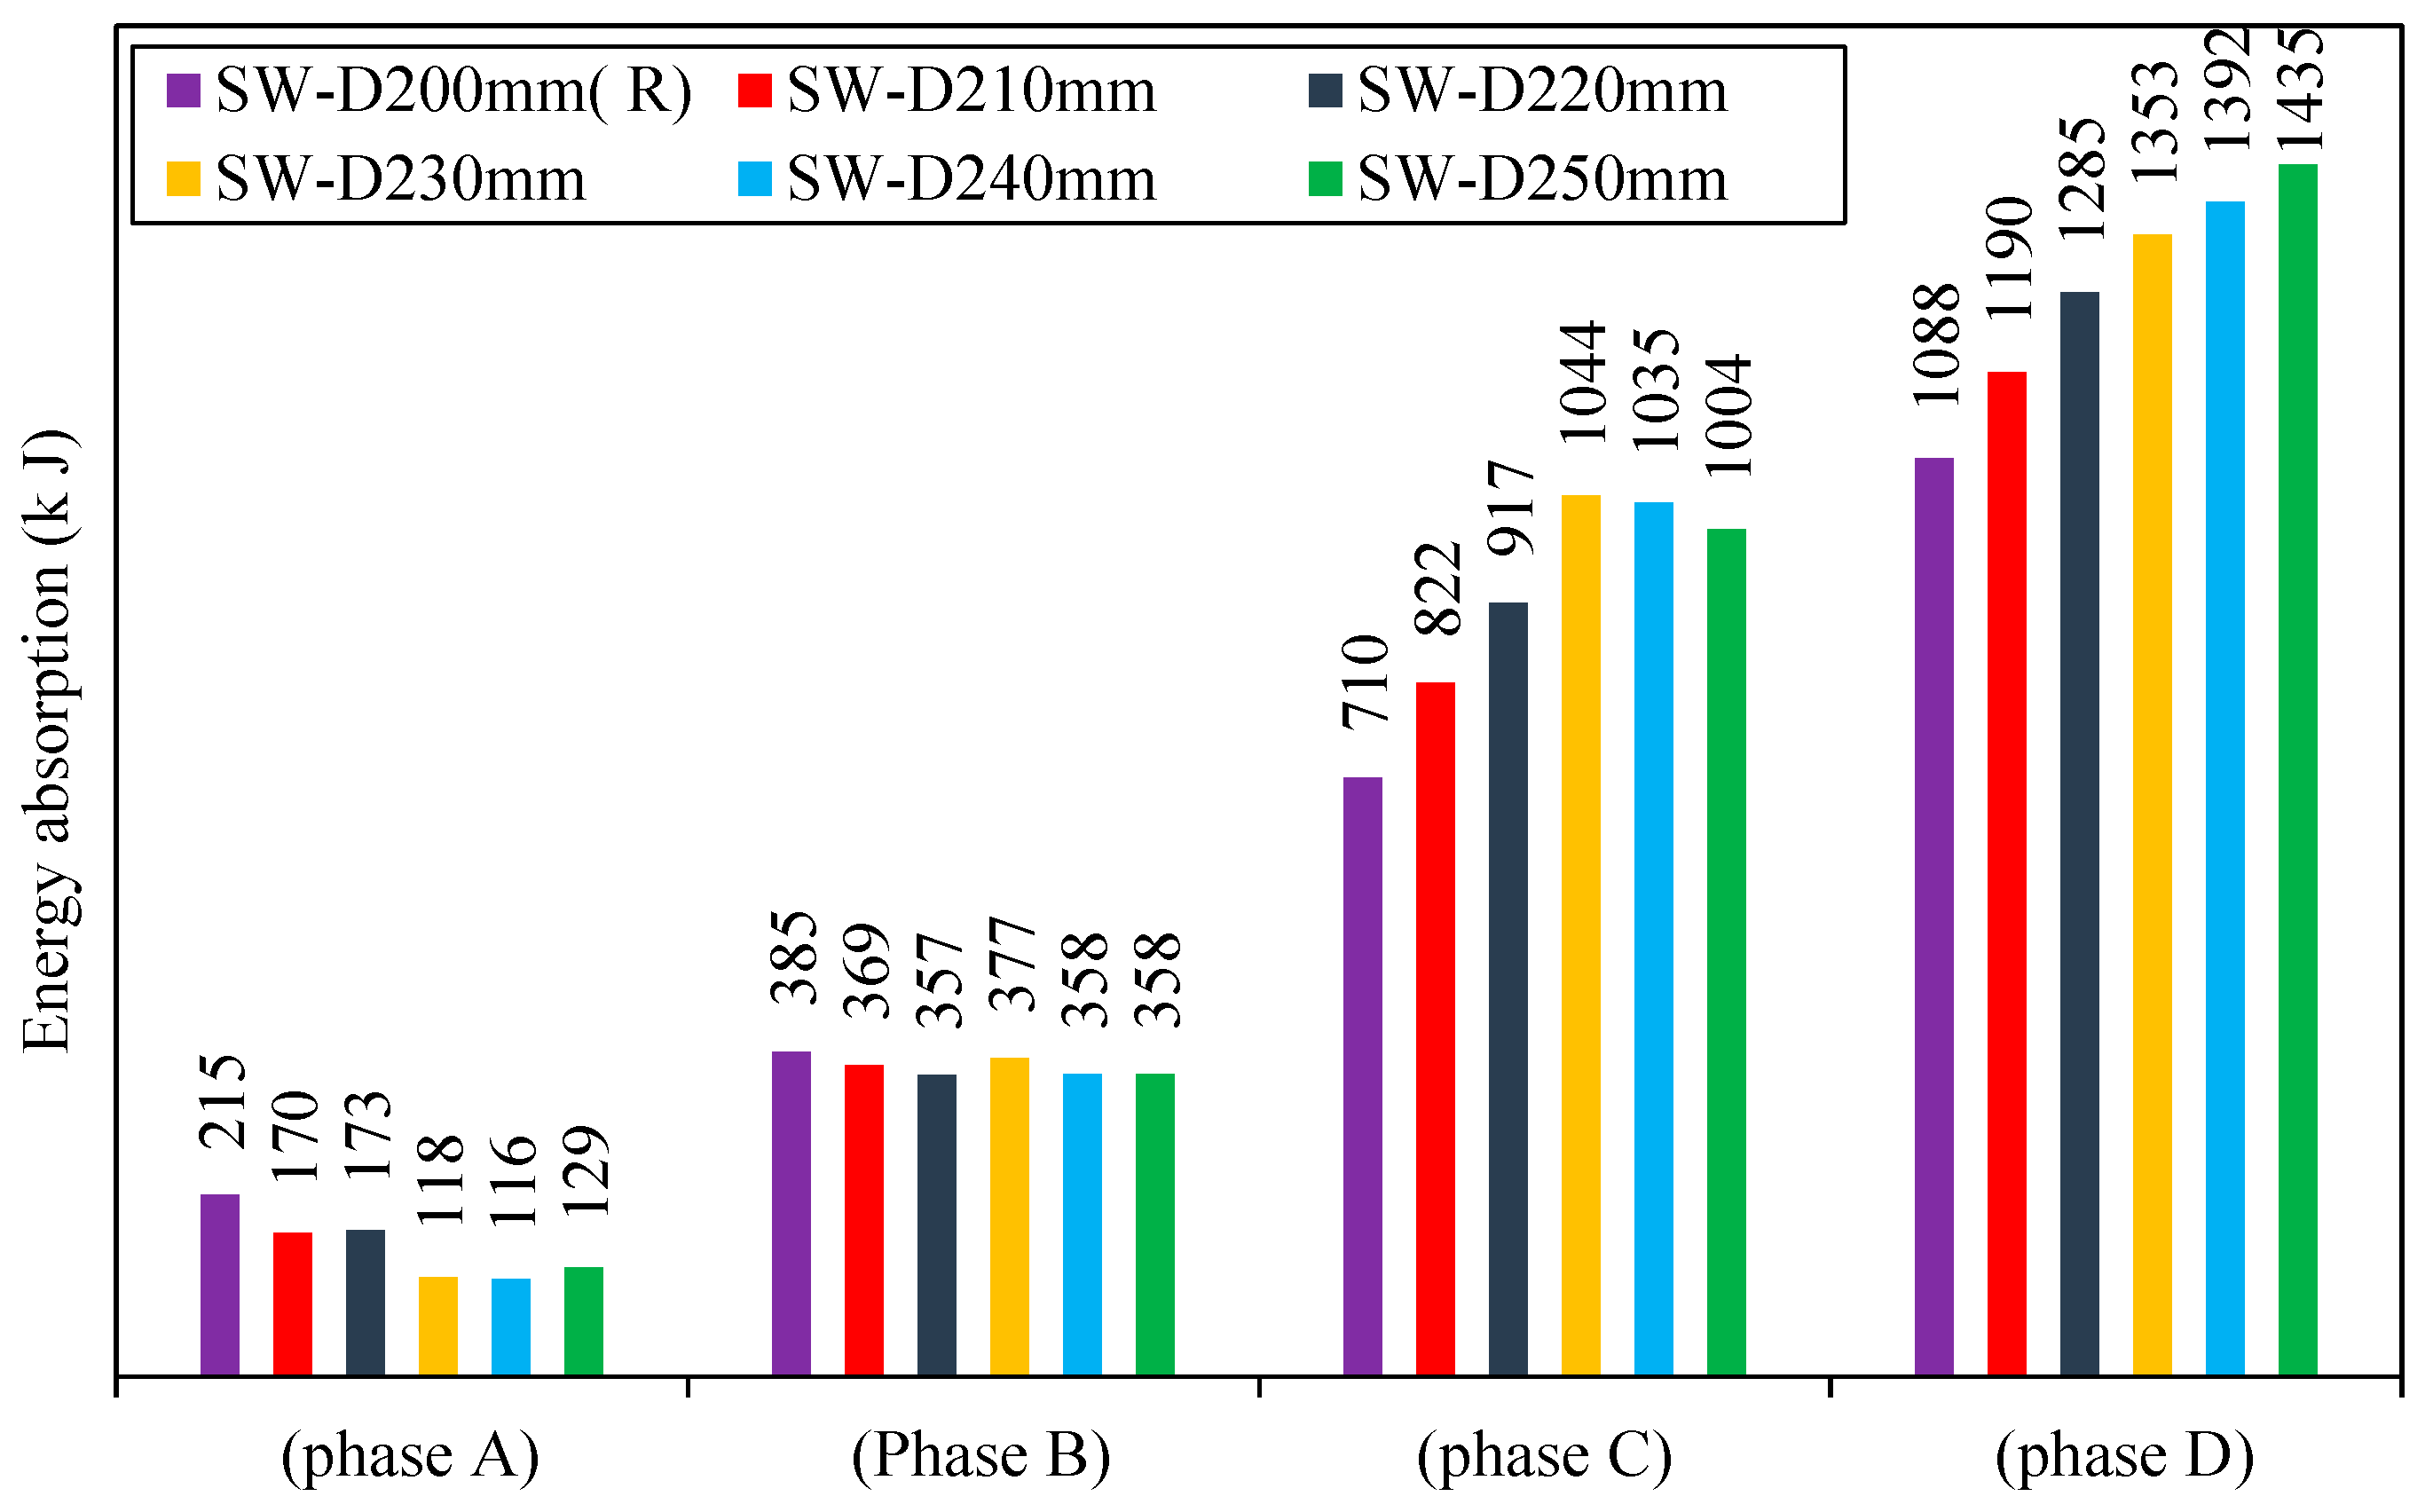
- 4.
- Energy Absorption
6. Conclusions
- Increasing the gap between the steel frame and concrete wall influences the sequences of the yielding of components, where yielding shows in the beam and infill steel plate first. At the end of the test, the columns showed yielding at the base but did not buckle. The gap between the steel frame and the concrete wall should be limited by a specific value of 4% of the width, as this value has a considerable effect on delaying failures of the model. Moreover, this model is economical in terms of the volume of concrete.
- The thickness of infill steel plate for 2000*1000 mm (length*width) specimen dimensions should be limited by a specific value (min 3 mm) because using 1 mm of infill steel plate resulted in a quick failure in the model; the type of failure was expressed as an opening in the steel plate. Therefore, the ideal range of infill steel plate thickness was 3–12 mm. The best value in terms of cost economy is 6 mm.
- The thickness of the concrete wall for (2000*1000) mm (length*width) specimen dimensions should be limited by a specific value (max 150 mm) because the behavior of smart CSPSW remains the same beyond that thickness. Therefore, the best range for using the thickness of the concrete wall was 50–100 mm.
- The distance between shear studs for 2000*1000 mm (length*width) specimen dimensions should be limited by a specific value of 250 mm because large distances will cause widespread buckling of the steel plate and will result in no enhancement. Therefore, the best range for the distance between the shear stud was 200–250 mm.
Author Contributions
Funding
Institutional Review Board Statement
Informed Consent Statement
Data Availability Statement
Acknowledgments
Conflicts of Interest
References
- Ramesh, S. Behavior and Design of Earthquake-Resistant Dual-Plate Composite Shear Wall Systems; Purdue University: West Lafayette, IN, USA, 2013. [Google Scholar]
- Bruneau, M.; Alzeni, Y.; Fouché, P. Seismic Behavior of Concrete-Filled Steel Sandwich Walls and Concrete-Filled Steel Tube Columns. In Proceedings of the Steel Innovations Conference 2013, Christchurch, New Zealand, 21–22 February 2013. [Google Scholar]
- Yan, J.B.; Yan, Y.Y.; Wang, T. Cyclic Tests on Novel Steel-Concrete-Steel Sandwich Shear Walls with Boundary CFST Columns. J. Constr. Steel Res. 2020, 164, 105760. [Google Scholar] [CrossRef]
- Liu, Y.; Zhou, Z.; Cao, W.; Wei, L. Study on Seismic Performance of the Masonry Wall with Lightweight Concrete Filled Steel Tube Core Column and Thermal-Insulation Sandwich. J. Earthq. Eng. Eng. Vib. 2016, 15, 850. [Google Scholar] [CrossRef]
- ASCE 7. Minimum Design Loads for Buildings and Other Structures; American Society of Civil Engineers: Reston, VA, USA, 2022. [Google Scholar]
- AISC American Institute of Steel Construction-Seismic Provisions for Structural Steel Buildings. Seismic Provisions for Structural Steel Buildings; American Institute of Steel Construction: Chicago, IL, USA, 2010. [Google Scholar]
- Nie, X.; Wang, J.J.; Tao, M.X.; Fan, J.S.; Bu, F.M. Experimental Study of Flexural Critical Reinforced Concrete Filled Composite Plate Shear Walls. Eng. Struct. 2019, 197, 109439. [Google Scholar] [CrossRef]
- Mydin, M.A.O.; Wang, Y.C. Structural Performance of Lightweight Steel-Foamed Concretesteel Composite Walling System under Compression. Thin Walled Struct. 2011, 49, 66–76. [Google Scholar] [CrossRef]
- Wright, H. Axial and Bending Behavior of Composite Walls. J. Struct. Eng. 1998, 124, 758–764. [Google Scholar] [CrossRef]
- Wang, M.Z.; Guo, Y.L.; Zhu, J.S.; Yang, X. Flexural-Torsional Buckling and Design Recommendations of Axially Loaded Concrete-Infilled Double Steel Corrugated-Plate Walls with T-Section. Eng. Struct. 2020, 208, 110345. [Google Scholar] [CrossRef]
- Zhang, X.; Qin, Y.; Chen, Z. Experimental Seismic Behavior of Innovative Composite Shear Walls. J. Constr. Steel Res. 2016, 116, 218–232. [Google Scholar] [CrossRef]
- Zhang, W.; Wang, K.; Chen, Y.; Ding, Y. Experimental Study on the Seismic Behaviour of Composite Shear Walls with Stiffened Steel Plates and Infilled concrete. Thin Walled Struct. 2019, 144, 106279. [Google Scholar] [CrossRef]
- Najem, H.M. Influence of Concrete Strength on the Cycle Performance of Composite Steel Plate Shear Walls. Diyala J. Eng. Sci. 2018, 11, 1–7. [Google Scholar] [CrossRef]
- Najem, H.M. The Effect of Infill Steel Plate Thickness on the Cycle Behavior of Steel Plate Shear Walls. Diyala J. Eng. Sci. 2018, 11, 1–6. [Google Scholar] [CrossRef]
- Nguyen, N.H.; Whittaker, A.S. Numerical Modelling of Steel-Plate Concrete Composite Shear Walls. Eng. Struct. 2017, 150, 1–11. [Google Scholar] [CrossRef]
- Epackachi, S.; Whittaker, A.S.; Varma, A.H.; Kurt, E.G. Finite Element Modeling of Steel-Plate Concrete Composite Wall Piers. Eng. Struct. 2015, 100, 369–384. [Google Scholar] [CrossRef]
- Rafiei, S.; Hossain, K.M.A.; Lachemi, M.; Behdinan, K.; Anwar, M.S. Finite Element Modeling of Double Skin Profiled Composite Shear Wall System under In-Plane Loadings. Eng. Struct. 2013, 56, 46–57. [Google Scholar] [CrossRef]
- Wei, F.F.; Zheng, Z.J.; Yu, J.; Wang, Y.Q. Computational Method for Axial Compression Capacity of Double Steel-Concrete Composite Shear Walls with Consideration of Buckling. Gongcheng Lixue Eng. Mech. 2019, 36, 154–164. [Google Scholar] [CrossRef]
- Guo, L.; Wang, Y.; Zhang, S. Experimental Study of Rectangular Multi-Partition Steel-Concrete Composite Shear Walls. Thin-Walled Struct. 2018, 130, 577–592. [Google Scholar] [CrossRef]
- Wang, M.Z.; Guo, Y.L.; Zhu, J.S.; Yang, X. Flexural Buckling of Axially Loaded Concrete-Infilled Double Steel Corrugated-Plate Walls with T-Section. J. Constr. Steel Res. 2020, 166, 105940. [Google Scholar] [CrossRef]
- Shafaei, S.; Ayazi, A.; Farahbod, F. The Effect of Concrete Panel Thickness upon Composite Steel Plate Shear Walls. J. Constr. Steel Res. 2016, 117, 81–90. [Google Scholar] [CrossRef]
- Qin, Y.; Shu, G.P.; Zhou, G.G.; Han, J.H. Compressive Behavior of Double Skin Composite Wall with Different Plate Thicknesses. J. Constr. Steel Res. 2019, 157, 297–313. [Google Scholar] [CrossRef]
- Huang, Z.; Liew, J.Y.R. Structural Behaviour of Steel-Concrete-Steel Sandwich Composite Wall Subjected to Compression and End Moment. Thin-Walled Struct. 2016, 98, 592–606. [Google Scholar] [CrossRef]
- Li, X.; Li, X. Steel Plates and Concrete Filled Composite Shear Walls Related Nuclear Structural Engineering: Experimental Study for out-of-Plane Cyclic Loading. Nucl. Eng. Des. 2017, 315, 144–154. [Google Scholar] [CrossRef]
- Epackachi, S.; Nguyen, N.H.; Kurt, E.G.; Whittaker, A.S.; Varma, A.H. In-Plane Seismic Behavior of Rectangular Steel-Plate Composite Wall Piers. J. Struct. Eng. 2015, 141, 04014176. [Google Scholar] [CrossRef]
- JGJ/T 380; Technical Specification for Steel Plate Shear Walls. Ministry of Housing and Urban-Rural Development: Beijing, China, 2015.
- ACI Committee 318; Building Code Requirements for Structural Concrete and Commentary (ACI 318M-11). American Concrete Institute: Indianapolis, IN, USA, 2011.
- ANSI/AISC N690-18; Specification for Safety-Related Steel Structures for Nuclear Facilities. American Institute of Steel Construction: Chicago, IL, USA, 2018.
- Epackachi, S.; Nguyen, N.H.; Kurt, E.G.; Whittaker, A.S.; Varma, A.H. An Experimental Study of the In-Plane Response of Steel-Concrete Composite Walls. In Proceedings of the 22nd International Conference on Structural Mechanics in Reactor Technology (SMiRT-22), San Francisco, CA, USA, 18–23 August 2013. [Google Scholar]
- Kantaros, A.; Chatzidai, N.; Karalekas, D. 3D Printing-Assisted Design of Scaffold Structures. Int. J. Adv. Manuf. Technol. 2016, 82, 559–571. [Google Scholar] [CrossRef]
- Nedelcu, M.; Cucu, H.L. Buckling Modes Identification from FEA of Thin-Walled Members Using Only GBT Cross-Sectional Deformation Modes. Thin Walled Struct. 2014, 81, 150–158. [Google Scholar] [CrossRef]
- Yan, J.B.; Liew, J.Y.R.; Zhang, M.H.; Sohel, K.M.A. Experimental and Analytical Study on Ultimate Strength Behavior of Steel–Concrete–Steel Sandwich Composite Beam Structures. Mater. Struct. Mater. Constr. 2015, 48, 1523–1544. [Google Scholar] [CrossRef]
- Rahai, A.; Hatami, F. Evaluation of Composite Shear Wall Behavior under Cyclic Loadings. J. Constr. Steel Res. 2009, 65, 1528–1537. [Google Scholar] [CrossRef]
- Li, Q.; He, Y.; Zhou, K.; Han, X.; He, Y.; Shu, Z. Structural Health Monitoring for a 600 m High Skyscraper. Struct. Des. Tall Spec. Build. 2018, 27, e1490. [Google Scholar] [CrossRef]
- Wang, R.; Cao, W.L.; Yin, F.; Dong, H.Y. Experimental and Numerical Study Regarding a Fabricated CFST Frame Composite Wall Structure. J. Constr. Steel Res. 2019, 162, 105718. [Google Scholar] [CrossRef]
- Tong, J.Z.; Yu, C.Q.; Zhang, L. Sectional Strength and Design of Double-Skin Composite Walls Withre-Entrant Profiled Faceplates. Thin-Walled Struct. 2021, 158, 107196. [Google Scholar] [CrossRef]
- Zhao, Q.; Astaneh-Asl, A. Cyclic Behavior of Traditional and Innovative Composite Shear Walls. J. Struct. Eng. 2004, 130, 271–284. [Google Scholar] [CrossRef] [Green Version]
- Luo, Y.; Guo, X.; Li, J.; Xiong, Z.; Meng, L.; Dong, N.; Zhang, J. Experimental Research on Seismic Behaviour of the Concrete-Filled Double-Steel-Plate Composite Wall. Adv. Struct. Eng. 2015, 18, 1845–1858. [Google Scholar] [CrossRef]
- Huang, S.T.; Huang, Y.S.; He, A.; Tang, X.L.; Chen, Q.J.; Liu, X.; Cai, J. Experimental Study on Seismic Behaviour of an Innovative Composite Shear Wall. J. Constr. Steel Res. 2018, 148, 165–179. [Google Scholar] [CrossRef]
- Nie, J.G.; Hu, H.S.; Fan, J.S.; Tao, M.X.; Li, S.Y.; Liu, F.J. Experimental Study on Seismic Behavior of High-Strength Concrete Filled Double-Steel-Plate Composite Walls. J. Constr. Steel Res. 2013, 88, 206–219. [Google Scholar] [CrossRef]
- Najm, H.M.; Ibrahim, A.M.; Sabri, M.M.; Hassan, A.; Morkhade, S.; Mashaan, N.S.; Eldirderi, M.M.A.; Khedher, K.M. Modelling of Cyclic Load Behaviour of Smart Composite Steel-Concrete Shear Wall Using Finite Element Analysis. Buildings 2022, 12, 850. [Google Scholar] [CrossRef]


| Group No. | Group Name | SW | Gap | Thickness of Steel | Thickness of Concrete | Distance between Shear Studs | Ratio of Reinforcement | Compressive Strength | Yield Strength | Layout of Shear Stud (H*V) |
|---|---|---|---|---|---|---|---|---|---|---|
| 1 | Gap between steel frame and concrete wall | SW-G0mm | 0 | 3 | 50 | 200 | 1% | 45 | 240 | 3*8 |
| SW-G30mm | 30 | 3 | 50 | 200 | 1% | 45 | 240 | 3*8 | ||
| SW-G40mm(R) | 40 | 3 | 50 | 200 | 1% | 45 | 240 | 3*8 | ||
| SW-G50mm | 50 | 3 | 50 | 200 | 1% | 45 | 240 | 3*8 | ||
| 2 | Thickness of infill steel plate | SW-TS3mm(R) | 40 | 3 | 50 | 200 | 1% | 45 | 240 | 3*8 |
| SW-TS6mm | 40 | 6 | 50 | 200 | 1% | 45 | 240 | 3*8 | ||
| SW-TS12mm | 40 | 12 | 50 | 200 | 1% | 45 | 240 | 3*8 | ||
| 3 | Thickness of concrete wall | SW-TC50mm(R) | 40 | 3 | 50 | 200 | 1% | 45 | 240 | 3*8 |
| SW-TC75mm | 40 | 3 | 75 | 200 | 1% | 45 | 240 | 3*8 | ||
| SW-TC100mm | 40 | 3 | 100 | 200 | 1% | 45 | 240 | 3*8 | ||
| SW-TC150mm | 40 | 3 | 150 | 200 | 1% | 45 | 240 | 3*8 | ||
| 4 | Distance between shear studs | SW-D200mm(R) | 40 | 3 | 50 | 200 | 1% | 45 | 240 | 3*8 |
| SW-D210mm | 40 | 3 | 50 | 210 | 1% | 45 | 240 | 3*8 | ||
| SW-D220mm | 40 | 3 | 50 | 220 | 1% | 45 | 240 | 3*8 | ||
| SW-D230mm | 40 | 3 | 50 | 230 | 1% | 45 | 240 | 3*8 | ||
| SW-D240mm | 40 | 3 | 50 | 240 | 1% | 45 | 240 | 3*8 | ||
| SW-D250mm | 40 | 3 | 50 | 250 | 1% | 45 | 240 | 3*8 |
| Time (s) | Max. Load (KN) | Loading Shape | Frequencies (Hz.) | |
|---|---|---|---|---|
| Start | End | |||
| 0.0 | 71 | 0.0 | Cyclic | 0.0 |
| 72 | 180 | 300 | Cyclic | 1/60 |
| 181 | 360 | 500 | Cyclic | 1/60 |
| 361 | 540 | 600 | Cyclic | 1/60 |
Publisher’s Note: MDPI stays neutral with regard to jurisdictional claims in published maps and institutional affiliations. |
© 2022 by the authors. Licensee MDPI, Basel, Switzerland. This article is an open access article distributed under the terms and conditions of the Creative Commons Attribution (CC BY) license (https://creativecommons.org/licenses/by/4.0/).
Share and Cite
Najm, H.M.; Ibrahim, A.M.; Sabri, M.M.S.; Hassan, A.; Morkhade, S.; Mashaan, N.S.; Eldirderi, M.M.A.; Khedher, K.M. Evaluation and Numerical Investigations of the Cyclic Behavior of Smart Composite Steel–Concrete Shear Wall: Comprehensive Study of Finite Element Model. Materials 2022, 15, 4496. https://doi.org/10.3390/ma15134496
Najm HM, Ibrahim AM, Sabri MMS, Hassan A, Morkhade S, Mashaan NS, Eldirderi MMA, Khedher KM. Evaluation and Numerical Investigations of the Cyclic Behavior of Smart Composite Steel–Concrete Shear Wall: Comprehensive Study of Finite Element Model. Materials. 2022; 15(13):4496. https://doi.org/10.3390/ma15134496
Chicago/Turabian StyleNajm, Hadee Mohammed, Amer M. Ibrahim, Mohanad Muayad Sabri Sabri, Amer Hassan, Samadhan Morkhade, Nuha S. Mashaan, Moutaz Mustafa A. Eldirderi, and Khaled Mohamed Khedher. 2022. "Evaluation and Numerical Investigations of the Cyclic Behavior of Smart Composite Steel–Concrete Shear Wall: Comprehensive Study of Finite Element Model" Materials 15, no. 13: 4496. https://doi.org/10.3390/ma15134496
APA StyleNajm, H. M., Ibrahim, A. M., Sabri, M. M. S., Hassan, A., Morkhade, S., Mashaan, N. S., Eldirderi, M. M. A., & Khedher, K. M. (2022). Evaluation and Numerical Investigations of the Cyclic Behavior of Smart Composite Steel–Concrete Shear Wall: Comprehensive Study of Finite Element Model. Materials, 15(13), 4496. https://doi.org/10.3390/ma15134496