
Corrosion Behavior of CrFeCoNiVx (x = 0.5 and 1) High-Entropy Alloys in 1M Sulfuric Acid and 1M Hydrochloric Acid Solutions

Abstract
:1. Introduction
2. Materials and Methods
3. Results and Discussion
4. Conclusions
Author Contributions
Funding
Institutional Review Board Statement
Informed Consent Statement
Data Availability Statement
Acknowledgments
Conflicts of Interest
References
- Yeh, J.W.; Chen, S.K.; Gan, J.W.; Chin, T.S.; Shun, T.T.; Tsau, C.H.; Chang, S.Y. Nanostructured high-entropy alloys with multiple principal elements: Novel alloy design concepts and outcomes. Adv. Eng. Mater. 2004, 6, 299–303. [Google Scholar] [CrossRef]
- Murty, B.S.; Yeh, J.W.; Ranganathan, S.; Bhattacharjee, P.P. High-Entropy Alloys, 2nd ed.; Elsevier Co.: Amsterdam, The Netherlands, 2019; pp. 13–30. [Google Scholar]
- Yeh, J.W. Alloy Design Strategies and Future Trends in High-Entropy Alloys. JOM 2013, 65, 1759–1771. [Google Scholar] [CrossRef]
- Shkodich, N.; Sedegov, A.; Kuskov, K.; Busurin, S.; Scheck, Y.; Vadchenko, S.; Moskovskikh, D. Refractory High-Entropy HfTaTiNbZr-Based Alloys by Combined Use of Ball Milling and Spark Plasma Sintering: Effect of Milling Intensity. Metals 2020, 10, 1268. [Google Scholar] [CrossRef]
- Senkov, O.N.; Wilks, G.B.; Scott, J.M.; Miracle, D.B. Mechanical properties of Nb25Mo25Ta25W25 and V20Nb20Mo20Ta20W20 refractory high entropy alloys. Intermetallics 2011, 19, 698–706. [Google Scholar] [CrossRef]
- Zhang, K.B.; Fu, Z.Y.; Zhang, J.Y.; Wang, W.M.; Wang, H.; Wang, Y.C.; Zhang, Q.J.; Shib, J. Microstructure and mechanical properties of CoCrFeNiTiAlx high-entropy alloys. Mater. Sci Eng. A 2009, 508, 214–219. [Google Scholar] [CrossRef]
- Lu, K.; Chauhan, A.; Tirunilai, A.S.; Freudenberger, J.; Kauffmann, A.; Heilmaier, M.; Aktaa, J. Deformation mechanisms of CoCrFeMnNi high-entropy alloy under low-cycle-fatigue loading. Acta Mater. 2021, 215, 117089. [Google Scholar] [CrossRef]
- Otto, F.; Dlouhy, A.; Somsen, C.; Bei, H.; Eggeler, G.; George, E.P. The influences of temperature and microstructure on the tensile properties of a CoCrFeMnNi high-entropy alloy. Acta Mater. 2013, 61, 5743–5755. [Google Scholar] [CrossRef] [Green Version]
- Zhang, Y.; Li, R. New Advances in High-Entropy Alloys. Entropy 2020, 22, 1158. [Google Scholar] [CrossRef] [PubMed]
- Vaidya, M.; Gariapati, M.M.; Murty, B.S. High-entropy alloys by mechanical alloying: A review. J. Mater. Res. 2019, 34, 664–686. [Google Scholar] [CrossRef]
- Geantă, V.; Voiculescu, I.; Cotrut, M.C.; Vrânceanu, M.D.; Vasile, I.M.; Rosca, J.C.M. Effect of Al on Corrosion Behavior in 3.5% NaCl Solution of AlxCoCrFeNi High Entropy Alloys. Int. J. Eng. Res. Afr. 2021, 53, 20–30. [Google Scholar] [CrossRef]
- Wang, W.; Wang, J.; Yi, H.; Qi, W.; Peng, Q. Effect of Molybdenum Additives on Corrosion Behavior of (CoCrFeNi)100−xMox High-Entropy Alloys. Entropy 2018, 20, 908. [Google Scholar] [CrossRef] [PubMed] [Green Version]
- Tsau, C.H.; Tsai, M.C. The effects of Mo and Nb on the microstructures and properties of CrFeCoNi(Nb,Mo) alloys. Entropy 2018, 20, 648. [Google Scholar] [CrossRef] [PubMed] [Green Version]
- Tsau, C.H.; Yeh, C.Y.; Tsai, M.C. The Effect of Nb-Content on the Microstructures and Corrosion Properties of CrFeCoNiNbx High-Entropy Alloys. Materials 2019, 12, 3716. [Google Scholar] [CrossRef] [PubMed] [Green Version]
- Liu, X.Q.; Zhang, Y.X.; Wang, X.R.; Wang, Z.Q.; He, P. Microstructure and corrosion properties of AlCrxNiCu0.5Mo (x = 0, 0.5, 1.0, 1.5, 2.0) high entropy alloy coatings on Q235 steel by electrospark—Computer numerical control deposition. Mater. Lett. 2021, 292, 129642. [Google Scholar] [CrossRef]
- Xing, Q.; Wang, H.; Chen, M.; Chen, Z.; Li, R.; Jin, P.; Zhang, Y. Mechanical Properties and Corrosion Resistance of NbTiAlSiZrNx High-Entropy Films Prepared by RF Magnetron Sputtering. Entropy 2019, 21, 396. [Google Scholar] [CrossRef] [PubMed] [Green Version]
- Schlain, D.; Kenahan, C.B.; Acherman, W.L. Corrosion properties of high-purity vanadium. J. Less-Common Met. 1961, 3, 458–467. [Google Scholar] [CrossRef]
- Sherif, E.S.M.; Abdo, H.S.; Alharthi, N.H. Beneficial Effects of Vanadium Additions on the Corrosion of Ti6AlxV Alloys in Chloride Solutions. Metals 2020, 10, 264. [Google Scholar] [CrossRef] [Green Version]
- Bard, A.J.; Faulkner, L.R. Electrochemical Methods: Fundamentals and Applications, 2nd ed.; John Wiley & Sons: New York, NY, USA, 2000; the table on inside back cover. [Google Scholar]
- Salishchev, G.A.; Tikhonovsky, M.A.; Shaysultanov, D.G.; Stepanov, N.D.; Kuznetsov, A.V.; Kolodiy, I.V.; Tortika, A.S.; Senkov, O.N. Effect of Mn and V on structure and mechanical properties of high-entropy alloys based on CoCrFeNi system. J. Alloys Compd. 2014, 591, 11–21. [Google Scholar] [CrossRef]
- Dubiel, S.M.; Cieślak, J. Sigma-phase in Fe-Cr and Fe-V alloy systems and its physical properties. Crit. Rev. Solid State Mater. Sci. 2011, 36, 191–208. [Google Scholar] [CrossRef] [Green Version]
- Revie, R.W.; Uhlig, H.H. Corrosion and Corrosion Control, and Introduction to Corrosion Science and Engineering, 4th ed.; John Wiley & Sons, Inc.: New York, NY, USA, 2008; p. 476. [Google Scholar]


| Alloys (at.%) | Cr | Fe | Co | Ni | V |
|---|---|---|---|---|---|
| (wt.%) | |||||
| CrFeCoNiV0.5 | 20.72 | 22.25 | 23.48 | 23.39 | 10.16 |
| CrFeCoNiV | 18.81 | 20.20 | 21.32 | 21.24 | 18.43 |
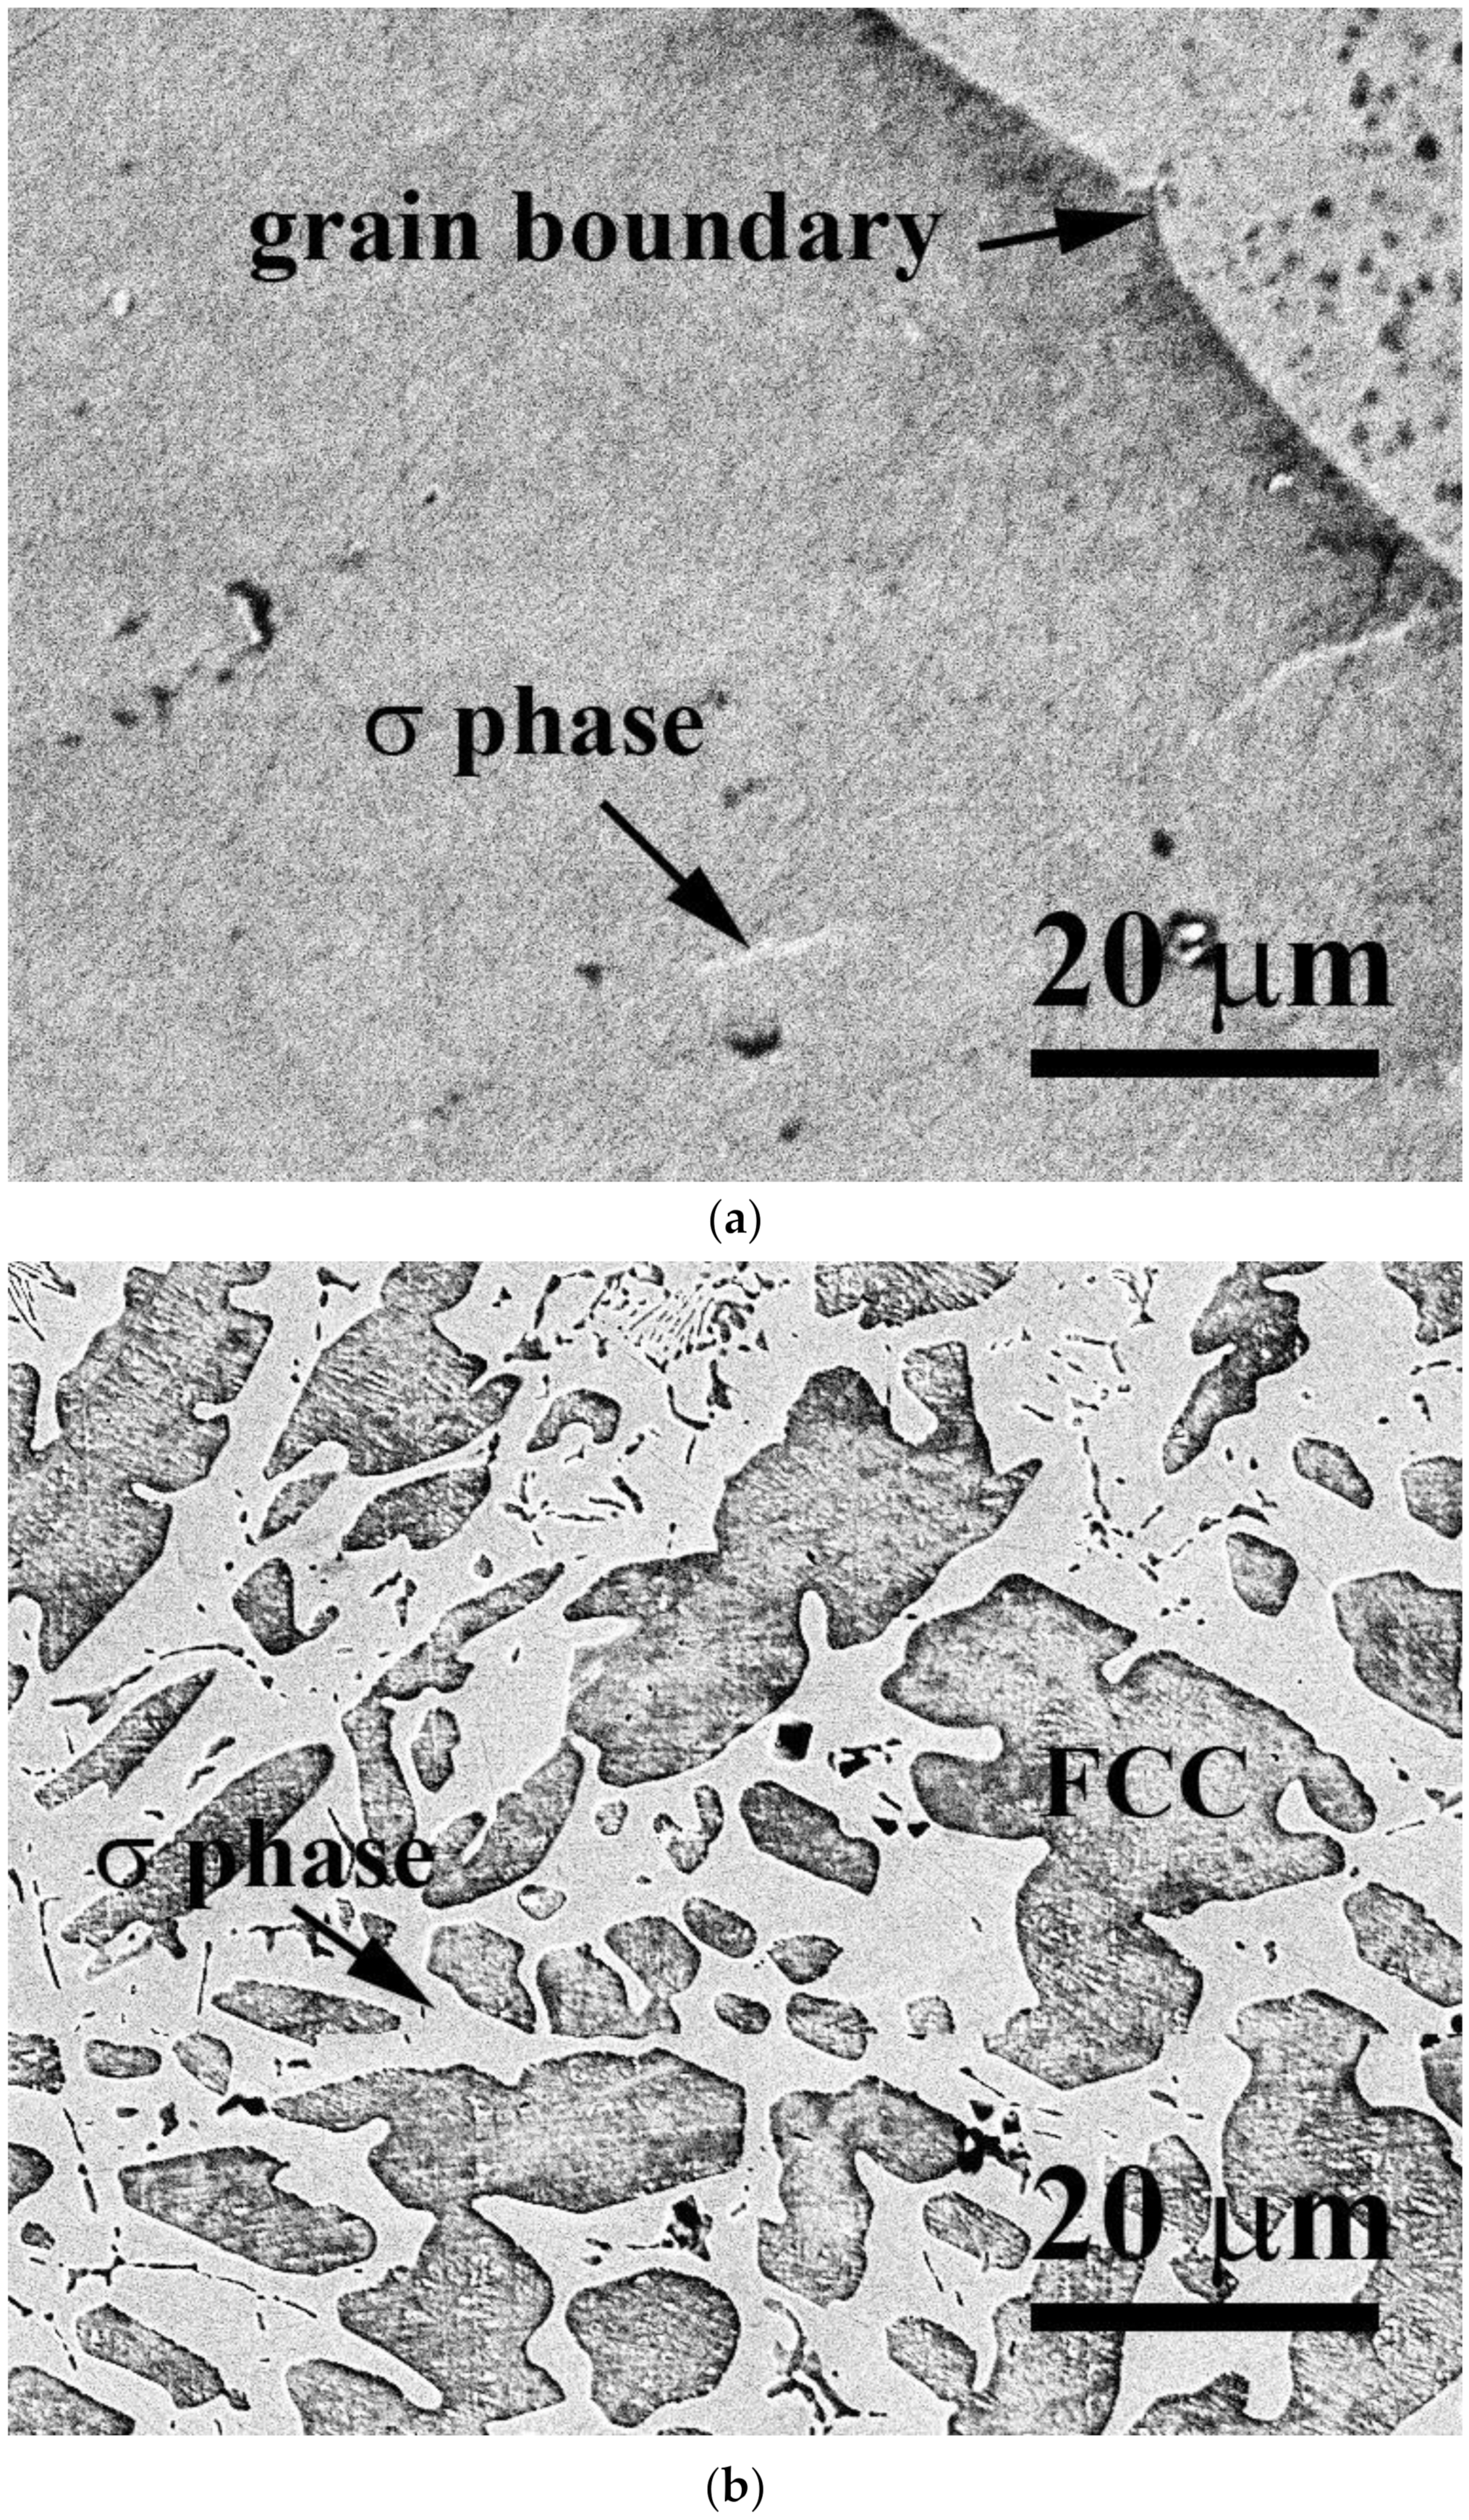
| Regions in the Alloys (at.%) | Cr | Fe | Co | Ni | V |
|---|---|---|---|---|---|
| (wt.%) | |||||
| CrFeCoNiV0.5 | |||||
| overall | 21.6 ± 0.2 | 22.6 ± 0.3 | 22.3 ± 0.4 | 22.3 ± 0.2 | 11.2 ± 0.2 |
| FCC | 20.9 ± 0.6 | 23.3 ± 0.7 | 23.8 ± 0.7 | 22.7 ± 0.3 | 9.3 ± 0.9 |
| σ phase | 34.1 ± 1.1 | 20.3 ± 0.2 | 17.3 ± 0.4 | 11.7 ± 1.2 | 16.6 ± 0.3 |
| CrFeCoNiV | |||||
| overall | 19.4 ± 0.2 | 20.2 ± 0.2 | 20.5 ± 0.2 | 20.2 ± 0.3 | 19.7 ± 0.2 |
| FCC | 17.3 ± 0.6 | 19.3 ± 0.3 | 21.1 ± 0.2 | 23.6 ± 0.8 | 18.7 ± 0.2 |
| σ phase | 23.5 ± 0.2 | 20.4 ± 0.3 | 18.9 ± 0.6 | 15.8 ± 0.2 | 21.4 ± 0.4 |
| CrFeCoNiV0.5 | CrFeCoNiV | |||
|---|---|---|---|---|
| 30 °C | 60 °C | 30 °C | 60 °C | |
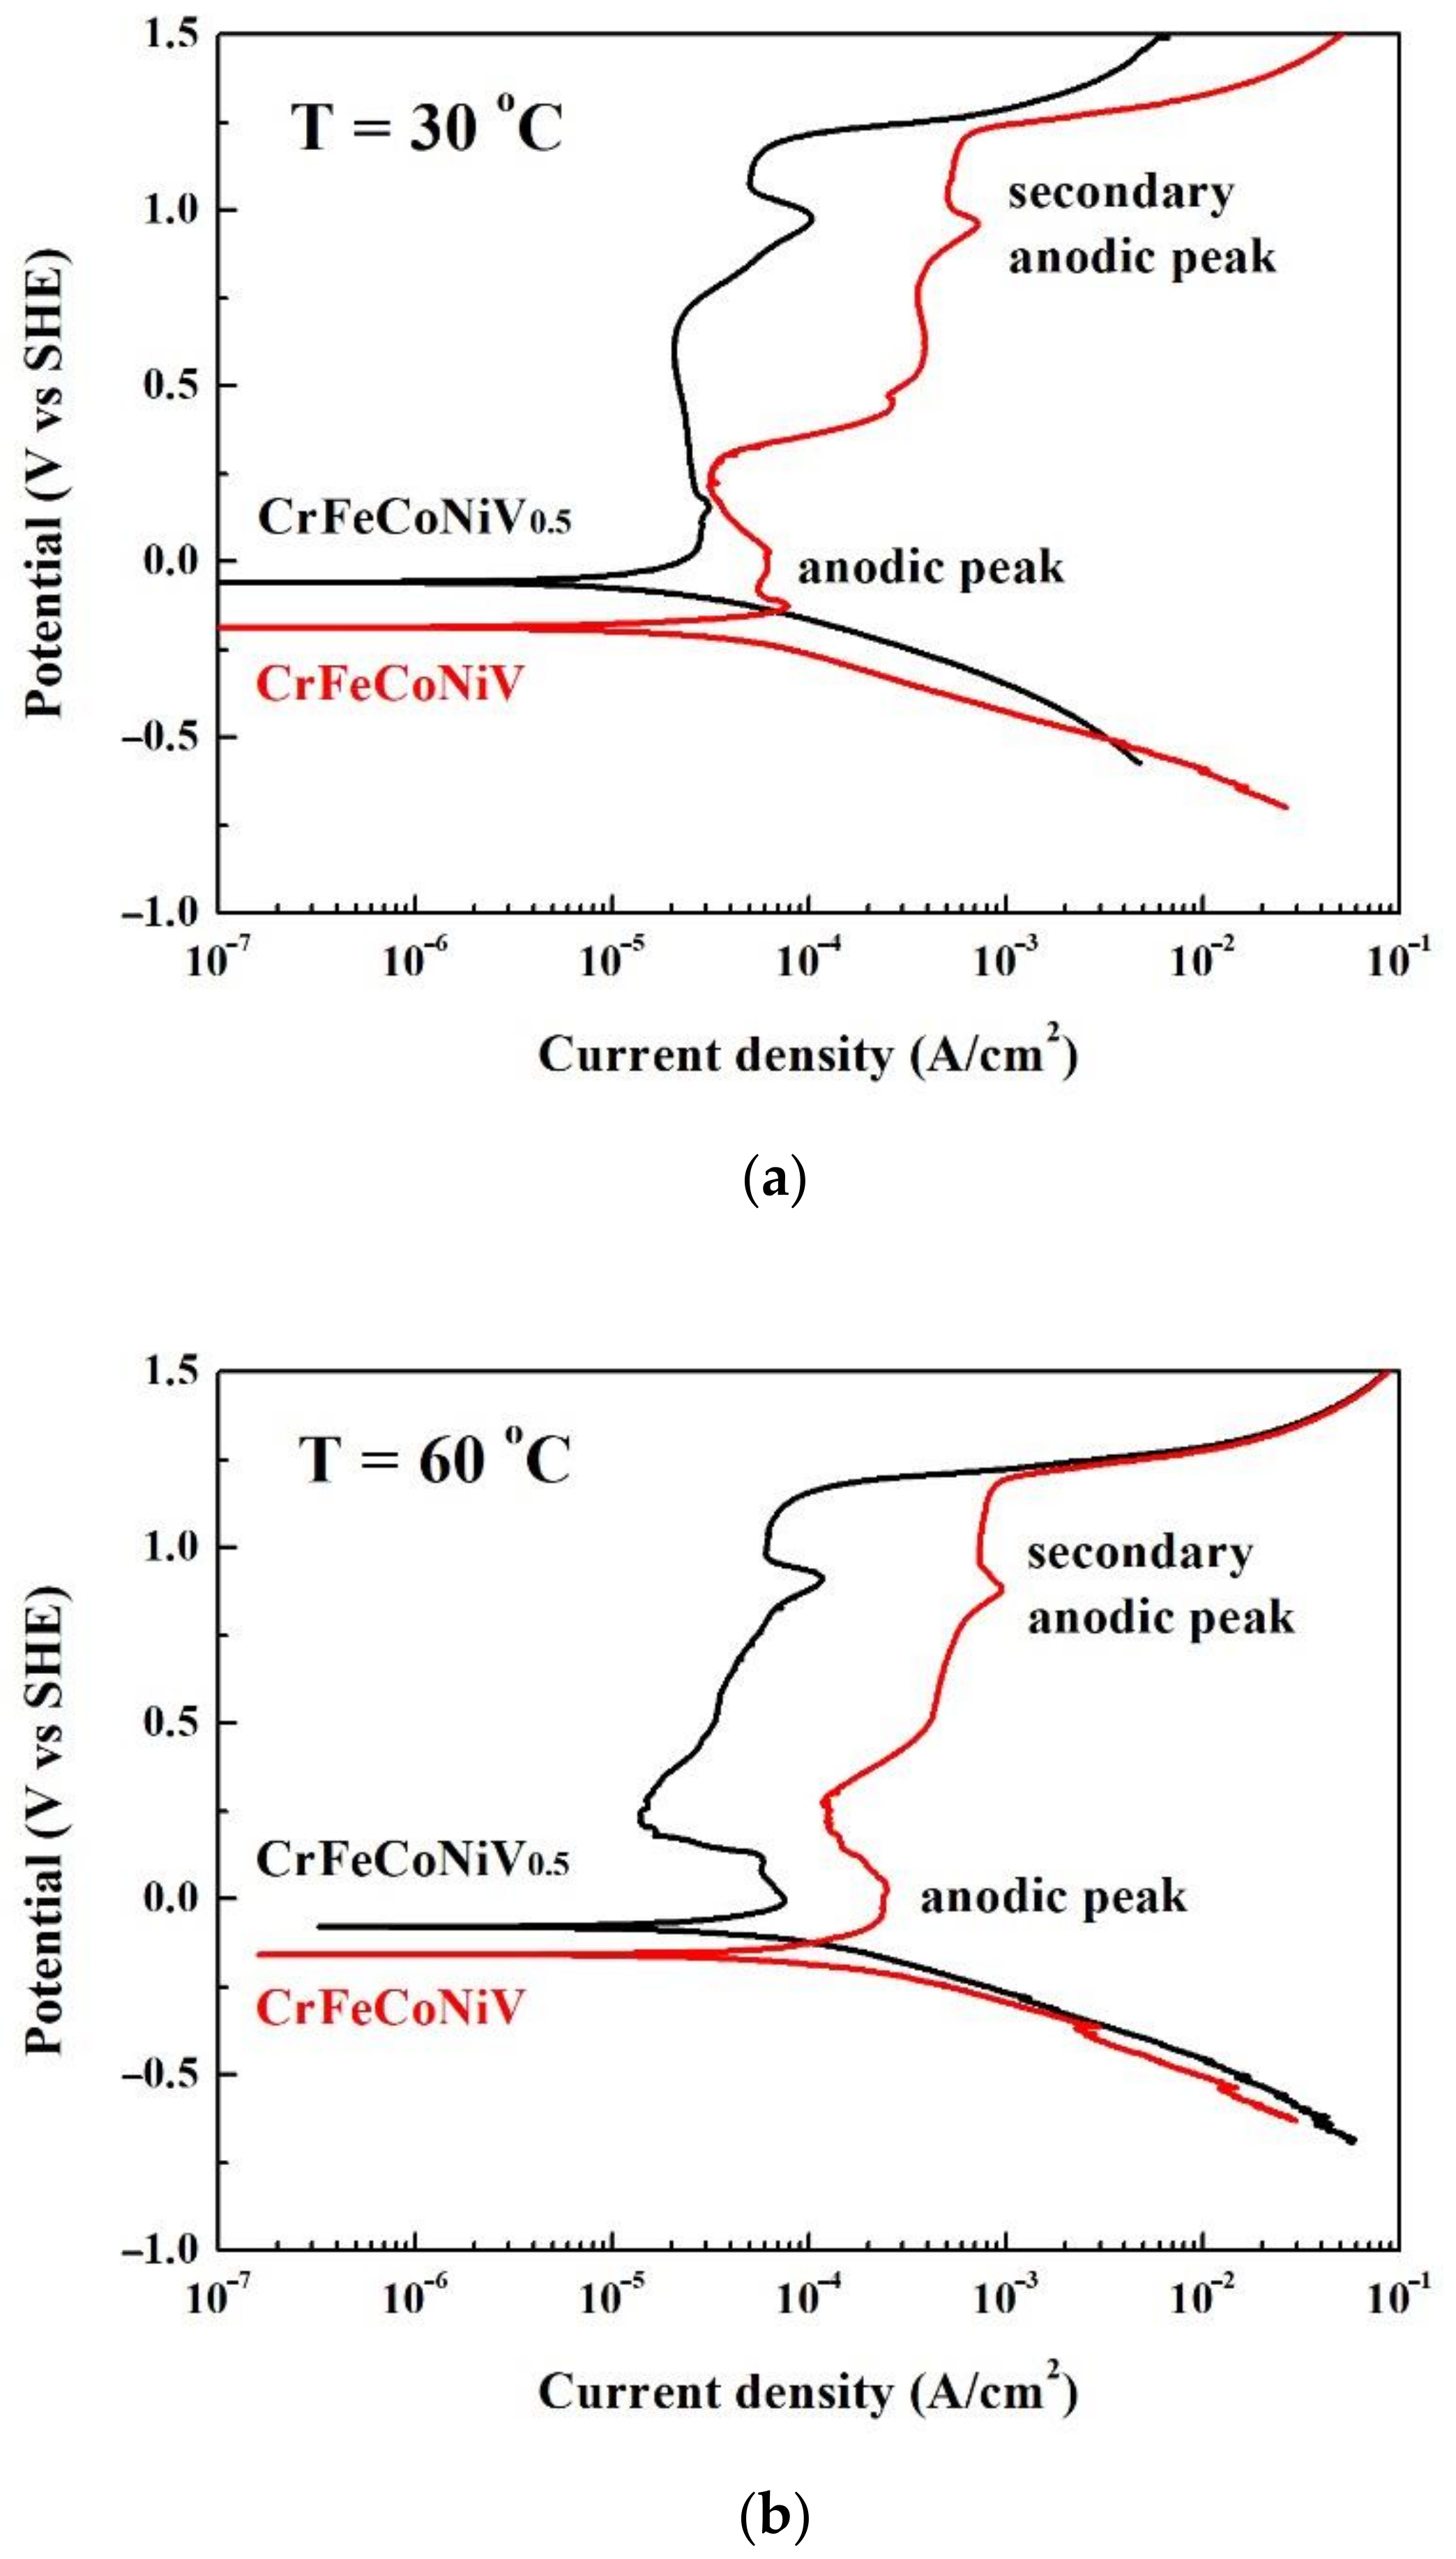
| Ecorr (VSHE) | −0.06 | −0.08 | −0.19 | −0.16 |
| icorr (μA/cm2) | 29.0 | 69.0 | 31.0 | 103 |
| Epp (VSHE) | 0.15 | 0.00 | 0.13 | 0.02 |
| icrit (μA/cm2) | 28.0 | 75.0 | 78.0 | 246 |
| Epp2 (VSHE) * | 0.98 | 0.91 | 0.96 | 0.88 |
| icrit2 (μA/cm2) * | 104 | 117 | 722 | 962 |
| Eb (VSHE) | 1.21 | 1.18 | 1.22 | 1.20 |
| CrFeCoNiV0.5 | CrFeCoNiV | |
|---|---|---|
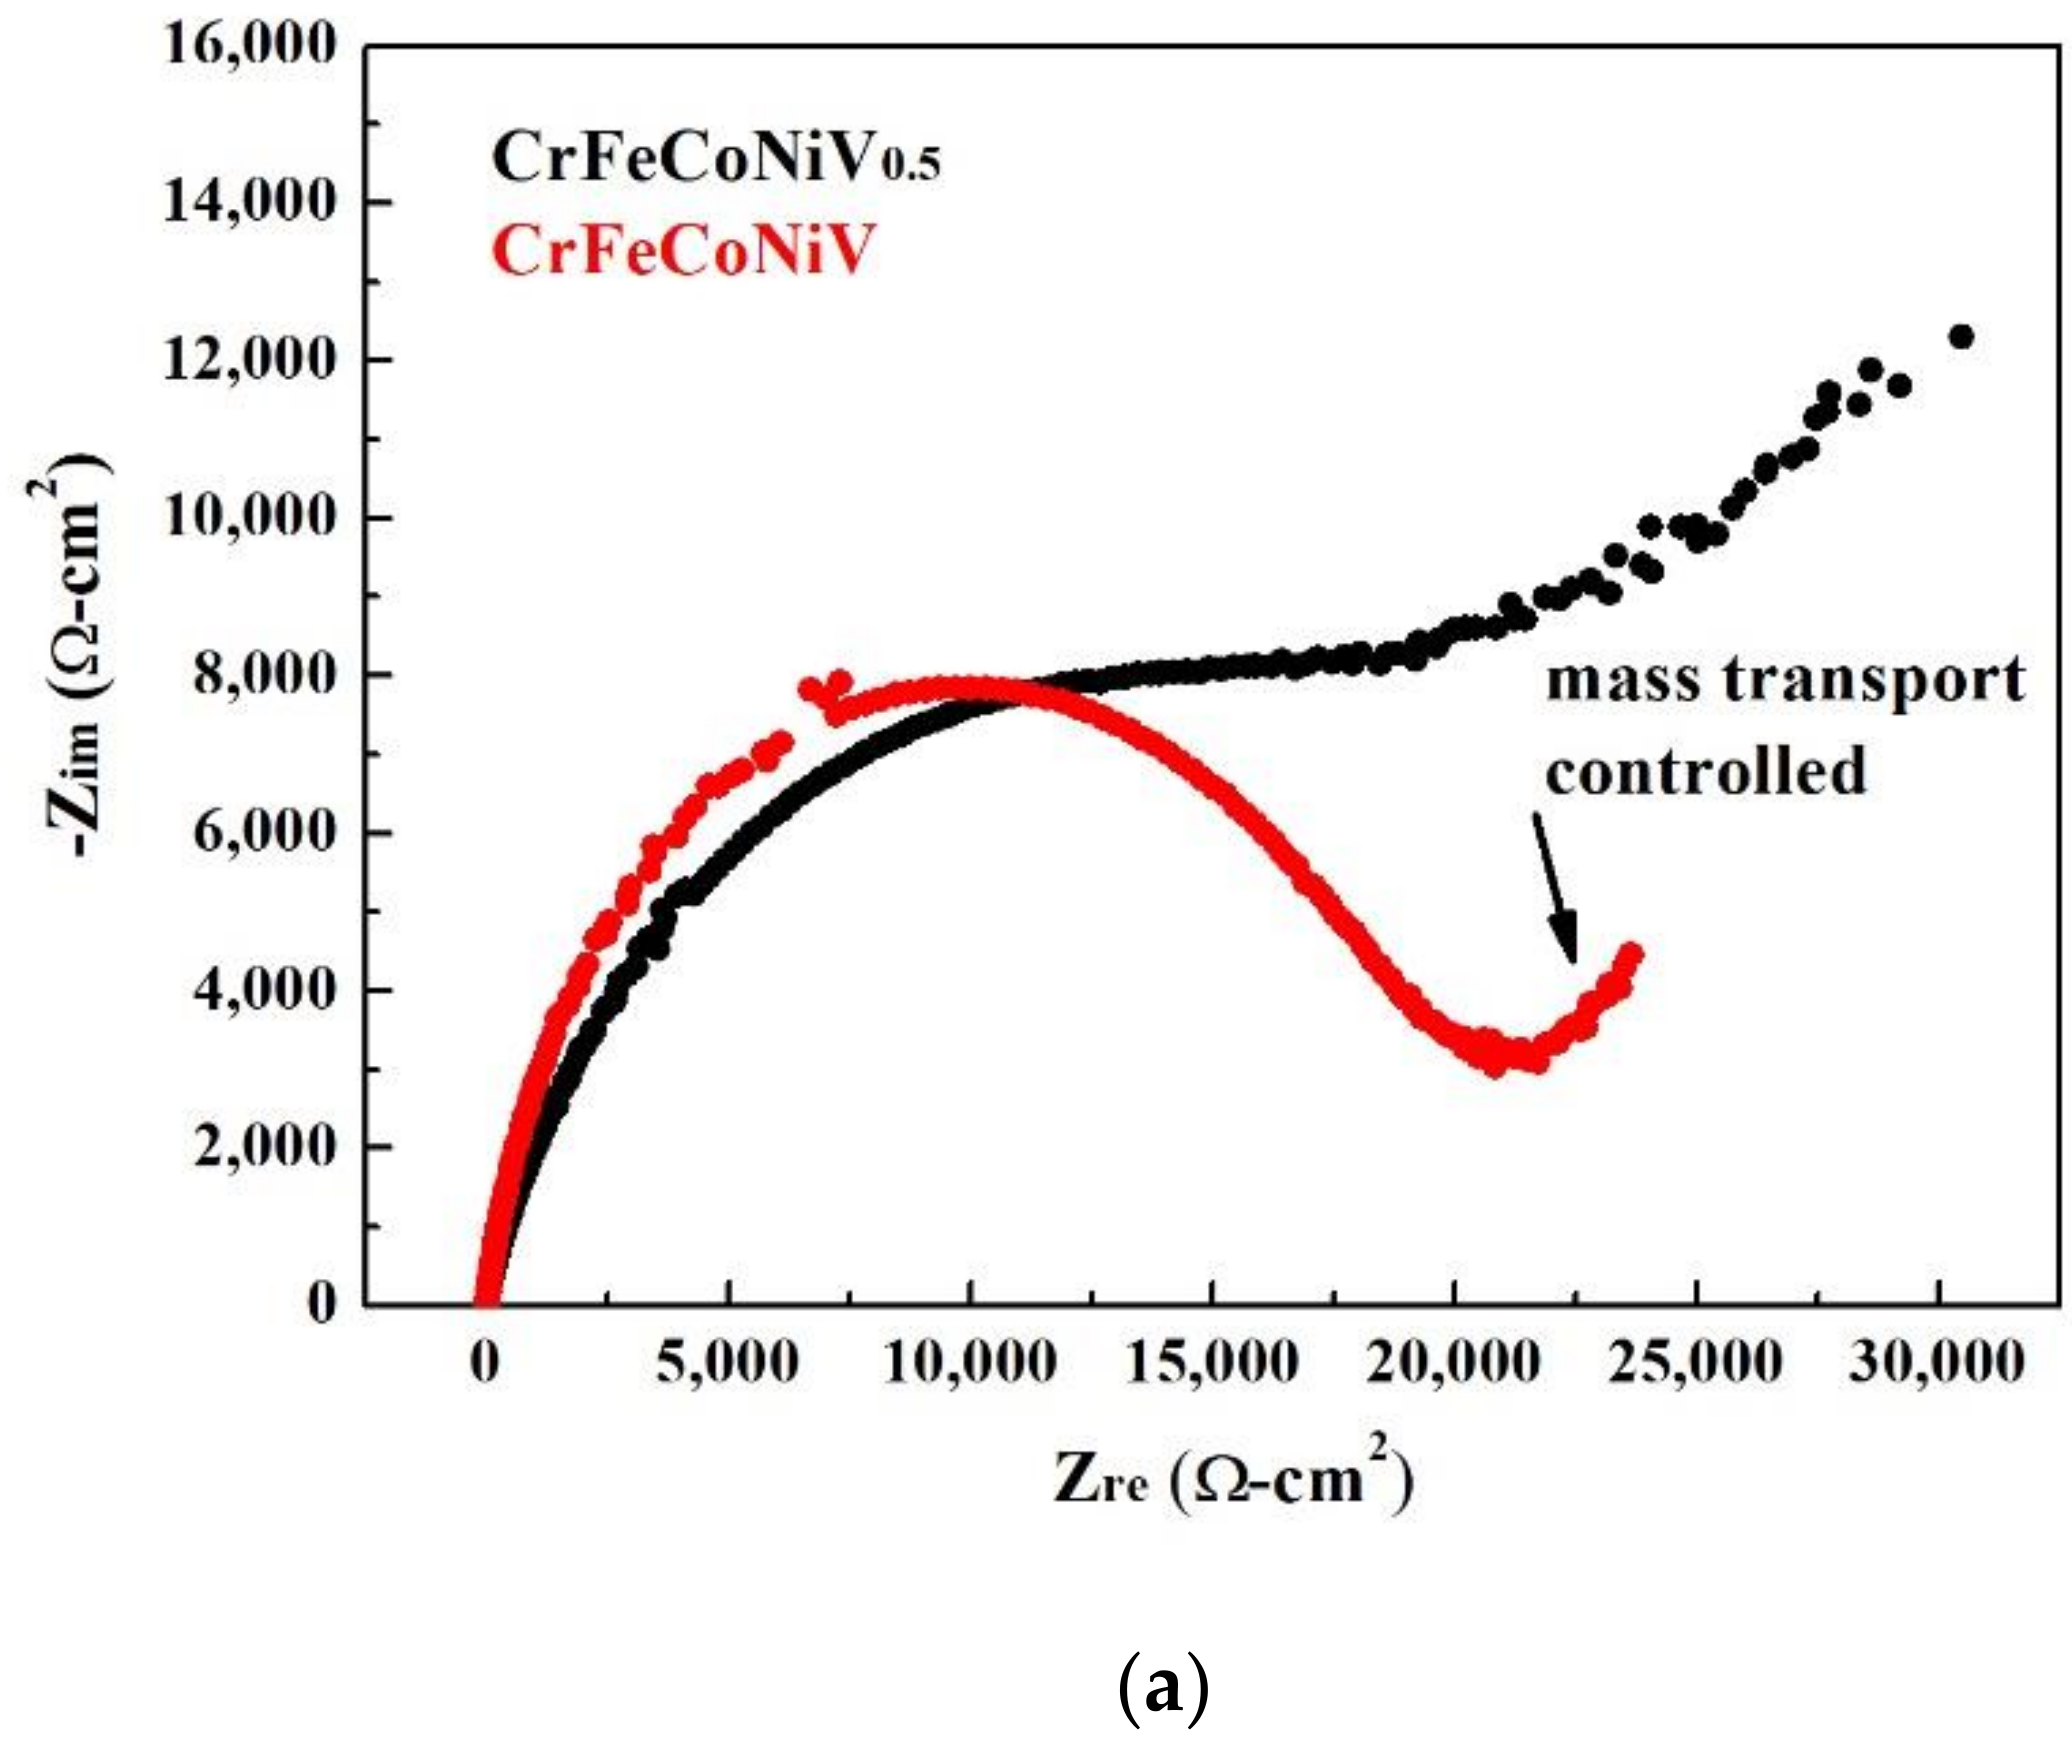
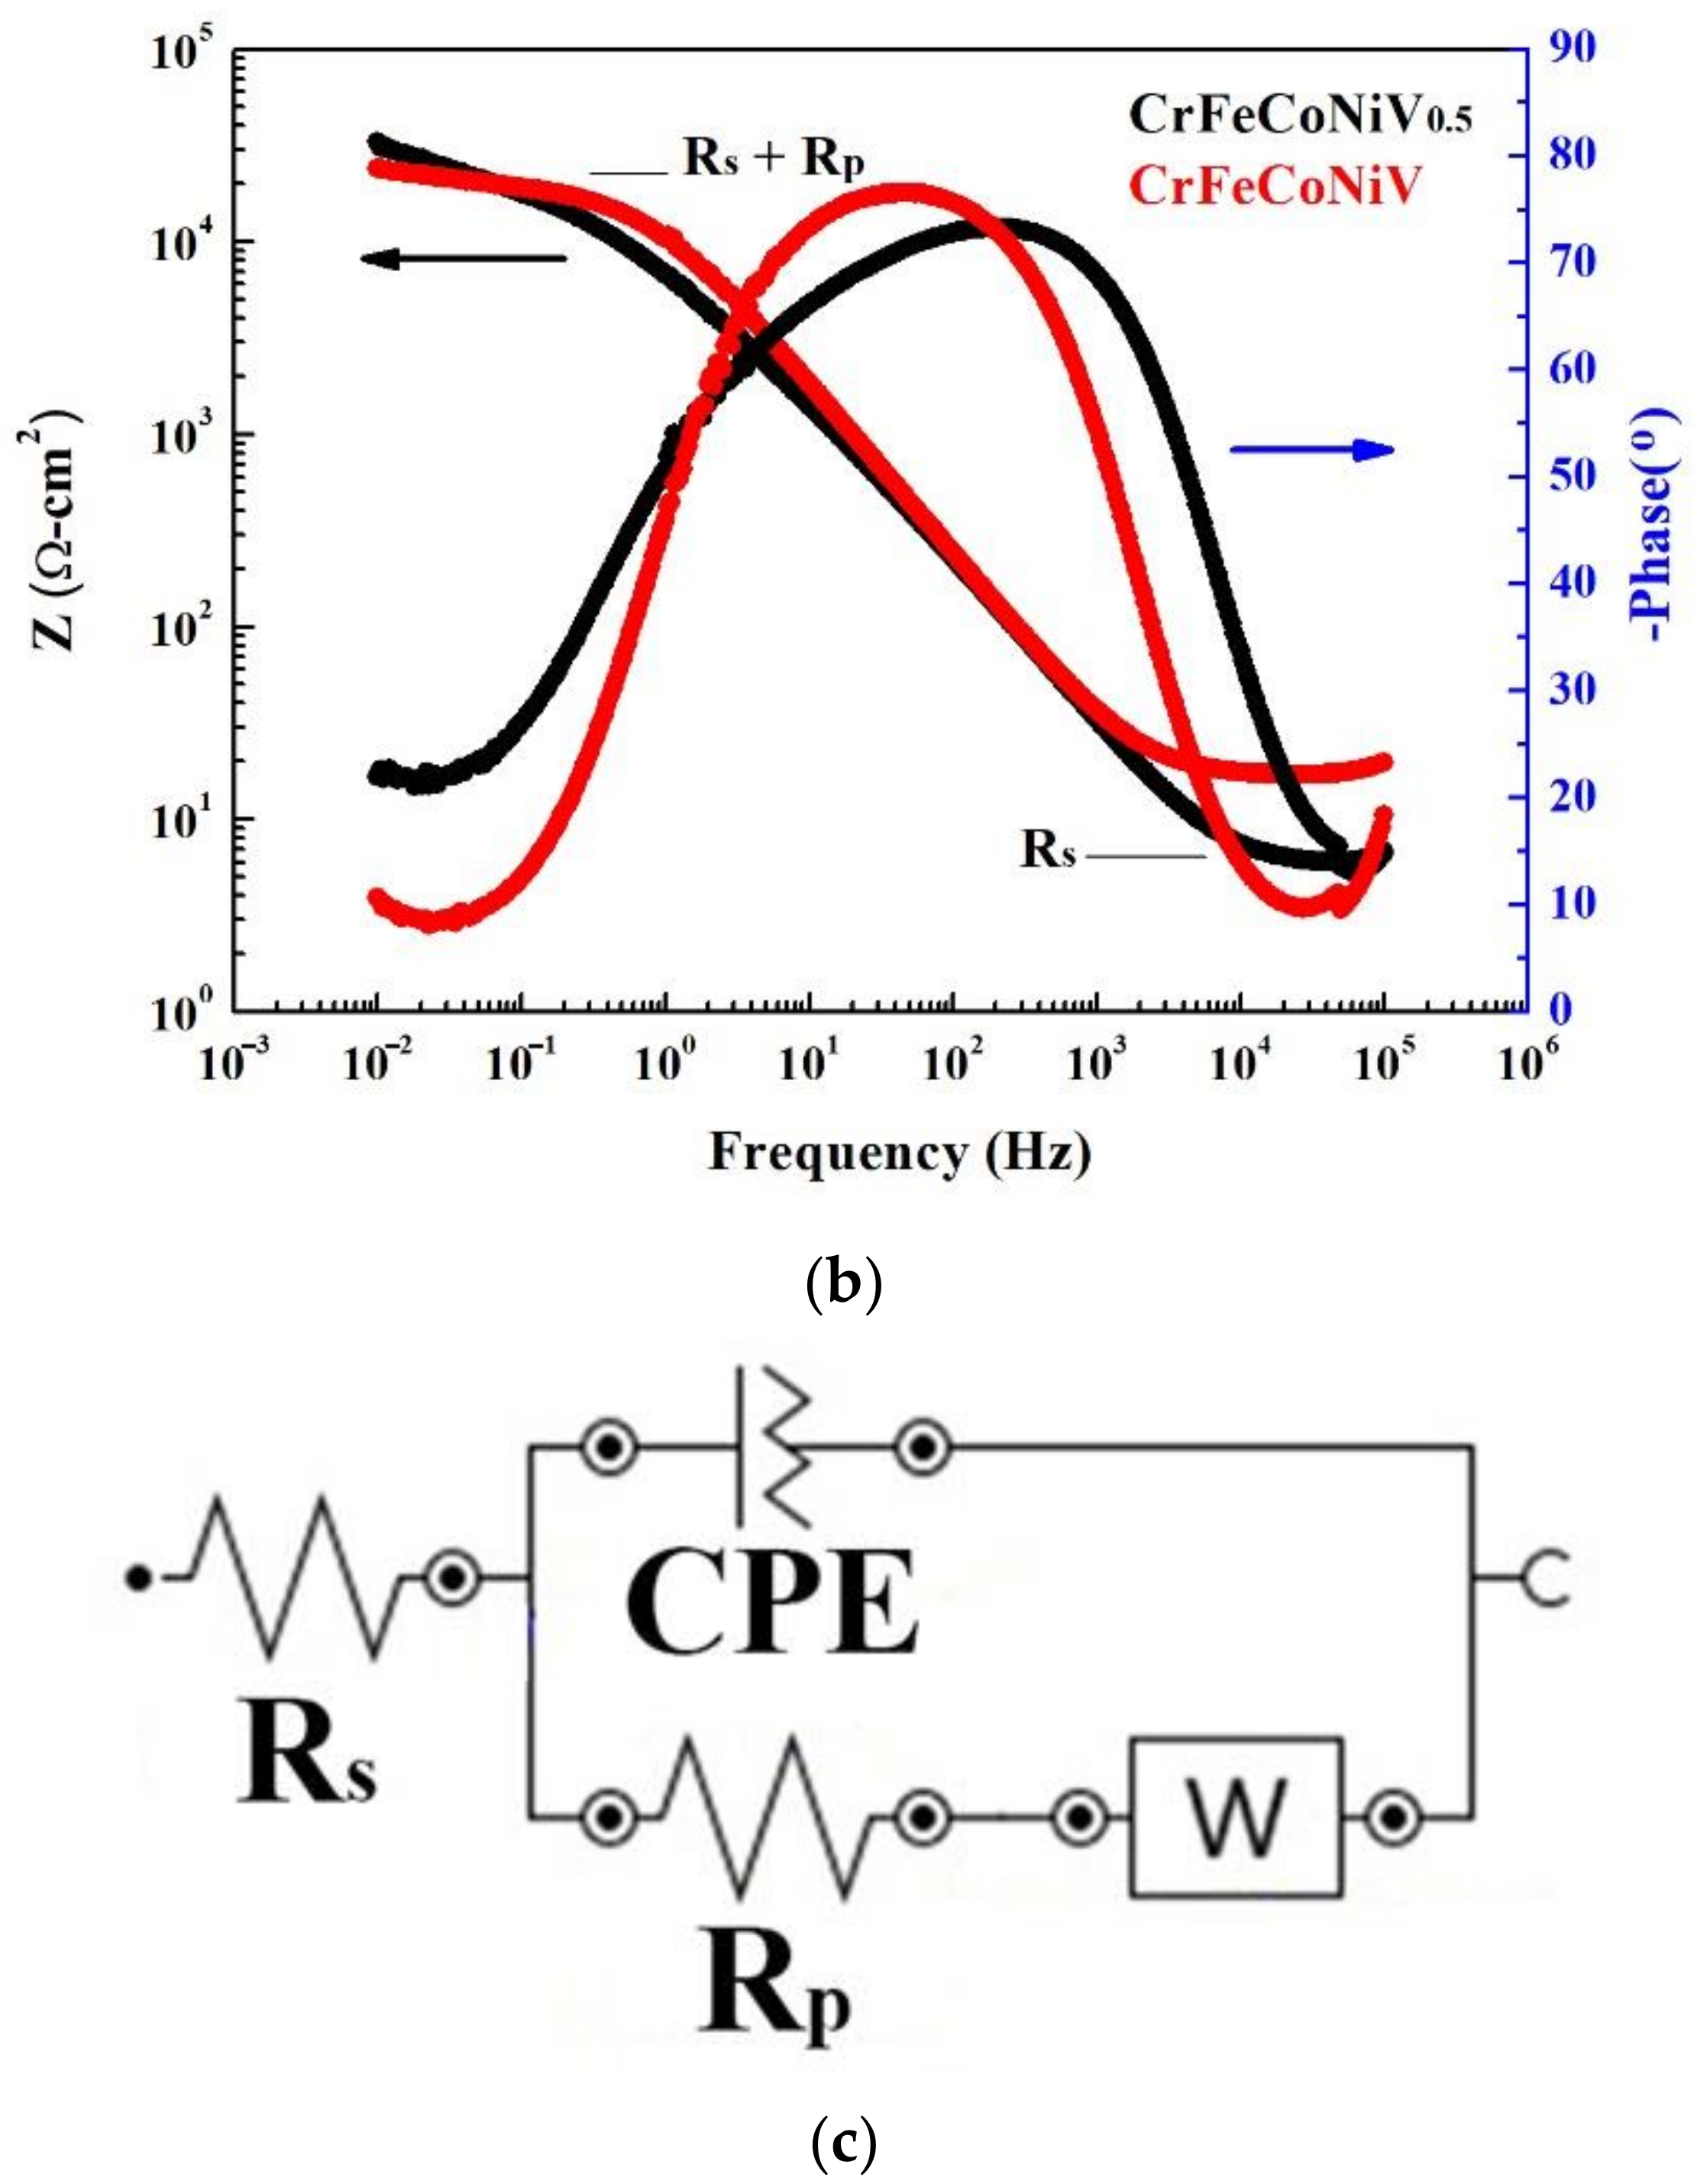
| Rs (Ω) | 5.62 | 7.24 |
| Rp (kΩ) | 5.78 | 17.1 |
| CrFeCoNiV0.5 | CrFeCoNiV | |||
|---|---|---|---|---|
| 30 °C | 60 °C | 30 °C | 60 °C | |
| Ecorr (VSHE) | −0.14 | −0.14 | −0.01 | −0.09 |
| icorr (μA/cm2) | 10.0 | 20.0 | 20.0 | 30.0 |
| Epp (VSHE) | 0.07 | 0.04 | 0.33 | 0.04 |
| icrit (μA/cm2) | 28.0 | 836 | 1200 | 463 |
| Epp2 (VSHE) * | 0.96 | N/A | 0.93 | N/A |
| icrit2 (μA/cm2) * | 118 | N/A | 884 | N/A |
| Eb (VSHE) | 1.20 | 1.19 | 1.23 | 1.19 |
| CrFeCoNiV0.5 | CrFeCoNiV | |
|---|---|---|
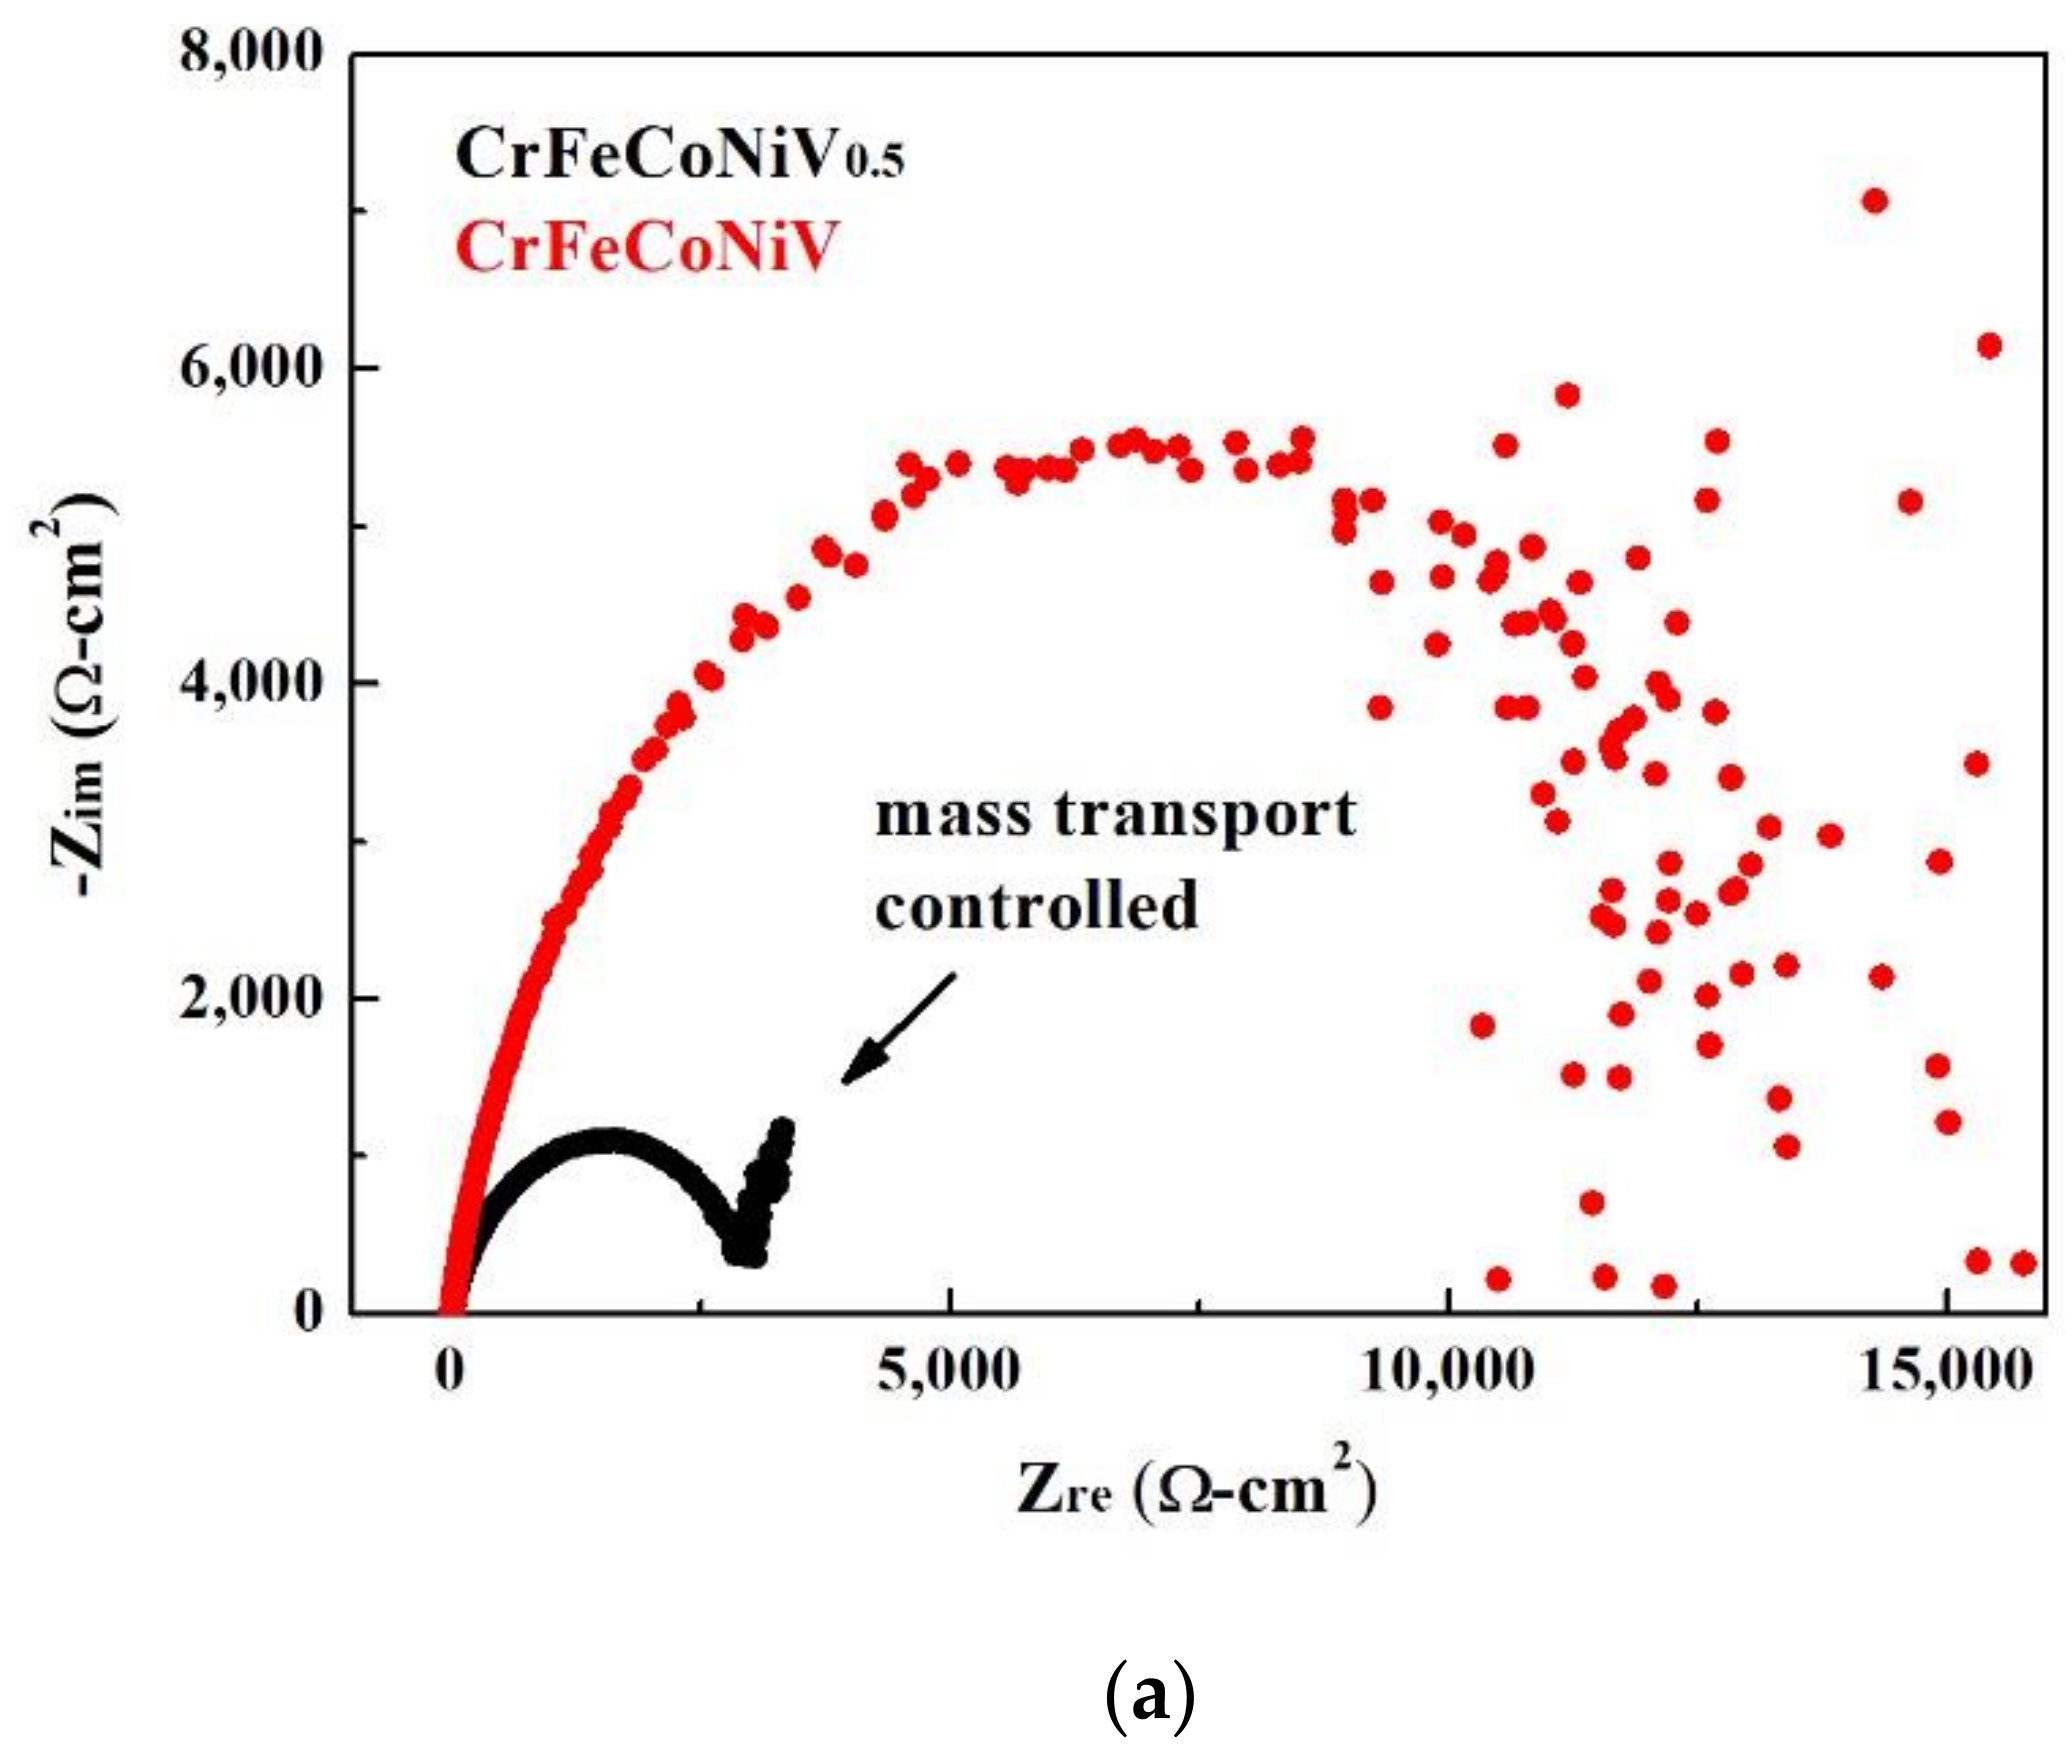
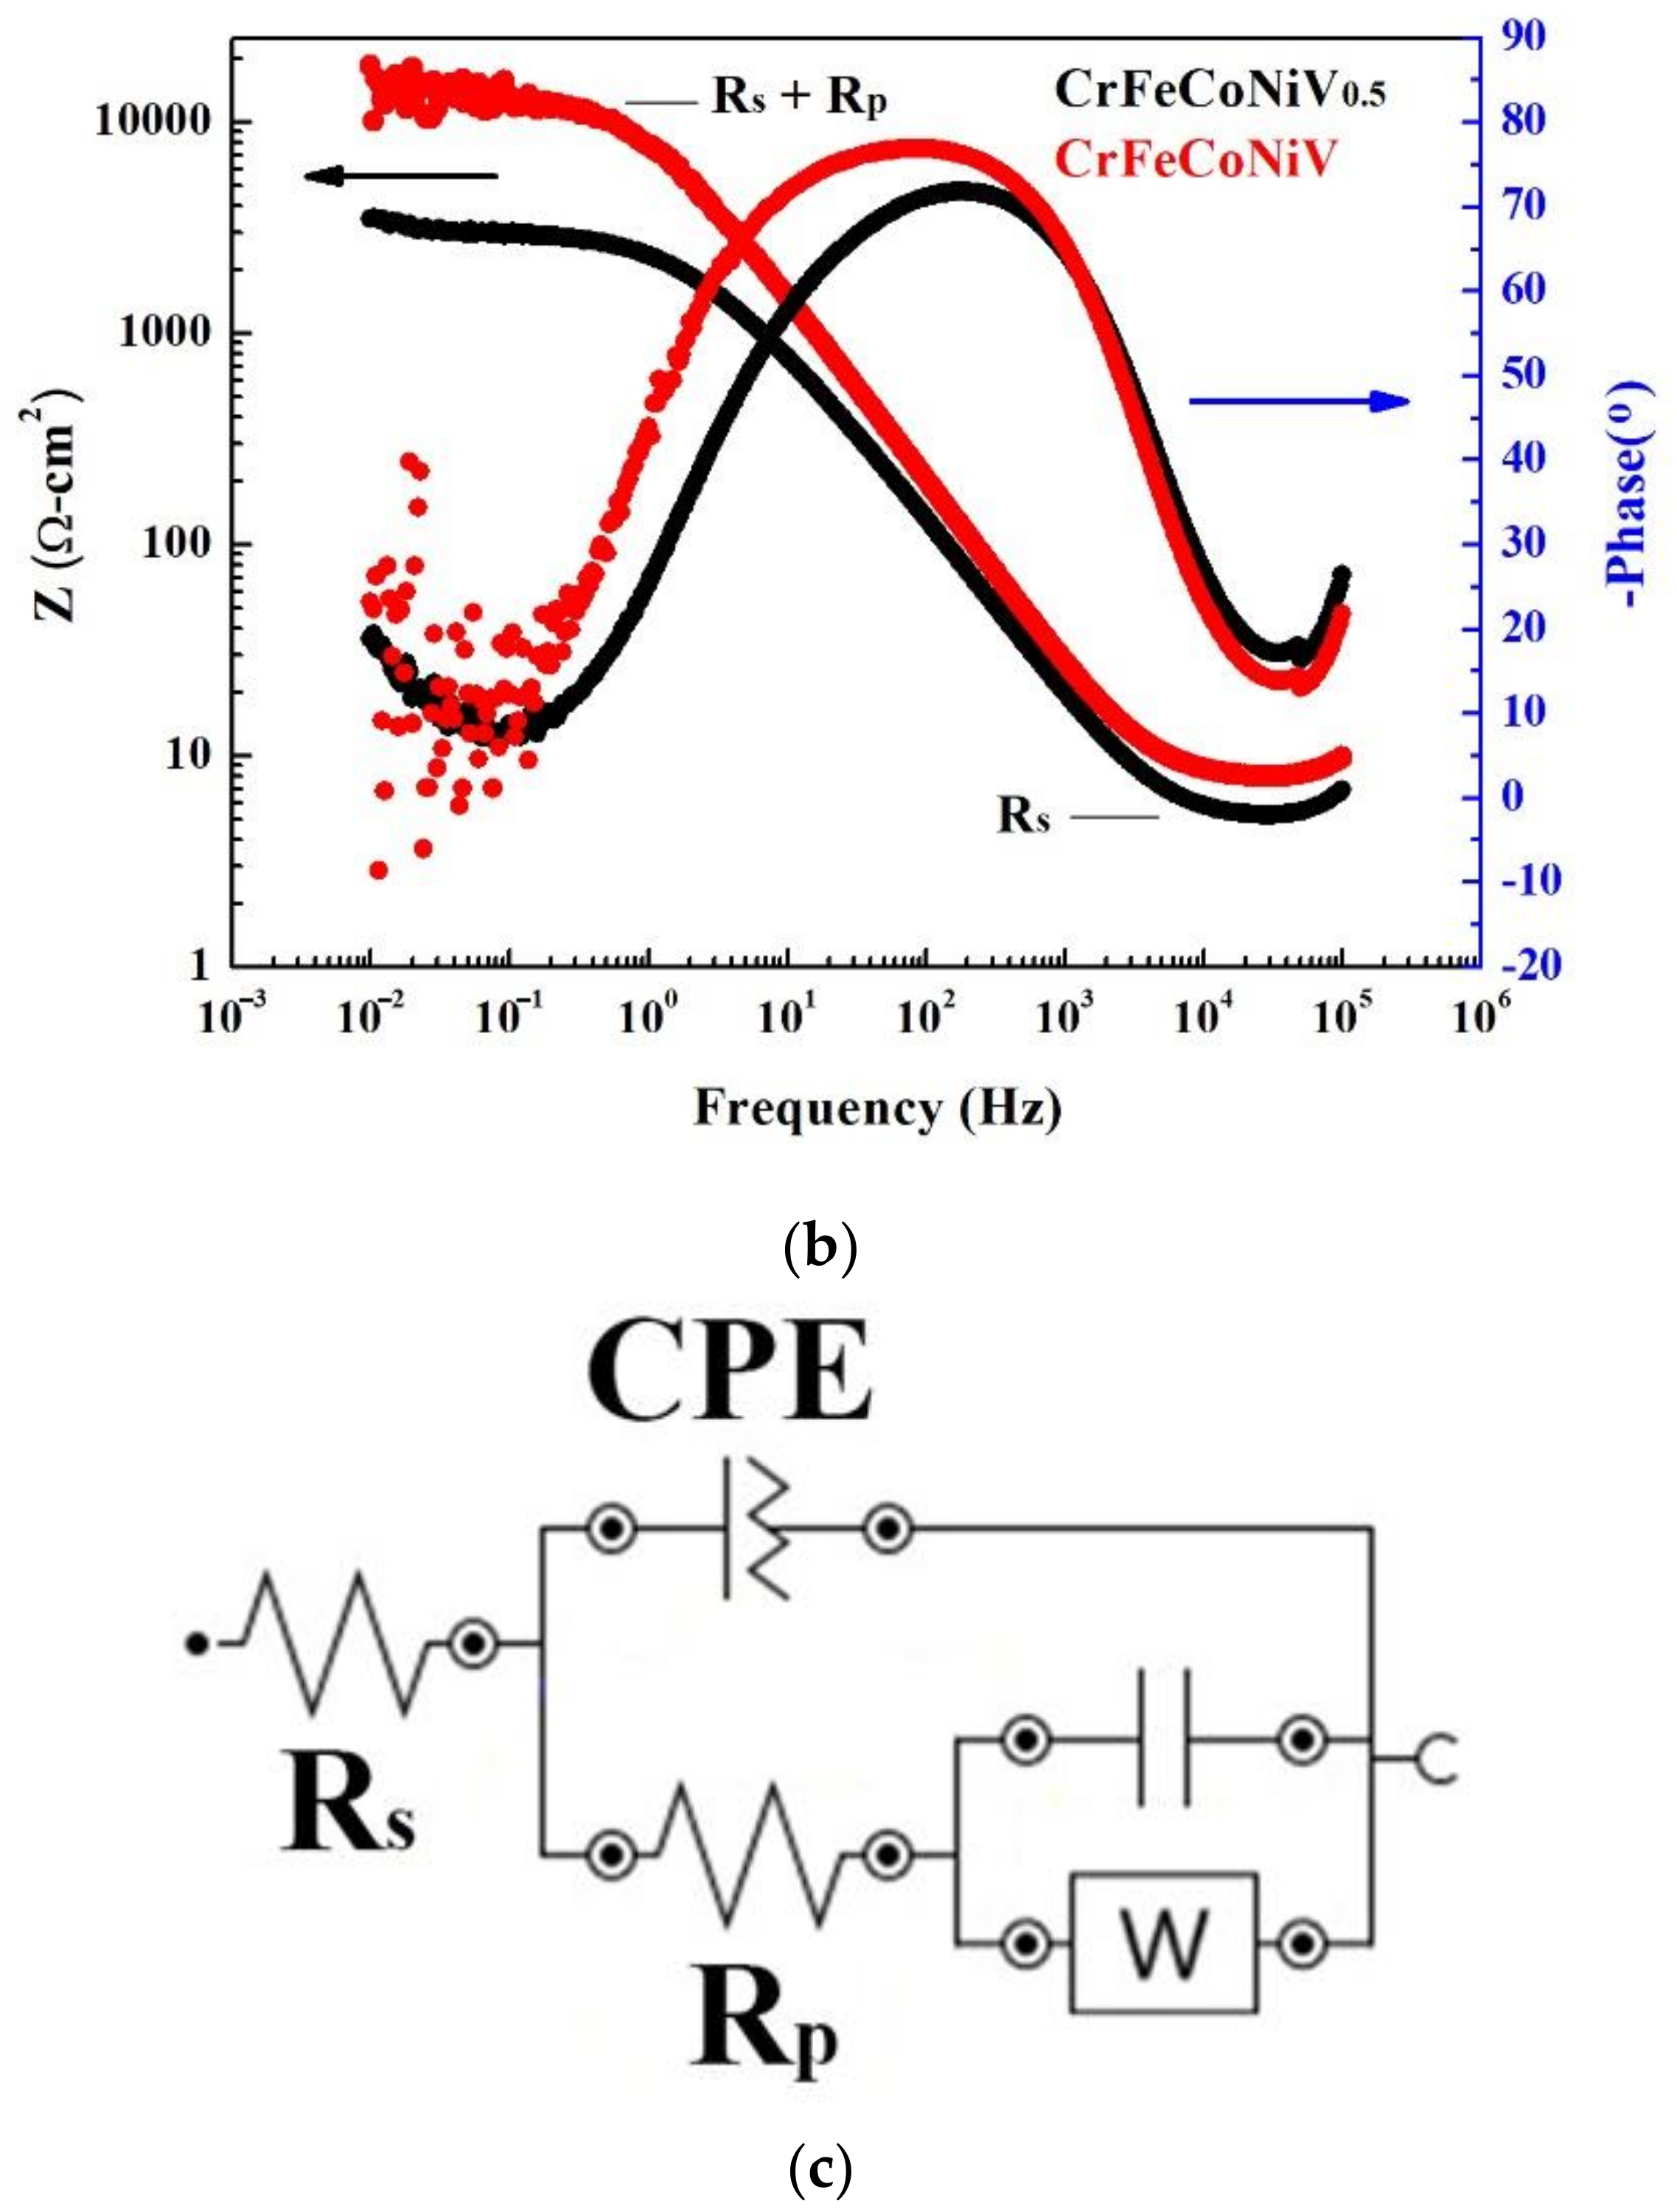
| Rs (Ω) | 4.65 | 7.52 |
| Rp (kΩ) | 2.91 | 13.1 |
| Alloys | 1M H2SO4 (mm/yr) | 1M HCl (mm/yr) | ||
|---|---|---|---|---|
| 30 °C | 60 °C | 30 °C | 60 °C | |
| CrFeCoNiV0.5 | 0.260 | 0.618 | 0.090 | 0.179 |
| CrFeCoNiV | 0.257 | 0.854 | 0.166 | 0.249 |
Publisher’s Note: MDPI stays neutral with regard to jurisdictional claims in published maps and institutional affiliations. |
© 2022 by the authors. Licensee MDPI, Basel, Switzerland. This article is an open access article distributed under the terms and conditions of the Creative Commons Attribution (CC BY) license (https://creativecommons.org/licenses/by/4.0/).
Share and Cite
Tsau, C.-H.; Chen, J.-Y.; Chien, T.-Y. Corrosion Behavior of CrFeCoNiVx (x = 0.5 and 1) High-Entropy Alloys in 1M Sulfuric Acid and 1M Hydrochloric Acid Solutions. Materials 2022, 15, 3639. https://doi.org/10.3390/ma15103639
Tsau C-H, Chen J-Y, Chien T-Y. Corrosion Behavior of CrFeCoNiVx (x = 0.5 and 1) High-Entropy Alloys in 1M Sulfuric Acid and 1M Hydrochloric Acid Solutions. Materials. 2022; 15(10):3639. https://doi.org/10.3390/ma15103639
Chicago/Turabian StyleTsau, Chun-Huei, Jo-Yi Chen, and Tien-Yu Chien. 2022. "Corrosion Behavior of CrFeCoNiVx (x = 0.5 and 1) High-Entropy Alloys in 1M Sulfuric Acid and 1M Hydrochloric Acid Solutions" Materials 15, no. 10: 3639. https://doi.org/10.3390/ma15103639
APA StyleTsau, C.-H., Chen, J.-Y., & Chien, T.-Y. (2022). Corrosion Behavior of CrFeCoNiVx (x = 0.5 and 1) High-Entropy Alloys in 1M Sulfuric Acid and 1M Hydrochloric Acid Solutions. Materials, 15(10), 3639. https://doi.org/10.3390/ma15103639