
Influence of Beam Figure on Porosity of Electron Beam Welded Thin-Walled Aluminum Plates


Abstract
:1. Introduction
2. Materials and Methods
2.1. Material
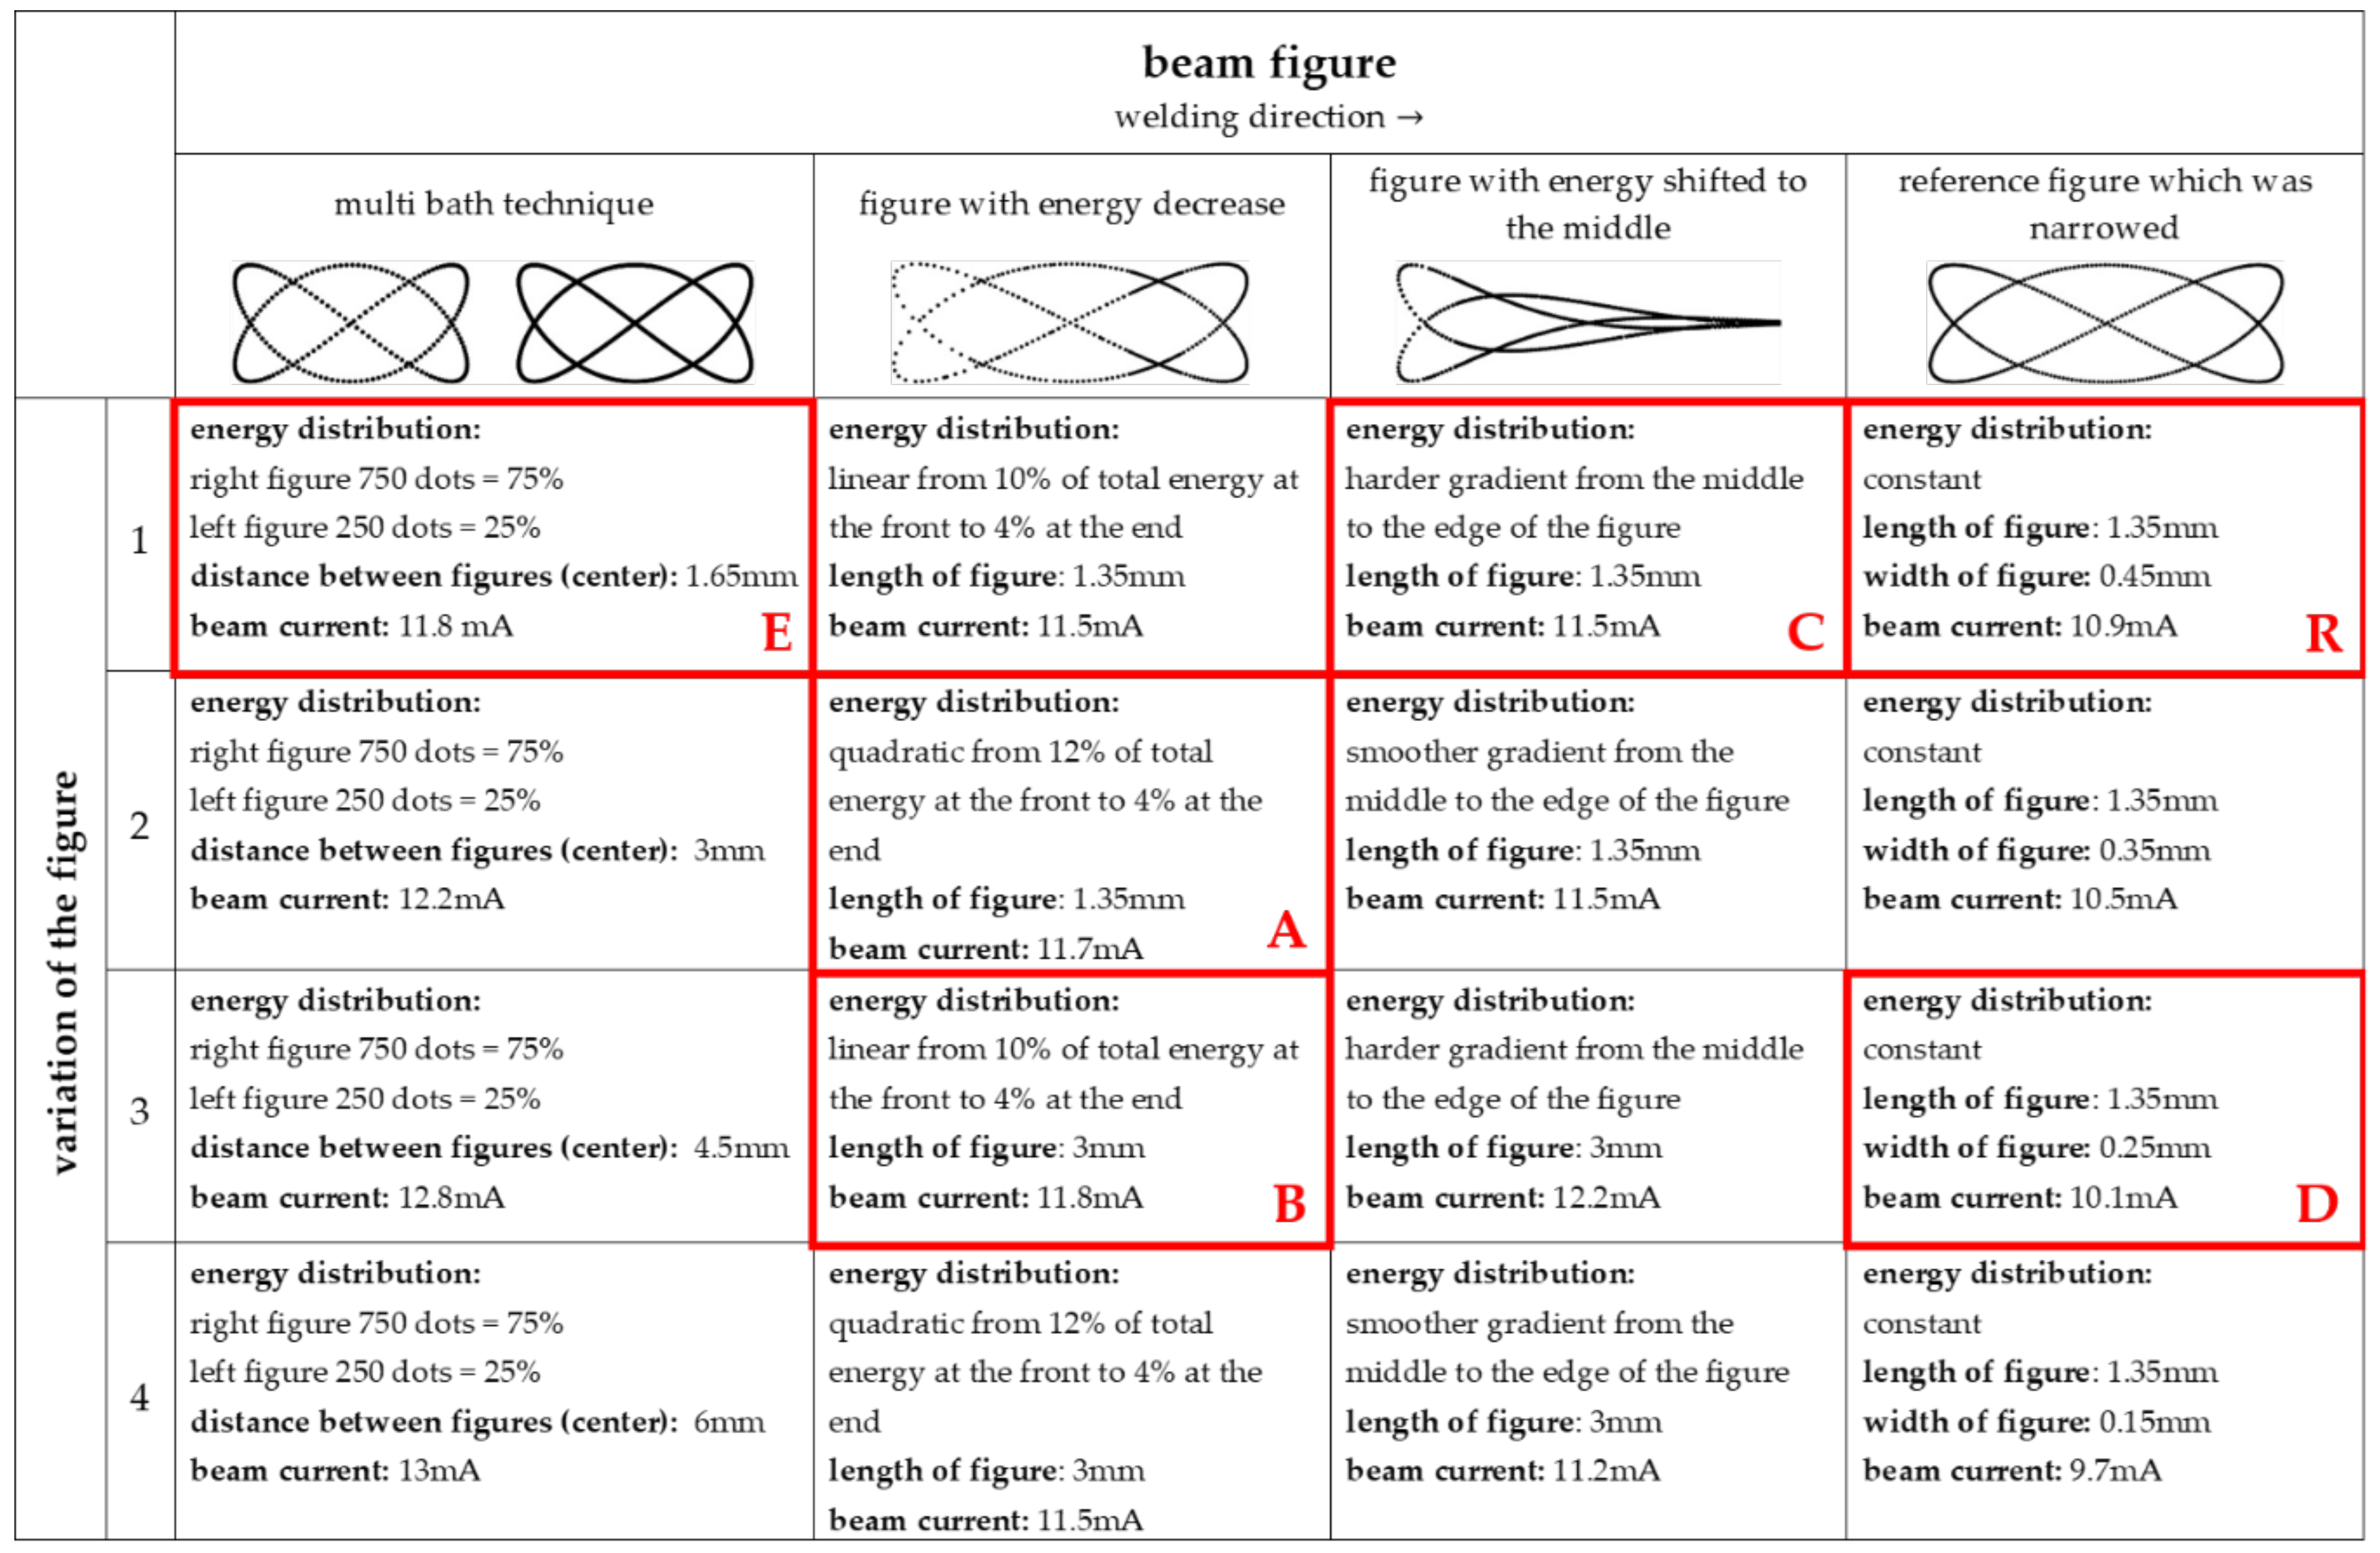
2.2. Welding Process and Beam Figures
- The series A and B were derived from the same basic figure which has an energy reduction from the front to the back, which was either linear or quadratic. In addition to the energy distribution, the length of the figure was also changed. Thus, A and B represent two figure configurations with different lengths and energy distributions as shown in Table 2.
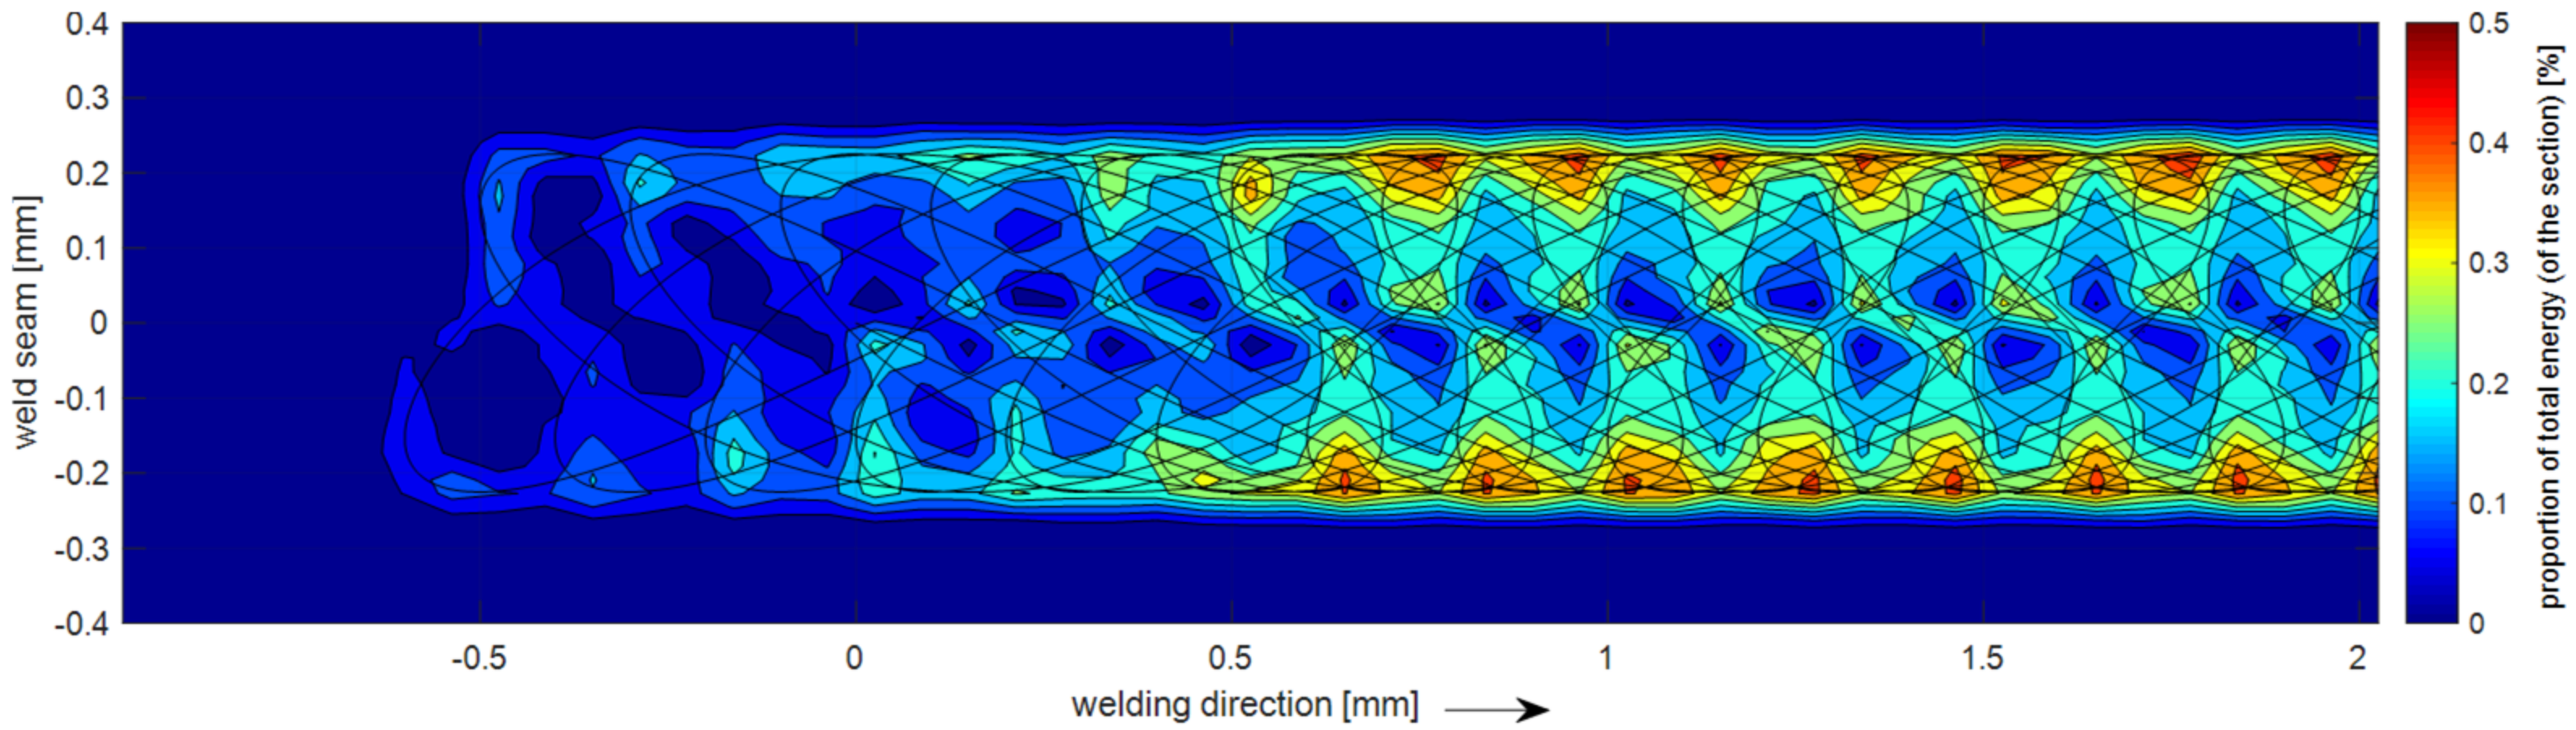
- For the basic figure of the series C, the energy was shifted to the weld centerline, since the analysis of the energy distribution of the reference figure R showed that most of the energy accumulated on the figure edge (see Figure 2). The figure was varied in length and the gradient of the energy distribution, the series C configuration was finally chosen for this figure type.
- Series D was developed based on the reference figure R with constant energy distribution. However, the width was decreased to make the weld narrower and thus give the pores less space to form. The selected figure width for series D was 0.25 mm (see Figure 2).
- The basis for the series E was a multi-bead technique as known from the literature [17]. Here, two figures were applied sequentially, the first figure ensuring the full penetration welding; the second figure is a post-heating of the molten pool. The distance between the individual figures (center to center) of 1.65 mm was used, which leads to a total length of 3 mm (front of the right figure to back of the left figure).
2.3. Investigations
3. Results
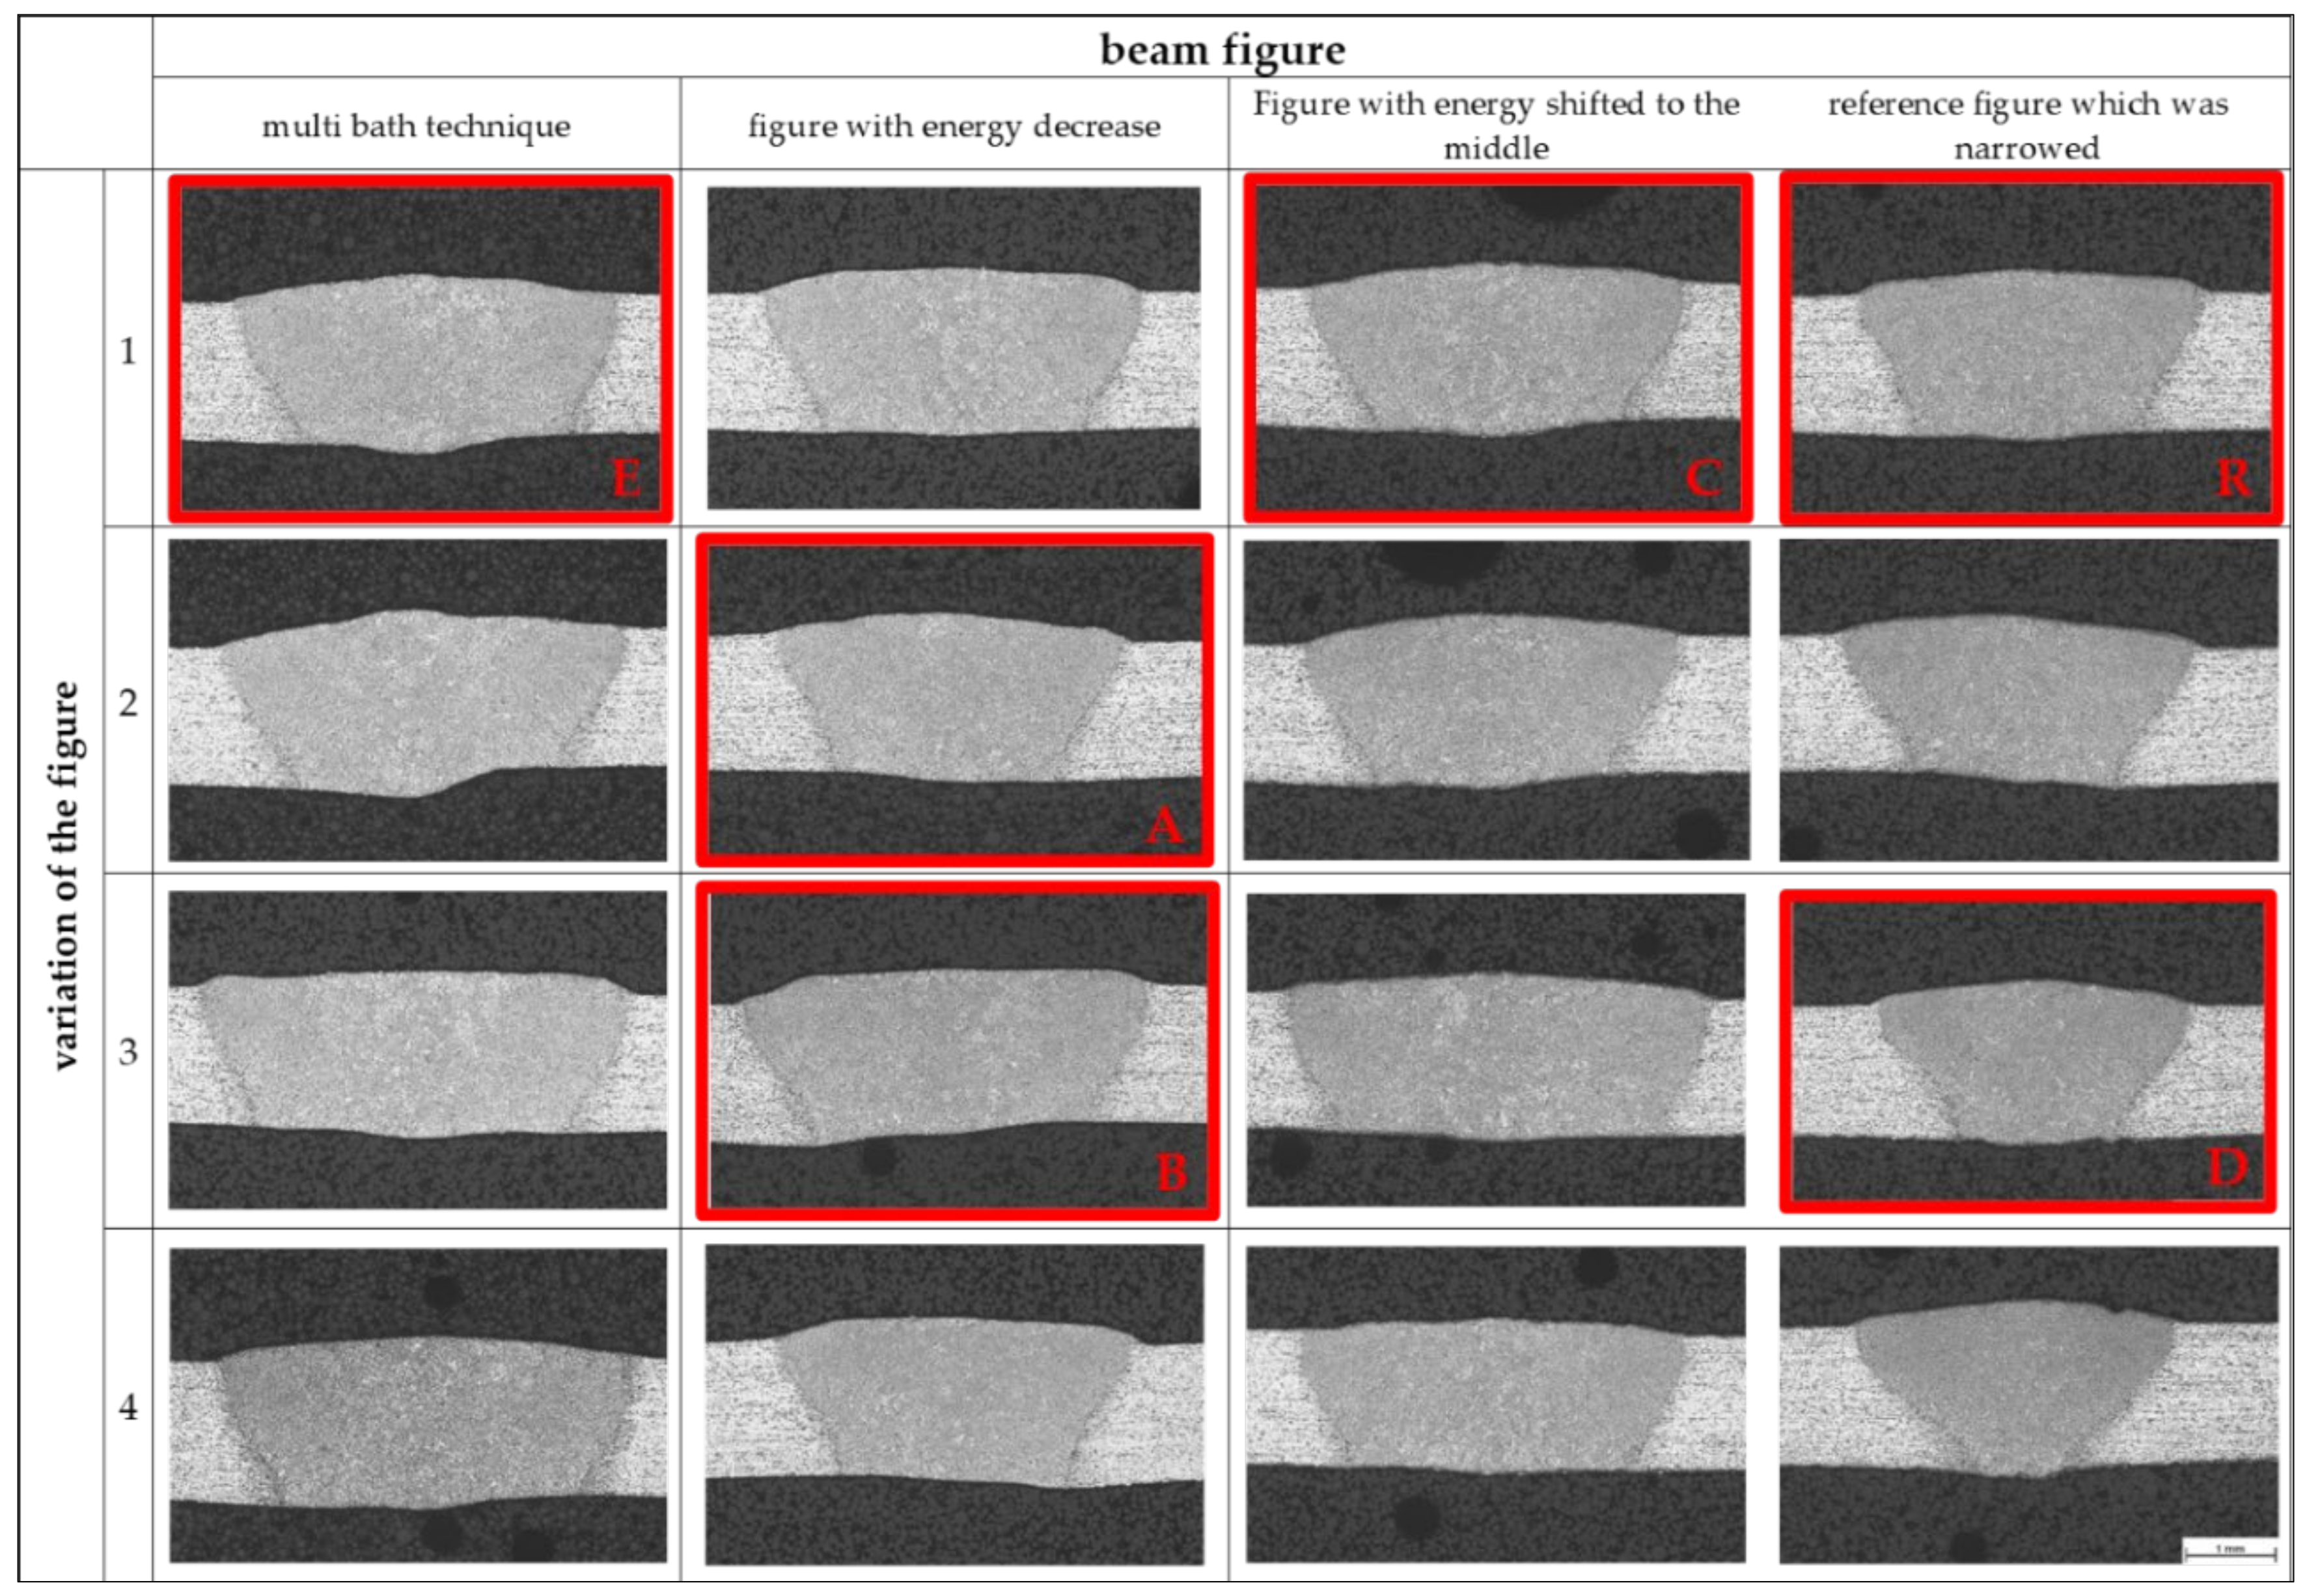
3.1. Metallography
3.2. Porosity
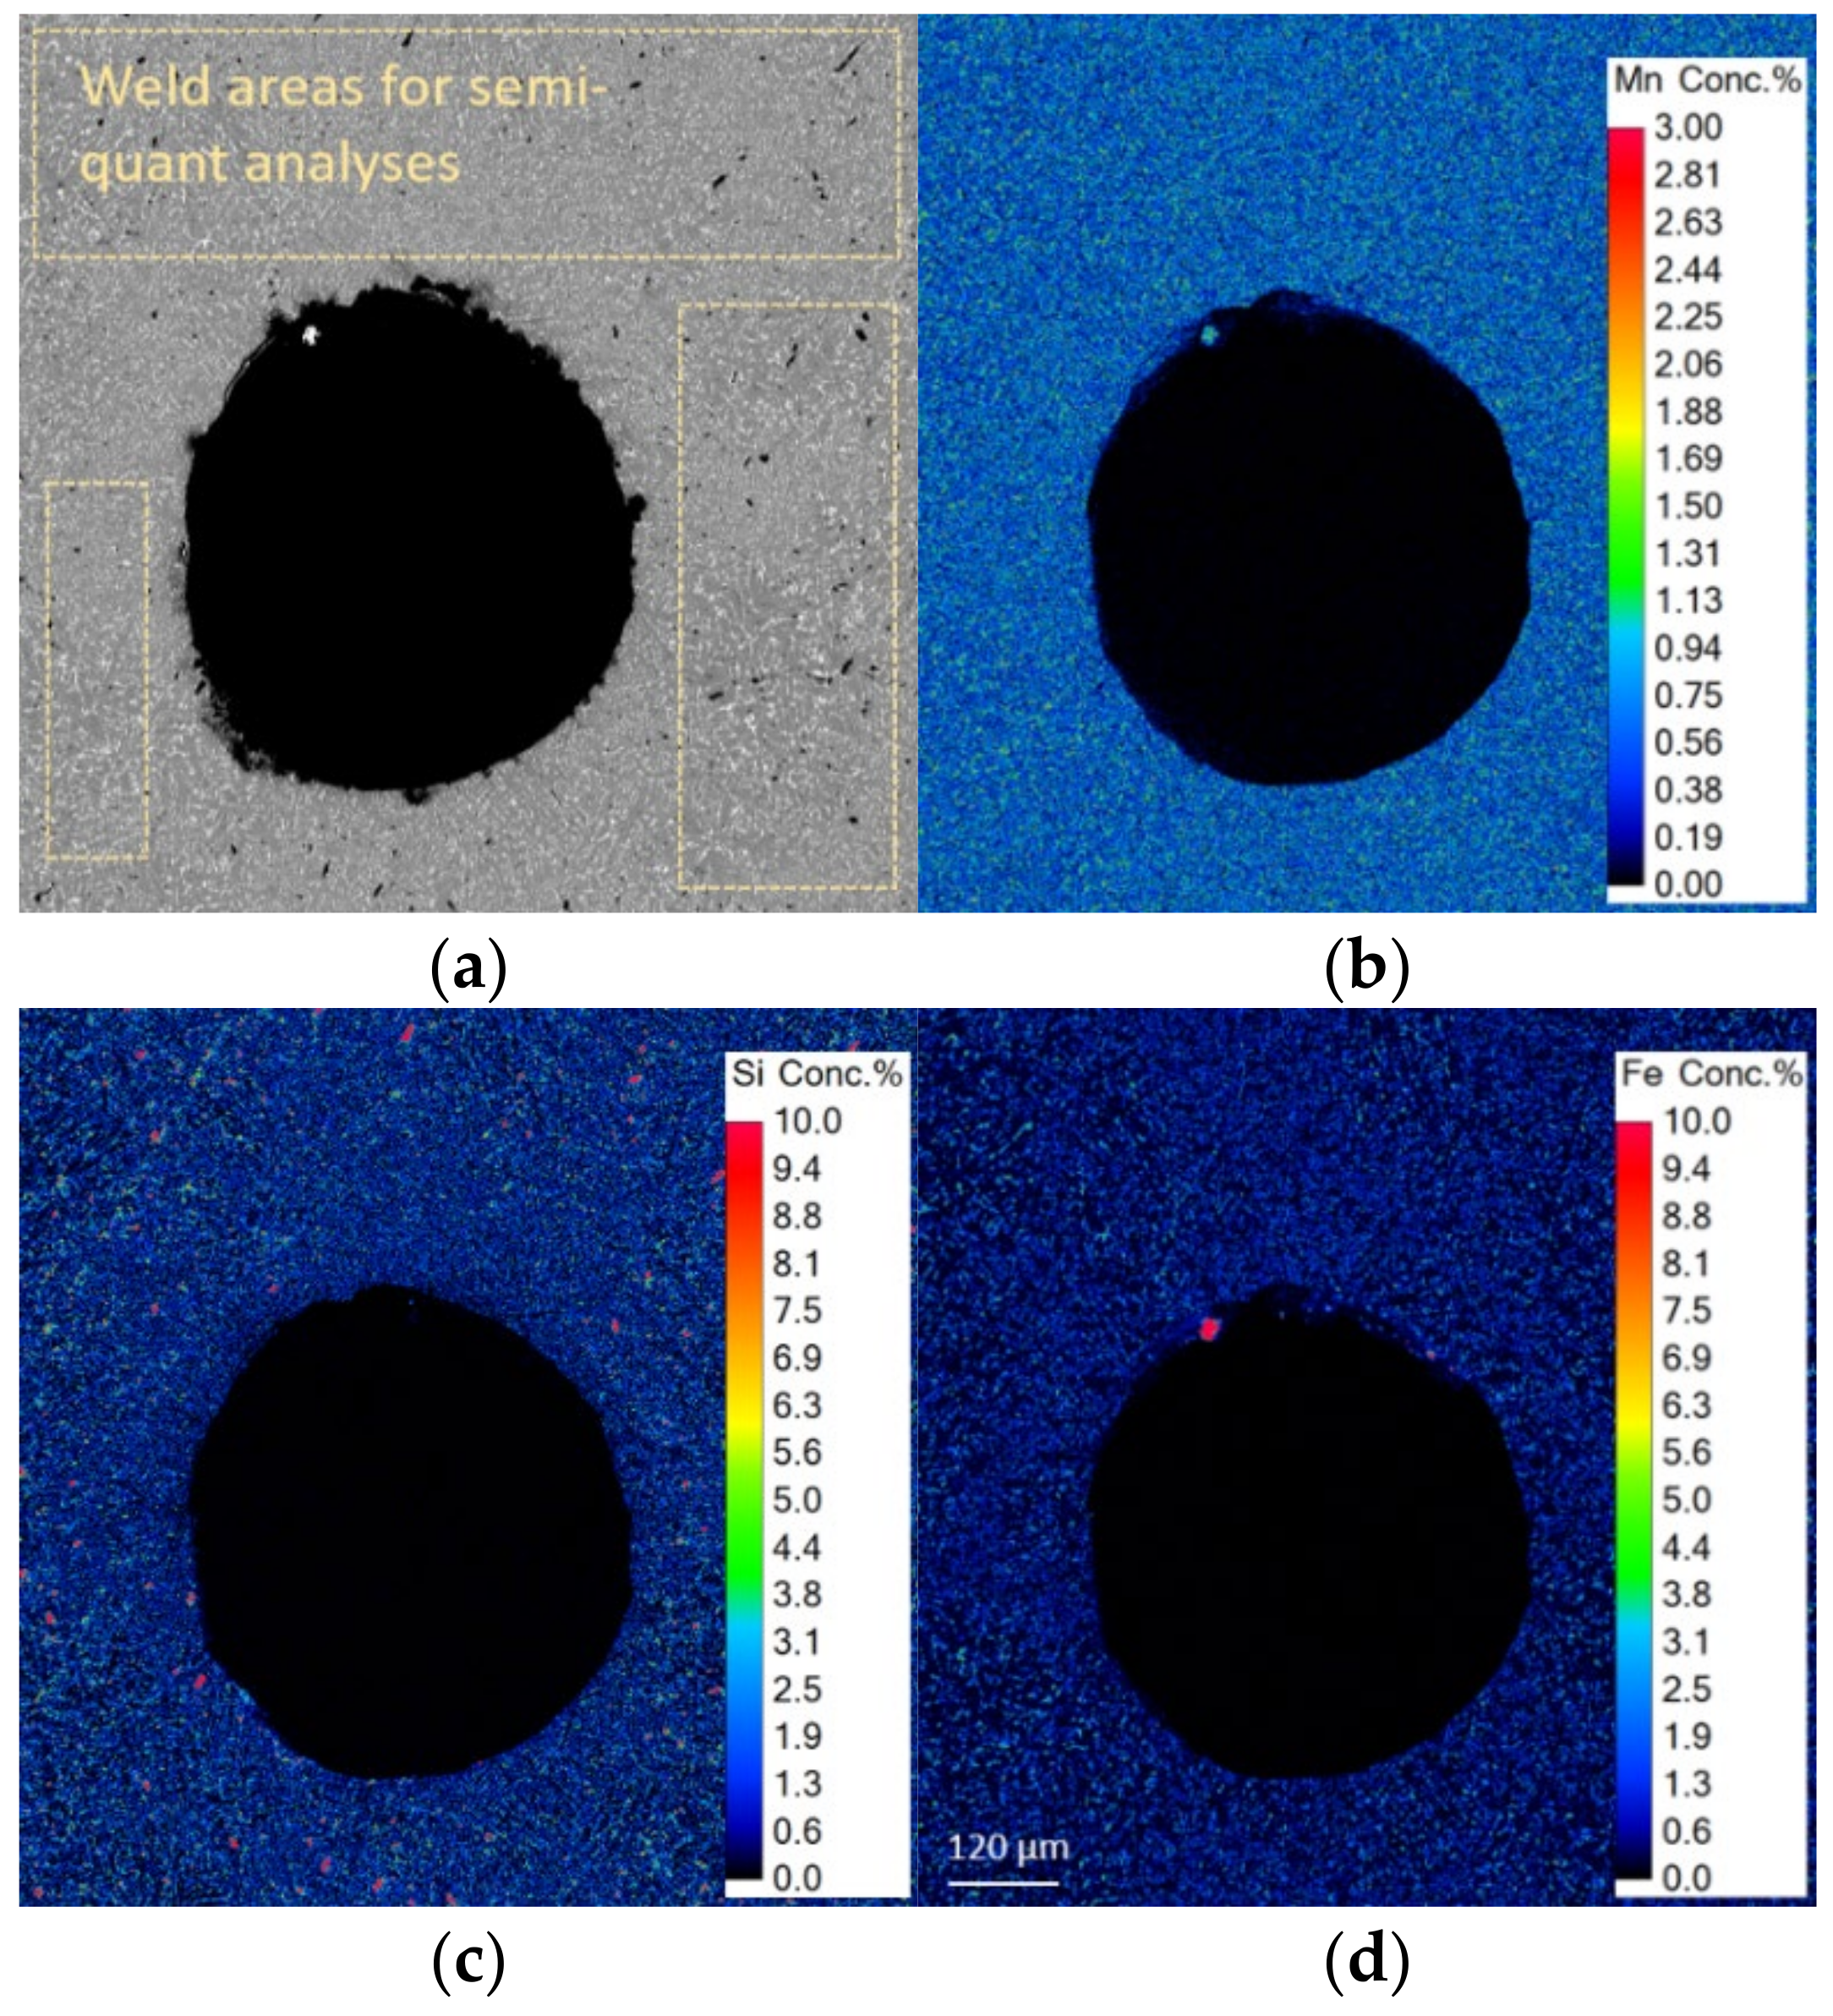
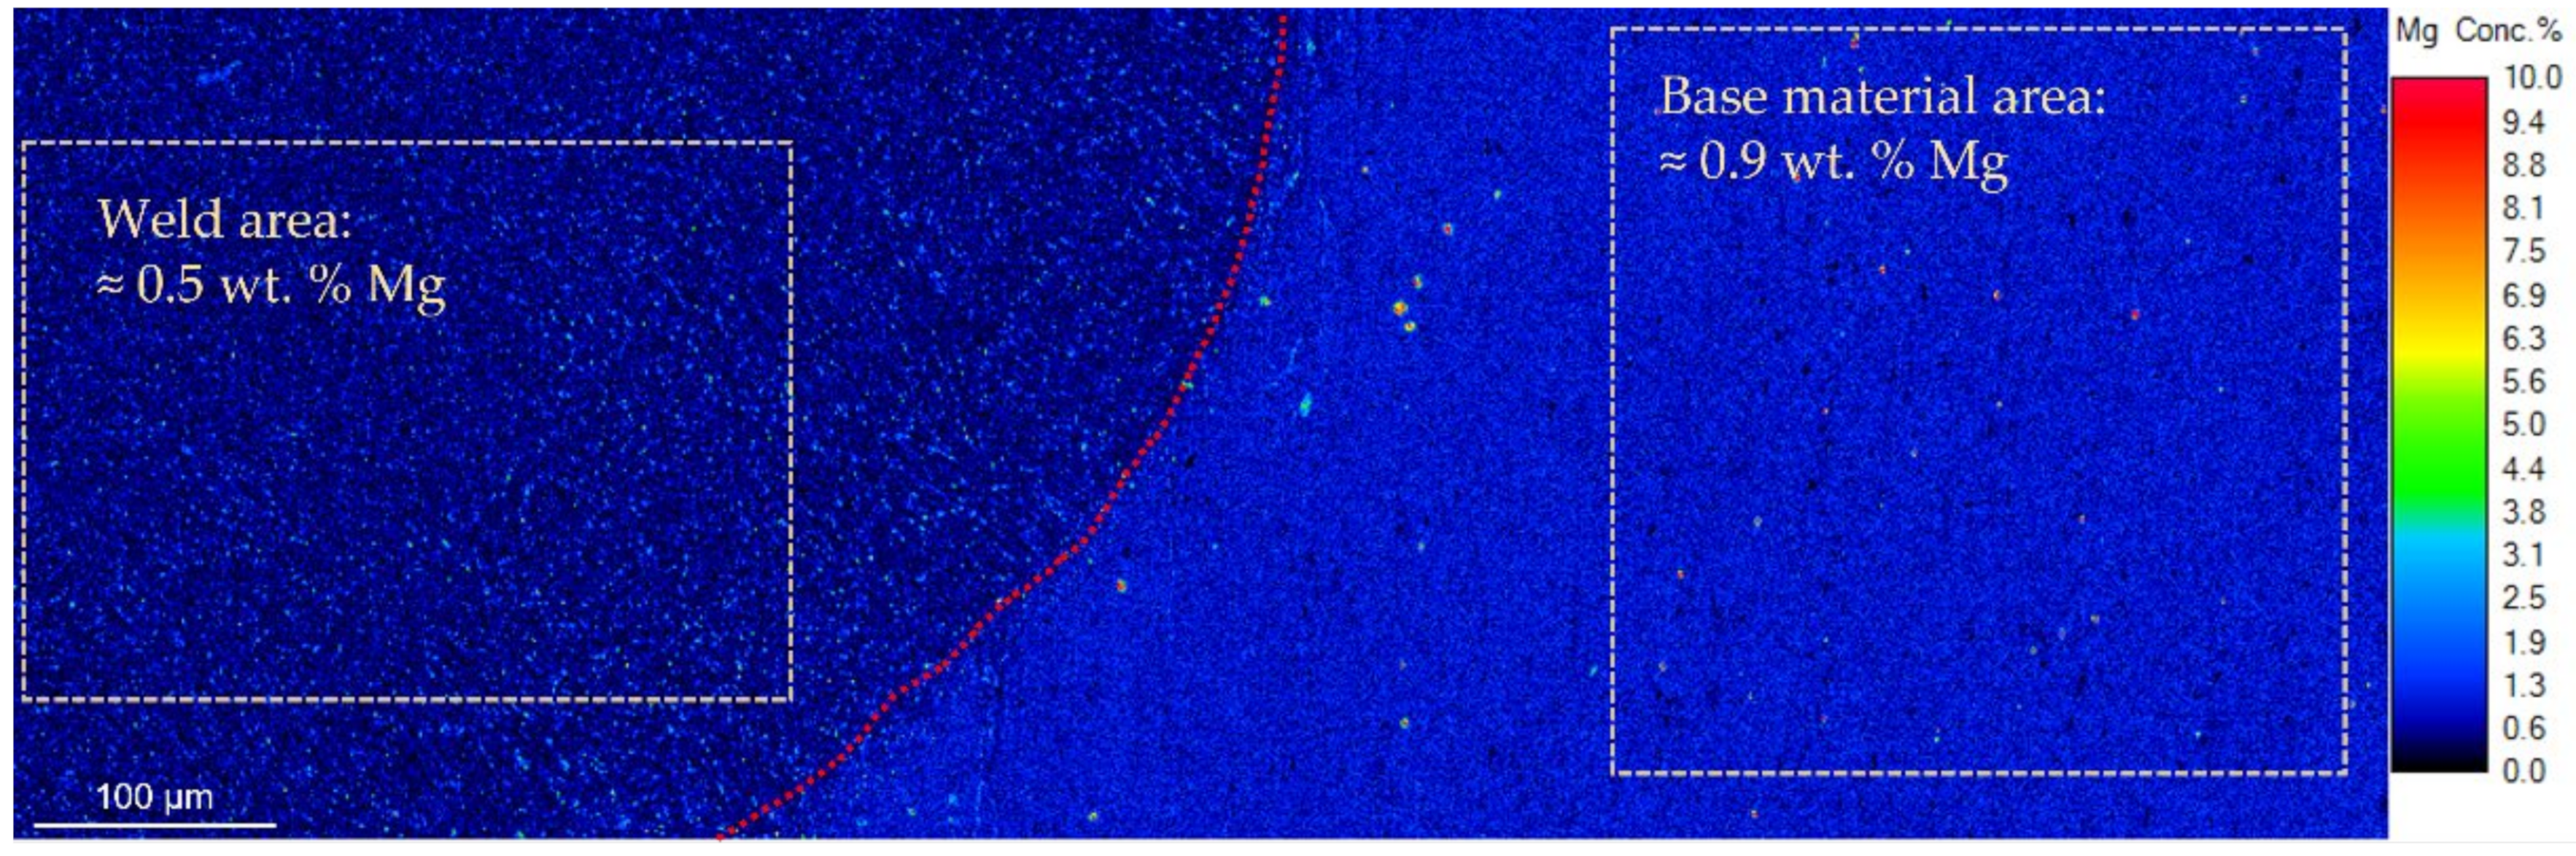
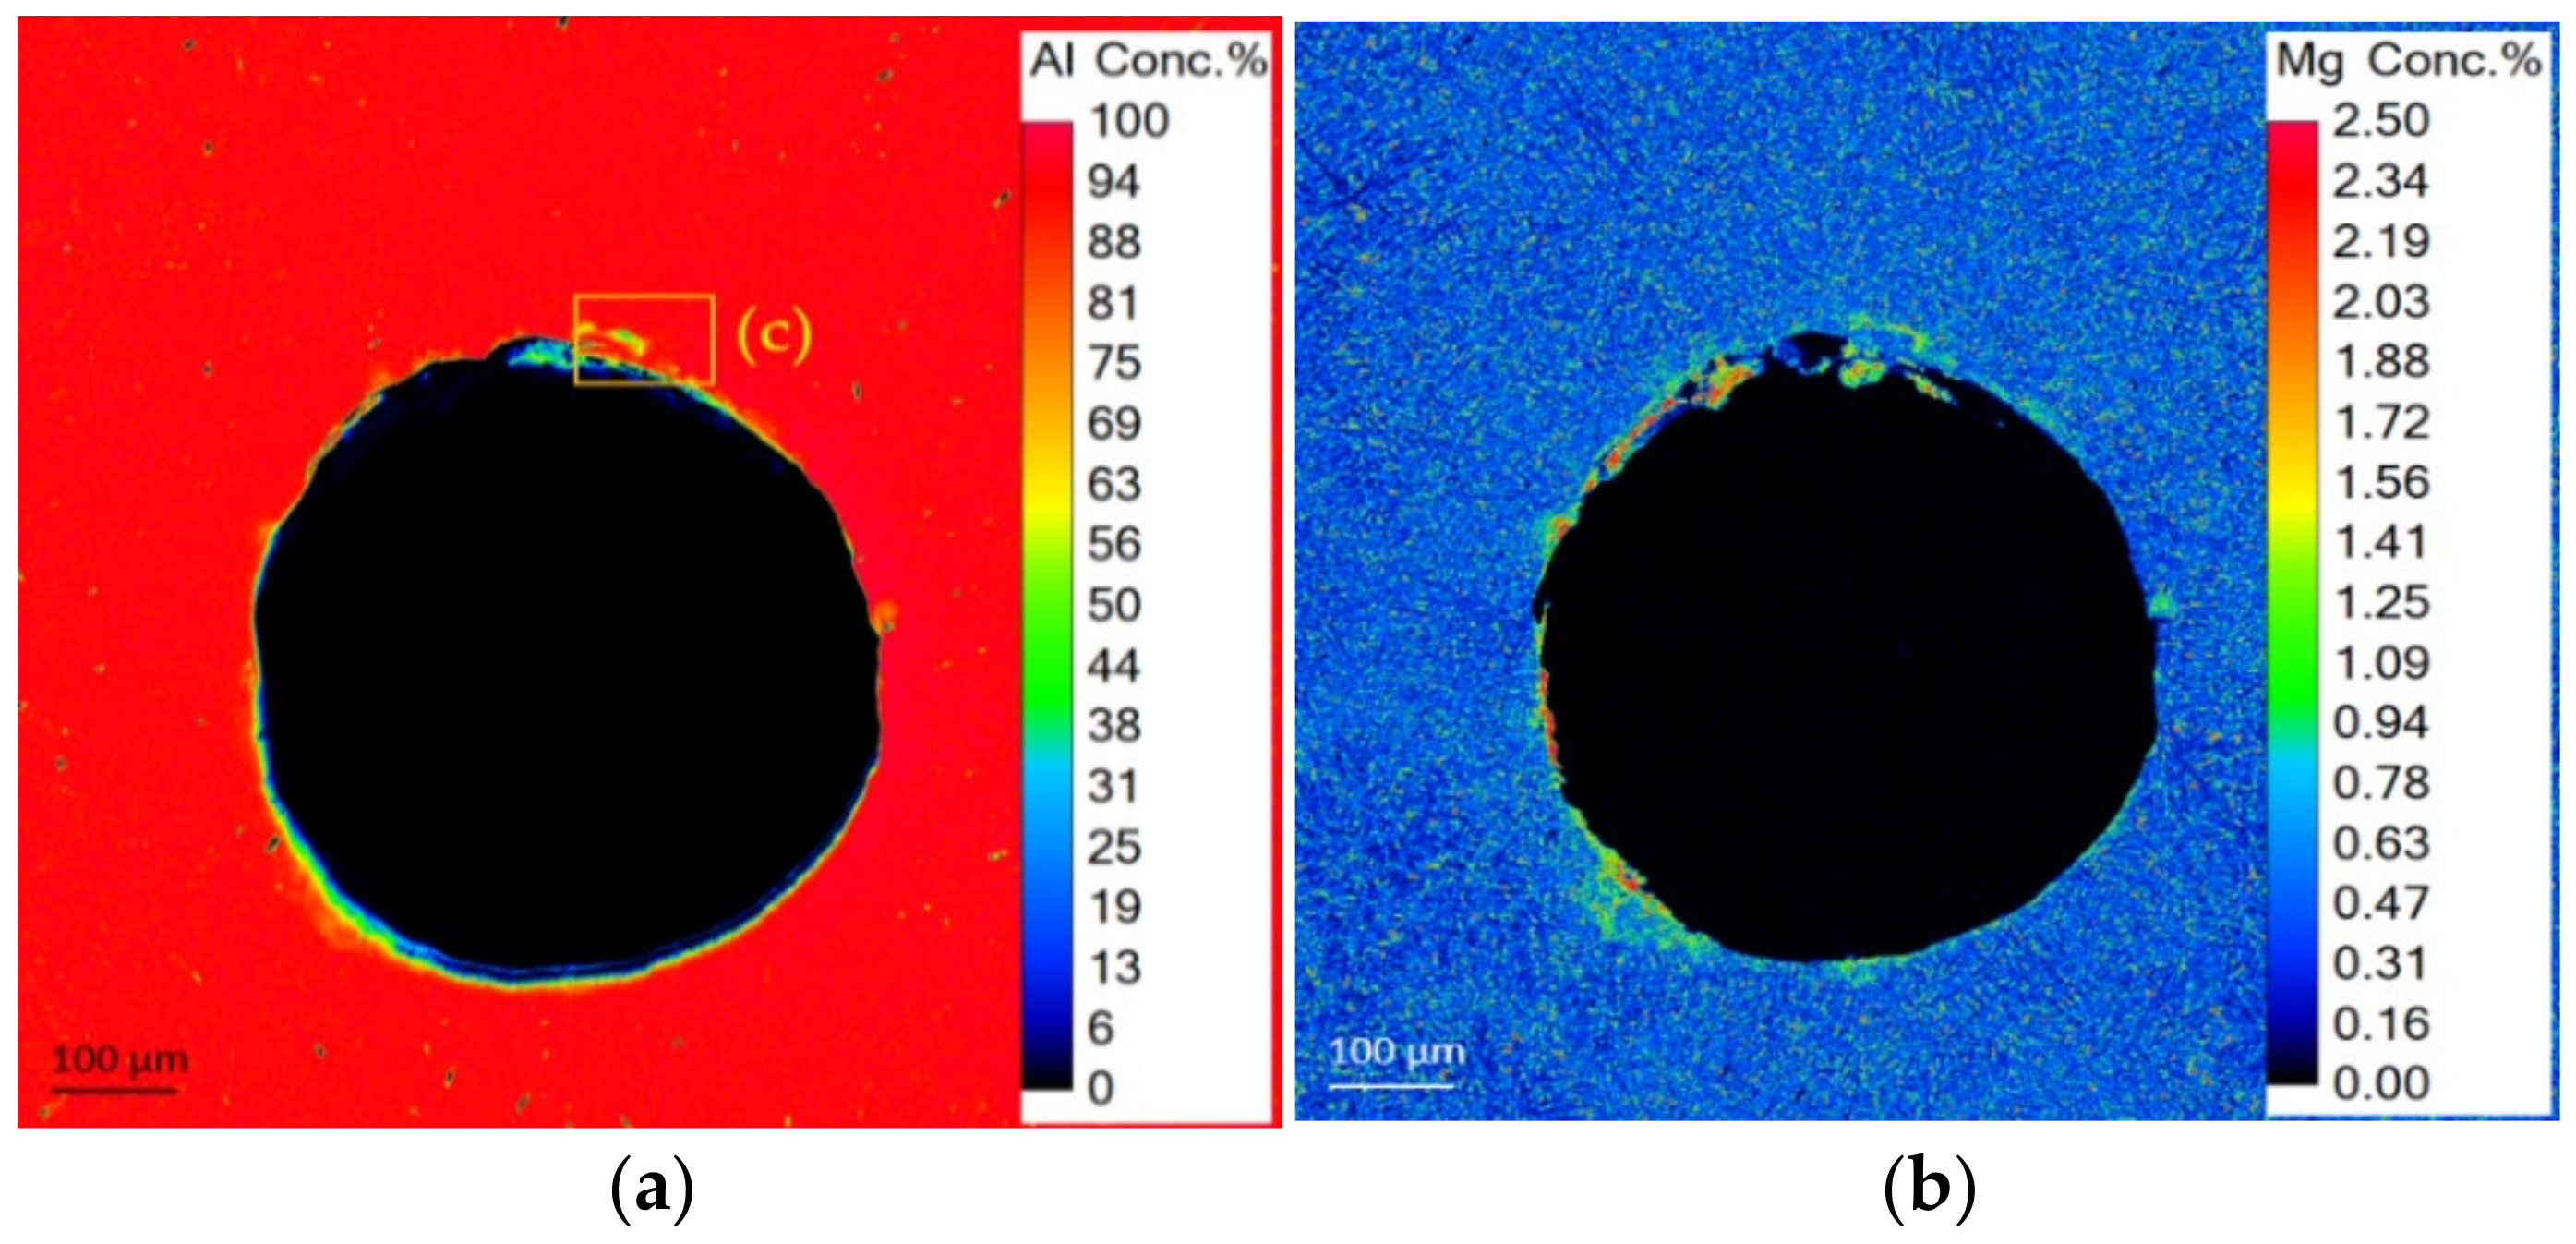
3.3. Chemical Composition and Microstructure Revealed by EPMA
4. Discussion
5. Conclusions
- The beam figure and consequently the energy input influences the porosity, but the direct relationship between beam deflection and pore formation is still unclear.
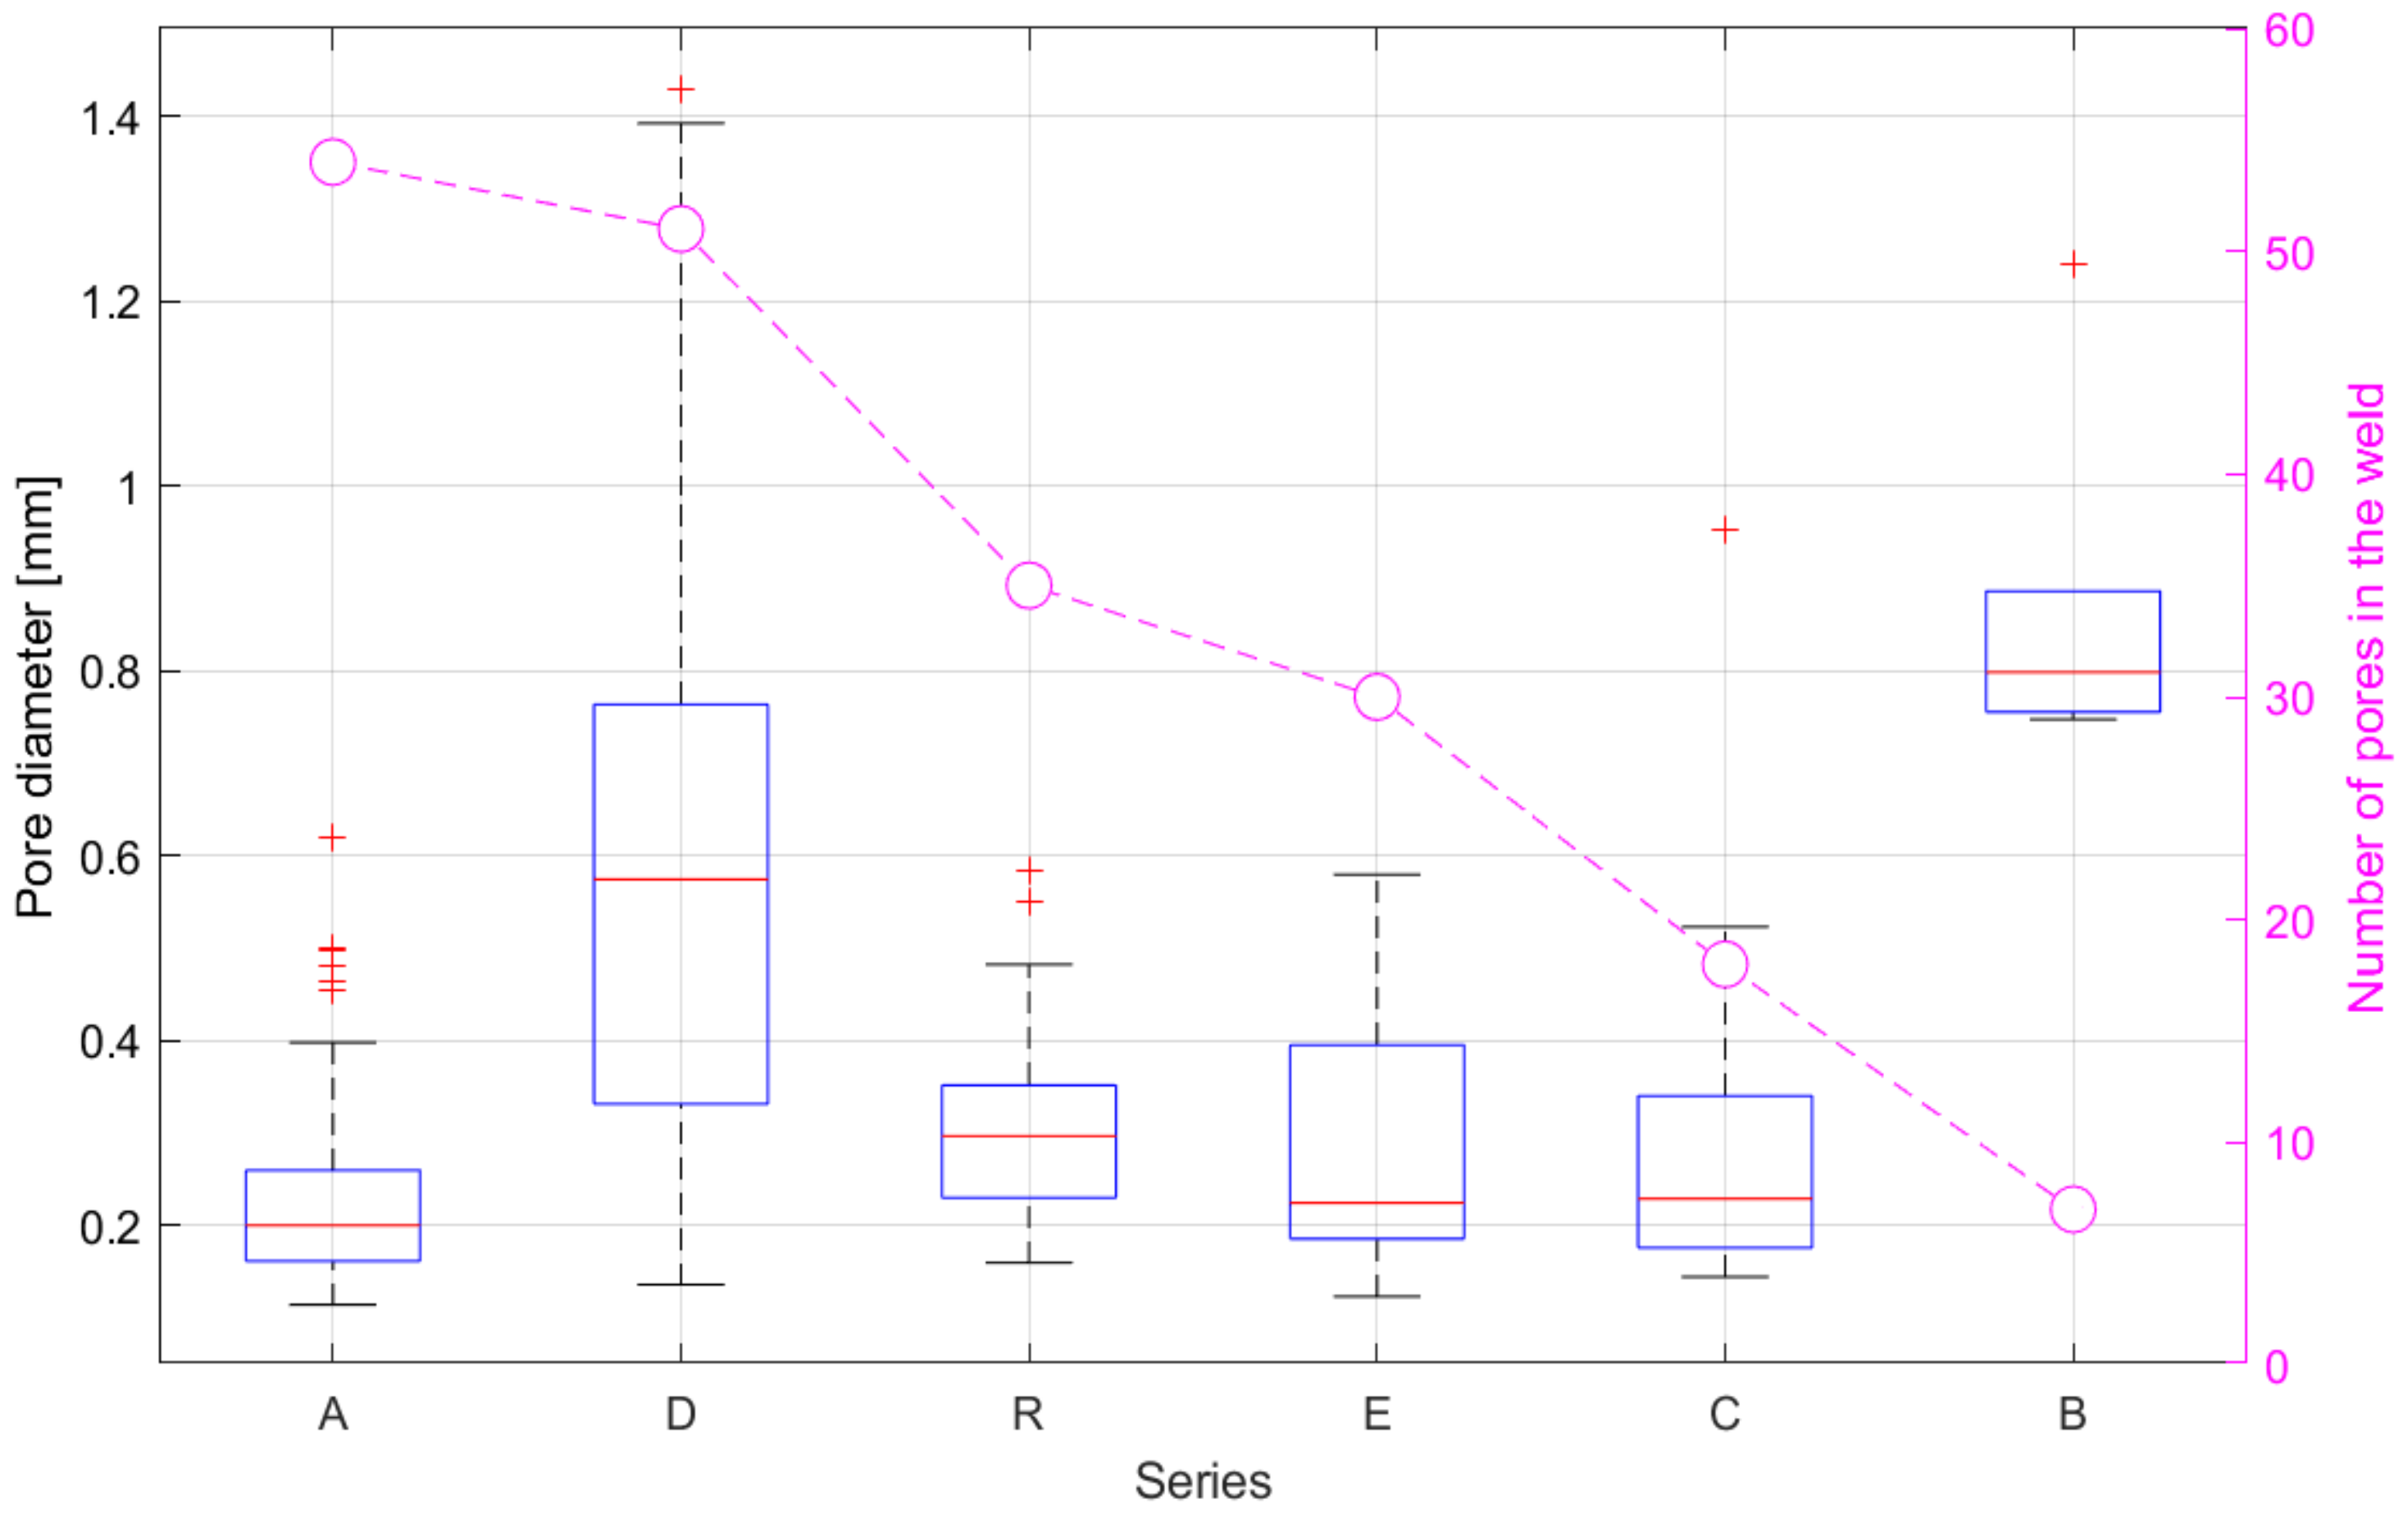
- It was possible to reproducibly avoid (Series B) and create (Series D) pores.
- The pore size will also be influenced by the beam figure. However, a direct correlation between pore number and pore size could not be established.
- Outgassing of the alloying elements magnesium and zinc were identified as the main pore formation mechanism.
- Considering that magnesium and other elements will never completely outgas from the material, pore-free welding in a high vacuum is improbable.
Author Contributions
Funding
Institutional Review Board Statement
Informed Consent Statement
Data Availability Statement
Acknowledgments
Conflicts of Interest
Appendix A

| Single Spot Analysis | Al | Si | Mg | Fe | Mn | Cr | Cu | Zn | Total |
|---|---|---|---|---|---|---|---|---|---|
| [wt.%] | [wt.%] | [wt.%] | [wt.%] | [wt.%] | [wt.%] | [wt.%] | [wt.%] | [wt.%] | |
| Base material 01 | 96.74 | 0.86 | 0.84 | 0.06 | 0.49 | 0.12 | 0.08 | 0.14 | 99.32 |
| Base material 02 | 94.47 | 1.53 | 0.78 | 1.35 | 1.19 | 0.19 | 0.12 | 0.14 | 99.77 |
| Base material 03 | 97.16 | 0.87 | 0.84 | 0.16 | 0.45 | 0.08 | 0.12 | 0.13 | 99.82 |
| Base material 04 | 95.56 | 1.16 | 0.81 | 0.67 | 0.92 | 0.20 | 0.07 | 0.15 | 99.55 |
| Base material 05 | 97.44 | 0.68 | 0.83 | bld. | 0.27 | 0.07 | 0.08 | 0.10 | 99.47 |
| Base material 06 | 96.47 | 1.01 | 0.85 | 0.38 | 0.56 | 0.10 | 0.10 | 0.11 | 99.58 |
| Base material 07 | 97.02 | 0.84 | 0.84 | 0.11 | 0.49 | 0.11 | 0.09 | 0.11 | 99.61 |
| Base material 08 | 97.23 | 0.76 | 0.83 | 0.05 | 0.44 | 0.16 | 0.07 | 0.15 | 99.69 |
| Base material 09 | 94.57 | 1.85 | 1.50 | 0.99 | 0.96 | 0.18 | 0.12 | 0.13 | 100.30 |
| Base material 10 | 97.02 | 0.82 | 0.81 | 0.09 | 0.49 | 0.12 | 0.10 | 0.10 | 99.55 |
| Base material 11 | 96.80 | 0.96 | 0.82 | 0.11 | 0.53 | 0.14 | 0.14 | 0.12 | 99.62 |
| Base material 12 | 94.62 | 1.43 | 0.80 | 0.90 | 0.81 | 0.11 | 0.10 | 0.16 | 98.93 |
| Base material 13 | 96.83 | 0.96 | 0.79 | 0.16 | 0.47 | 0.12 | 0.14 | 0.11 | 99.60 |
| Base material 14 | 96.99 | 0.86 | 0.81 | 0.13 | 0.44 | 0.10 | 0.09 | 0.14 | 99.56 |
| Base material 15 | 95.74 | 1.04 | 0.80 | 0.48 | 0.69 | 0.14 | 0.06 | 0.13 | 99.08 |
| Base material 16 | 95.06 | 1.31 | 0.79 | 1.16 | 1.01 | 0.17 | 0.11 | 0.15 | 99.76 |
| Base material 17 | 96.69 | 0.91 | 0.80 | 0.19 | 0.48 | 0.10 | 0.10 | 0.10 | 99.39 |
| Base material 18 | 95.31 | 1.16 | 0.80 | 0.64 | 0.80 | 0.16 | 0.08 | 0.13 | 99.08 |
| Weld 01 | 96.02 | 1.01 | 0.44 | 0.58 | 0.73 | 0.15 | 0.12 | bld. | 99.12 |
| Weld 02 | 96.08 | 1.28 | 0.56 | 0.50 | 0.71 | 0.13 | 0.12 | 0.09 | 99.47 |
| Weld 03 | 96.45 | 1.03 | 0.48 | 0.49 | 0.73 | 0.13 | 0.08 | bld. | 99.43 |
| Weld 04 | 96.29 | 1.07 | 0.47 | 0.43 | 0.66 | 0.13 | 0.11 | bld. | 99.22 |
| Weld 05 | 96.51 | 1.10 | 0.49 | 0.36 | 0.62 | 0.13 | 0.11 | bld. | 99.34 |
| Weld 06 | 96.28 | 1.24 | 0.45 | 0.44 | 0.67 | 0.17 | 0.08 | bld. | 99.39 |
| Weld 07 | 96.30 | 1.22 | 0.51 | 0.39 | 0.63 | 0.13 | 0.15 | 0.09 | 99.42 |
| Weld 08 | 96.43 | 0.95 | 0.45 | 0.55 | 0.71 | 0.13 | 0.11 | bld. | 99.38 |
| Weld 09 | 97.40 | 0.70 | 0.38 | 0.27 | 0.58 | 0.12 | 0.09 | bld. | 99.59 |
| Weld 10 | 96.36 | 1.04 | 0.43 | 0.57 | 0.75 | 0.16 | 0.08 | bld. | 99.46 |
| Weld 11 | 95.68 | 1.44 | 0.48 | 0.57 | 0.74 | 0.17 | 0.12 | bld. | 99.26 |
| Weld 12 | 96.02 | 1.56 | 0.50 | 0.54 | 0.71 | 0.14 | 0.09 | bld. | 99.57 |
| Weld 13 | 96.83 | 1.14 | 0.49 | 0.51 | 0.68 | 0.14 | 0.10 | bld. | 99.92 |
| Weld 14 | 95.46 | 1.53 | 0.46 | 0.69 | 0.76 | 0.14 | 0.11 | bld. | 99.19 |
| Weld 15 | 96.60 | 1.13 | 0.52 | 0.42 | 0.69 | 0.14 | 0.10 | bld. | 99.61 |
| Weld 16 | 96.42 | 1.34 | 0.56 | 0.47 | 0.64 | 0.16 | 0.07 | bld. | 99.71 |
| Weld 17 | 95.76 | 1.43 | 0.52 | 0.54 | 0.67 | 0.15 | 0.11 | bld. | 99.24 |
| Weld 18 | 95.67 | 1.57 | 0.52 | 0.51 | 0.68 | 0.14 | 0.09 | 0.07 | 99.24 |
| Weld 19 | 95.71 | 1.91 | 0.53 | 0.52 | 0.68 | 0.17 | 0.13 | bld. | 99.67 |
| Weld 20 | 95.69 | 1.10 | 0.48 | 0.52 | 0.69 | 0.11 | 0.07 | bld. | 98.73 |
| Weld 21 | 96.04 | 1.07 | 0.44 | 0.52 | 0.68 | 0.14 | 0.13 | 0.08 | 99.10 |
| Weld 22 | 95.34 | 1.60 | 0.49 | 0.45 | 0.68 | 0.16 | 0.10 | bld. | 98.83 |
| Weld 23 | 96.07 | 1.29 | 0.48 | 0.47 | 0.65 | 0.13 | 0.11 | bld. | 99.21 |
| Weld 24 | 96.01 | 1.30 | 0.54 | 0.44 | 0.67 | 0.13 | 0.09 | bld. | 99.25 |
| Weld 25 | 96.34 | 0.99 | 0.39 | 0.27 | 0.59 | 0.15 | 0.06 | bld. | 98.80 |
| Weld 26 | 94.98 | 1.95 | 0.49 | 0.57 | 0.72 | 0.14 | 0.11 | 0.08 | 99.03 |
| Weld 27 | 95.32 | 1.29 | 0.59 | 0.50 | 0.70 | 0.15 | 0.12 | 0.10 | 98.76 |

References
- Aluminium-Zentrale. Merkblatt W7: Wärmebehandlungen von Aluminiumlegierungen; GDA—Gesamtverband der Aluminiumindustrie e.V: Düsseldorf, Germany, 2007. [Google Scholar]
- Barnes, T.A.; Pashby, I.R. Joining techniques for aluminium spaceframes used in automobiles Part I—Solid and liquid phase welding. J. Mater. Process. Technol. 2000, 99, 62–71. [Google Scholar] [CrossRef]
- Rajan, R.; Kah, P.; Mvola, B.; Martikainen, J. Trends in aluminium alloy development and their joining methods. Rev. Adv. Mater. Sci. 2015, 44, 15. [Google Scholar]
- ECSS-Q-ST-70-39C; ESA Requirements and Standards Division. ESA: Paris, France, 2015.
- Ardika, R.D.; Triyono, T.; Muhayat, N. A review porosity in aluminum welding. Procedia Struct. Integr. 2021, 33, 171–180. [Google Scholar] [CrossRef]
- Zhan, X.; Chen, J.; Liu, J.; Wei, Y.; Zhou, J.; Meng, Y. Microstructure and magnesium burning loss behavior of AA6061 electron beam welding joints. Mater. Des. 2016, 99, 449–458. [Google Scholar] [CrossRef]
- Zhou, L.; Zhang, M.; Jin, X.; Zhang, H.; Mao, C. Study on the burning loss of magnesium in fiber laser welding of an Al-Mg alloy by optical emission spectroscopy. Int. J. Adv. Manuf. Technol. 2017, 88, 1373–1381. [Google Scholar] [CrossRef]
- Fujii, H.; Umakoshi, H.; Aoki, Y.; Nogi, K. Bubble formation in aluminium alloy during electron beam welding. J. Mater. Process. Technol. 2004, 155–156, 1252–1255. [Google Scholar] [CrossRef]
- Nogi, K.; Sumi, Y.; Aoki, Y.; Yamamoto, T.; Fujii, H. Welding Phenomena of Aluminum-Copper Alloy in Electron Beam Welding. Mater. Sci. Forum 2000, 331–337, 1763–1768. [Google Scholar] [CrossRef]
- Schultz, H. Elektronenstrahlschweißen; DVS-Verl: Düsseldorf, Germany, 1989. [Google Scholar]
- Wang, J.; Hu, R.; Chen, X.; Pang, S. Modeling fluid dynamics of vapor plume in transient keyhole during vacuum electron beam welding. Vacuum 2018, 157, 277–290. [Google Scholar] [CrossRef]
- Huang, B.; Chen, X.; Pang, S.; Hu, R. A three-dimensional model of coupling dynamics of keyhole and weld pool during electron beam welding. Int. J. Heat Mass Transf. 2017, 115, 159–173. [Google Scholar] [CrossRef]
- Wang, L.; Gao, M.; Zhang, C.; Zeng, X. Effect of beam oscillating pattern on weld characterization of laser welding of AA6061-T6 aluminum alloy. Mater. Des. 2016, 108, 707–717. [Google Scholar] [CrossRef]
- Kabasakaloglu, T.S.; Erdogan, M. Characterisation of figure-eight shaped oscillation laser welding behaviour of 5083 aluminium alloy. Sci. Technol. Weld. Join. 2020, 25, 609–616. [Google Scholar] [CrossRef]
- Chen, G.; Wang, B.; Mao, S.; Zhong, P.; He, J. Research on the ‘∞’-shaped laser scanning welding process for aluminum alloy. Opt. Laser Technol. 2019, 115, 32–41. [Google Scholar] [CrossRef]
- Ansys Granta EduPack2020, “AL6082”. Available online: https://www.ansys.com/products/materials/granta-edupack (accessed on 5 March 2022).
- Adam, V. Elektronenstrahlschweißen: Grundlagen Einer Faszinierenden Technik; pro-beam: Gilching, Germany, 2011. [Google Scholar]
- Petzow, G. Metallographisches, Keramographisches, Plastographisches Ätzen; 6. Auflage; Gebrüder Borntraeger: Stuttgart, Germany, 2006. [Google Scholar]
- Bättig, D. Angewandte Datenanalyse; Springer: Berlin/Heidelberg, Germany, 2017. [Google Scholar] [CrossRef]


| Al | Cr | Cu | Fe | Mg | Mn | Si | Ti | Zn | Others |
|---|---|---|---|---|---|---|---|---|---|
| 95.2 | 0 | 0 | 0 | 0.6 | 0.4 | 0.7 | 0 | 0 | 0 |
| 98.3 | 0.25 | 0.1 | 0.5 | 1.2 | 1 | 1.3 | 0.1 | 0.2 | 0.15 |
| Series | Figure Welding Direction → | Energy Distribution | Length [mm] | Width [mm] |
|---|---|---|---|---|
| A |  | quadratic | 1.35 | 0.45 |
| B | 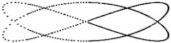 | linear | 3 | 0.45 |
| C |  | centered | 1.35 | 0.45 |
| D |  | constant | 1.35 | 0.25 |
| E | 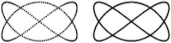 | Right Figure 75% Left Figure 25% | 3 | 0.45 |
| Quant Results | Single Spot Analyses | Al | Si | Mg | Fe | Mn | Cr | Cu | Zn | Total |
|---|---|---|---|---|---|---|---|---|---|---|
| [n] | [wt.%] | [wt.%] | [wt.%] | [wt.%] | [wt.%] | [wt.%] | [wt.%] | [wt.%] | [wt.%] | |
| Avg. base material | 18 | 96.21 | 1.06 | 0.85 | 0.42 | 0.64 | 0.13 | 0.10 | 0.13 | 99.54 |
| ±(SD) | 0.99 | 0.30 | 0.16 | 0.42 | 0.24 | 0.04 | 0.02 | 0.02 | 0.30 | |
| Avg. weld | 27 | 96.08 | 1.27 | 0.49 | 0.49 | 0.68 | 0.14 | 0.10 | bld. | 99.24 |
| ±(SD) | 0.50 | 0.28 | 0.05 | 0.09 | 0.04 | 0.01 | 0.02 | - | 0.,29 | |
| Semi-Quant Results | Integrated Mapping Area | Al | Si | Mg | Fe | Mn | Cr | Cu | Zn | Total |
| [mm2] | [wt.%] | [wt.%] | [wt.%] | [wt.%] | [wt.%] | [wt.%] | [wt.%] | [wt.%] | [wt.%] | |
| Avg. base material | 38.62 (Figure 7) | 96.45 | 1.12 | 0.93 | 0.55 | 0.56 | not analyzed | 99.61 | ||
| Avg. weld | 30.19 (Figure 7) | 97.02 | 1.21 | 0.56 | 0.63 | 0.58 | not analyzed | 99.99 | ||
| Avg. weld | 0.44 (Figure 8 and Figure A1) | 96.82 | 1.18 | 0.52 | 0.61 | 0.58 | not analyzed | 99.71 | ||
Publisher’s Note: MDPI stays neutral with regard to jurisdictional claims in published maps and institutional affiliations. |
© 2022 by the authors. Licensee MDPI, Basel, Switzerland. This article is an open access article distributed under the terms and conditions of the Creative Commons Attribution (CC BY) license (https://creativecommons.org/licenses/by/4.0/).
Share and Cite
Moschinger, M.; Mittermayr, F.; Enzinger, N. Influence of Beam Figure on Porosity of Electron Beam Welded Thin-Walled Aluminum Plates. Materials 2022, 15, 3519. https://doi.org/10.3390/ma15103519
Moschinger M, Mittermayr F, Enzinger N. Influence of Beam Figure on Porosity of Electron Beam Welded Thin-Walled Aluminum Plates. Materials. 2022; 15(10):3519. https://doi.org/10.3390/ma15103519
Chicago/Turabian StyleMoschinger, Matthias, Florian Mittermayr, and Norbert Enzinger. 2022. "Influence of Beam Figure on Porosity of Electron Beam Welded Thin-Walled Aluminum Plates" Materials 15, no. 10: 3519. https://doi.org/10.3390/ma15103519
APA StyleMoschinger, M., Mittermayr, F., & Enzinger, N. (2022). Influence of Beam Figure on Porosity of Electron Beam Welded Thin-Walled Aluminum Plates. Materials, 15(10), 3519. https://doi.org/10.3390/ma15103519