
Development and Optimization of Broadband Acoustic Metamaterial Absorber Based on Parallel–Connection Square Helmholtz Resonators


 , and
, and
Abstract
:
1. Introduction
2. Structural Design of the Metamaterial Cell
3. Construction of the Finite Element Model
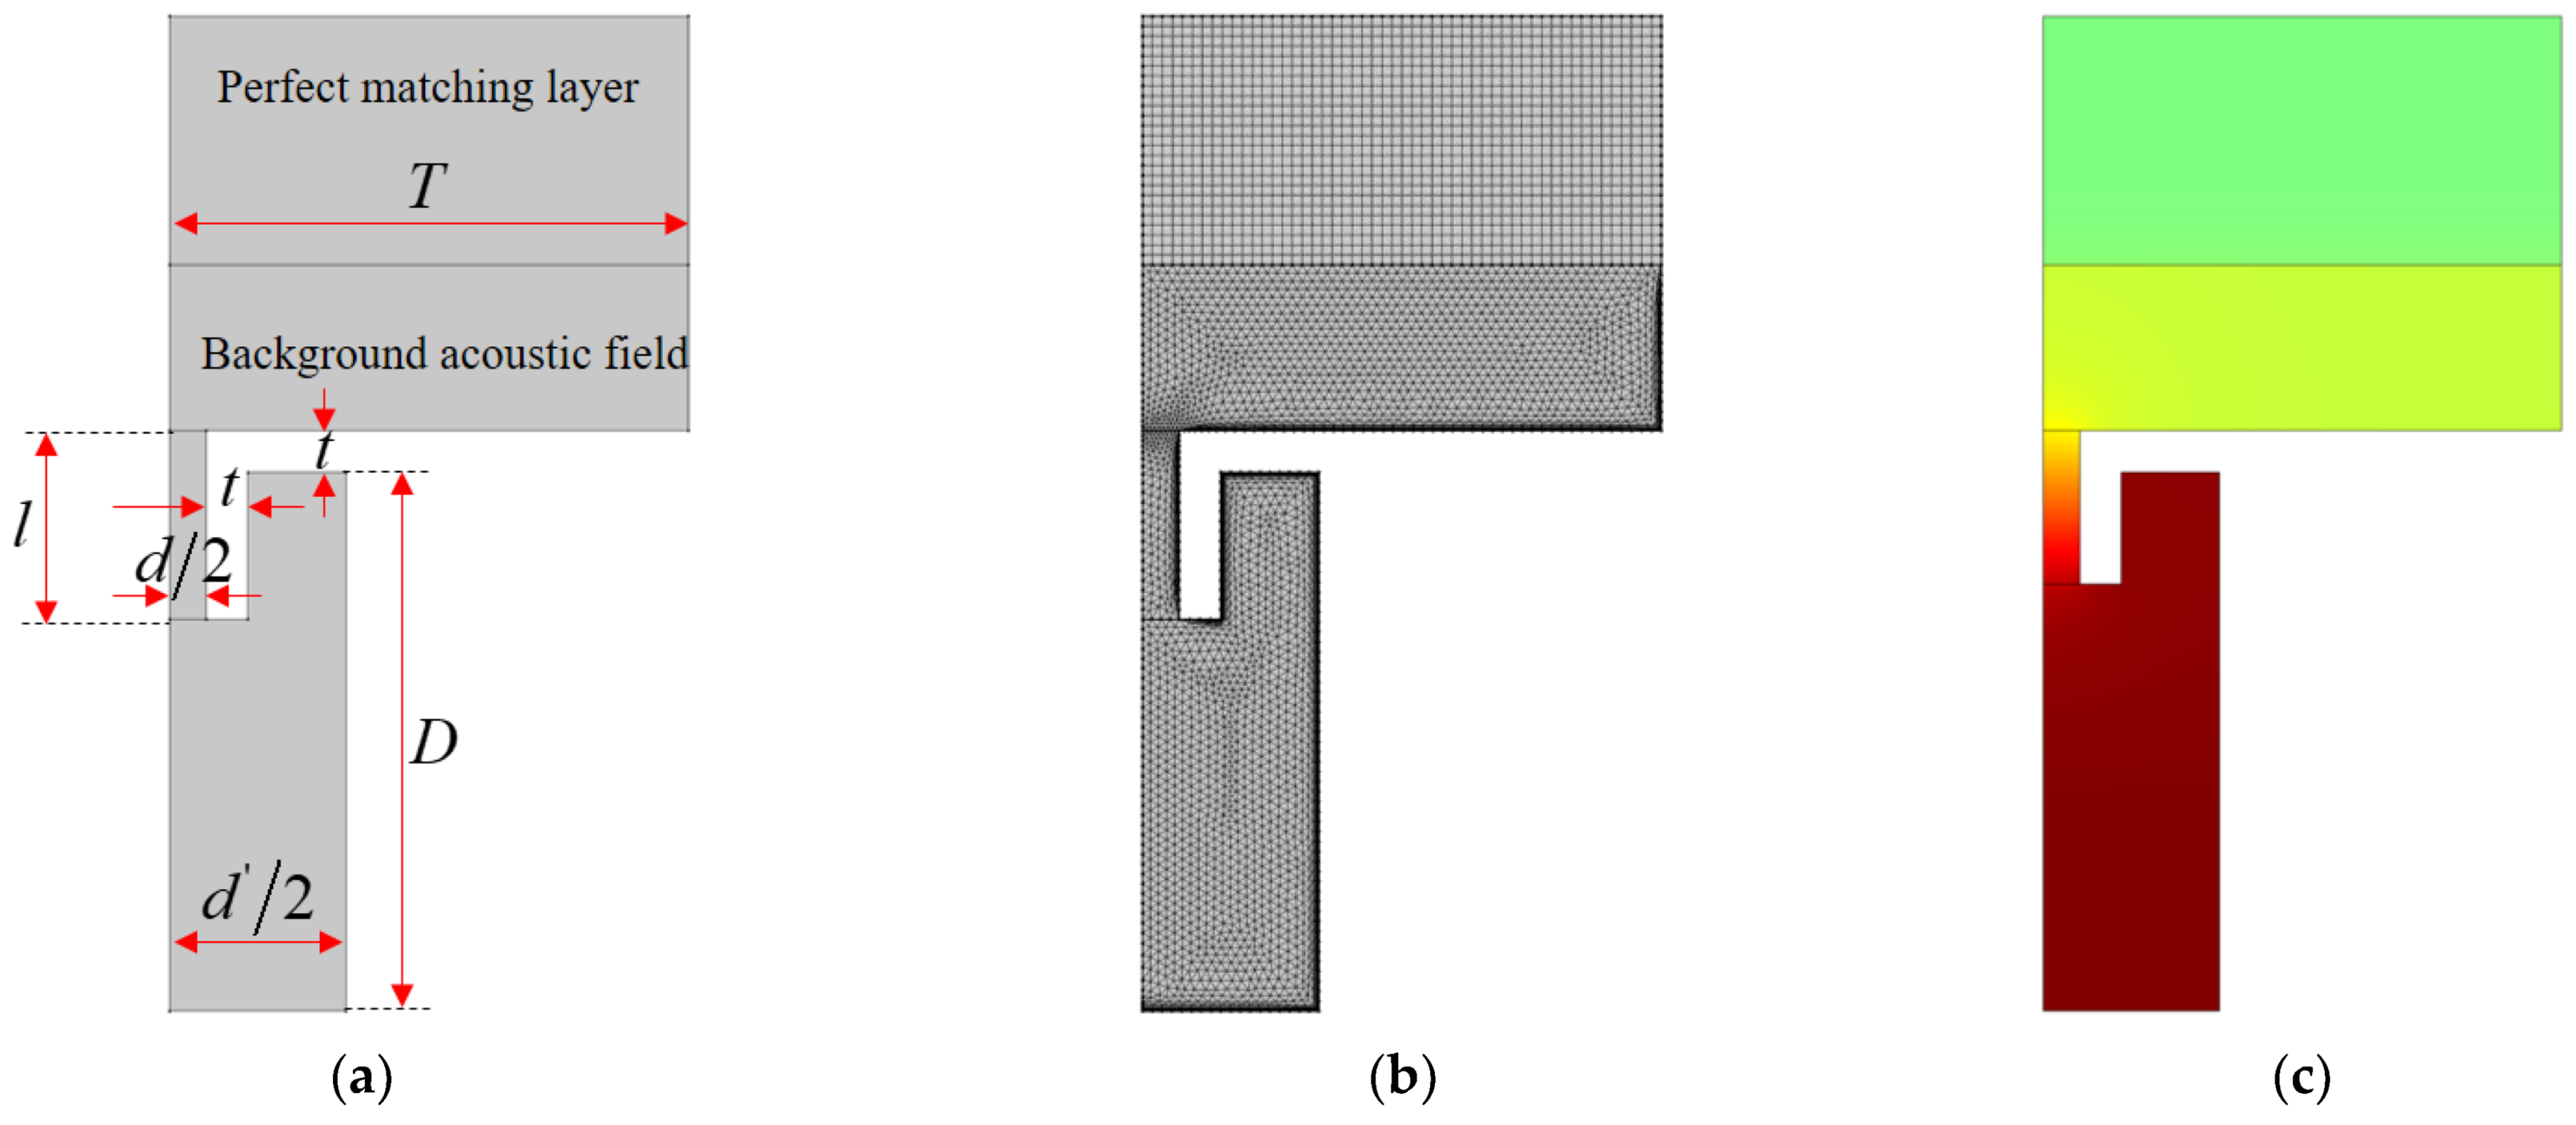
3.1. Three–Dimensional Finite Element Model
3.2. Two–Dimensional Equivalent Simulation Model
4. Optimization of the Structural Parameters
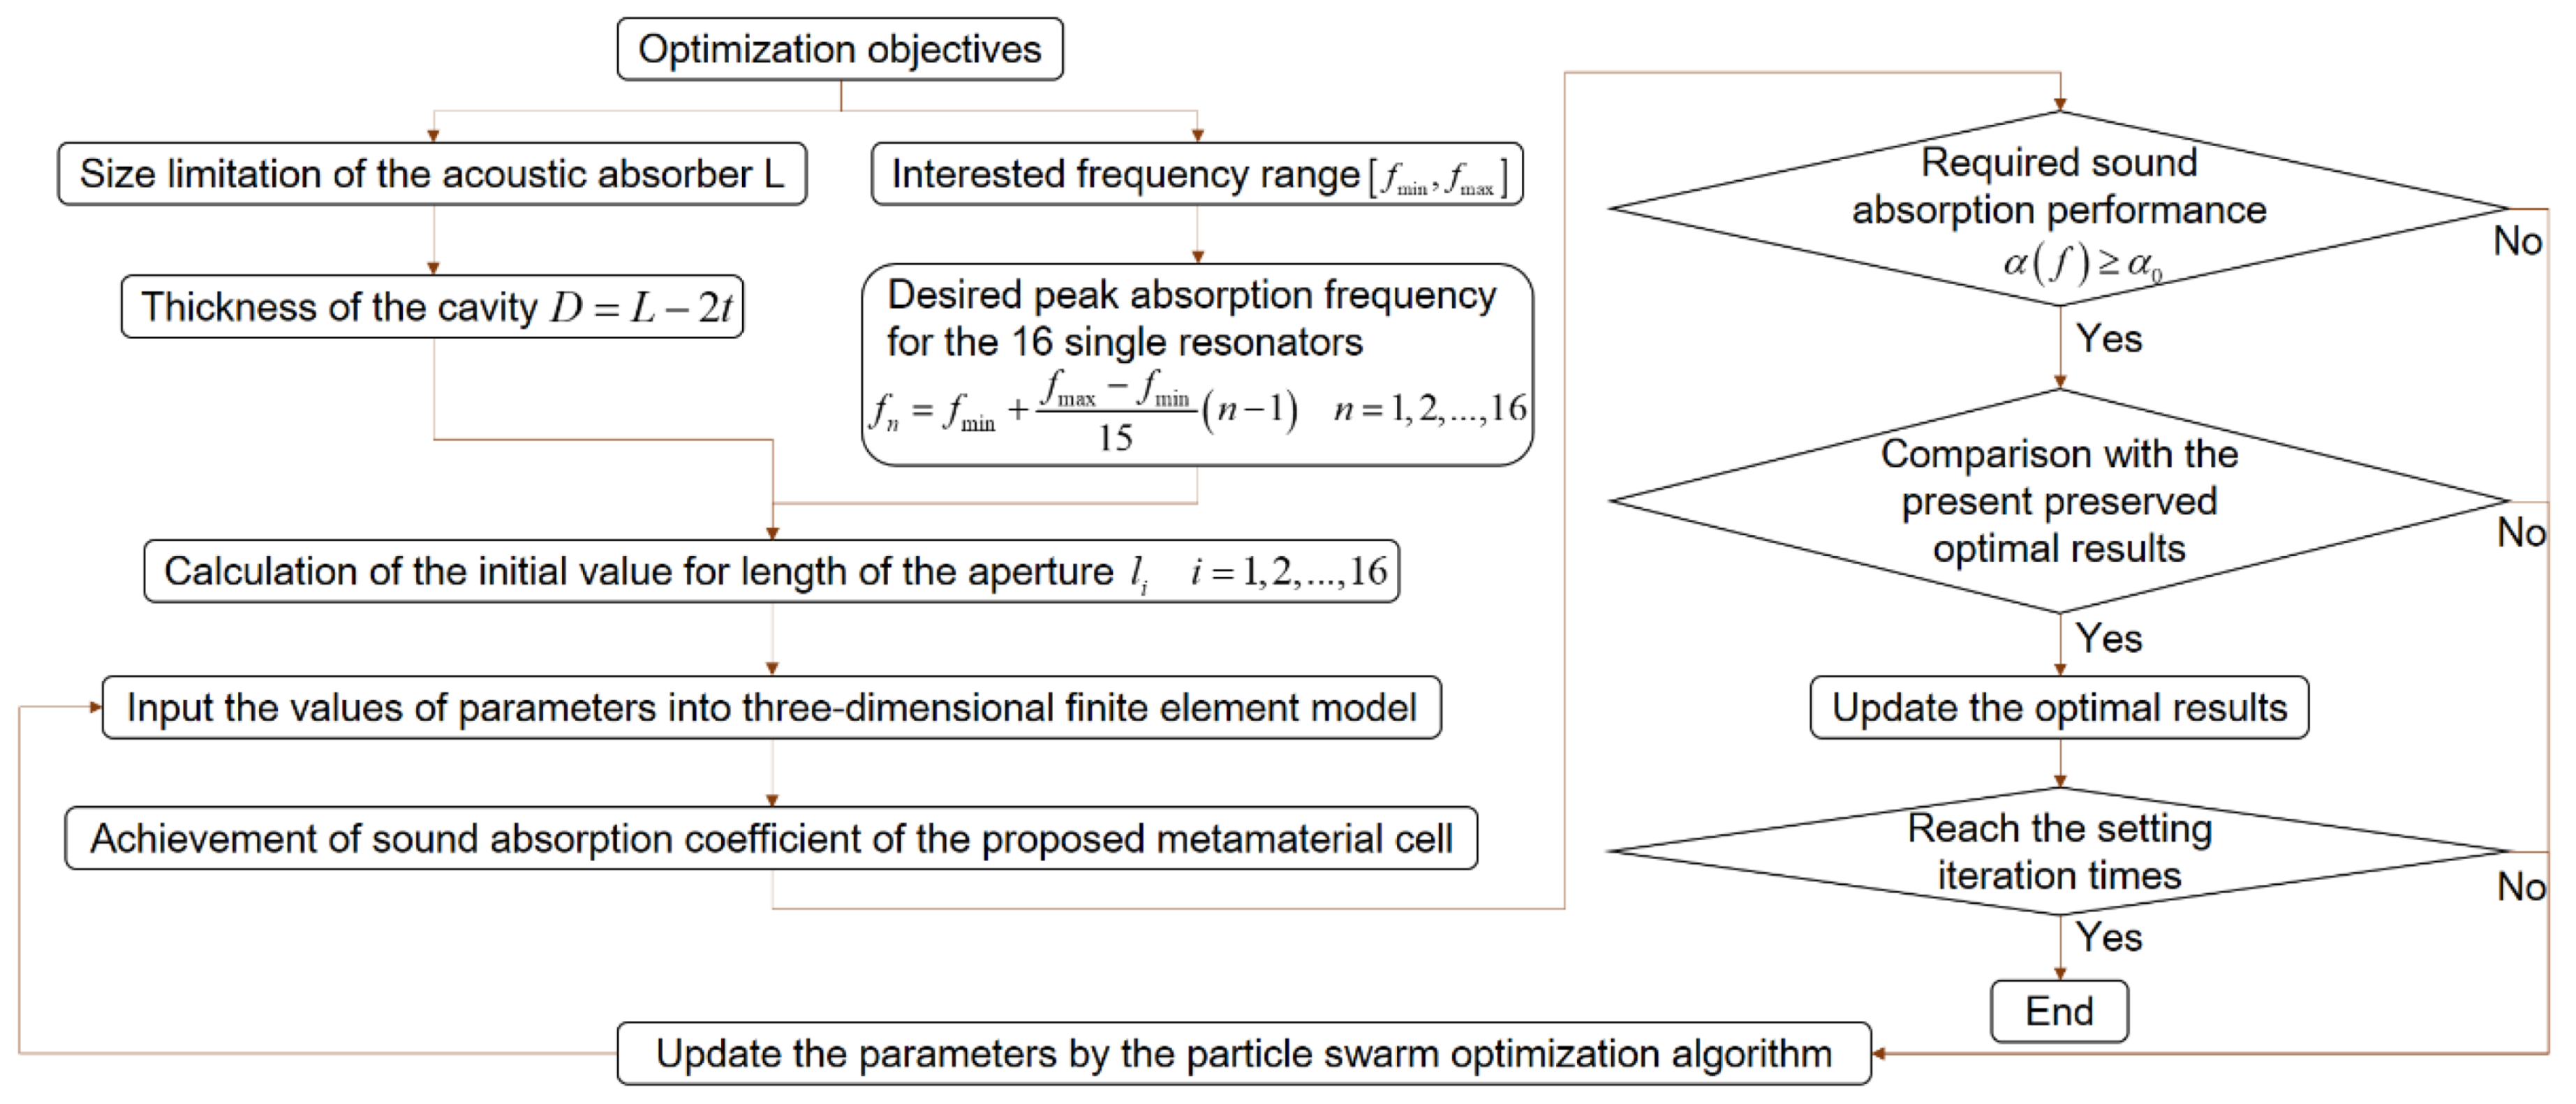
4.1. Optimization Objectives
4.2. Intelligent Optimization Algorithm
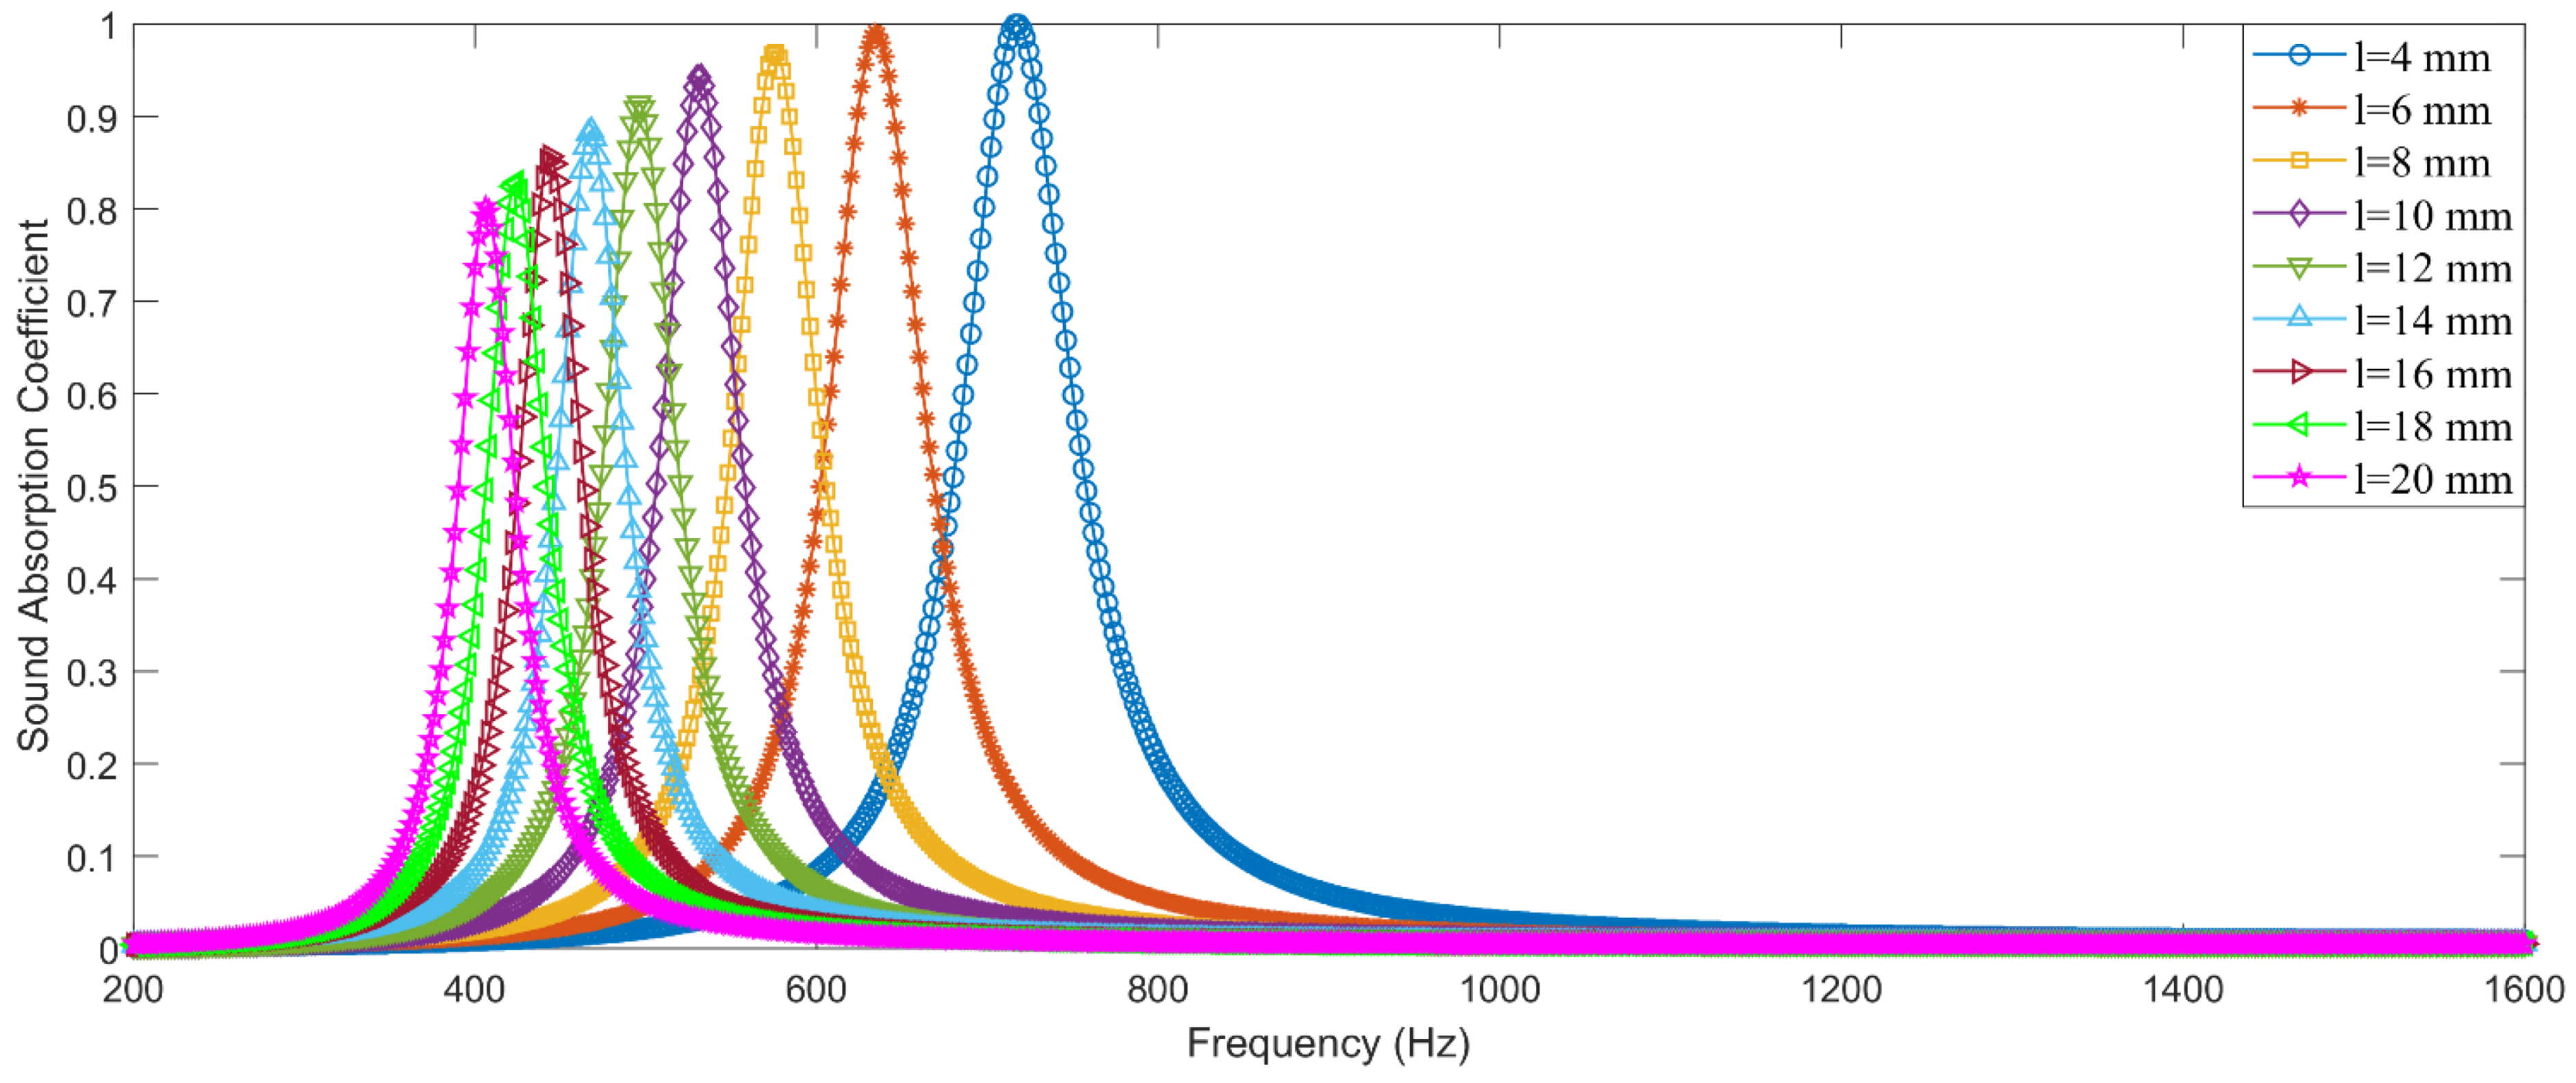
4.3. Initial Values of Parameters
4.4. Optimization Results
5. Fabrication and Detection of the Optimal Sample
5.1. Preparation of Experimental Sample
5.2. Detection of Sound Absorption Coefficient
6. Analysis and Discussion
7. Conclusions
- (1)
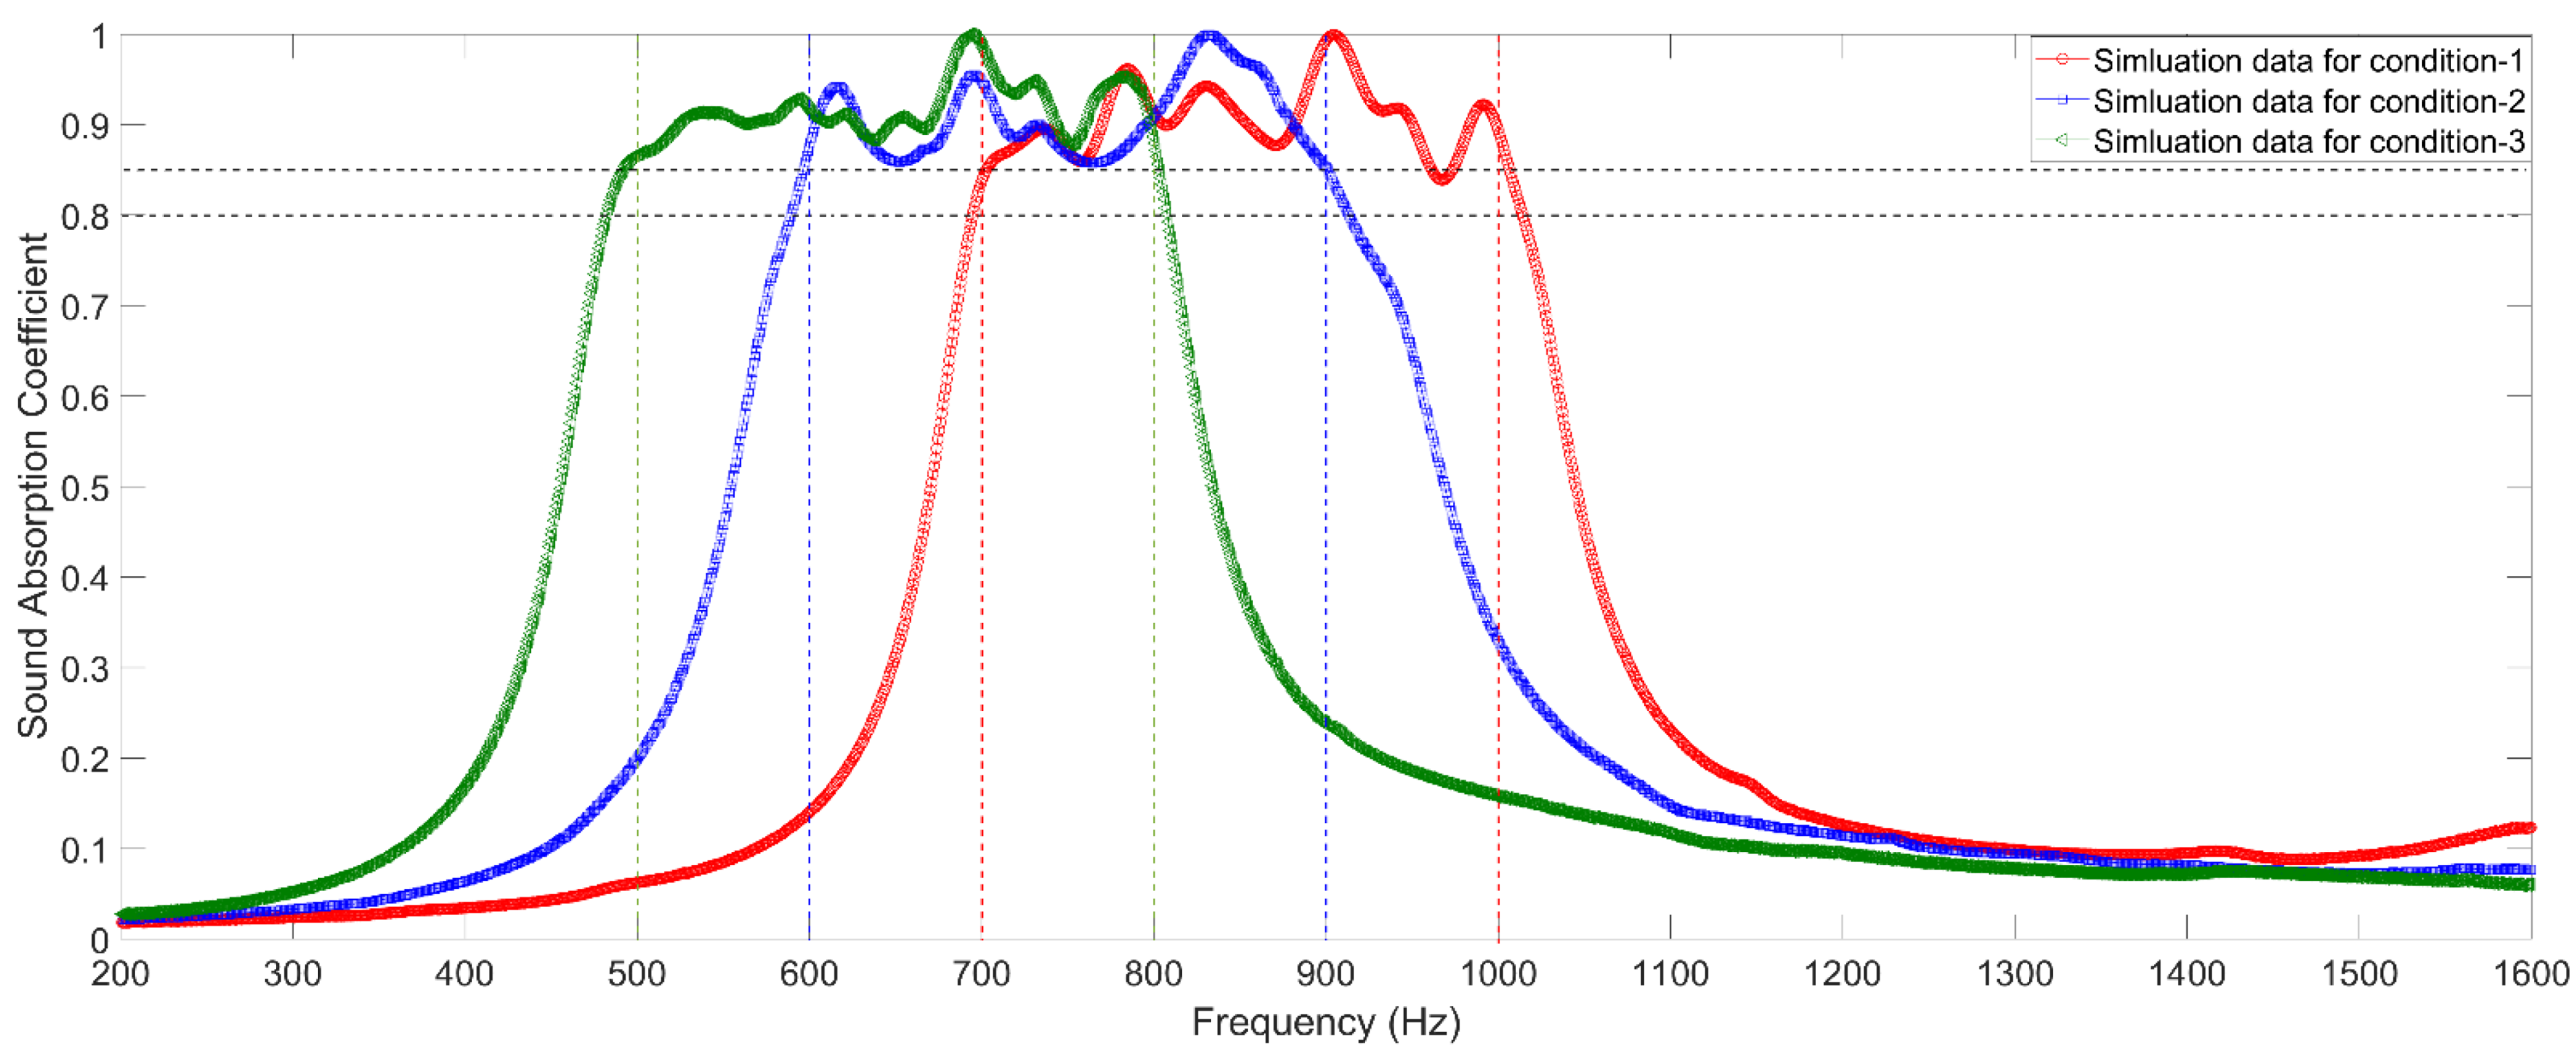
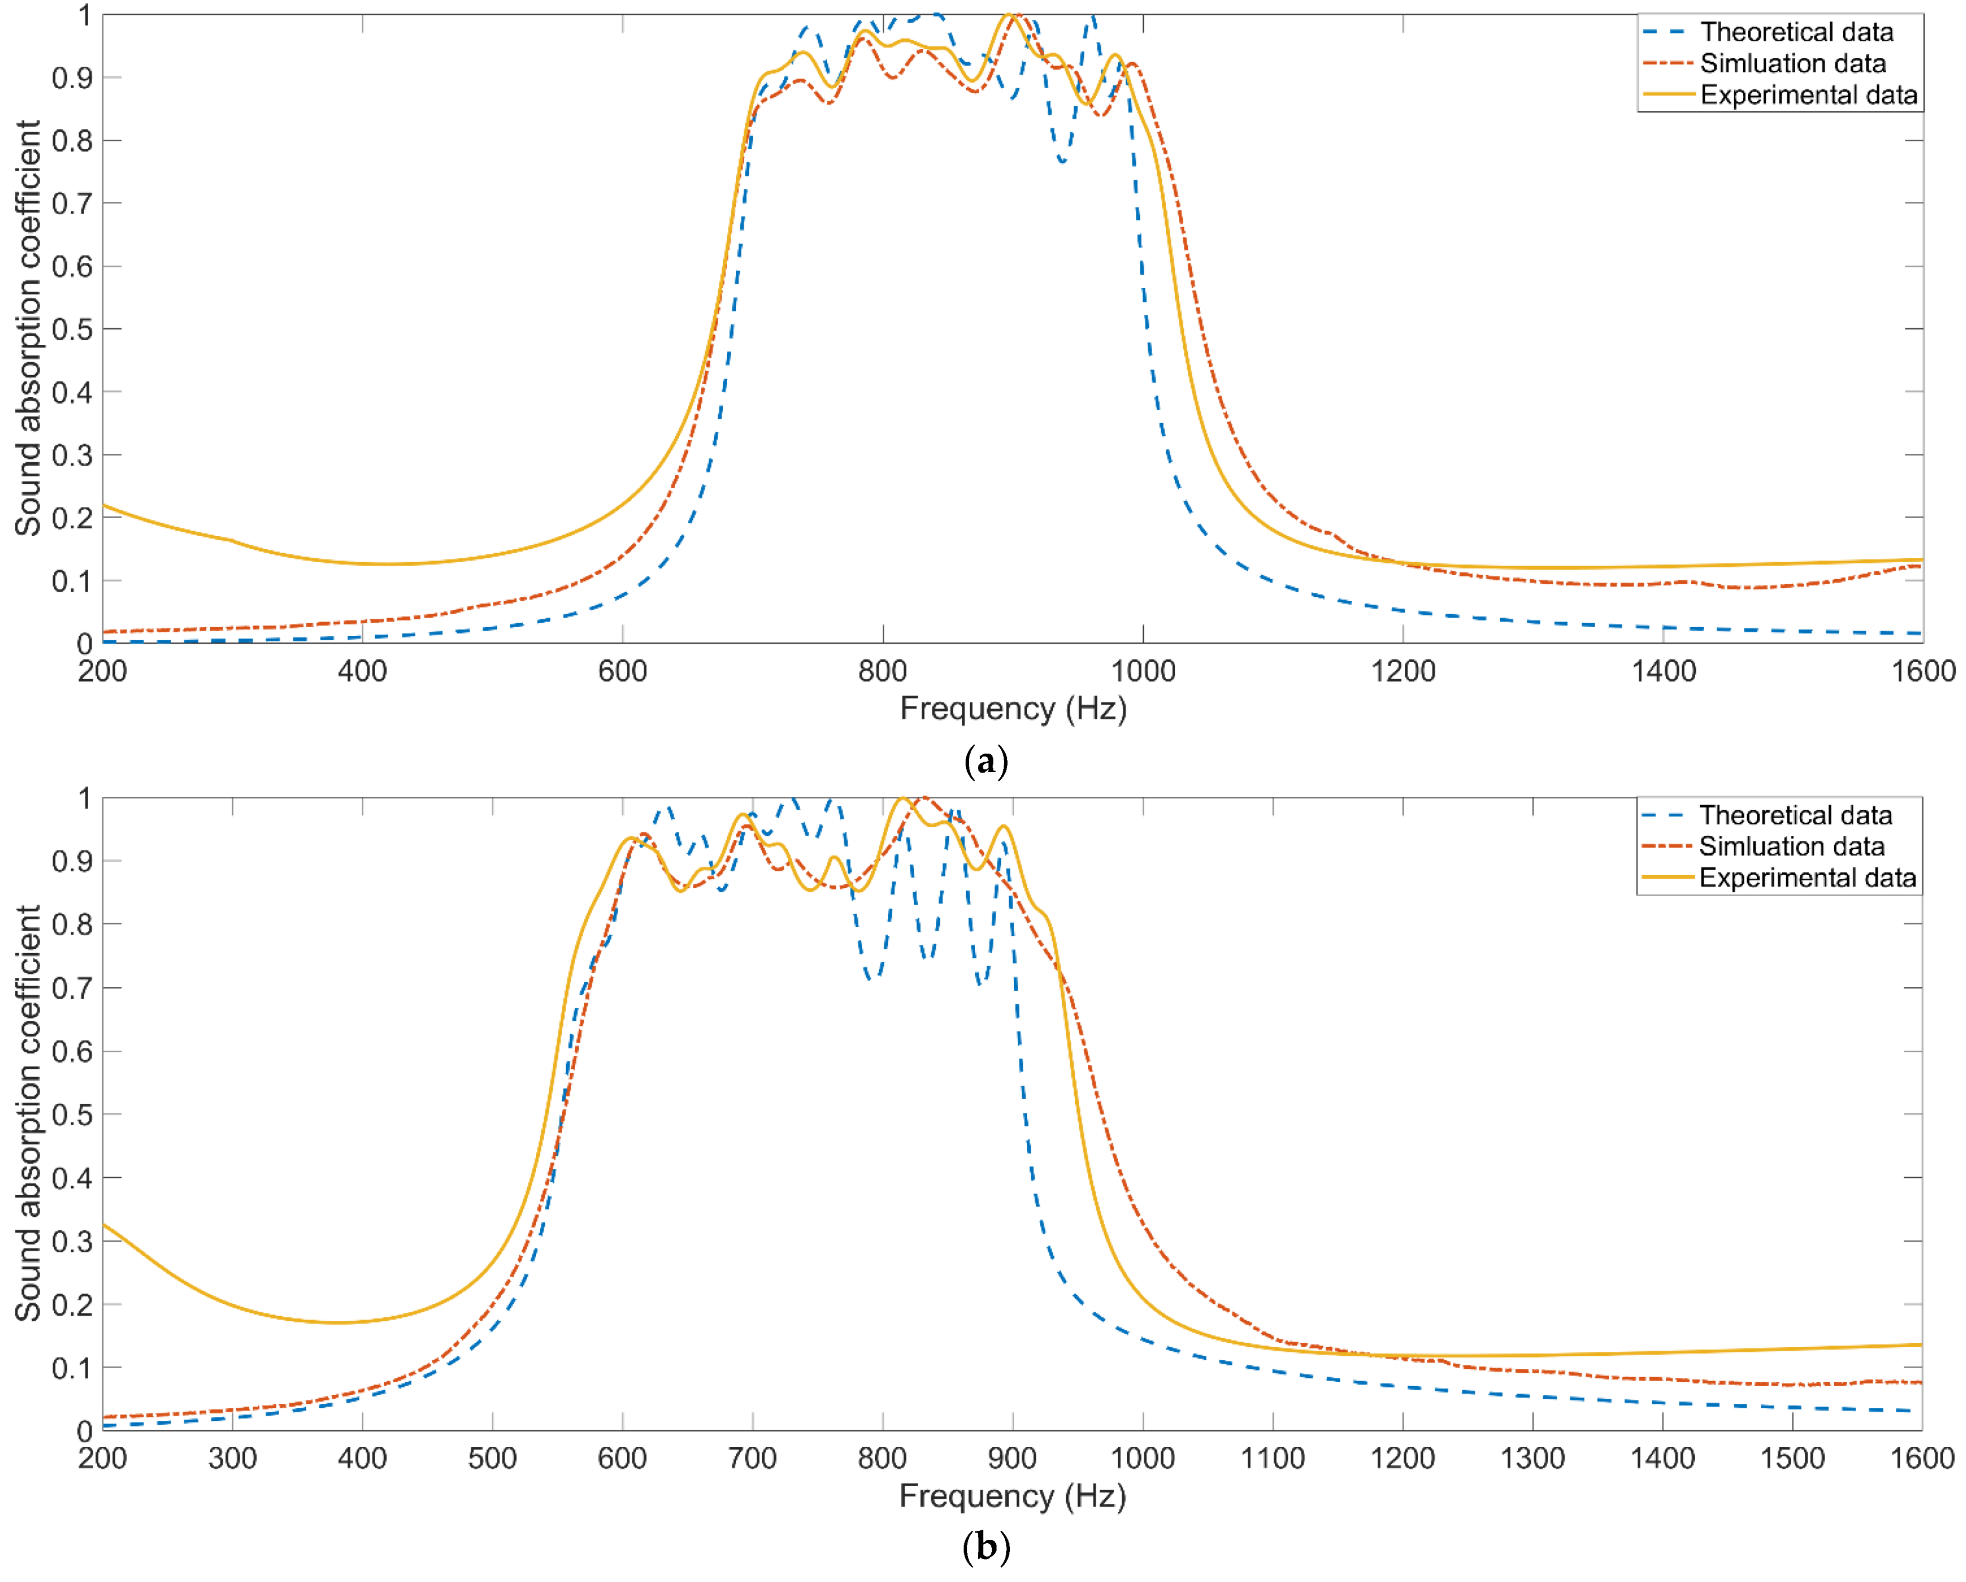
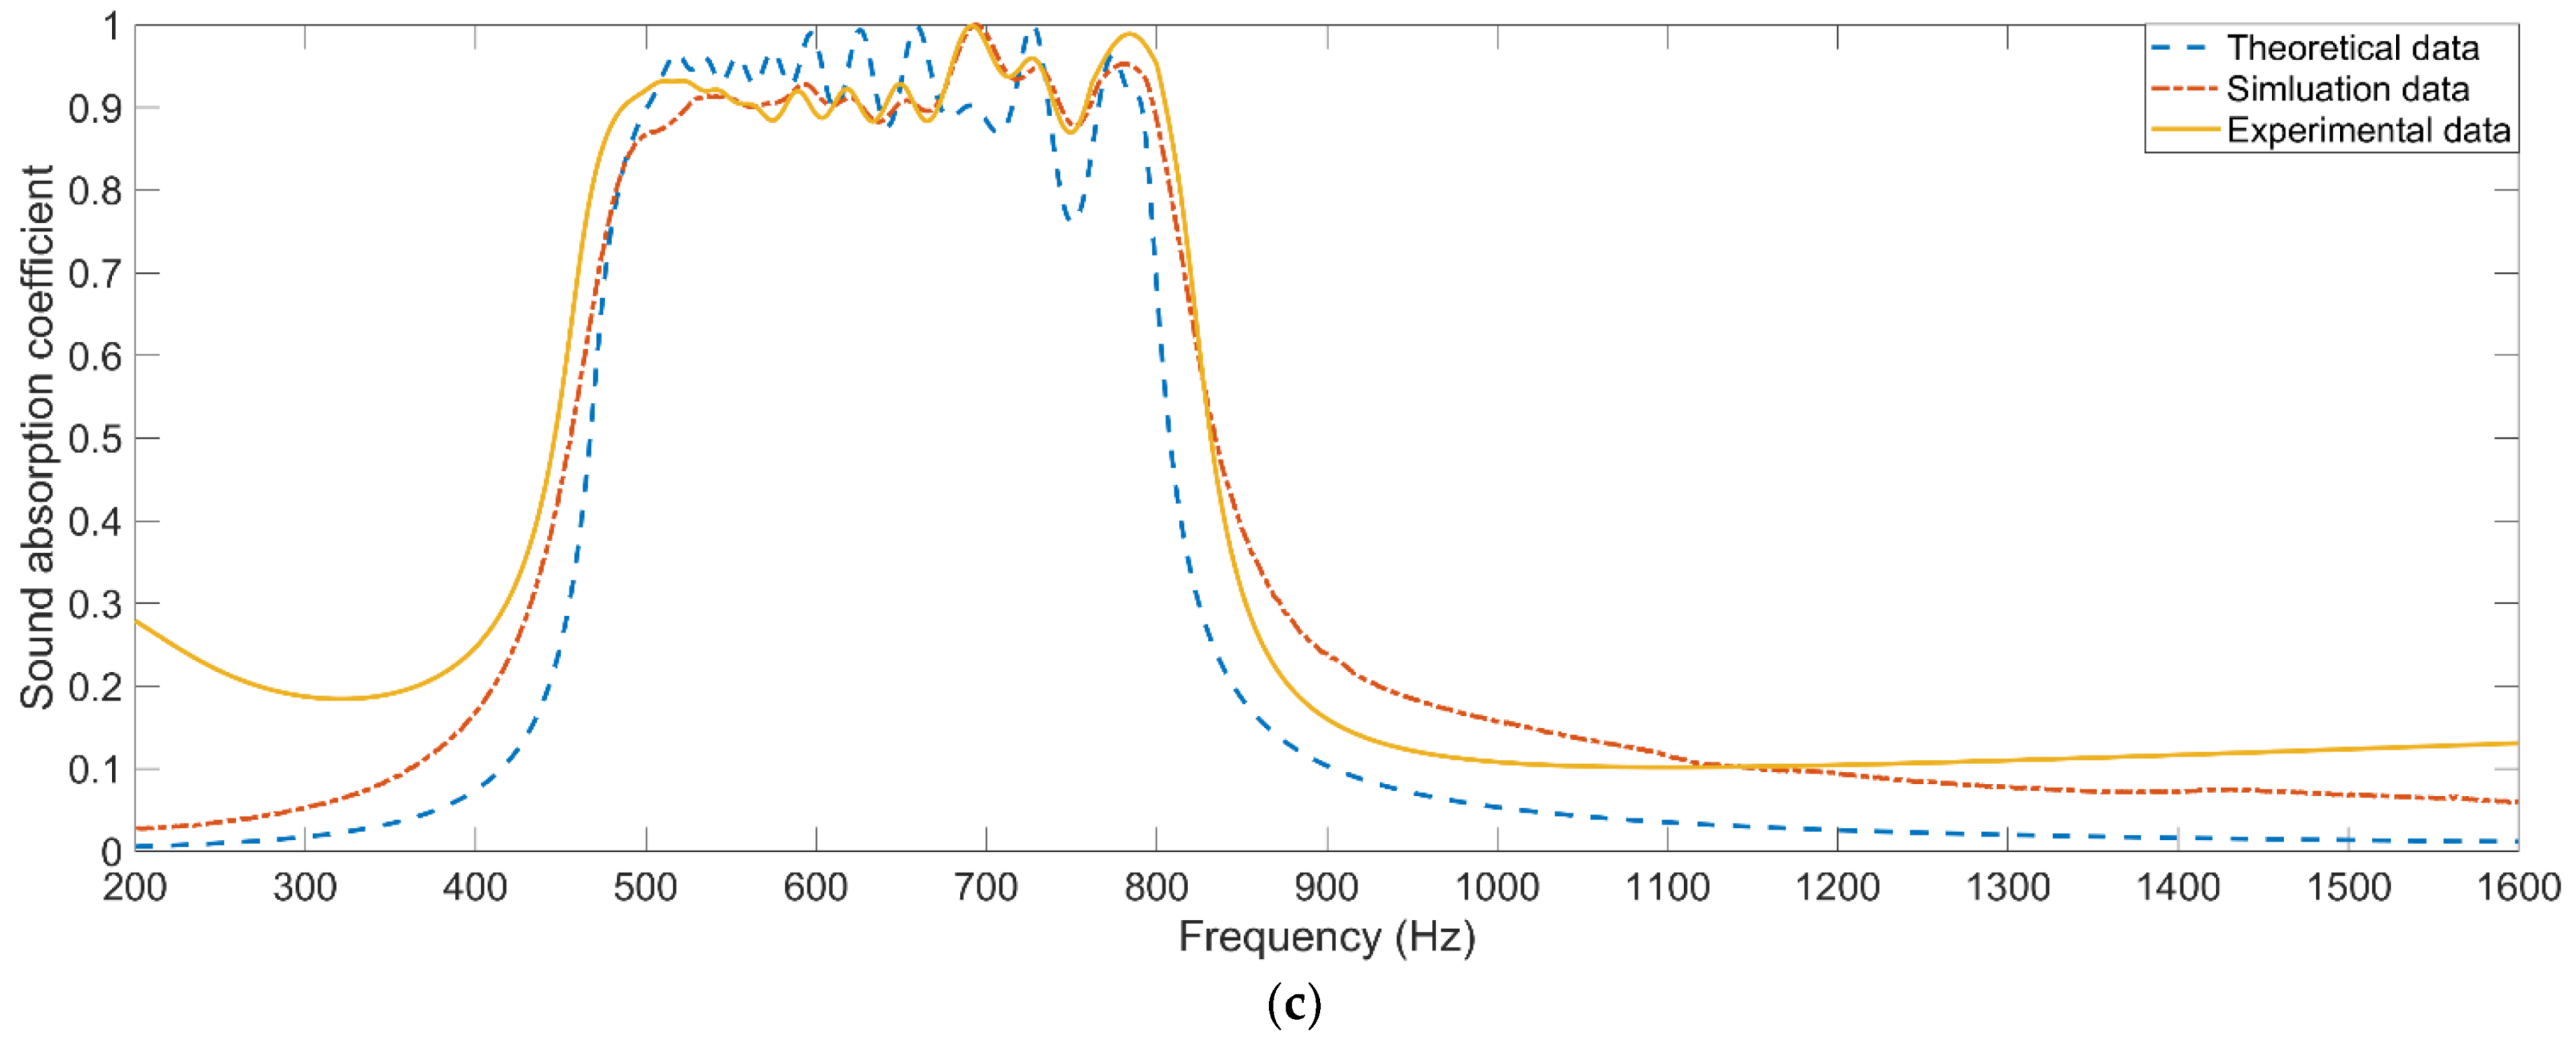
- Sound absorption coefficients of the investigated metamaterial cells obtained by the three–dimensional finite element model are consistent with those achieved by standing wave tube measurement, which can prove feasibility of the proposed optimization method and usefulness of the developed acoustic metamaterial absorber.
- (2)
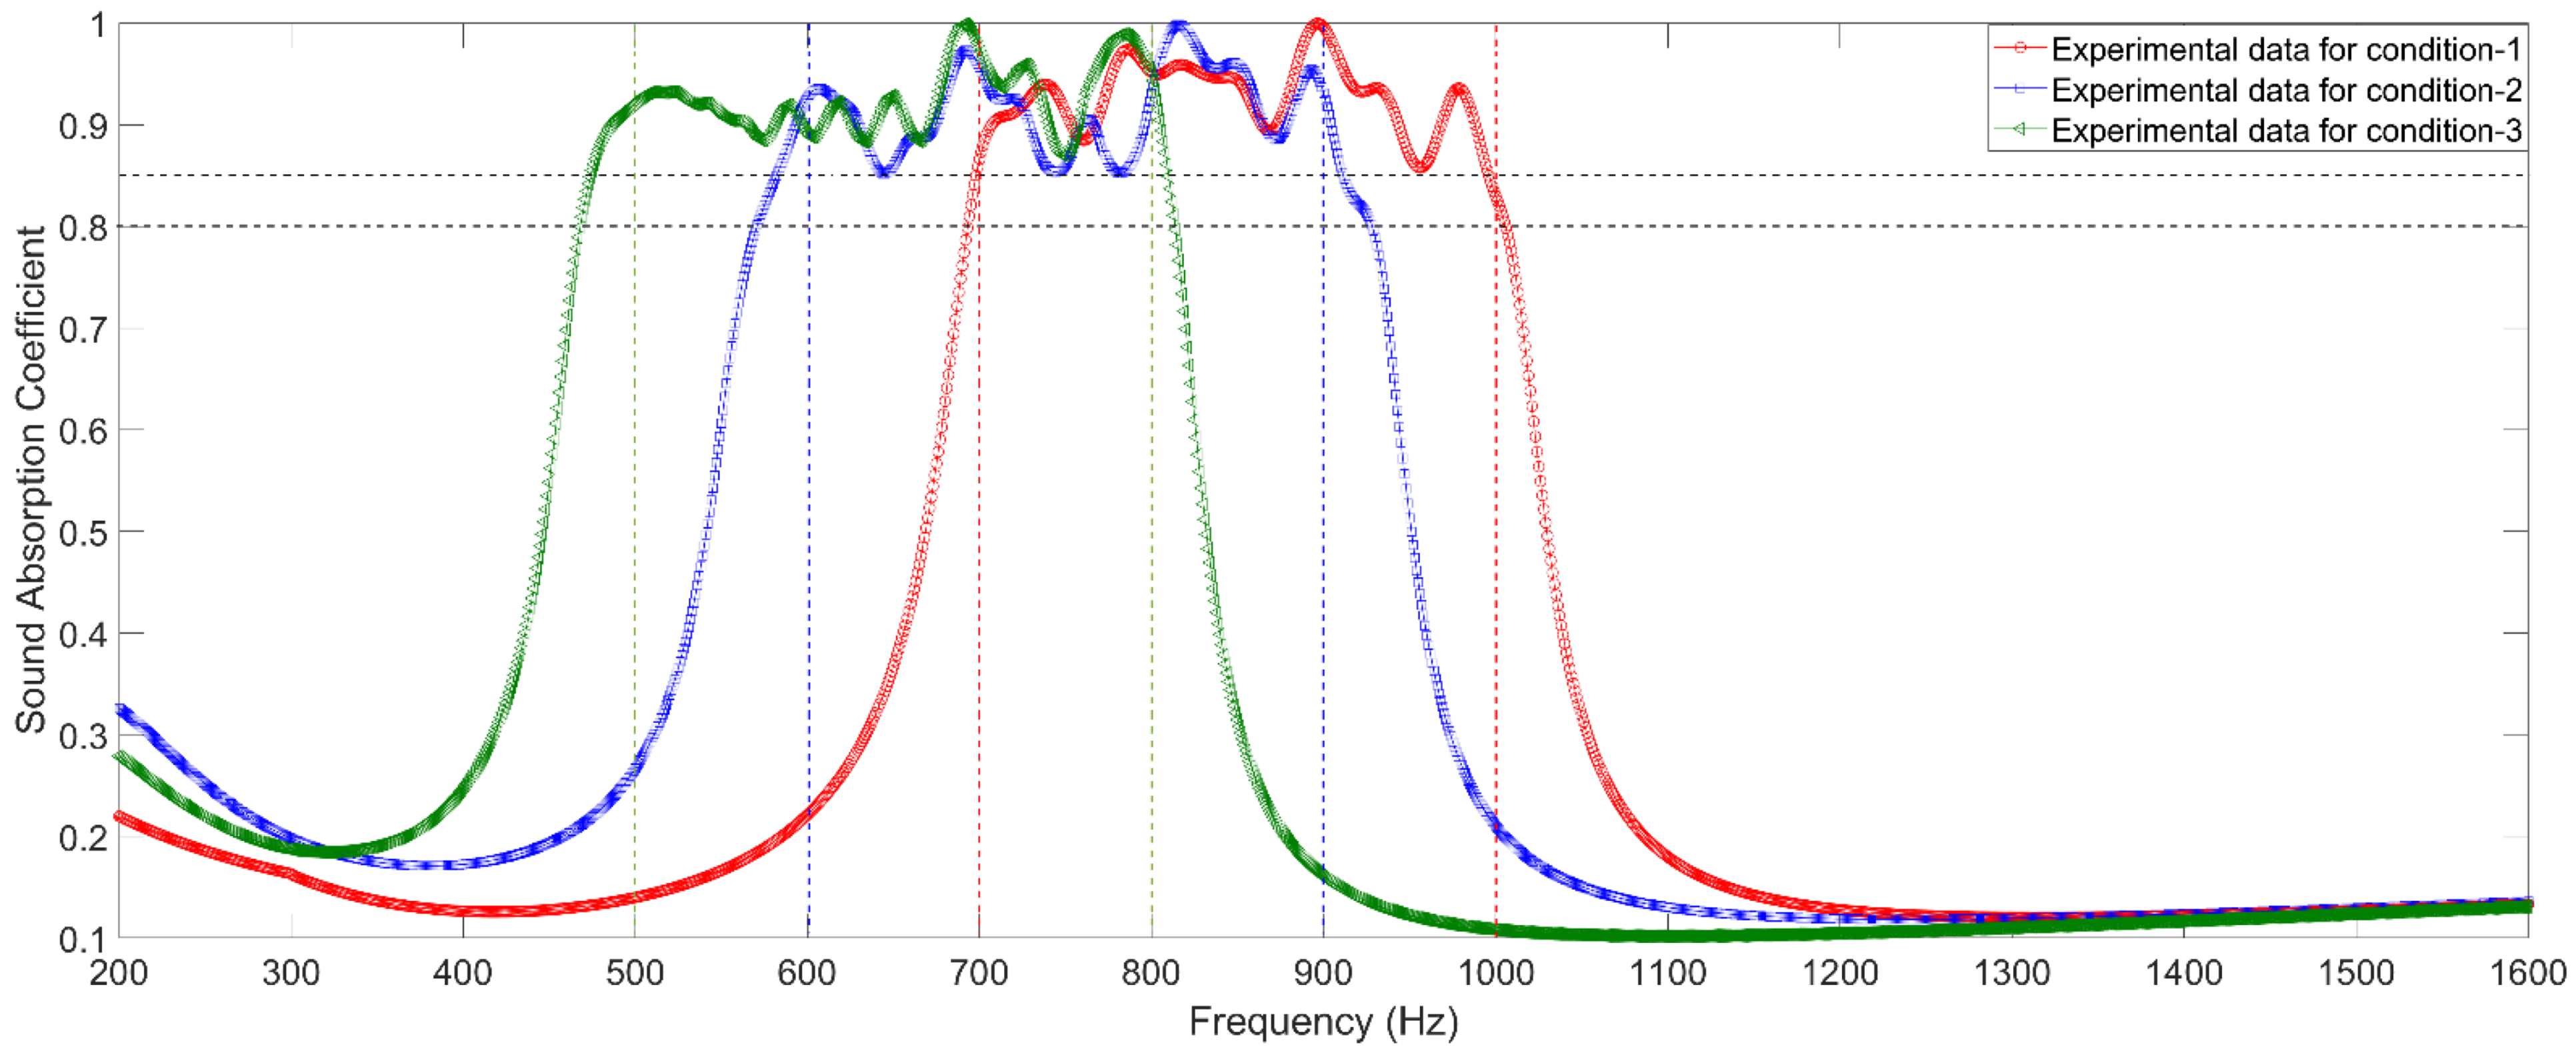
- Actual sound absorption performance of the obtained optimal metamaterial cells can meet the requirements of the 3 given conditions in the experimental validation, which can prove the effectiveness of the initial values of parameters obtained by the two–dimensional equivalent simulation model and the accuracy of the optimal parameters achieved through the particle swarm optimization algorithm.
- (3)
- The average actual sound absorption coefficients of the three investigated metamaterial cells are 0.9271 in the [700 Hz, 1000 Hz] with total size of 30 mm, 0.9157 in the [600 Hz, 900 Hz] with total size of 40 mm, and 0.9259 in the [500 Hz, 800 Hz] with total size of 50 mm, respectively. Broadband sound absorption performance is obtained by the parameter optimization, which will be propitious for promoting the actual application of the proposed parallel–connection square Helmholtz resonators to reduce the low frequency noise generated by the large equipment in the factory.
Author Contributions
Funding
Institutional Review Board Statement
Informed Consent Statement
Data Availability Statement
Conflicts of Interest
References
- Yaghoubi, K.; Alimohammadi, I.; Abolghasemi, J.; Shandiz, M.S.; Aboutaleb, N.; Ashtarinezhad, A. The effect of occupational noise exposure on systolic blood pressure, diastolic blood pressure and salivary cortisol level among automotive assembly workers. Int. J. Occup. Saf. Ergon. 2021, 27, 8–13. [Google Scholar] [CrossRef] [PubMed]
- Sikora, J.; Wagnerova, R.; Landryova, L.; Sima, J.; Wrona, S. Influence of Environmental Noise on Quality Control of HVAC Devices Based on Convolutional Neural Network. Appl. Sci. 2021, 11, 7484. [Google Scholar] [CrossRef]
- Nyarubeli, I.P.; Tungu, A.M.; Bratveit, M.; Sunde, E.; Kayumba, A.V.; Moen, B.E. Variability and Determinants of Occupational Noise Exposure Among Iron and Steel Factory Workers in Tanzania. Ann. Work Expos. Health 2019, 62, 1109–1122. [Google Scholar] [CrossRef] [PubMed] [Green Version]
- Yang, X.C.; Shen, X.M.; Duan, H.Q.; Zhang, X.N.; Yin, Q. Identification of Acoustic Characteristic Parameters and Improvement of Sound Absorption Performance for Porous Metal. Metals 2020, 10, 340. [Google Scholar] [CrossRef] [Green Version]
- Yang, X.C.; Shen, X.M.; Duan, H.Q.; Yang, F.; Zhang, X.N.; Pan, M.; Yin, Q. Improving and Optimizing Sound Absorption Performance of Polyurethane Foam by Prepositive Microperforated Polymethyl Methacrylate Panel. Appl. Sci. 2020, 10, 2103. [Google Scholar] [CrossRef] [Green Version]
- Duan, H.Q.; Shen, X.M.; Wang, E.S.; Yang, F.; Zhang, X.N.; Yin, Q. Acoustic multi-layer Helmholtz resonance metamaterials with multiple adjustable absorption peaks. Appl. Phys. Lett. 2021, 118, 241904. [Google Scholar] [CrossRef]
- Hedayati, R.; Lakshmanan, S. Pneumatically-Actuated Acoustic Metamaterials Based on Helmholtz Resonators. Materials 2020, 13, 1456. [Google Scholar] [CrossRef] [Green Version]
- Yang, D.G.; Jiang, Q.Y.; Wu, J.F.; Han, Y.H.; Ding, B.; Niu, B.; Xie, G.L. Acoustic Slow-Wave Effect Metamaterial Muffler for Noise Control of HVDC Converter Station. Front. Mater. 2022, 8, 804302. [Google Scholar] [CrossRef]
- Zhang, H.; Chen, S.B.; Liu, Z.Z.; Song, Y.B.; Xiao, Y. Light-weight large-scale tunable metamaterial panel for low-frequency sound insulation. Appl. Phys. Express 2020, 13, 067003. [Google Scholar] [CrossRef]
- Melnikov, A.; Maeder, M.; Friedrich, N.; Pozhanka, Y.; Wollmann, A.; Scheffler, M.; Oberst, S.; Powell, D.; Marburg, S. Acoustic metamaterial capsule for reduction of stage machinery noise. J. Acoust. Soc. Am. 2020, 147, 1491–1503. [Google Scholar] [CrossRef] [Green Version]
- Gao, N.S.; Zhang, Z.C.; Tang, L.L.; Hou, H.; Chen, K.A. Optimal design of broadband quasi-perfect sound absorption of composite hybrid porous metamaterial using TLBO algorithm. Appl. Acoust. 2021, 183, 108296. [Google Scholar] [CrossRef]
- Dong, H.W.; Zhao, S.D.; Wei, P.J.; Cheng, L.; Wang, Y.S.; Zhang, C.Z. Systematic design and realization of double-negative acoustic metamaterials by topology optimization. Acta Mater. 2019, 172, 102–120. [Google Scholar] [CrossRef] [Green Version]
- Zheng, B.; Yang, J.; Liang, B.; Cheng, J.C. Inverse design of acoustic metamaterials based on machine learning using a Gauss-Bayesian model. J. Appl. Phys. 2020, 128, 134902. [Google Scholar] [CrossRef]
- Chen, P.; Haberman, M.R.; Ghattas, O. Optimal design of acoustic metamaterial cloaks under uncertainty. J. Comput. Phys. 2021, 431, 110114. [Google Scholar] [CrossRef]
- Gritsenko, D.; Paoli, R. Theoretical Optimization of Trapped-Bubble-Based Acoustic Metamaterial Performance. Appl. Sci. 2020, 10, 5720. [Google Scholar] [CrossRef]
- Luo, Y.Q.; Lou, J.J.; Zhang, Y.B. An acoustic absorbing metamaterial with multi-Helmholtz resonators at low-frequency underwater. Mod. Phys. Let. B 2021, 35, 2150397. [Google Scholar] [CrossRef]
- Hu, G.B.; Tang, L.H.; Cui, X.B. On the modelling of membrane-coupled Helmholtz resonator and its application in acoustic metamaterial system. Mech. Syst. Signal Process 2019, 132, 595–608. [Google Scholar] [CrossRef]
- Dogra, S.; Gupta, A. Design, Manufacturing, and Acoustical Analysis of a Helmholtz Resonator-Based Metamaterial Plate. Acoustics 2021, 3, 630–641. [Google Scholar] [CrossRef]
- Gebrekidan, S.B.; Kim, H.J.; Song, S.J. Investigation of Helmholtz resonator-based composite acoustic metamaterial. Appl. Phys. A Mater. 2019, 125, 65. [Google Scholar] [CrossRef]
- Jena, D.P.; Dandsena, J.; Jayakumari, V.G. Demonstration of effective acoustic properties of different configurations of Helmholtz resonators. Appl. Acoust. 2019, 155, 371–382. [Google Scholar] [CrossRef]
- Yang, M.; Sheng, P. Sound Absorption Structures: From Porous Media to Acoustic Metamaterials. Annu. Rev. Mater. Res. 2017, 47, 83–114. [Google Scholar] [CrossRef]
- Noguchi, Y.; Yamada, T.; Izui, K.; Nishiwaki, S. Optimum design of an acoustic metamaterial with negative bulk modulus in an acoustic-elastic coupled system using a level set-based topology optimization method. Int. J. Numer. Meth. Eng. 2018, 113, 1300–1339. [Google Scholar] [CrossRef]
- Li, D.; Zigoneanu, L.; Popa, B.I.; Cummer, S.A. Design of an acoustic metamaterial lens using genetic algorithms. J. Acoust. Soc. Am. 2012, 132, 2823–2833. [Google Scholar] [CrossRef] [PubMed] [Green Version]
- Shah, T.; Zhuo, L.W.; Lai, P.; De la Rosa-Moreno, A.; Amirkulova, F.; Gerstoft, P. Reinforcement learning applied to metamaterial design. J. Acoust. Soc. Am. 2021, 150, 321–338. [Google Scholar] [CrossRef]
- Dong, H.W.; Zhao, S.D.; Zhu, R.; Wang, Y.S.; Cheng, L.; Zhang, C.Z. Customizing acoustic dirac cones and topological insulators in square lattices by topology optimization. J. Sound Vib. 2021, 493, 115687. [Google Scholar] [CrossRef]
- Jiang, J.J.; Wei, W.X.; Shao, W.L.; Liang, Y.F.; Qu, Y.Y. Research on Large-Scale Bi-Level Particle Swarm Optimization Algorithm. IEEE Access 2021, 9, 56364–56375. [Google Scholar] [CrossRef]
- Liu, C.R.; Wu, J.H.; Ma, F.Y.; Chen, X.; Yang, Z.R. A thin multi-order Helmholtz metamaterial with perfect broadband acoustic absorption. Appl. Phys. Express 2019, 12, 084002. [Google Scholar] [CrossRef]
- Guo, J.W.; Fang, Y.; Jiang, Z.Y.; Zhang, X. An investigation on noise attenuation by acoustic liner constructed by Helmholtz resonators with extended necks. J. Acoust. Soc. Am. 2021, 149, 70–81. [Google Scholar] [CrossRef]
- Huang, S.B.; Fang, X.S.; Wang, X.; Assouar, B.; Cheng, Q.; Li, Y. Acoustic perfect absorbers via Helmholtz resonators with embedded apertures. J. Acoust. Soc. Am. 2019, 145, 254–262. [Google Scholar] [CrossRef]
- Gric, T.; Cada, M. Analytic solution to field distribution in one-dimensional inhomogeneous media. Opt. Commun. 2014, 322, 183–187. [Google Scholar] [CrossRef]
- Duan, H.Q.; Shen, X.M.; Yin, Q.; Yang, F.; Bai, P.F.; Zhang, X.N.; Pan, M. Modeling and optimization of sound absorption coefficient of microperforated compressed porous metal panel absorber. Appl. Acoust. 2020, 166, 107322. [Google Scholar] [CrossRef]


| Number of Group | Number of Resonator | Parameters | |||
|---|---|---|---|---|---|
| Diameter of Hole | Length of Aperture | Side Length of Cavity | Thickness of Cavity | ||
| 1 | R1 | 3.54 mm | 15 mm | D | |
| R2 | |||||
| R3 | |||||
| R4 | |||||
| 2 | R5 | 3.87 mm | |||
| R6 | |||||
| R7 | |||||
| R8 | |||||
| 3 | R9 | 4.18 mm | |||
| R10 | |||||
| R11 | |||||
| R12 | |||||
| 4 | R13 | 4.47 mm | |||
| R14 | |||||
| R15 | |||||
| R16 | |||||
| Optimization Objectives | Condition–1 | Condition–2 | Condition–3 |
|---|---|---|---|
| Size limitation of the acoustic absorber | 30 mm | 40 mm | 50 mm |
| Interested frequency range | 700–1000 Hz | 600–900 Hz | 500–800 Hz |
| Required sound absorption performance | ≥0.80 | ≥0.85 | ≥0.85 |
| Average sound absorption coefficient | maximum | maximum | maximum |
| Condition–1 | Condition–2 | Condition–3 | ||||||
|---|---|---|---|---|---|---|---|---|
| Parameters | Absorption Peak | Parameters | Absorption Peak | Parameters | Absorption Peak | |||
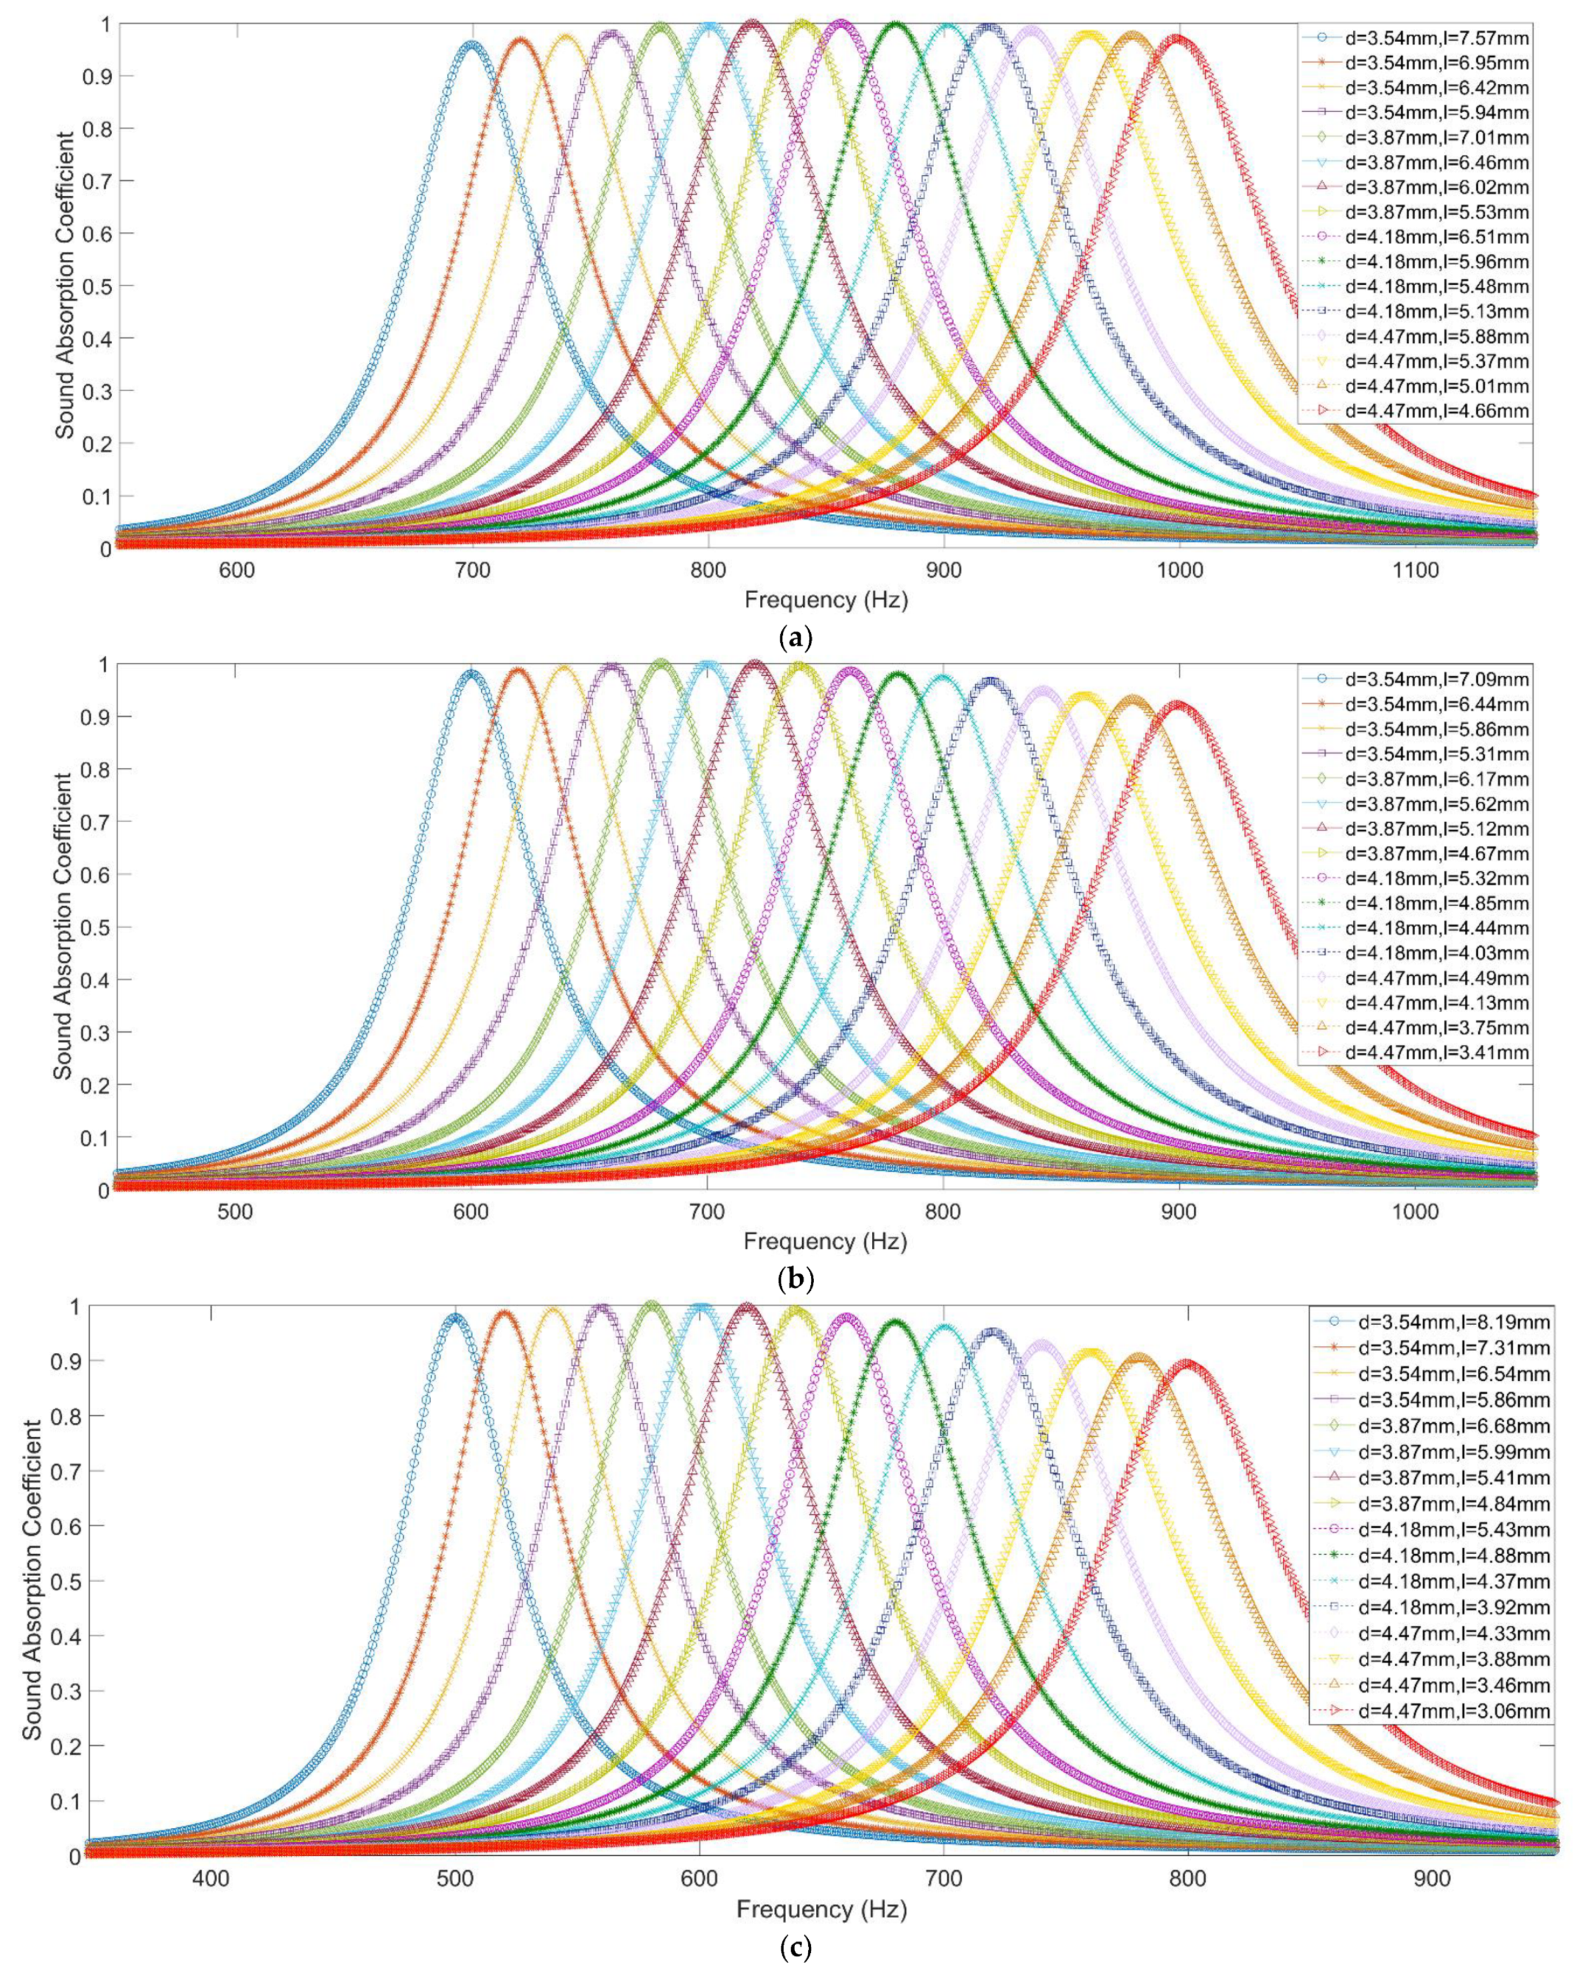
| 7.57 | 700 Hz | 7.09 | 600 Hz | 8.19 | 500 Hz | |||
| 6.95 | 720 Hz | 6.44 | 620 Hz | 7.31 | 520 Hz | |||
| 6.42 | 740 Hz | 5.86 | 640 Hz | 6.54 | 540 Hz | |||
| 5.94 | 760 Hz | 5.31 | 660 Hz | 5.86 | 560 Hz | |||
| 7.01 | 780 Hz | 6.17 | 680 Hz | 6.68 | 580 Hz | |||
| 6.46 | 800 Hz | 5.62 | 700 Hz | 5.99 | 600 Hz | |||
| 6.02 | 820 Hz | 5.12 | 720 Hz | 5.41 | 620 Hz | |||
| 5.53 | 840 Hz | 4.67 | 740 Hz | 4.84 | 640 Hz | |||
| 6.51 | 860 Hz | 5.32 | 760 Hz | 5.43 | 660 Hz | |||
| 5.96 | 880 Hz | 4.85 | 780 Hz | 4.88 | 680 Hz | |||
| 5.48 | 900 Hz | 4.44 | 800 Hz | 4.37 | 700 Hz | |||
| 5.13 | 920 Hz | 4.03 | 820 Hz | 3.92 | 720 Hz | |||
| 5.88 | 940 Hz | 4.49 | 840 Hz | 4.33 | 740 Hz | |||
| 5.37 | 960 Hz | 4.13 | 860 Hz | 3.88 | 760 Hz | |||
| 5.01 | 980 Hz | 3.75 | 880 Hz | 3.46 | 780 Hz | |||
| 4.66 | 1000 Hz | 3.41 | 900 Hz | 3.06 | 800 Hz | |||
| Condition–1 | Condition–2 | Condition–3 | ||||||
|---|---|---|---|---|---|---|---|---|
| Parameters | Absorption Peak | Parameters | Absorption Peak | Parameters | Absorption Peak | |||
| 7.41 | 705 Hz | 8.08 | 574 Hz | 8.92 | 485 Hz | |||
| 6.92 | 721 Hz | 7.47 | 589 Hz | 8.41 | 495 Hz | |||
| 6.43 | 739 Hz | 6.86 | 607 Hz | 7.93 | 506 Hz | |||
| 5.92 | 759 Hz | 6.23 | 627 Hz | 7.44 | 517 Hz | |||
| 9.11 | 714 Hz | 8.36 | 616 Hz | 8.81 | 529 Hz | |||
| 7.84 | 751 Hz | 7.37 | 642 Hz | 8.02 | 546 Hz | |||
| 6.32 | 806 Hz | 6.36 | 674 Hz | 7.21 | 566 Hz | |||
| 5.23 | 854 Hz | 5.39 | 709 Hz | 6.43 | 587 Hz | |||
| 8.13 | 798 Hz | 6.84 | 705 Hz | 6.92 | 614 Hz | |||
| 7.04 | 835 Hz | 5.88 | 739 Hz | 5.91 | 644 Hz | |||
| 6.02 | 877 Hz | 4.86 | 780 Hz | 4.93 | 678 Hz | |||
| 5.01 | 925 Hz | 3.85 | 830 Hz | 3.94 | 719 Hz | |||
| 6.12 | 926 Hz | 4.74 | 830 Hz | 4.82 | 720 Hz | |||
| 5.24 | 968 Hz | 3.92 | 871 Hz | 3.84 | 762 Hz | |||
| 4.31 | 1020 Hz | 3.11 | 918 Hz | 2.81 | 814 Hz | |||
| 3.83 | 1050 Hz | 2.52 | 957 Hz | 2.53 | 829 Hz | |||
| Condition Serial | Interested Frequency Range | Average Absolute Deviations | |
|---|---|---|---|
| For simulation Data | For Theoretical Data | ||
| Condition–1 | 700–1000 Hz | 0.0571 | 0.1086 |
| Condition–2 | 600–900 Hz | 0.0685 | 0.1305 |
| Condition–3 | 500–800 Hz | 0.0553 | 0.1147 |
Publisher’s Note: MDPI stays neutral with regard to jurisdictional claims in published maps and institutional affiliations. |
© 2022 by the authors. Licensee MDPI, Basel, Switzerland. This article is an open access article distributed under the terms and conditions of the Creative Commons Attribution (CC BY) license (https://creativecommons.org/licenses/by/4.0/).
Share and Cite
Wang, E.; Yang, F.; Shen, X.; Duan, H.; Zhang, X.; Yin, Q.; Peng, W.; Yang, X.; Yang, L. Development and Optimization of Broadband Acoustic Metamaterial Absorber Based on Parallel–Connection Square Helmholtz Resonators. Materials 2022, 15, 3417. https://doi.org/10.3390/ma15103417
Wang E, Yang F, Shen X, Duan H, Zhang X, Yin Q, Peng W, Yang X, Yang L. Development and Optimization of Broadband Acoustic Metamaterial Absorber Based on Parallel–Connection Square Helmholtz Resonators. Materials. 2022; 15(10):3417. https://doi.org/10.3390/ma15103417
Chicago/Turabian StyleWang, Enshuai, Fei Yang, Xinmin Shen, Haiqin Duan, Xiaonan Zhang, Qin Yin, Wenqiang Peng, Xiaocui Yang, and Liu Yang. 2022. "Development and Optimization of Broadband Acoustic Metamaterial Absorber Based on Parallel–Connection Square Helmholtz Resonators" Materials 15, no. 10: 3417. https://doi.org/10.3390/ma15103417
APA StyleWang, E., Yang, F., Shen, X., Duan, H., Zhang, X., Yin, Q., Peng, W., Yang, X., & Yang, L. (2022). Development and Optimization of Broadband Acoustic Metamaterial Absorber Based on Parallel–Connection Square Helmholtz Resonators. Materials, 15(10), 3417. https://doi.org/10.3390/ma15103417