
The Influence of Surface Preparation, Chewing Simulation, and Thermal Cycling on the Phase Composition of Dental Zirconia


Abstract
1. Introduction
2. Materials and Methods
2.1. Materials
2.2. Methods
2.2.1. Confocal Laser Scanning Microscopy (CLSM)
2.2.2. X-ray Diffraction (XRD)
- (a)
- Semi quantitative phase analyses (XRD).
- (b)
- Rietveld refinement.
3. Results
3.1. Surface Roughness
3.2. X-ray Diffraction (XRD)
- (a)
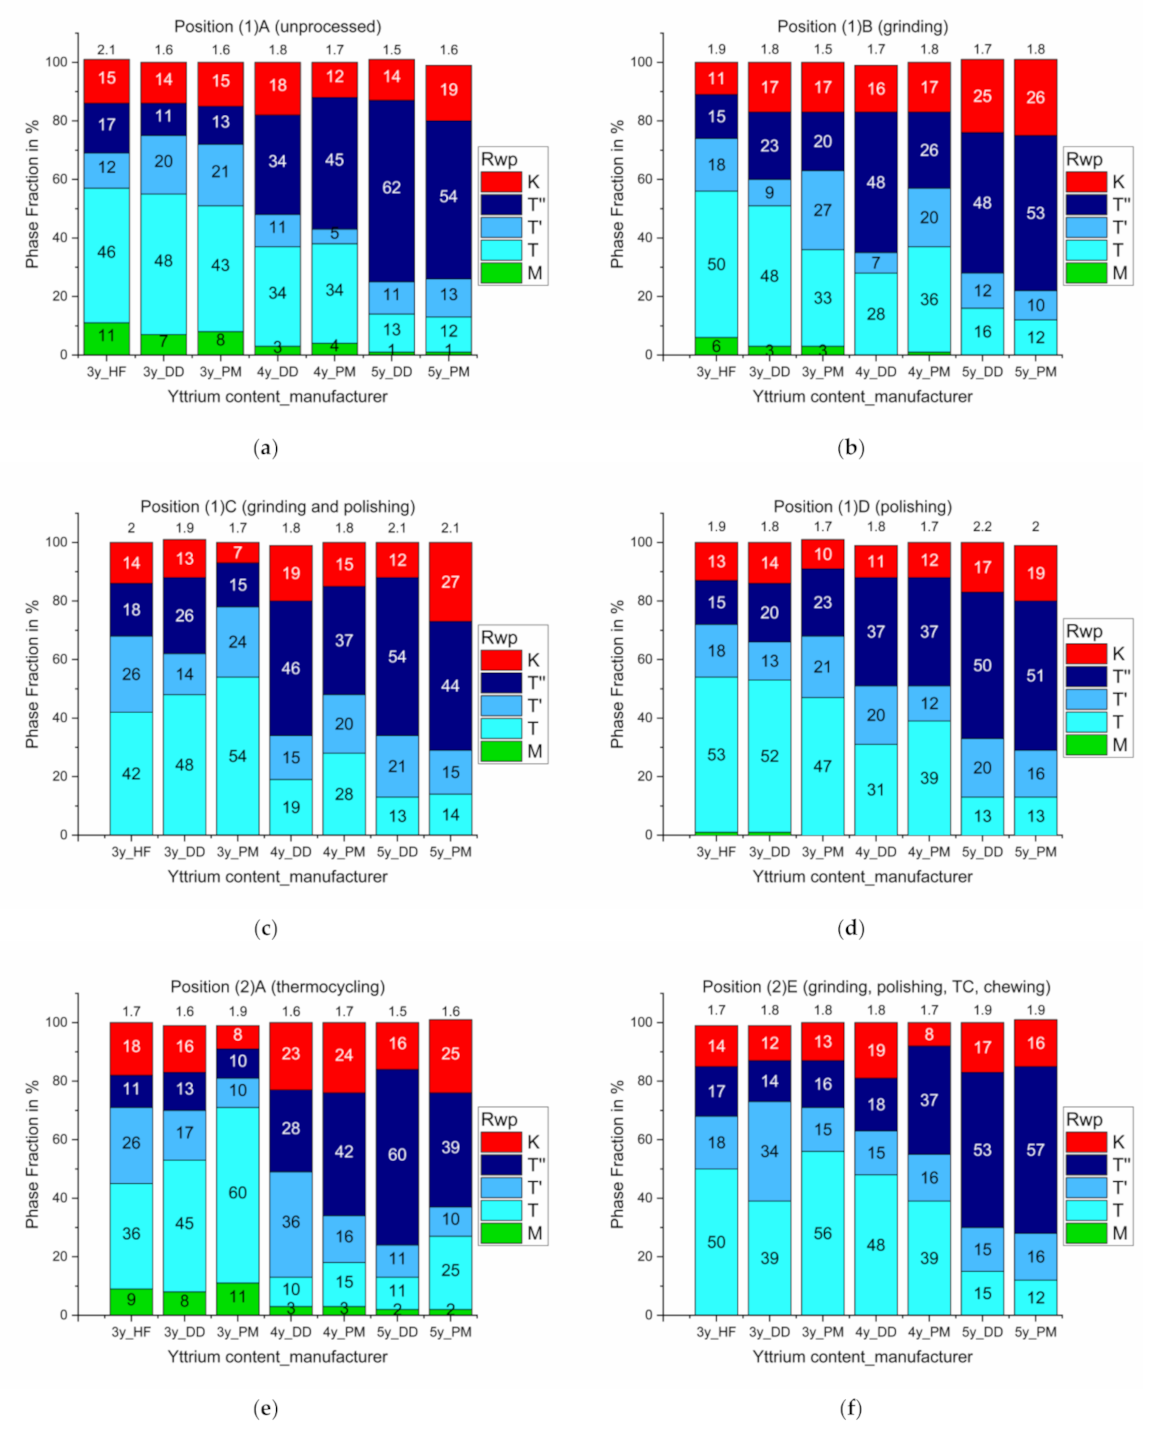
- Semi quantitative phase analyses (XRD)
- (b)
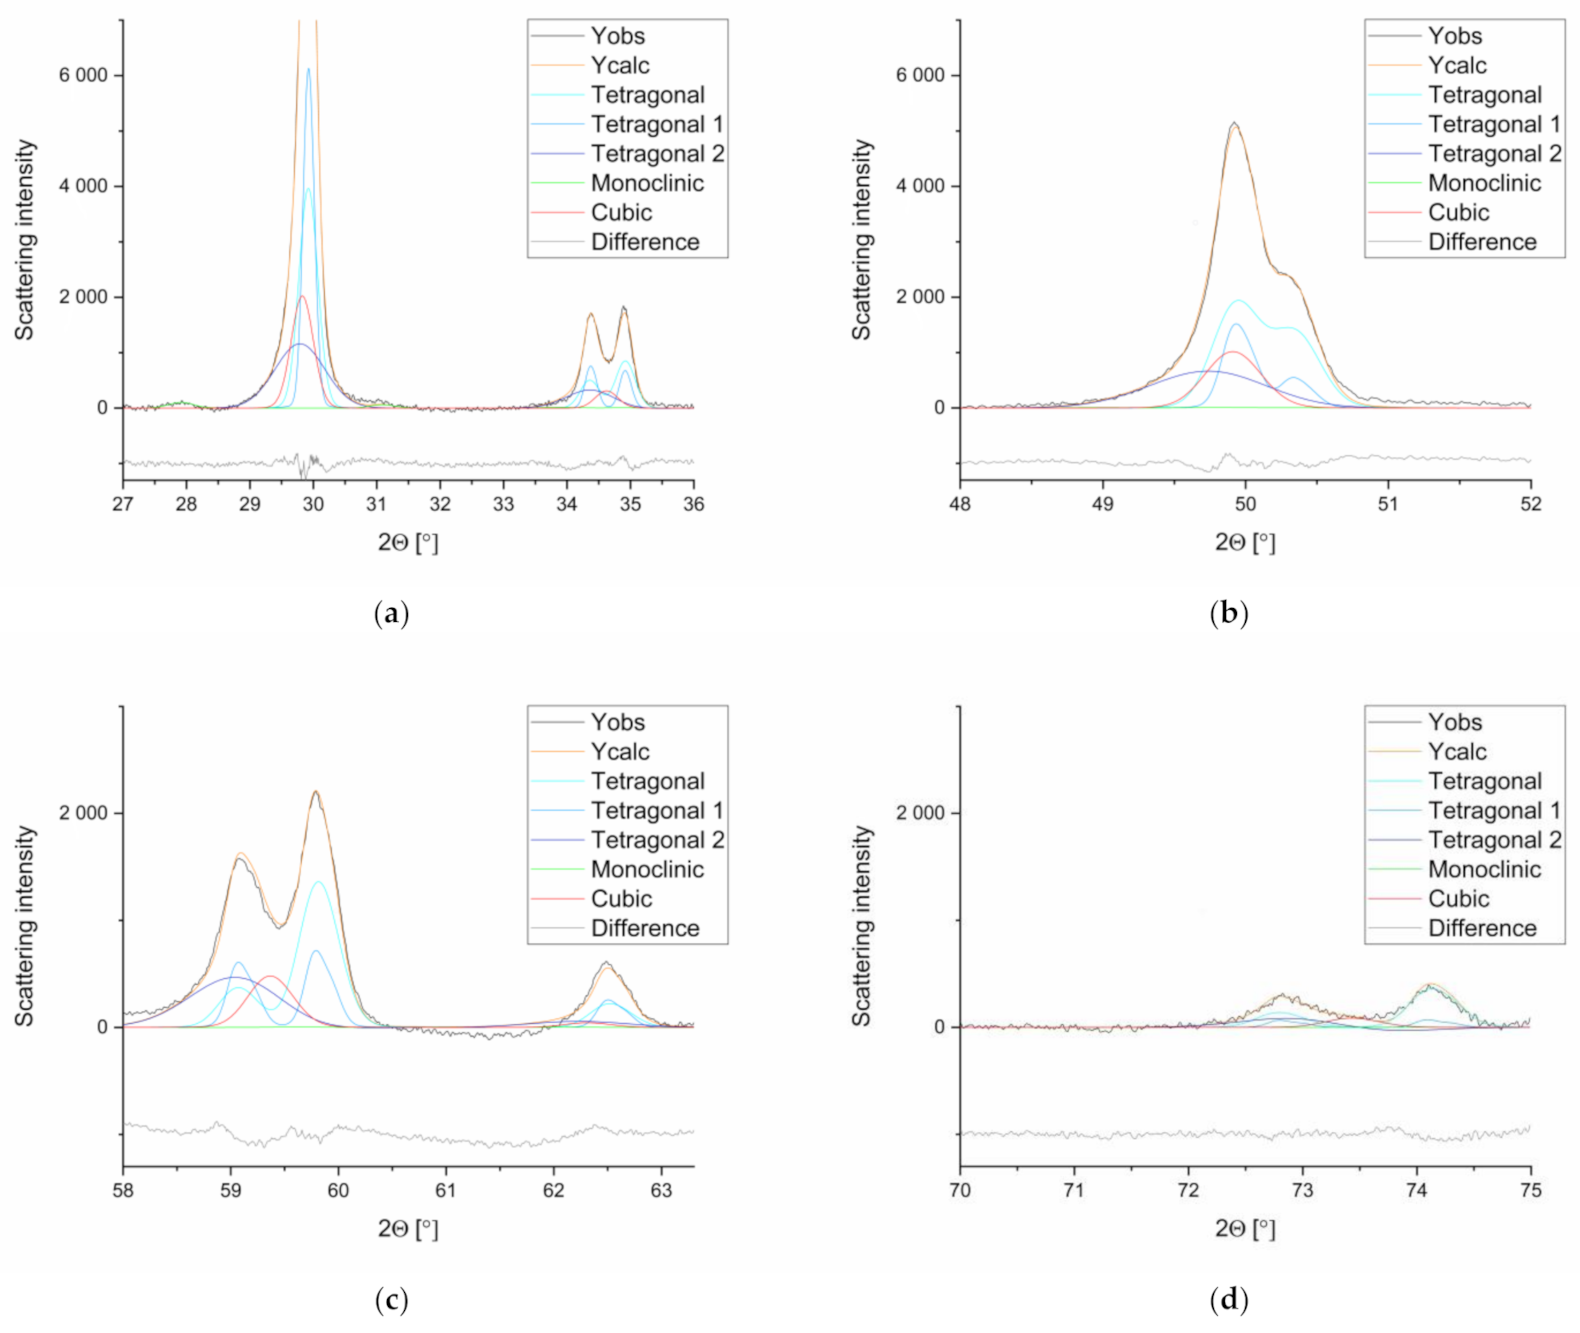
- Rietveld refinement
4. Discussion
5. Conclusions
- (1)
- X-ray diffraction (XRD) is a suitable method for analyzing the phase composition of yttria-stabilized zirconia.
- (2)
- Mechanical processing partly (grinding) or completely (polishing and chewing) transforms the monoclinic phase into the tetragonal phase in all specimens investigated. Low-temperature degradation was not observed in the current study.
- (3)
- The composition of the tetragonal phase is dependent on the yttria content. In specimens with a content of 3 mol% yttria, the tetragonal phase t was preferred, while in specimens with a content of 5 mol% yttria, the tetragonal phase t″ was preferred.
- (4)
Author Contributions
Funding
Institutional Review Board Statement
Informed Consent Statement
Data Availability Statement
Acknowledgments
Conflicts of Interest
Appendix A
- z-score:
- p-value:
- r-value:

| Measurement Point | Z | p | r |
|---|---|---|---|
| AB | −2.440 | =0.147 | - |
| AC | 5.254 | <0.000 ** | 0.47 |
| AD | 2.799 | =0.051 | - |
| AE | 6.585 | <0.000 ** | 0.59 |
| BC | 7.694 | <0.000 ** | 0.69 |
| BD | 5.239 | <0.000 ** | 0.47 |
| BE | 9.025 | <0.000 ** | 0.81 |
| CD | −2.455 | =0.141 | - |
| CE | 1.331 | >1.000 | - |
| DE | 3.787 | =0.002 * | 0.34 |
| Measurement Point | Z | p | r |
|---|---|---|---|
| AB | −2.459 | =0.139 | - |
| AC | 4.481 | <0.000 ** | 0.40 |
| AD | 4.007 | =0.001 * | 0.36 |
| AE | 6.053 | <0.000 ** | 0.54 |
| BC | 6.941 | <0.000 ** | 0.62 |
| BD | 6.466 | <0.000 ** | 0.58 |
| BE | 8.512 | <0.000 ** | 0.76 |
| CD | −0.474 | >1.000 | - |
| CE | 1.571 | >1.000 | - |
| DE | 2.046 | =0.408 | - |
| Measurement Point | Z | p | r |
|---|---|---|---|
| AE | 0.015 | =0.147 | - |
| AC | 3.377 | =0.007 * | 0.30 |
| AD | 5.652 | <0.000 ** | 0.51 |
| AE | 5.609 | <0.000 ** | 0.50 |
| BC | 5.816 | <0.000 ** | 0.52 |
| BD | 8.092 | <0.000 ** | 0.72 |
| BE | 8.094 | <0.000 ** | 0.72 |
| CD | 2.276 | =0.229 | - |
| CE | 2.233 | =0.256 | - |
| DE | −0.043 | >1.000 | - |
| Measurement Point | Z | p | r |
|---|---|---|---|
| AB | −2.440 | =0.147 | - |
| AC | 3.111 | =0.019 * | 0.28 |
| AD | 6.695 | <0.000 ** | 0.56 |
| AE | 4.833 | <0.000 ** | 0.43 |
| BC | 5.551 | <0.000 ** | 0.50 |
| BD | 9.134 | <0.000 ** | 0.82 |
| BE | 7.272 | <0.000 ** | 0.65 |
| CD | 3.584 | =0.003 * | 0.32 |
| CE | 1.721 | =0.852 | - |
| DE | −1.862 | =0.626 | - |
| Measurement Point | Z | p | r |
|---|---|---|---|
| AB | −2.440 | =0.147 | - |
| AC | 4.110 | <0.000 ** | 0.37 |
| AD | 3.896 | =0.001 * | 0.35 |
| AE | 6.632 | <0.000 ** | 0.59 |
| BC | 6.550 | <0.000 ** | 0.59 |
| BD | 6.336 | <0.000 ** | 0.57 |
| BE | 9.072 | <0.000 ** | 0.81 |
| CD | −0.215 | >1.000 | - |
| CE | 2.522 | =0.117 | - |
| DE | 2.736 | =0.062 | - |
| Measurement Point | Z | p | r |
|---|---|---|---|
| AB | −2.440 | =0.147 | - |
| AC | 3.466 | =0.001 * | 0.31 |
| AD | 5.141 | <0.000 ** | 0.46 |
| AE | 6.031 | <0.000 ** | 0.54 |
| BC | 5.906 | <0.000 ** | 0.53 |
| BD | 7.581 | <0.000 ** | 0.68 |
| BE | 8.471 | <0.000 ** | 0.76 |
| CD | 1.675 | =0.940 | - |
| CE | 2.565 | =0.103 | - |
| DE | 0.890 | >1.000 | - |
| Measurement Point | Z | p | r |
|---|---|---|---|
| AB | −2.440 | =0.147 | - |
| AC | 3.724 | =0.002 * | 0.33 |
| AD | 5.805 | <0.000 ** | 0.52 |
| AE | 5.110 | <0.000 ** | 0.46 |
| BC | 6.164 | <0.000 ** | 0.55 |
| BD | 8.244 | <0.000 ** | 0.74 |
| BE | 7.550 | <0.000 ** | 0.68 |
| CD | 2.081 | =0.375 | - |
| CE | 1.386 | >1.000 | - |
| DE | −0.695 | >1.000 | - |
References
- Kolakarnprasert, N.; Kaizer, M.R.; Kim, D.K.; Zhang, Y. New multi-layered zirconias: Composition, microstructure and translucency. Dent. Mater. 2019, 35, 797–806. [Google Scholar] [CrossRef] [PubMed]
- Vila-Nova, T.E.L.; De Carvalho, I.H.G.; Moura, D.M.D.; Batista, A.U.D.; Zhang, Y.; Paskocimas, C.A.; Bottino, M.A.; Souza, R.O.D.A.E.; Gurgel, I.H. Effect of finishing/polishing techniques and low temperature degradation on the surface topography, phase transformation and flexural strength of ultra-translucent ZrO2 ceramic. Dent. Mater. 2020, 36, e126–e139. [Google Scholar] [CrossRef] [PubMed]
- Shen, J.; Xie, H.; Wu, X.; Yang, J.; Liao, M.; Chen, C. Evaluation of the effect of low-temperature degradation on the translucency and mechanical properties of ultra-transparent 5Y-TZP ceramics. Ceram. Int. 2020, 46, 553–559. [Google Scholar] [CrossRef]
- Garvie, R.C.; Hannink, R.H.; Pascoe, R.T. Ceramic steel? Nat. Cell Biol. 1975, 258, 703–704. [Google Scholar] [CrossRef]
- Zhang, Y.; Lawn, B.R. Novel zirconia materials in dentistry. J. Dent. Res. 2018, 97, 140–147. [Google Scholar] [CrossRef]
- Kelly, J.R.; Denry, I. Stabilized zirconia as a structural ceramic: An overview. Dent. Mater. 2008, 24, 289–298. [Google Scholar] [CrossRef]
- Pecho, O.E.; Ghinea, R.; Ionescu, A.M.; La Cardona, J.C.; Paravina, R.D.; Pérez, M.M. Color and translucency of zirconia ceramics, human dentine and bovine dentine. J. Dent. 2012, 40, e34–e40. [Google Scholar] [CrossRef]
- Baldissara, P. Translucency of zirconia copings made with different CAD/CAM systems. J. Prosthet. Dent. 2010, 104, 6–12. [Google Scholar] [CrossRef]
- Kelly, J.R.; Cesar, P.F.; Scherrer, S.S.; Della Bona, A.; van Noort, R.; Tholey, M.; Vichi, A.; Lohbauer, U. ADM guidance-ceramics: Fatigue principles and testing. Dent. Mater. 2017, 33, 1192–1204. [Google Scholar] [CrossRef]
- Weber, B.C. Observations on the stabilization of zirconia. J. Am. Ceram. Soc. 1956, 56, 197–206. [Google Scholar] [CrossRef]
- Fabris, S. A stabilization mechanism of zirconia based on oxygen vacancies only. Acta Mater. 2002, 50, 5171–5178. [Google Scholar] [CrossRef]
- Penner-Hahn, J.P.L. Effect of dopants on zirconia stabilization—An X-ray absorption study: II, tetravalent dopants. J. Am. Ceram. Soc. 1994, 5, 1281–1288. [Google Scholar]
- Howard, C.J.; Hill, R.J. The polymorphs of zirconia: Phase abundance and crystal structure by Rietveld analysis of neutron and X-ray diffraction data. J. Mater. Sci. 1991, 26, 127–134. [Google Scholar] [CrossRef]
- Keuper, M.; Berthold, C.; Nickel, K.G. Long-time aging in 3 mol.% yttria-stabilized tetragonal zirconia polycrystals at human body temperature. Acta Biomater. 2014, 10, 951–959. [Google Scholar] [CrossRef]
- Lughi, V.; Sergo, V. Low temperature degradation-aging-of zirconia: A critical review of the relevant aspects in dentistry. Dent. Mater. 2010, 26, 807–820. [Google Scholar] [CrossRef]
- Tholey, M.J.; Berthold, C.; Swain, M.V.; Thiel, N. XRD2 Micro-diffraction analysis of the interface between Y-TZP and veneering porcelain: Role of application methods. Dent. Mater. 2010, 26, 545–552. [Google Scholar] [CrossRef]
- Edalati, K.; Toh, S.; Ikoma, Y.; Horita, Z. Plastic deformation and allotropic phase transformations in zirconia ceramics during high-pressure torsion. Scr. Mater. 2011, 65, 974–977. [Google Scholar] [CrossRef]
- Chevalier, J.; Cales, B.; Drouin, J.M. Low-temperature aging of Y-TZP ceramics. J. Am. Ceram. Soc. 2004, 82, 2150–2154. [Google Scholar] [CrossRef]
- Masonis, J.L.; Bourne, R.B.; Ries, M.D.; McCalden, R.W.; Salehi, A.; Kelman, D.C. Zirconia femoral head fractures: A clinical and retrieval analysis. J. Arthroplast. 2004, 19, 898–905. [Google Scholar] [CrossRef]
- Gahlert, M.; Burtscher, D.; Grunert, I.; Kniha, H.; Steinhauser, E. Failure analysis of fractured dental zirconia implants. Clin. Oral Implants Res. 2012, 23, 287–293. [Google Scholar] [CrossRef]
- Hashim, D.; Cionca, N.; Courvoisier, D.S.; Mombelli, A. A systematic review of the clinical survival of zirconia implants. Clin. Oral Investig. 2016, 20, 1403–1417. [Google Scholar] [CrossRef]
- Kisi, E.H.; Howard, C.J. Crystal structures of zirconia phases and their inter-relation. Key Eng. Mater. 1998, 153–154, 1–36. [Google Scholar] [CrossRef]
- Krogstad, J.A.; Gao, Y.; Bai, J.; Wang, J.; Lipkin, D.M.; Levi, C.G. In situ diffraction study of the high-temperature decomposition of t′ -Zirconia. J. Am. Ceram. Soc. 2015, 98, 247–254. [Google Scholar] [CrossRef]
- Lipkin, D.M.; Krogstad, J.A.; Gao, Y.; Johnson, C.A.; Nelson, W.A.; Levi, C.G. Phase Evolution upon Aging of Air-Plasma Sprayed t′-zirconia coatings: I-synchrotron X-ray diffraction. J. Am. Ceram. Soc. 2013, 96, 290–298. [Google Scholar] [CrossRef]
- Yashima, M.; Sasaki, S.; Kakihana, M.; Yamaguchi, Y.; Arashi, H.; Yoshimura, M. Oxygen-induced structural change of the tetragonal phase around the tetragonal–cubic phase boundary in ZrO2–YO1.5 solid solutions. Acta Crystallogr. B 1995, 51, 381. [Google Scholar] [CrossRef]
- Duwez, P.; Brown, F.H.; Odell, F. The zirconia-yttria system. J. Electrochem. Soc. 1951, 98, 356–362. [Google Scholar] [CrossRef]
- Scott, H.G. Phase relationships in the zirconia-yttria system. J. Mater. Sci. 1975, 10, 1527–1535. [Google Scholar] [CrossRef]
- Lange, F.F. Transformation toughening: Part 1 size effects associated with the thermodynamics of constrained transformations. J. Mater. Sci. 1982, 17, 225–234. [Google Scholar] [CrossRef]
- Botelho, M.G.; Dangay, S.; Shih, K.; Lam, W.Y.H. The effect of surface treatments on dental zirconia: An analysis of biaxial flexural strength, surface roughness and phase transformation. J. Dent. 2018, 75, 65–73. [Google Scholar] [CrossRef] [PubMed]
- Shapiro, S.S.; Wilks, M.B. An analysis of variance test for normality (complete samples). Biometrika 1965, 52, 591–611. [Google Scholar] [CrossRef]
- Kruskal, W.; Wallis, A. Use of ranks in one-criterion variance analysis. J. Am. Stat. Assoc. 1952, 47, 583–621. [Google Scholar] [CrossRef]
- Dunn, O.J. Multiple comparisons among means. J. Am. Stat. Assoc. 1961, 56, 52–64. [Google Scholar] [CrossRef]
- Bonferroni, C.E. Teoria statistica delle classi e calcolo delle probabilit. Pubbl. R Ist. Super. Sci. Econ. Commer. Firenze 1936, 8, 3–62. [Google Scholar]
- Cohen, J. Statistical Power Analysis for the Behavioral Sciences; Erlbaum: Hillsdale, NJ, USA, 1988. [Google Scholar]
- Rosenthal, R.; DiMatteo, M.R. Meta-Analysis: Recent Developments in Quantitative Methods for Literature Reviews; Erlbaum: Hillsdale, NJ, USA, 2001. [Google Scholar]
- Tobias, K. Einfluss Externer Spannungen auf Phasenumwandlungen in Tetragonalem Zirconiumdioxid. Ph.D. Thesis, Eberhard Karls Universität, Tübingen, Germany, 2017. [Google Scholar]
- DIN EN ISO. DIN EN ISO 13356—Chirurgische Implantate-Keramische Werkstoffe aus Yttriumstabilisiertem Tetragonalem Zirkoniumoxid (Y-TZP); Deutsches Institut für Normung: Berlin, Germany, 2016. [Google Scholar]
- Garvie, R.C.; Nicholson, P.S. Phase analysis in zirconia systems. J. Am. Ceram. Soc. 1972, 6, 303–305. [Google Scholar] [CrossRef]
- Toraya, H. Calibration curve for quantitative analysis of the monoclinic-tetragonal ZrO2 System by X-ray diffraction. J. Am. Ceram. Soc. 1984, 6, 119–121. [Google Scholar]
- Guazzato, M.; Quach, L.; Albakry, M.; Swain, M.V. Influence of surface and heat treatments on the flexural strength of Y-TZP dental ceramic. J. Dent. 2005, 33, 9–18. [Google Scholar] [CrossRef]
- Keuper, M.; Eder, K.; Berthold, C.; Nickel, K.G. Direct evidence for continuous linear kinetics in the low-temperature degradation of Y-TZP. Acta Biomater. 2013, 9, 4826–4835. [Google Scholar] [CrossRef]
- Shukla, S.; Seal, S. Mechanisms of room temperature metastable tetragonal phase stabilisation in zirconia. Int. Mater. Rev. 2005, 50, 45–64. [Google Scholar] [CrossRef]
- Block, S. Pressure-temperature phase diagram of zirconia. J. Am. Ceram. Soc. 1985, 9, 497–499. [Google Scholar] [CrossRef]
- Ohtaka, O. Stability of monoclinic and orthorhombic zirconia: Studies by high-pressure phase equilibria and calorimetry. J. Am. Ceram. Soc. 1991, 3, 505–509. [Google Scholar] [CrossRef]
- Schlichting, K.W. Thermal conductivity of dense and porous yttria-stabilized zirconia. J. Mater. Sci. 2001, 36, 3003–3010. [Google Scholar] [CrossRef]
- Badwal, S.P.S. Electrical conductivity of single crystal and polycrystalline yttria-stabilized zirconia. J. Mater. Sci. 1984, 19, 1767–1776. [Google Scholar] [CrossRef]


| Abbreviation | Product | Manufacturer | Yttria Content (mol%) | Flexural Strength (MPa) 1 |
|---|---|---|---|---|
| 3y_PM | Priti multi translucent | PM | 3 | >1150 |
| 3y_HF | DD Bio ZW iso | DD | 3 | >1300 |
| 3y_DD | DD Bio ZX2 | DD | 3 | >1100 |
| 4y_PM | Priti multi extra translucent | PM | 4 | >1150 |
| 4y_DD | DD cube ONE | DD | 4 | >1250 |
| 5y_PM | Priti multi high translucent | PM | 5 | >650 |
| 5y_DD | DD cubeX2 | DD | 5 | >750 |
| Abbreviationof Treatment | Treatment | Number of Cycles |
|---|---|---|
| (1)A | Untreated | - |
| (1)B | Grinding (red ring diamond) | - |
| (1)C | Grinding and polishing | - |
| (1)D | Polishing (polishing kit) | - |
| (2)A | Thermocycling 5–55 °C | 10,000 (2 min each) |
| (2)E | 1. Grinding and polishing | - |
| 2. Chewing simulation | 1.2 × 10⁶ (50 N; 1 Hz; enstatite antagonist) | |
| 3. Thermocycling 5–55 °C | 10,000 (2 min each) |
Publisher’s Note: MDPI stays neutral with regard to jurisdictional claims in published maps and institutional affiliations. |
© 2021 by the authors. Licensee MDPI, Basel, Switzerland. This article is an open access article distributed under the terms and conditions of the Creative Commons Attribution (CC BY) license (https://creativecommons.org/licenses/by/4.0/).
Share and Cite
Wertz, M.; Fuchs, F.; Hoelzig, H.; Wertz, J.M.; Kloess, G.; Hahnel, S.; Rosentritt, M.; Koenig, A. The Influence of Surface Preparation, Chewing Simulation, and Thermal Cycling on the Phase Composition of Dental Zirconia. Materials 2021, 14, 2133. https://doi.org/10.3390/ma14092133
Wertz M, Fuchs F, Hoelzig H, Wertz JM, Kloess G, Hahnel S, Rosentritt M, Koenig A. The Influence of Surface Preparation, Chewing Simulation, and Thermal Cycling on the Phase Composition of Dental Zirconia. Materials. 2021; 14(9):2133. https://doi.org/10.3390/ma14092133
Chicago/Turabian StyleWertz, Markus, Florian Fuchs, Hieronymus Hoelzig, Julia Maria Wertz, Gert Kloess, Sebastian Hahnel, Martin Rosentritt, and Andreas Koenig. 2021. "The Influence of Surface Preparation, Chewing Simulation, and Thermal Cycling on the Phase Composition of Dental Zirconia" Materials 14, no. 9: 2133. https://doi.org/10.3390/ma14092133
APA StyleWertz, M., Fuchs, F., Hoelzig, H., Wertz, J. M., Kloess, G., Hahnel, S., Rosentritt, M., & Koenig, A. (2021). The Influence of Surface Preparation, Chewing Simulation, and Thermal Cycling on the Phase Composition of Dental Zirconia. Materials, 14(9), 2133. https://doi.org/10.3390/ma14092133