Article

Effect of Cement Types and Superabsorbent Polymers on the Properties of Sustainable Ultra-High-Performance Paste

1
Department of Architectural Engineering, Kangwon National University, Chuncheon-si 24341, Korea
2
Department of Integrated Energy and Infra System, Kangwon National University, Chuncheon-si 24341, Korea
3
Department of Architectural Engineering, Hanyang University, Ansan-si 15588, Korea
4
Department of Civil and Environmental Engineering, Hannam University, Daejeon-si 34430, Korea
*
Author to whom correspondence should be addressed.
Materials 2021, 14(6), 1497; https://doi.org/10.3390/ma14061497
Submission received: 24 February 2021 / Revised: 15 March 2021 / Accepted: 16 March 2021 / Published: 18 March 2021
(This article belongs to the Special Issue Sustainable Construction Materials: From Paste to Concrete)

Abstract

:
This study focuses on the effects of superabsorbent polymers (SAP) and belite-rich Portland cement (BPC) on the compressive strength, autogenous shrinkage (AS), and micro- and macroscopic performance of sustainable, ultra-high-performance paste (SUHPP). Several experimental studies were conducted, including compressive strength, AS, isothermal calorimetry, X-ray diffraction (XRD), thermogravimetric analysis (TGA), attenuated total reflectance (ATR)–Fourier-transform infrared spectroscopy (FTIR), ultra-sonic pulse velocity (UPV), and electrical resistivity. The following conclusions can be made based on the experimental results: (1) a small amount of SAP has a strength promotion effect during the first 3 days, while BPC can significantly improve the strength over the following 28 days. (2) SAP slows down the internal relative humidity reduction and effectively reduces the development of AS. BPC specimens show a lower AS than other specimens. The AS shows a linear relationship with the internal relative humidity. (3) Specimens with SAP possess higher cumulative hydration heat than control specimens. The slow hydration rate in the BPC effectively reduces the exothermic heat. (4) With the increase in SAP, the calcium hydroxide (CH) and combined water content increases, and SAP thus improves the effect on cement hydration. The contents of CH and combined water in BPC specimens are lower than those in the ordinary Portland cement (OPC) specimen. (5) All samples display rapid hydration of the cement in the first 3 days, with a high rate of UPV development. Strength is an exponential function of UPVs. (6) The electrical resistivity is reduced due to the increase in porosity caused by the release of water from SAP. From 3 to 28 days, BPC specimens show a greater increment in electrical resistivity than other specimens.

1. Introduction

Ultra-high-performance concrete (UHPC) has a high cementitious material content, low water–cement ratio (w/c), dense microstructure, and very low porosity [1]. Therefore, it has superior mechanical properties and durability performance. To achieve a high-strength and dense structure in UHPC, the mechanical properties and rheology can be improved by adding microfillers [2]. Usually, silica fume is added as a typical reactive powder for UHPC, but this causes autogenous shrinkage (AS) to be high [3]. In addition, limestone fillers and blast-furnace slag are also used to increase UHPC sustainability. The addition of limestone and slag can increase cement’s degree of hydration, improve mechanical strength, and lower CO2 emissions [3,4,5]. In addition, as a result of the extremely low w/c of UHPC, the final hydration value can be less than 50% [6]. AS and autogenous cracking limit the application of UHPC in practical engineering [7].
To effectively promote cement hydration and reduce AS, the internal relative humidity of UHPC can be increased by providing it with additional water [8]. However, the extremely low porosity (very low permeability) of UHPC makes it impossible for water from outside to enter [6]. UHPC was found to be more suitable than the internal curing method for maintenance [9]. Internal curing is the process of mixing and dispersing materials with high water absorption capacity into concrete and gradually releasing water to the surrounding area during the cement’s hydration process [10]. Common internal curing methods are lightweight aggregates (LWA) [11] and SAP [9]. The water absorption ability of SAP is much higher than LWA; consequently, the internal curing efficiency of SAP is higher [12,13]. Moreover, SAP is more conducive to controlling the distribution, shape, and size of defects and pores [14]. For the internal curing of UHPC, SAP can effectively maintain internal relative humidity and reduce AS [15,16,17].
SAP materials have hydrophilic networks that can absorb large amounts of water (other solutions) without being dissolved [18]. Further, SAP absorbs water and swells to form a hydrogel, providing additional water during the concrete hardening process [19]. Liu et al. [20] indicated that SAP, as an internal curing agent, could delay the appearance of cracks and reduce the early AS of UHPC. In composite cement systems with fly ash or slag, the water absorbed/released by SAP has an effective shrinkage reduction [21]. Justs et al. [6] explored the internal curing effect of SAP on UHPC, which reduced shrinkage by around 75% when 2% SAP was added. When SAP is used as an internal curing agent, it can promote hydration to improve the microstructure, but the formation of pores during the release of water also increases the porosity [22] and affects the mechanical properties [7]. Song et al. [23] indicated that SAP mitigated the internal relative humidity drop and was effective in reducing AS, but the strength of the samples was also reduced. In mortars with a w/c of 0.55, the addition of SAP reduces the early strength, but the effect gradually decreases at a later stage [24]. From previous studies, it can be concluded that SAP as an internal curing agent has excellent performance in reducing AS, but with a corresponding reduction in strength.
Although many studies have been conducted to examine SAP internal curing of UHPC, previous studies show some weak points. (1) The binder used in UHPC in previous studies mainly consists of cement and silica fume. The study of sustainable, ultra-high-performance paste (SUHPP) with other SCMs and fillers, such as limestone and slag, was insufficient. Moreover, the internal curing of SUHPP was rarely studied. (2) The cement used in UHPC in previous studies mainly consisted of type I Portland cement. Other types of cement, such as BPC, were seldom used. Compared with OPC, the CO2 emission of BPC is around 10% lower [25]. Moreover, BPC can reduce hydration heat, which is helpful for reducing thermal cracking. Hence, BPC is a sustainable material compared with OPC. In addition, compared with OPC, the rate of hydration of BPC is much slower, which may be helpful for reducing AS in UHPC [26]. In addition, UHPC has a high binder content and experiences a high temperature rise. The utilization of BPC can lower the temperature rise of UHPC. Furthermore, the hydration of C2S in BPC can enhance the late-age strength of UHPC. Due to these advantages of BPC, concrete factories were eager to know whether BPC was suitable for producing UHPC. (3) Previous studies mainly focus on the AS and strength of SAP-blended UHPC. Studies on other aspects have also been insufficient, i.e., studies regarding internal relative humidity and temperature of hardening specimens, strength monitoring with ultrasonic pulse velocity (UPV), and electrical resistivity development.
Therefore, this study focuses on the effect of adding SAP and replacing BPC in SUHPP with silica fume, limestone, and slag. Several experimental studies were conducted, including compressive strength, AS coupled with internal relative humidity and temperature, isothermal calorimetry, X-ray diffraction (XRD), thermogravimetric analysis (TGA), attenuated total reflectance (ATR)–Fourier-transform infrared spectroscopy (FTIR), UPV, and electrical resistivity.
The innovation points of this study can be summarized as follows: First, silica fume, limestone, and slag were used to produce SUHPP. The internal curing effect of SAP on SUHPP was investigated. Second, we clarified the effects of the type of cement on the differences in the performance of SUHPP. Finally, a systematical experimental investigation into hydration, AS, strength, and durability was performed.
The aims of the research questions in our research are (1) to find feasible methods for reducing the AS of SUHPP and to clarify the mechanism of AS in SUHPP; (2) to conduct detailed and various experimental studies on SUHPP containing SAP and BPC and to explore the relations among the various results; and (3) to discuss the strong points and weak points of paste containing SAP or BPC and to determine the expected practical applications of the tested specimens.

2. Materials and Experimental Methods

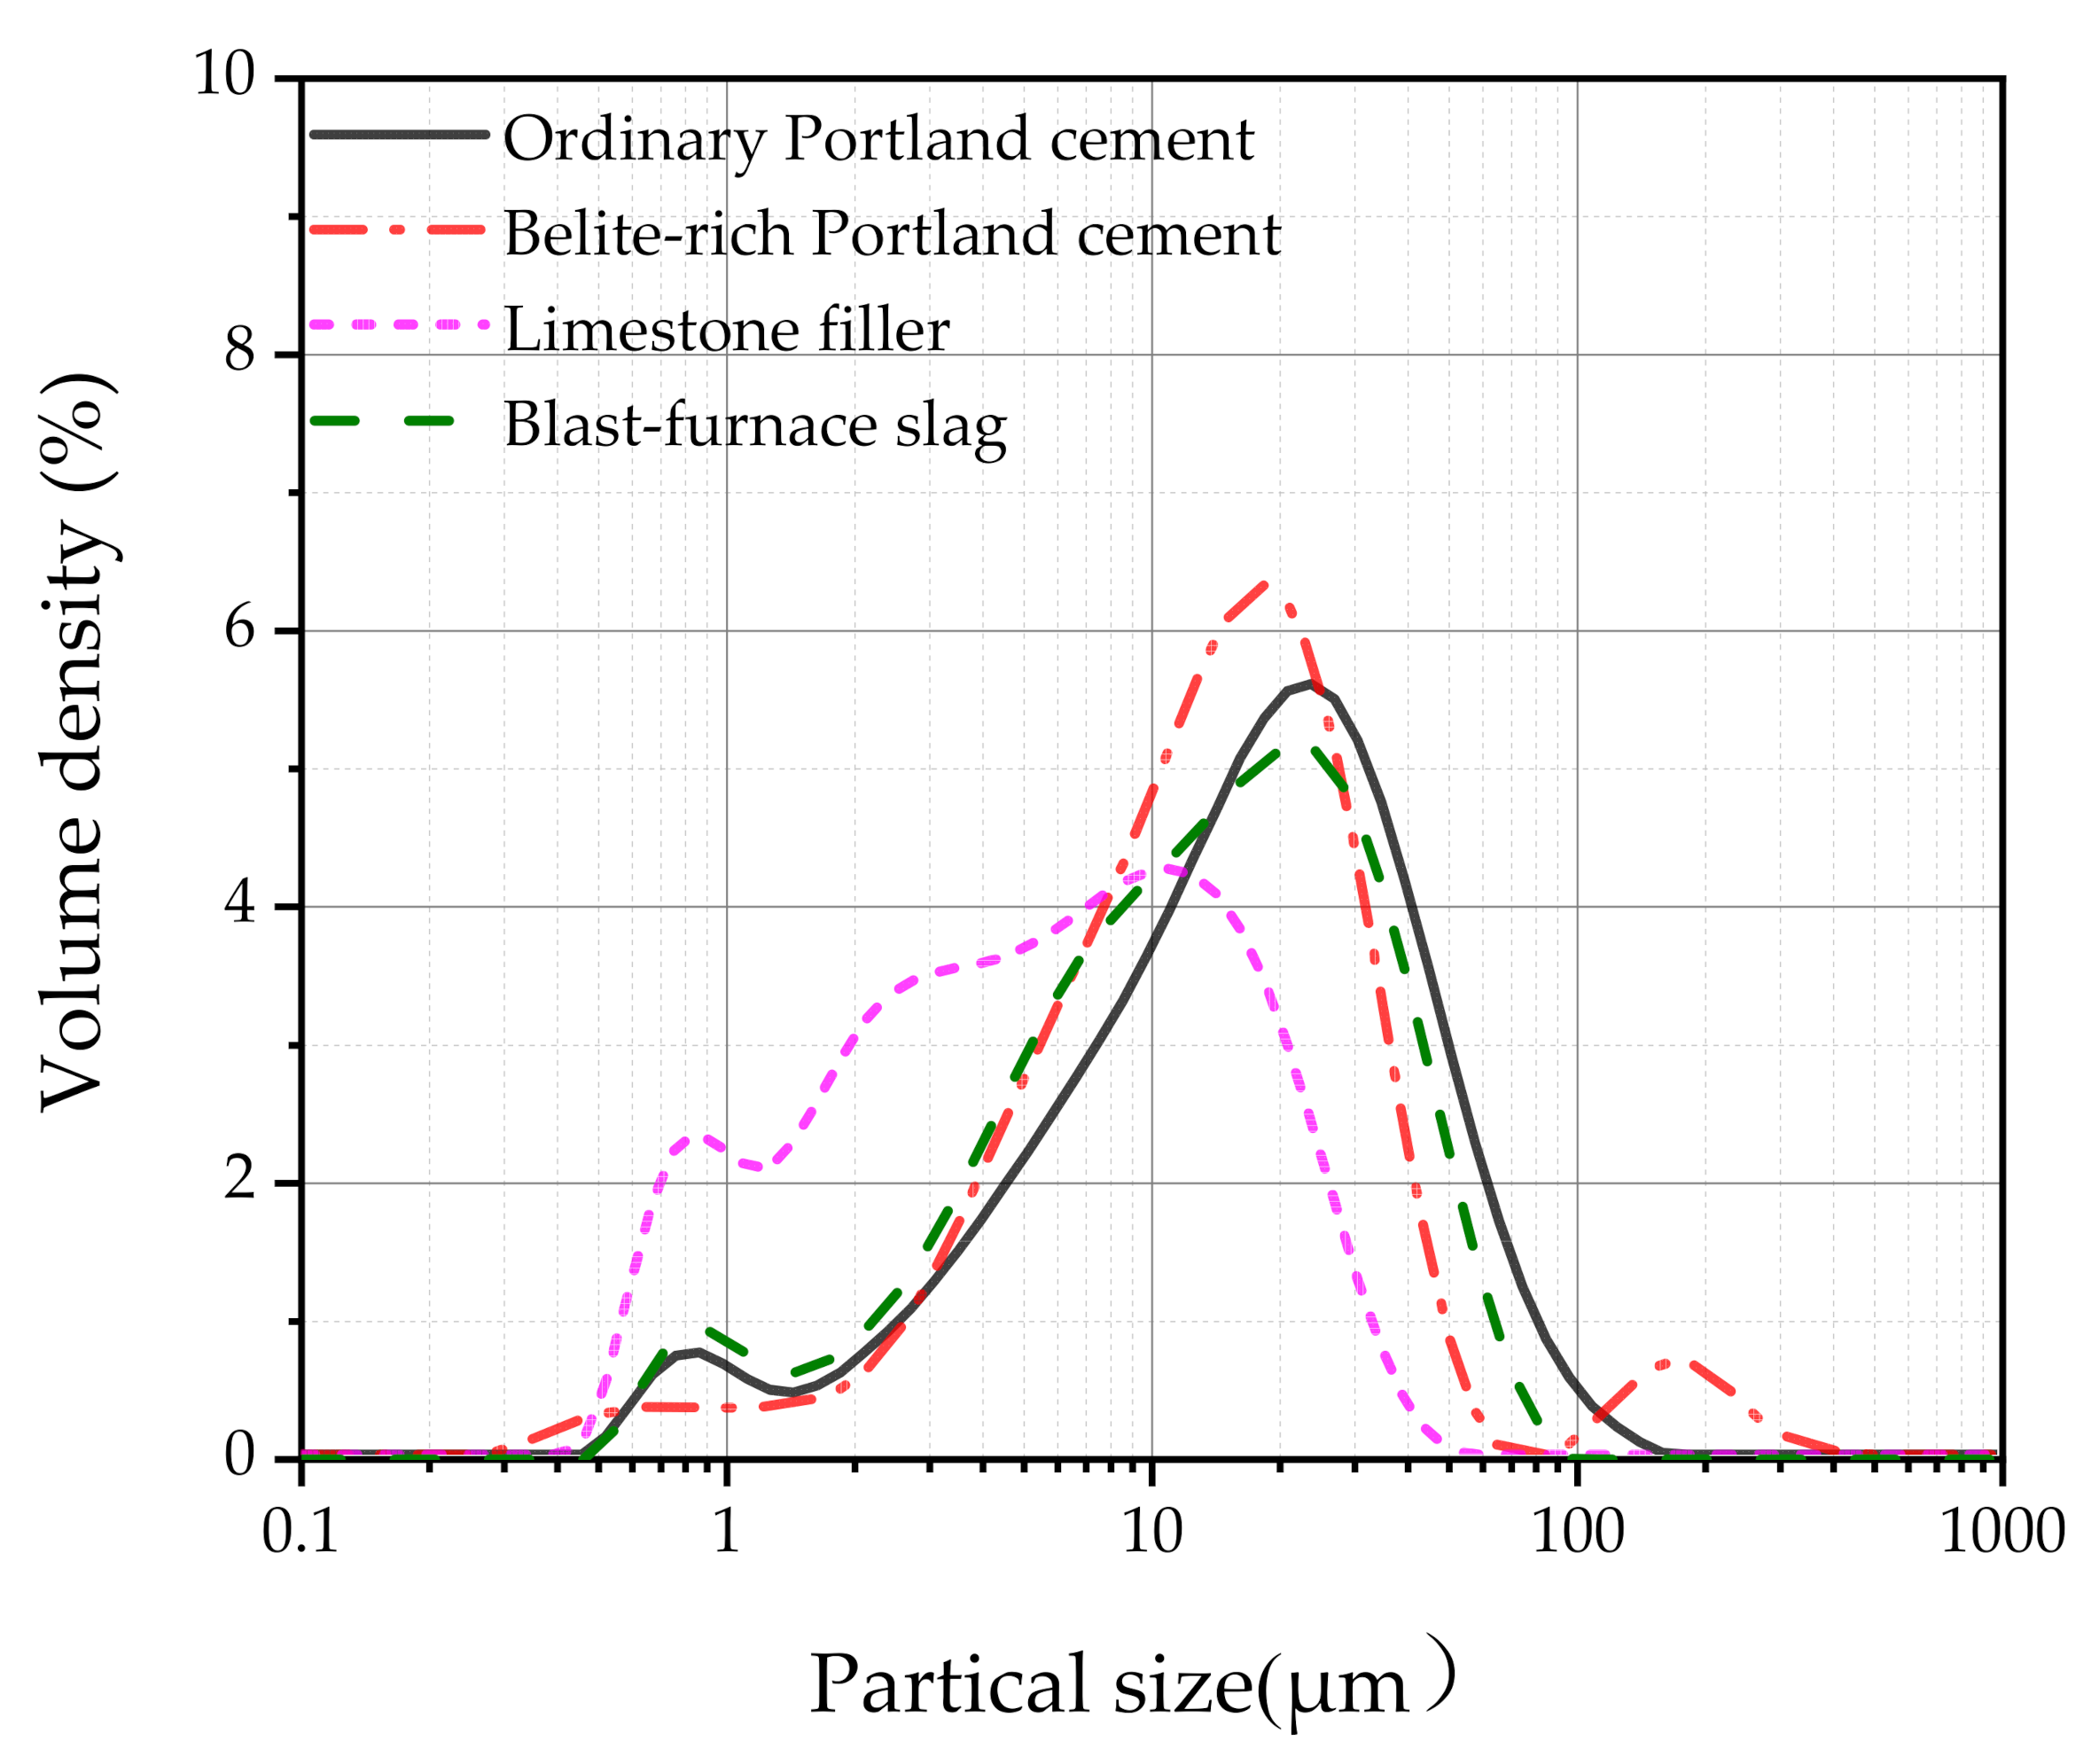
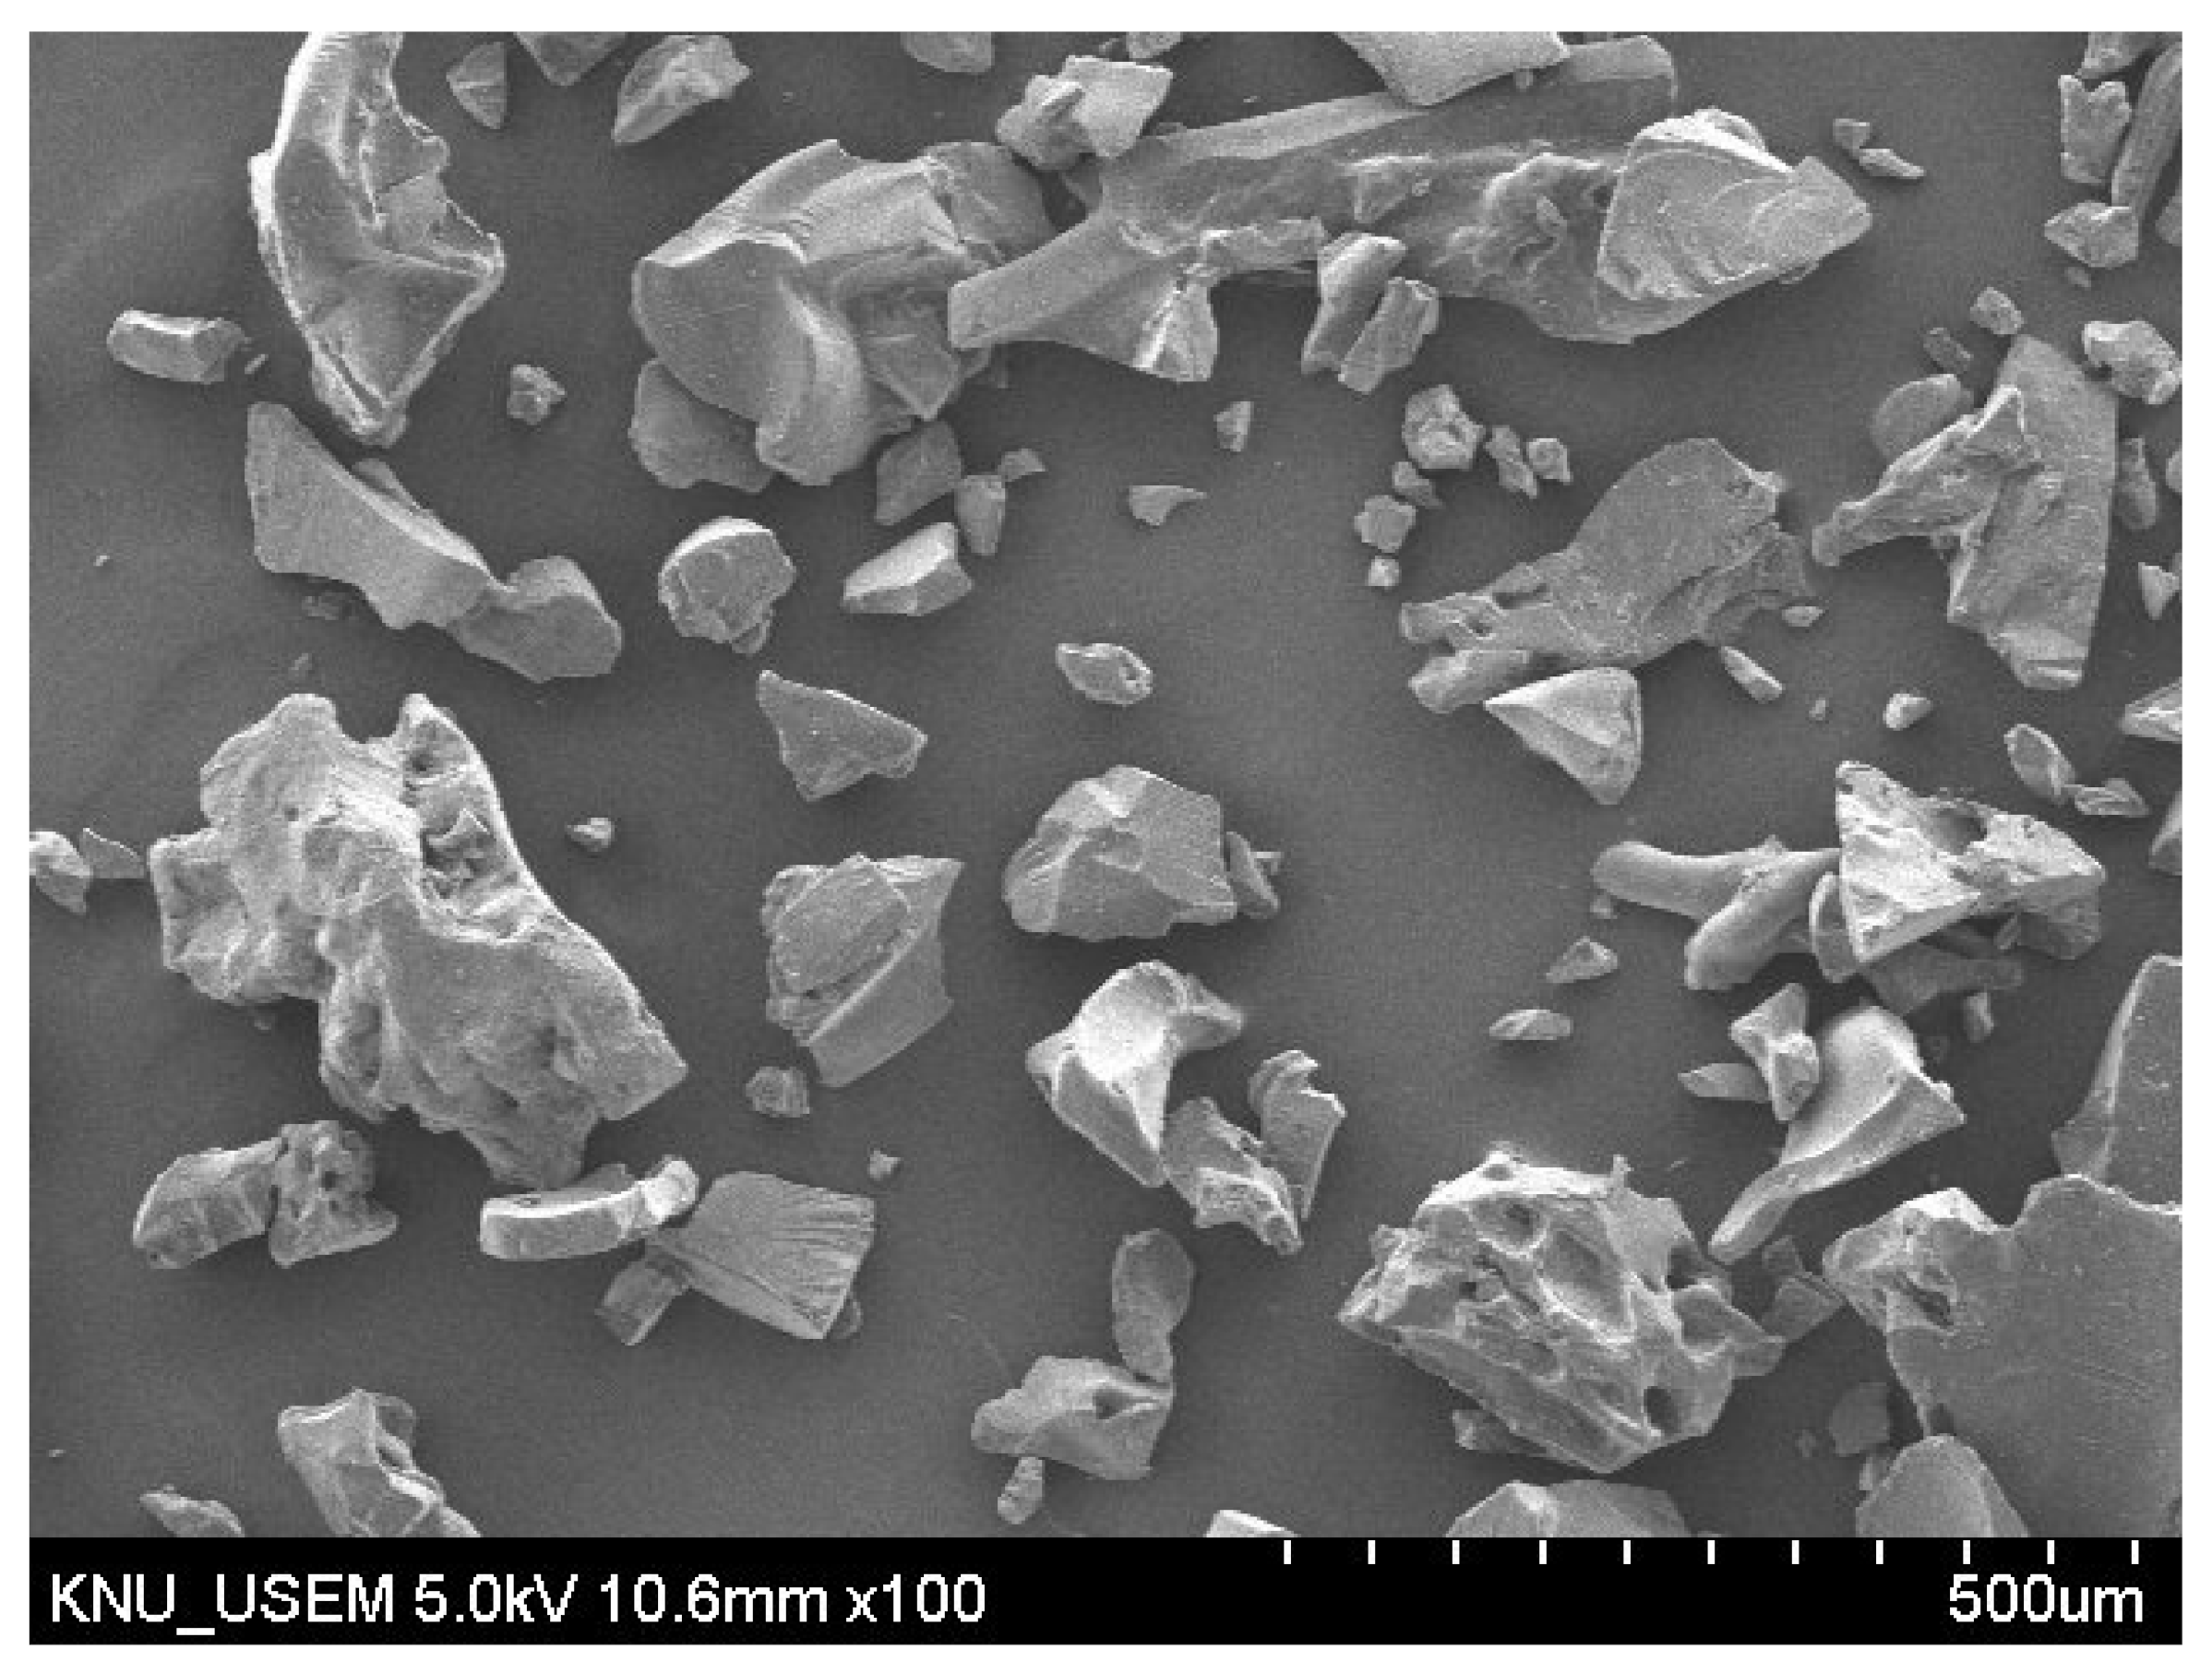
2.1. Material and Ratio Design

In this study, SUHPP was prepared with a fixed water–binder ratio of 0.2. The chemical composition of OPC, BPC, silica fume, limestone, and slag used in mixtures is listed in Table 1. Based on the chemical composition listed in Table 1 and calculated by the Bogue formula, the mineralogical composition of the clinker is shown in Table 2. The particle size distribution of each component is shown in Figure 1. According to Figure 1, the average particle sizes of OPC, BPC, limestone, and slag were 16.4, 14.5, 5.21, and 12.7 μm, respectively. In addition, the water absorption of SAP was measured using the “tea bag” method [27]. In water, the swelling capacity of SAP was equal to 295.5 g/gSAP after 10 min and 291.5 g/gSAP after 12 h. The swelling capacity of SAP in cement paste was much lower than when in water [12]. In cement paste, the swelling capacity of SAP was approximately 10.4 g/gSAP. A scanning electron microscope (SEM) (S-4800, Hitachi, Tokyo, Japan) image of the SAP is shown in Figure 2. In general, SAP particles have an irregular shape.
Regarding the quaternary mixture, the weight ratio of silica fume, limestone, and slag was 1:2:2. As shown in Table 3, the effect of SAP content was studied. We added 0.25% and 0.5% (% by mass of binder) SAP content, respectively. In addition, the effect of the cement type was studied using OPC–0SAP and BPC–0SAP. In order to obtain proper workability, 1.2% (% by mass of binder) by weight of superplasticizer (SP) was added.

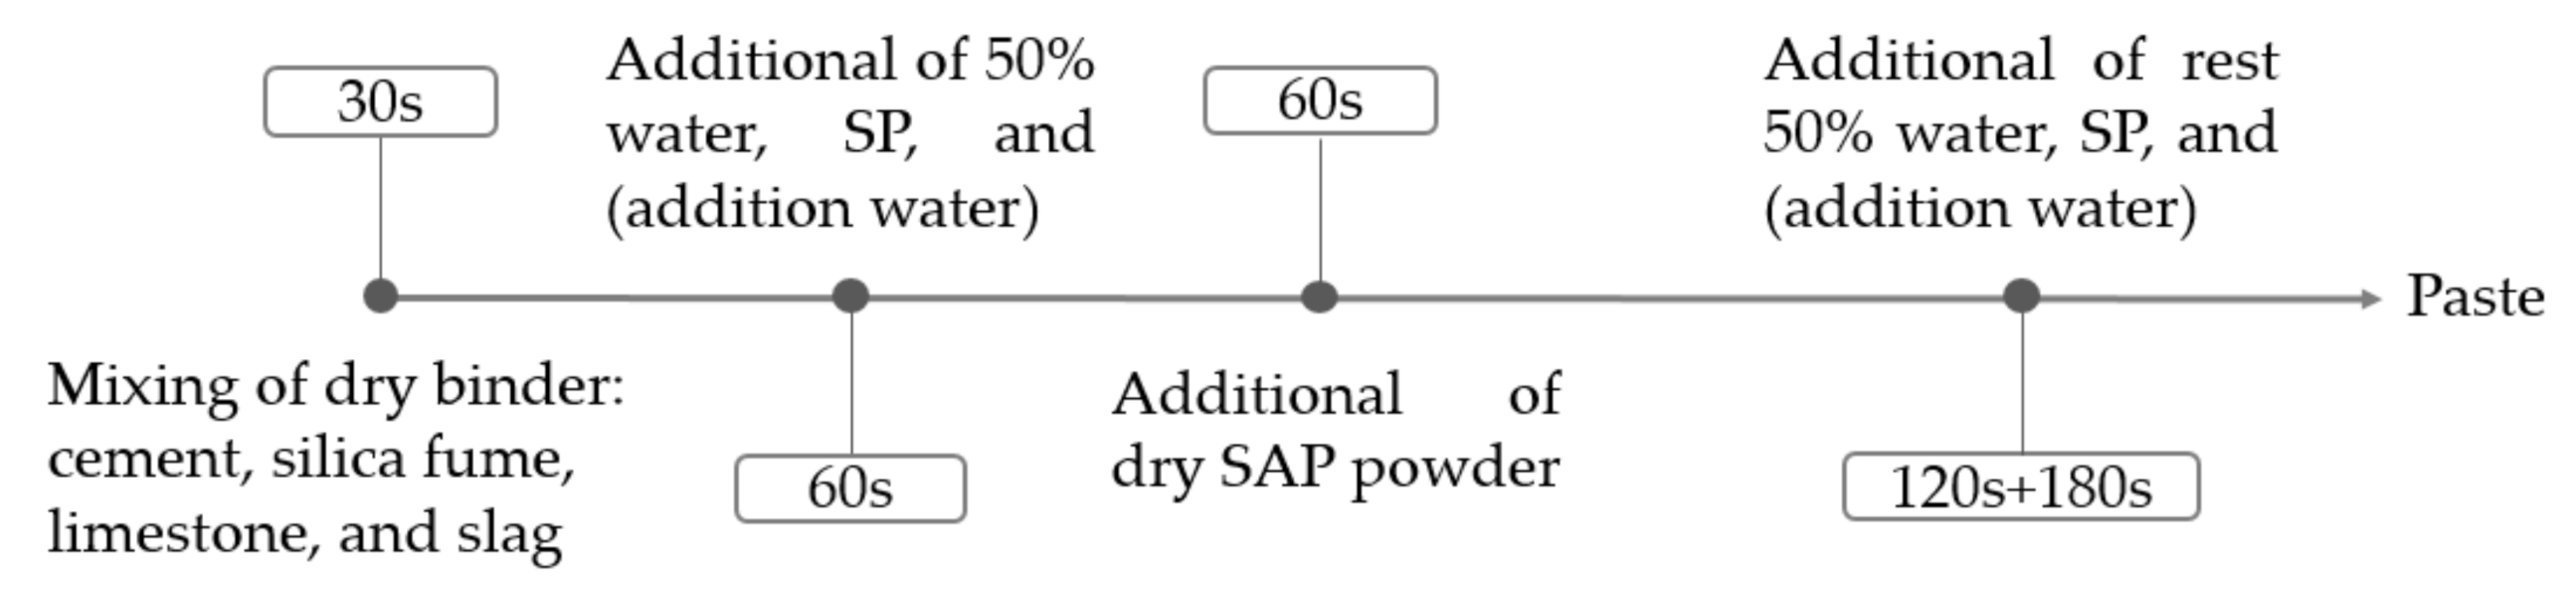
2.2. Mixture Preparation Method

Figure 3 shows the specific steps of the mixing procedure of SUHPP. Step 1: dry mix all the binding materials for 30 s. Step 2: add 50% of water, SP, and/or additional water, mixing for 60 s. Step 3: add the dry SAP, mixing for 60 s. Considering that the presoaked SAP turns into a hydrogel, it is difficult to disperse in the mixture [12]. Therefore, it is reasonable to add the dry SAP directly [12]. Step 4: add the rest of the water, SP, and/or additional water; mix slowly for 120 s; and then mix quickly for 180 s.

2.3. Experimental Methods

Table 4 lists the experimental methods used in this study and the range of tests performed. First, we measured the compressive strength of the sample based on ASTM C39 [28]. Second, the AS coupled with internal relative humidity and temperature measurements were performed using a bellows self-shrinkage tester (Instrument Creation Era, Beijing, China) (based on American Standard ASTM C1698-09) [29]. The isothermal calorimeter TAM Air (TA Instruments, New Castle, CO, USA) was used to measure the heat flow and cumulative hydration heat of the samples (mixing out-of-bottle). After 28 days, XRD analysis was conducted using PANalytical X’pert pro MPD diffractometers (Panalytical, Almelo, The Netherlands). Scanning measurements were performed in the 2θ range from 5° to 75° in steps of 0.02° under CuKα radiation (λ = 1.5404 Å) [30]. At 28 days, a thermal analysis system (SDT Q600, TA Instruments, Santa Clara, CA, USA) was used for TGA. We used temperatures ranging from 20 to 1050 °C at a rate of 10°/min. At 28 days, the samples were scanned using a frontier spectrometer (PerkinElmer, Waltham, MA, USA). The resolution was 0.4 cm−1, and each scan ranged from 2000 to 500 cm−1 (7–8). Moreover, at 1, 3, 7, and 28 days, the ultra-sonic pulse velocity and electrical resistivity evolution of the samples were recorded using a nondestructive digital indicator tester (Pundit Lab, Proceq Company, Schwerzenbach, Switzerland) and a four-point Wenner probe surface testing device (Proceq Company, Schwerzenbach, Switzerland).

3. Experimental Results

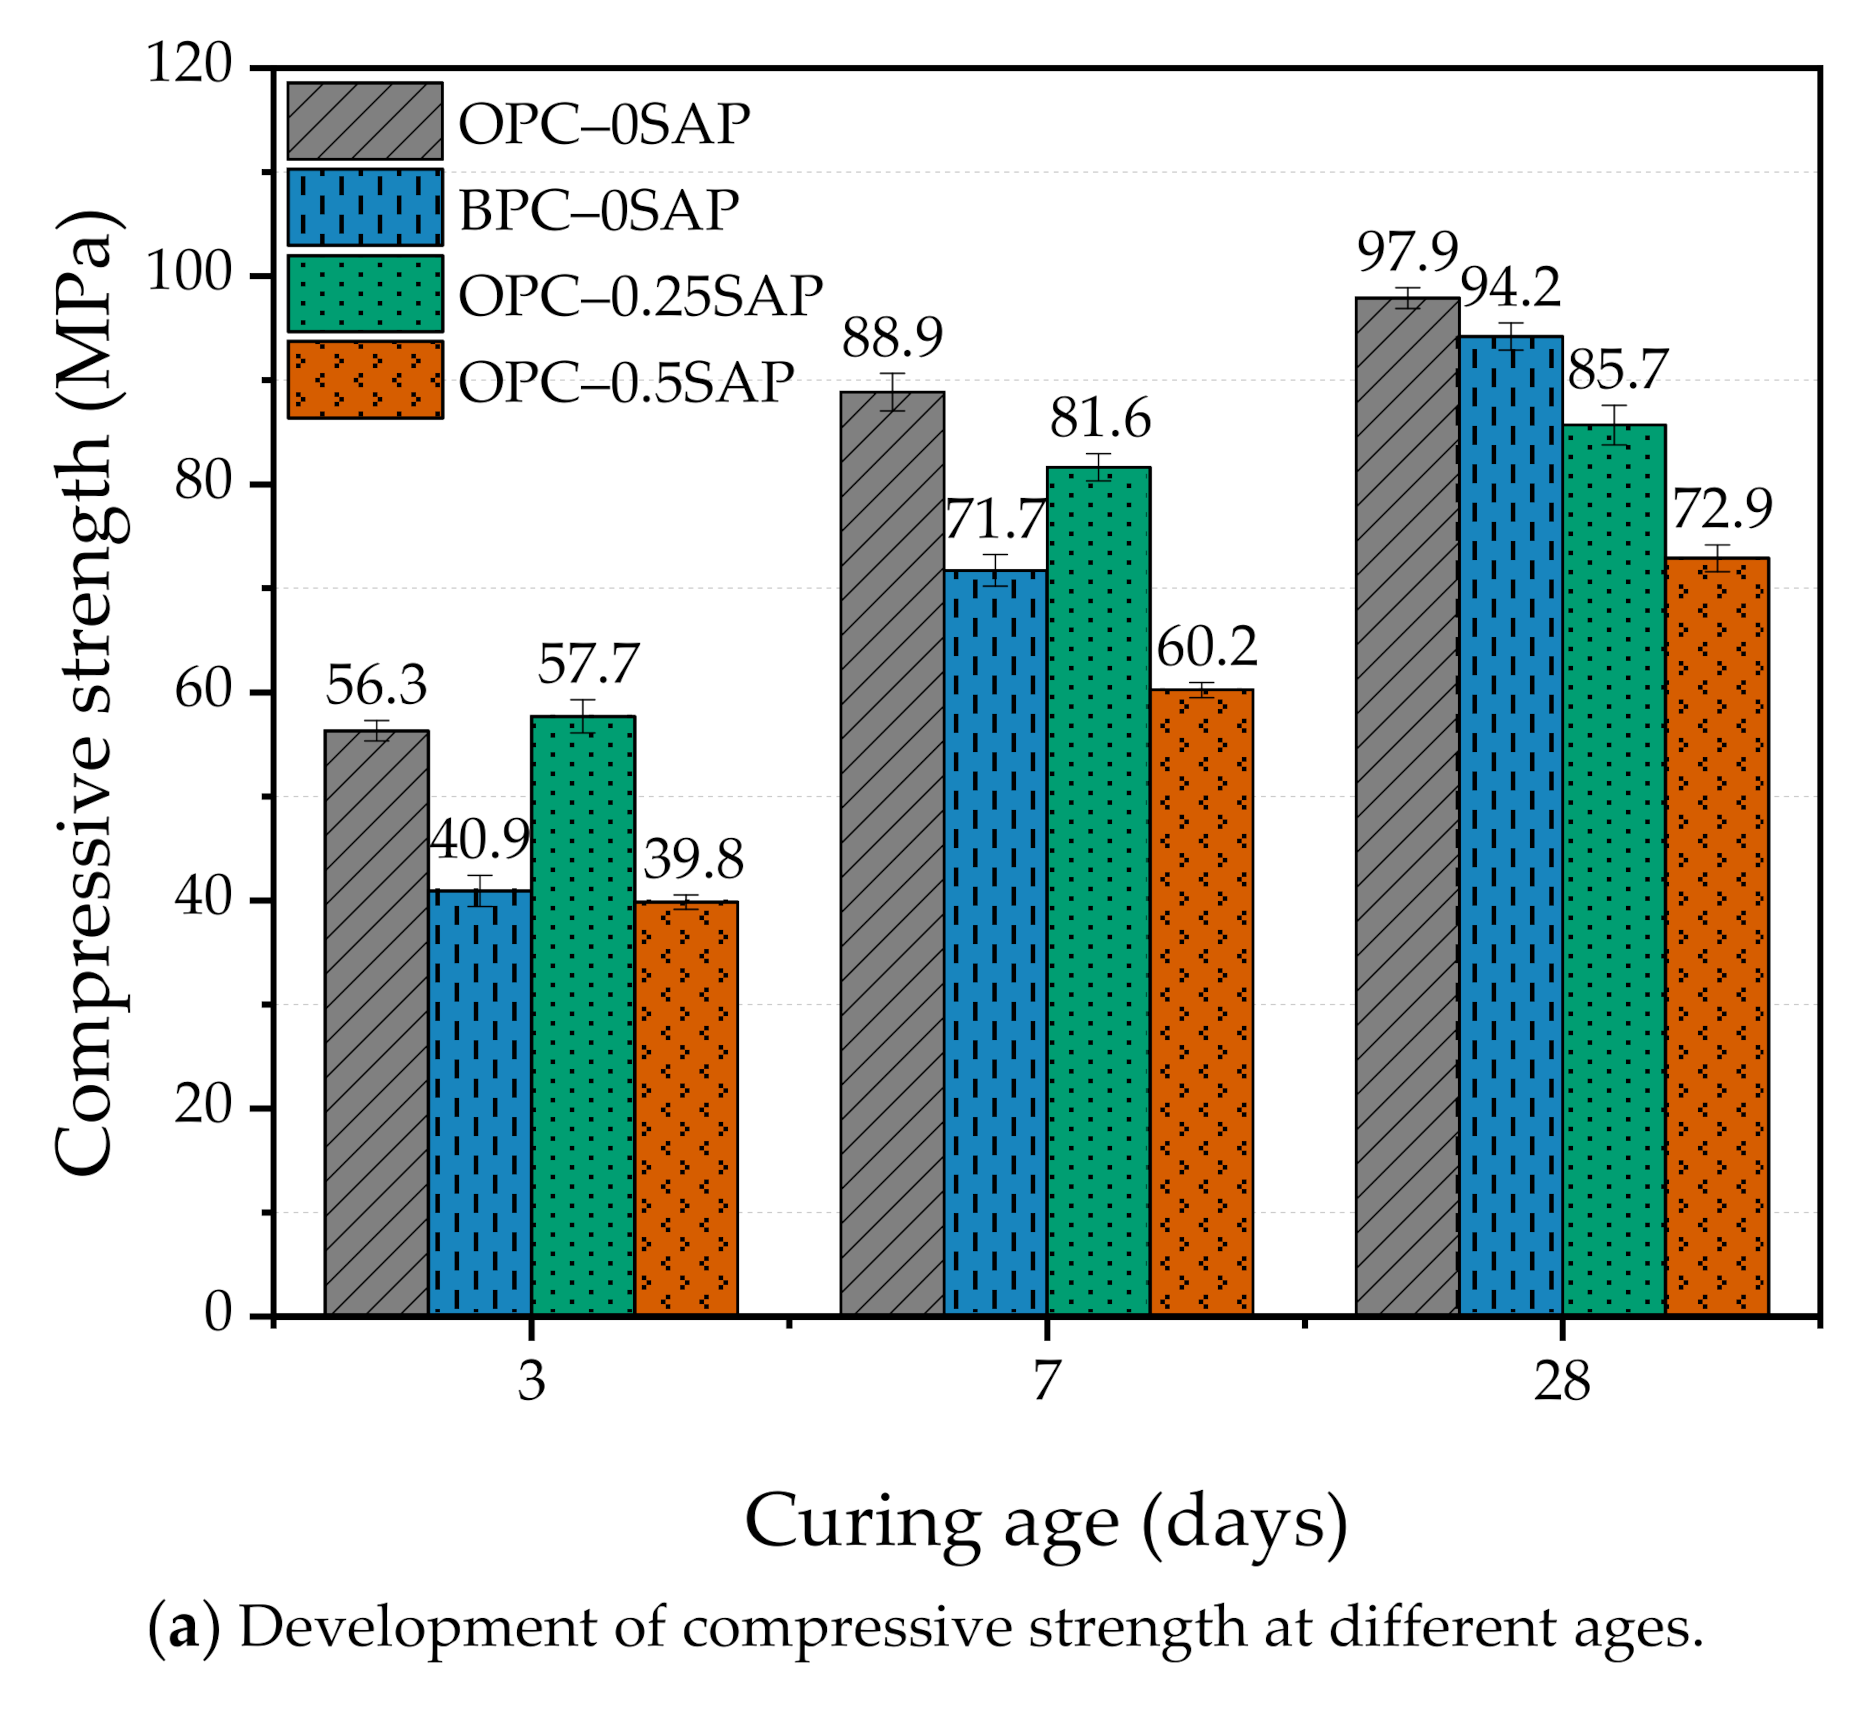
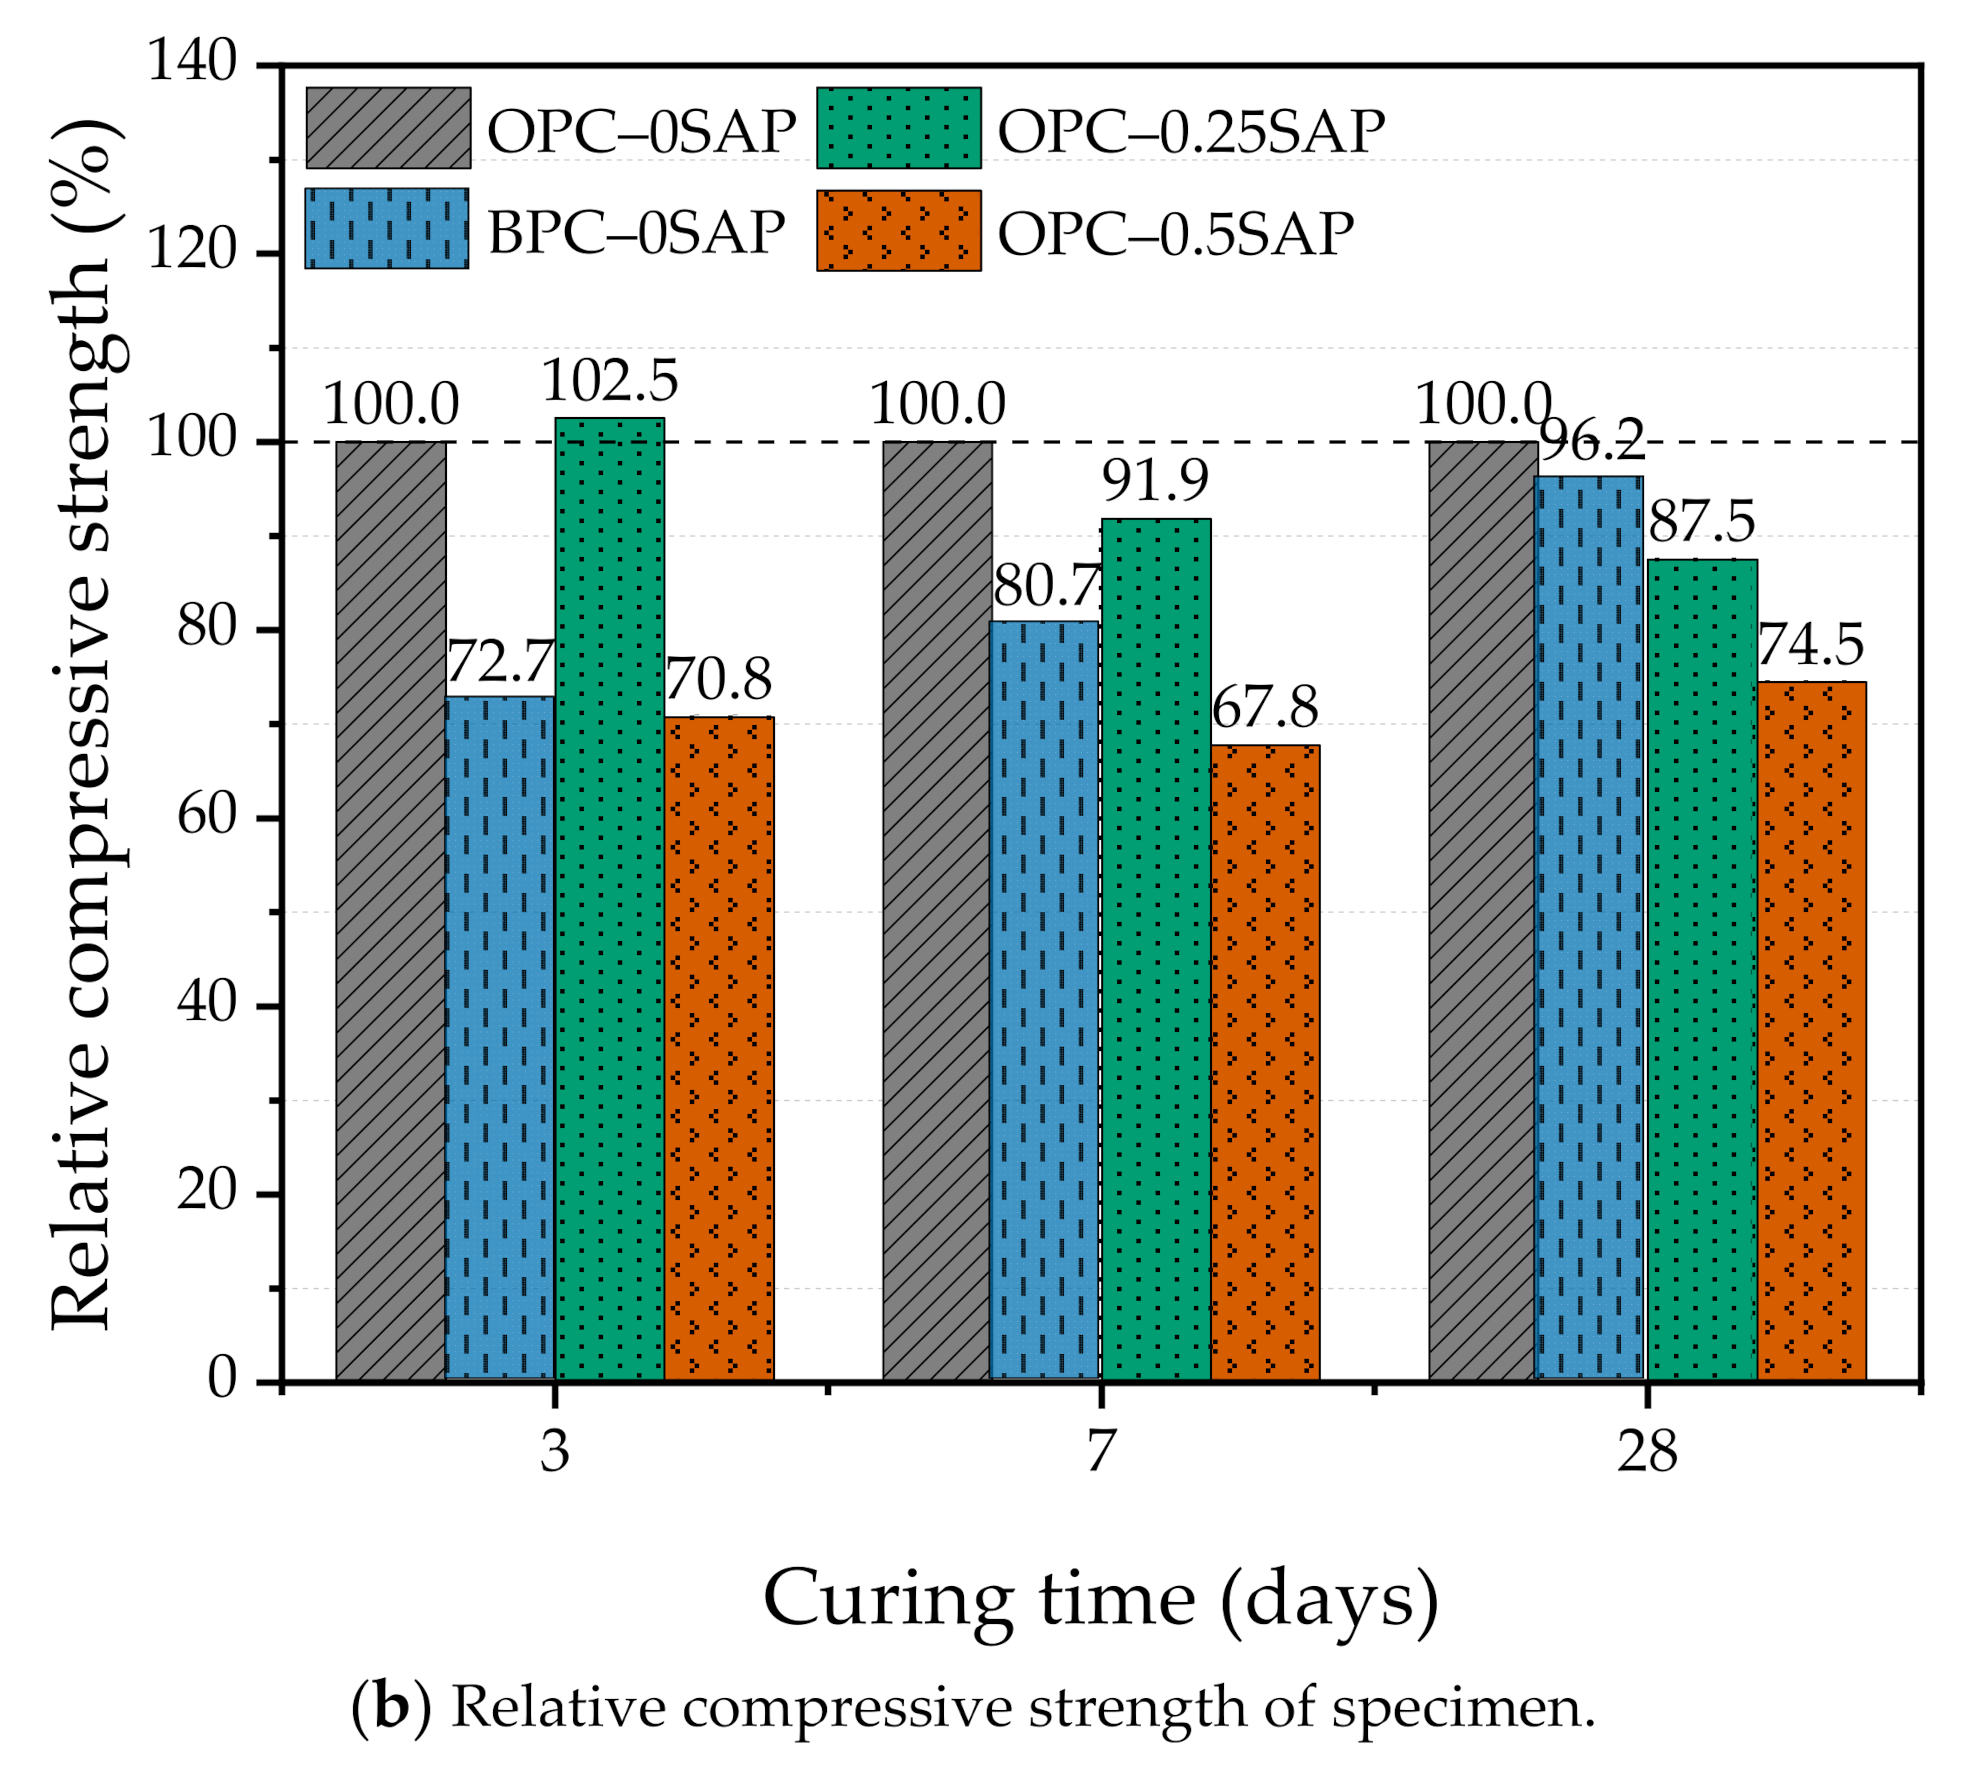
3.1. Compressive Strength

Figure 4 shows the effects of the amount of SAP added and the type of cement on the compressive strength development of the mixture samples at 3, 7, and 28 days. The addition of SAP to a mixture has both pros and cons. First, SAP becomes a hydrogel by absorbing water and swelling in the mixing process. In the process of resolution, larger pores are formed, resulting in lower strength [6]. Secondly, SAP releases the absorbed water to the surrounding area in the reaction process (w/c decreases), which plays the role of internal curing, increases hydration, improves the microstructure (pore densification), and promotes the development of strength [17,23]. In general, the effect of SAP on the development of strength depends on the competing effects of SAP on the increase and decrease in compressive strength. When BPC is used instead of OPC, the structure of belite (e.g., irregular structure, few cavities, and low activity) leads to a slow strength increase at an early age and a faster strength increase at a later age [31].
At 3 days of curing age, the compressive strength of OPC–0.25SAP was slightly higher than that of the control group due to the improved degree of hydration from the internal curing of water. The compressive strength of OPC–0.5SAP samples was 29.2% lower than that of the control group due to the increase in porosity caused by SAP [16]. Compared with higher content, a lower amount of SAP was observed for the early-age strength.
At 7 and 28 days of curing age, the compressive strength of the samples with SAP was lower than that of the control group. At 7 days, the compressive strengths of OPC–0.25SAP and OPC–0.5SAP were 8.1% and 32.2% lower than that of the control group, respectively. At 28 days, the compressive strengths of OPC–0.25SAP and OPC–0.5SAP were 12.5% and 25.5% lower than that of the control group, respectively. This indicates that the internal curing of SAP at a later age improves hydration, promotes the pozzolanic reaction, and effectively increases the compressive strength [7,16]. However, the SAP internal maintenance effect does not fully compensate for the strength loss caused by the voids created by the SAP water release [7]. The higher the amount added, the more obvious the reduction phenomenon.
In contrast, the effect of the replacement cement type on strength ranged between 0.25% and 0.5% of SAP. At 3 and 7 days of hydration, the strength of BPC–0SAP was only 72.7%–80.7% of OPC–0SAP. This was attributed to the slow hydration rate of C2S in BPC–0SAP, resulting in a slow increase in strength in the early stages [32]. Although the early compressive strength developed slowly due to the higher C2S and lower C3A in the BPC cement, the later (28 days) strength was significantly improved [33]. The compressive strength of BPC–0SAP samples at 28 days could reach 96.2% of the control group. For strength, the BPC–0SAP samples had a higher late-stage strength than the samples doped with SAP.

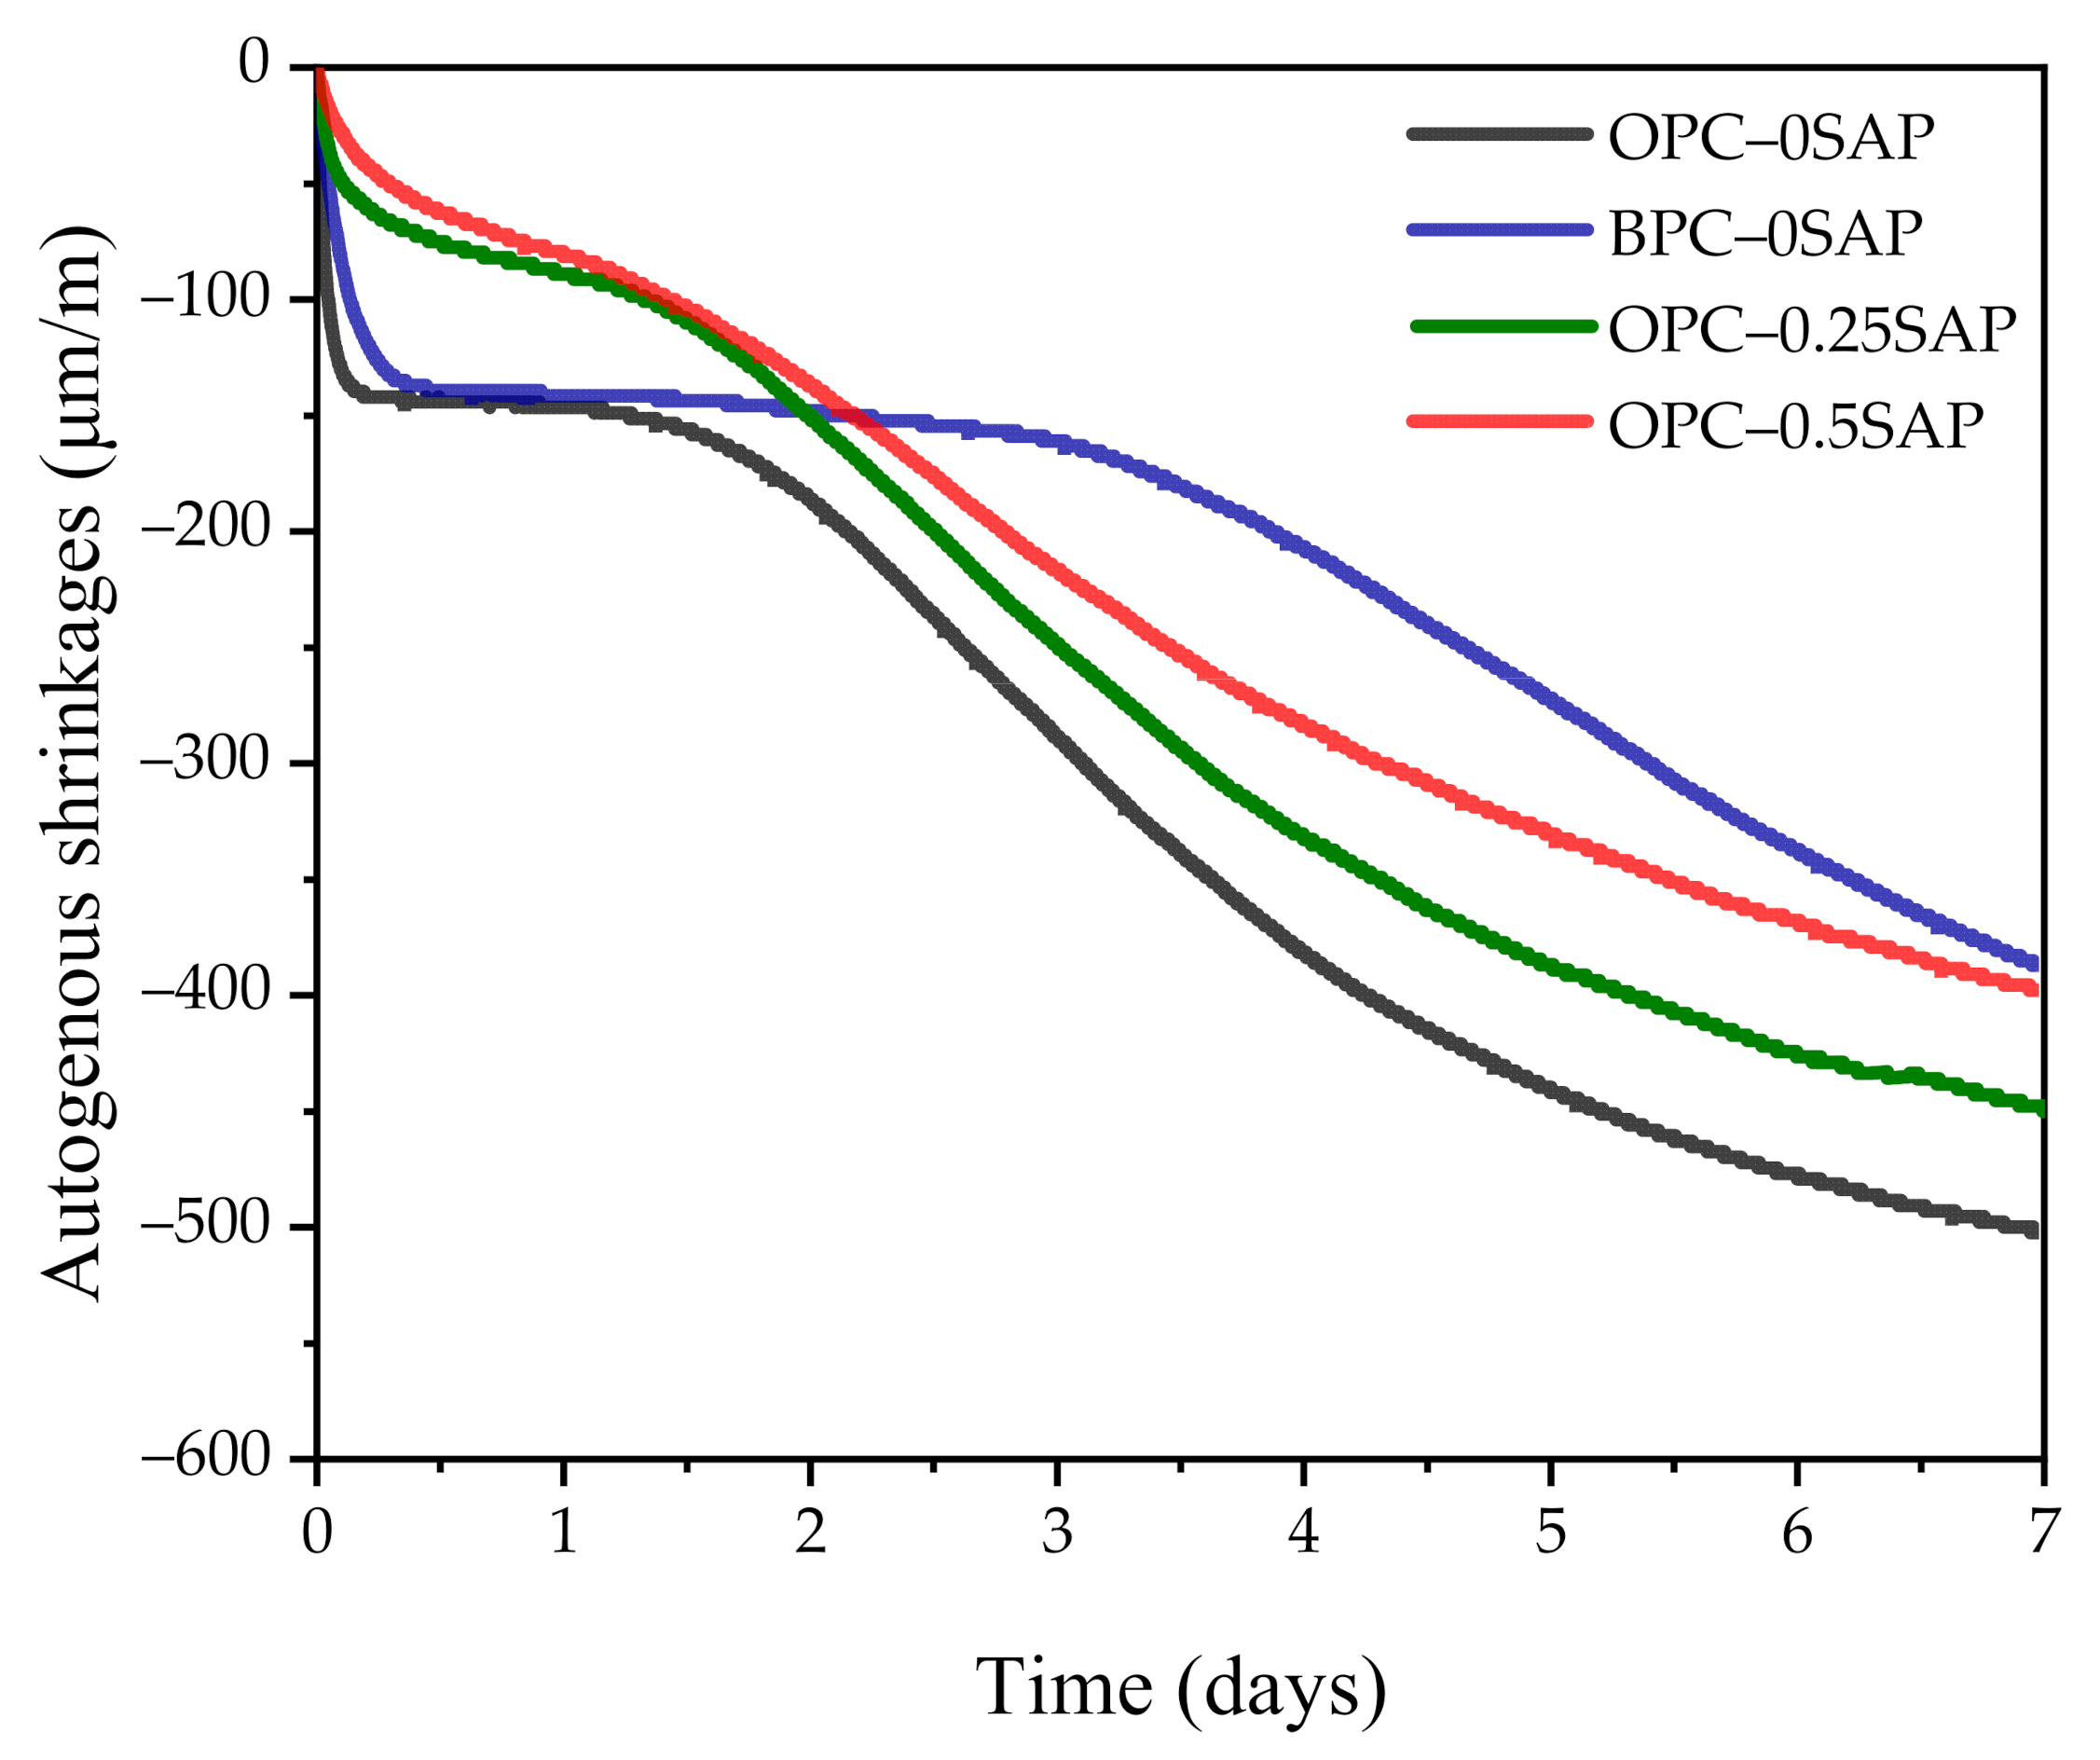
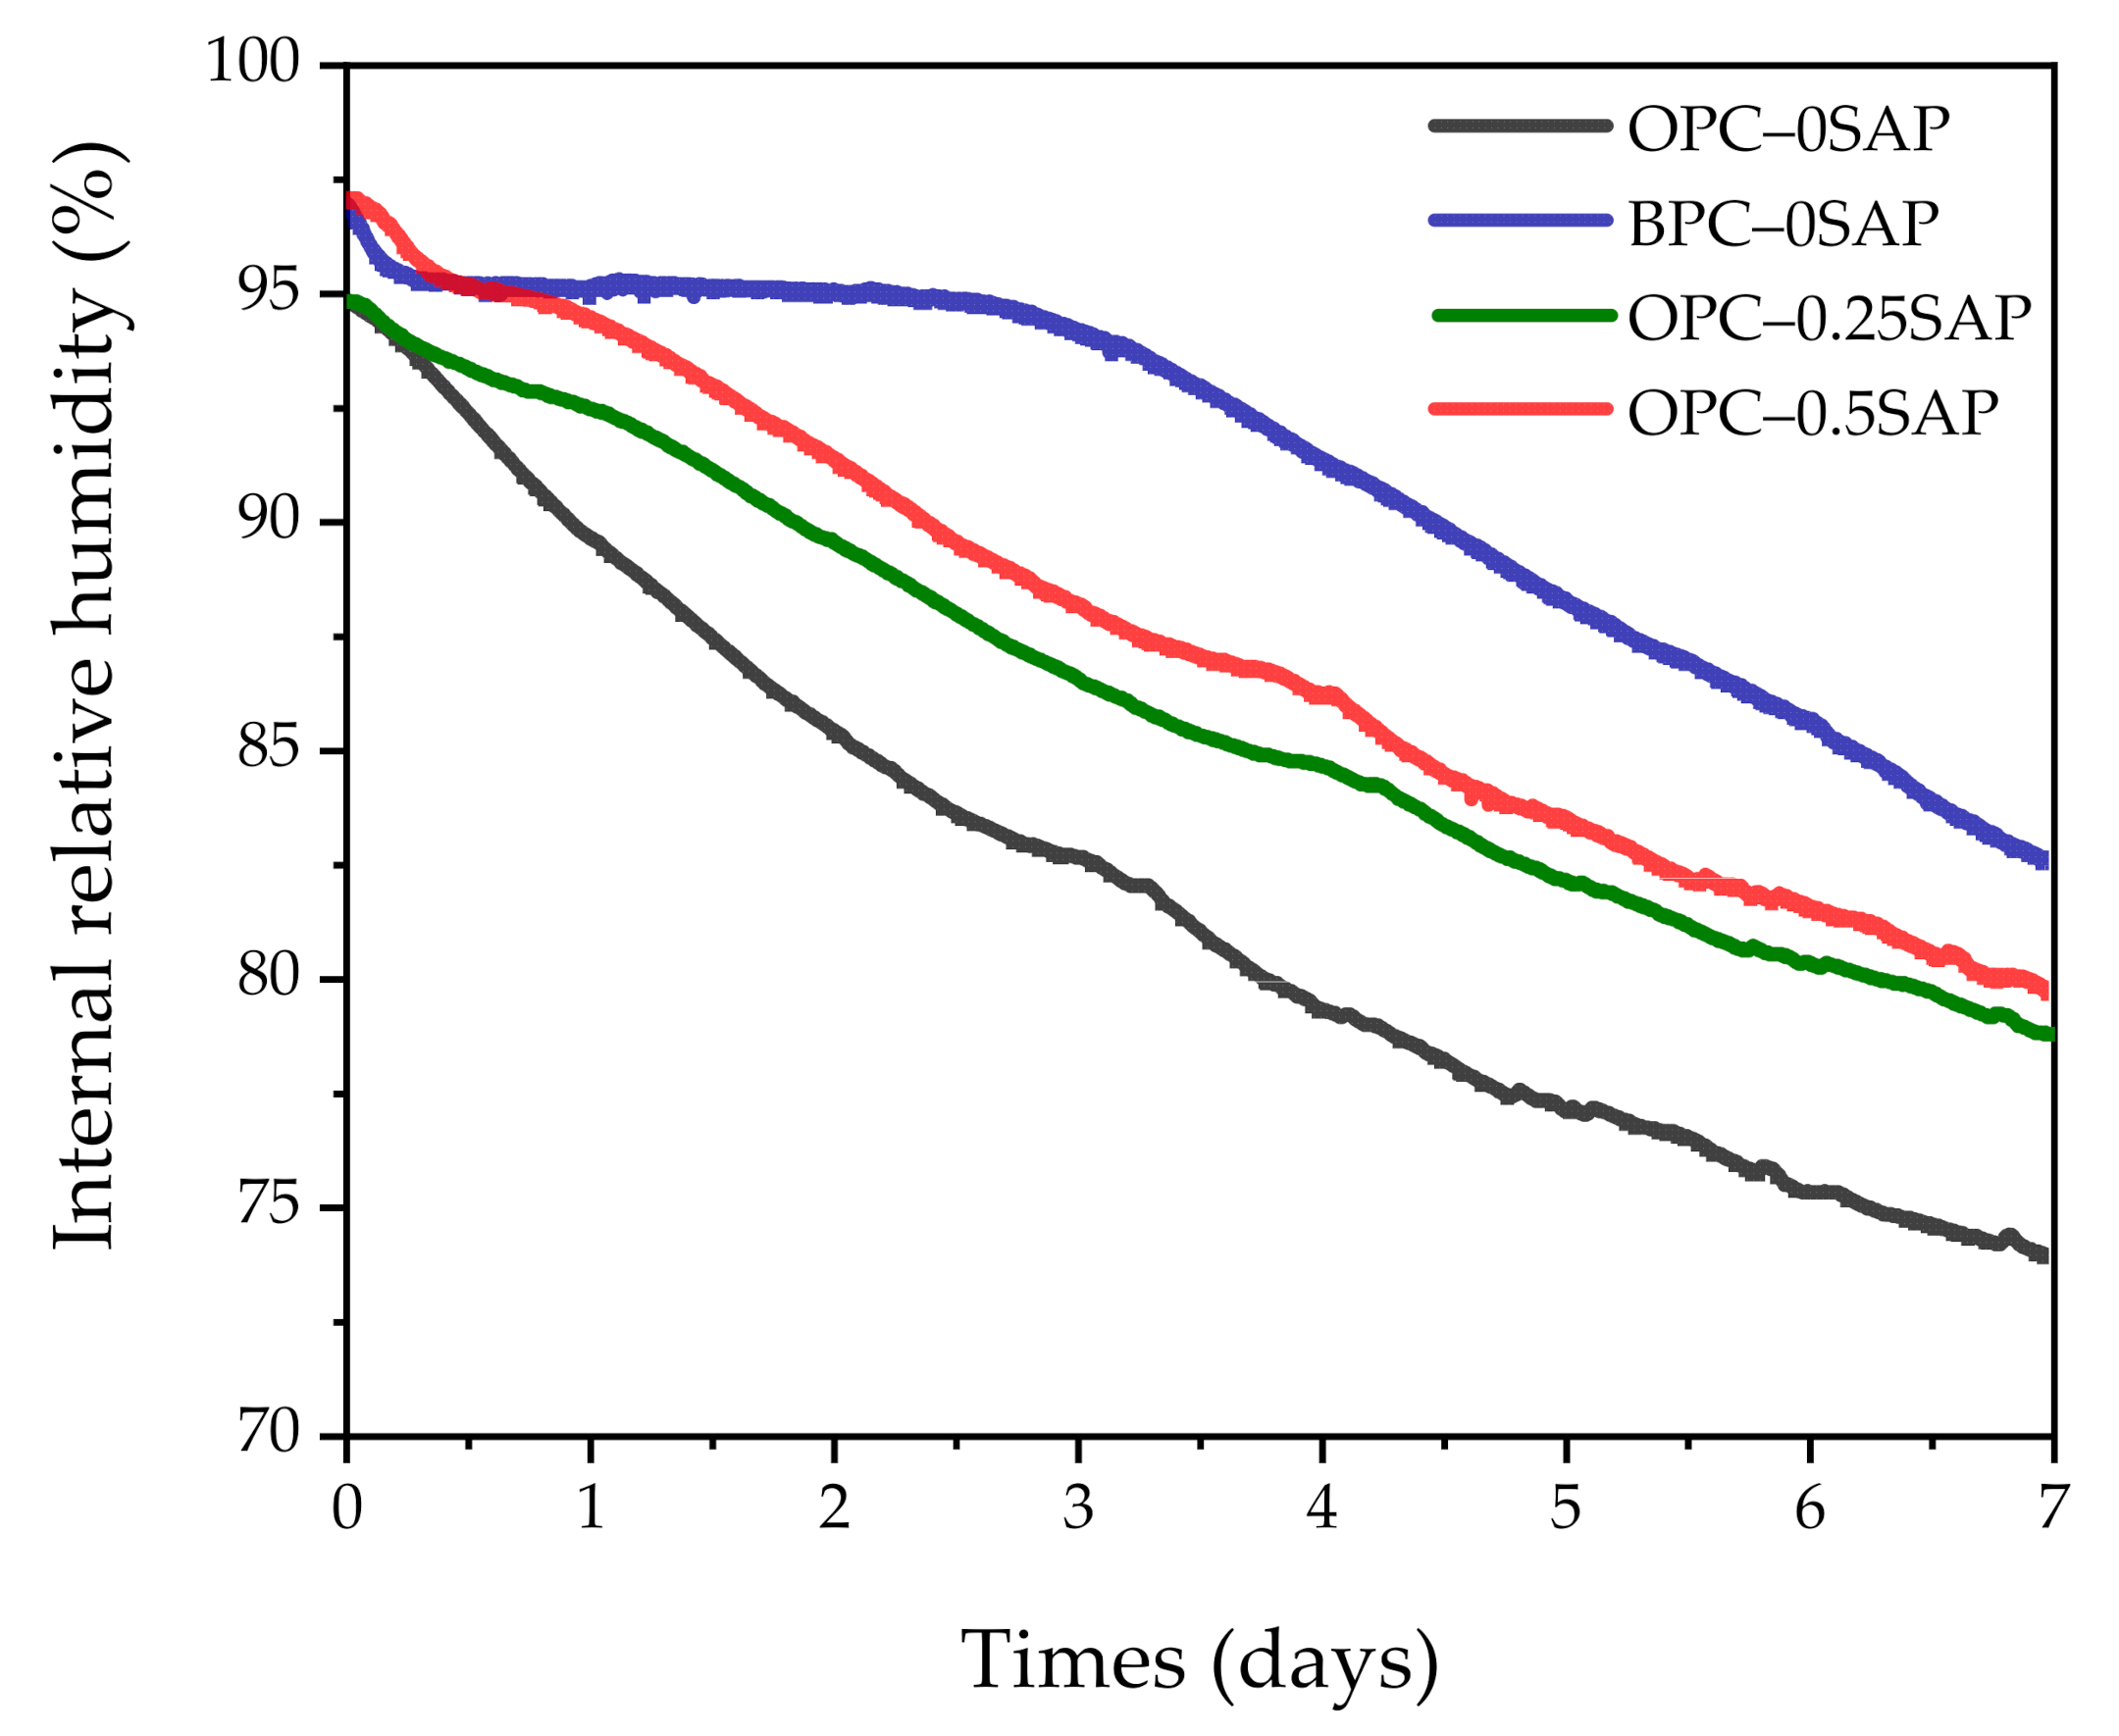
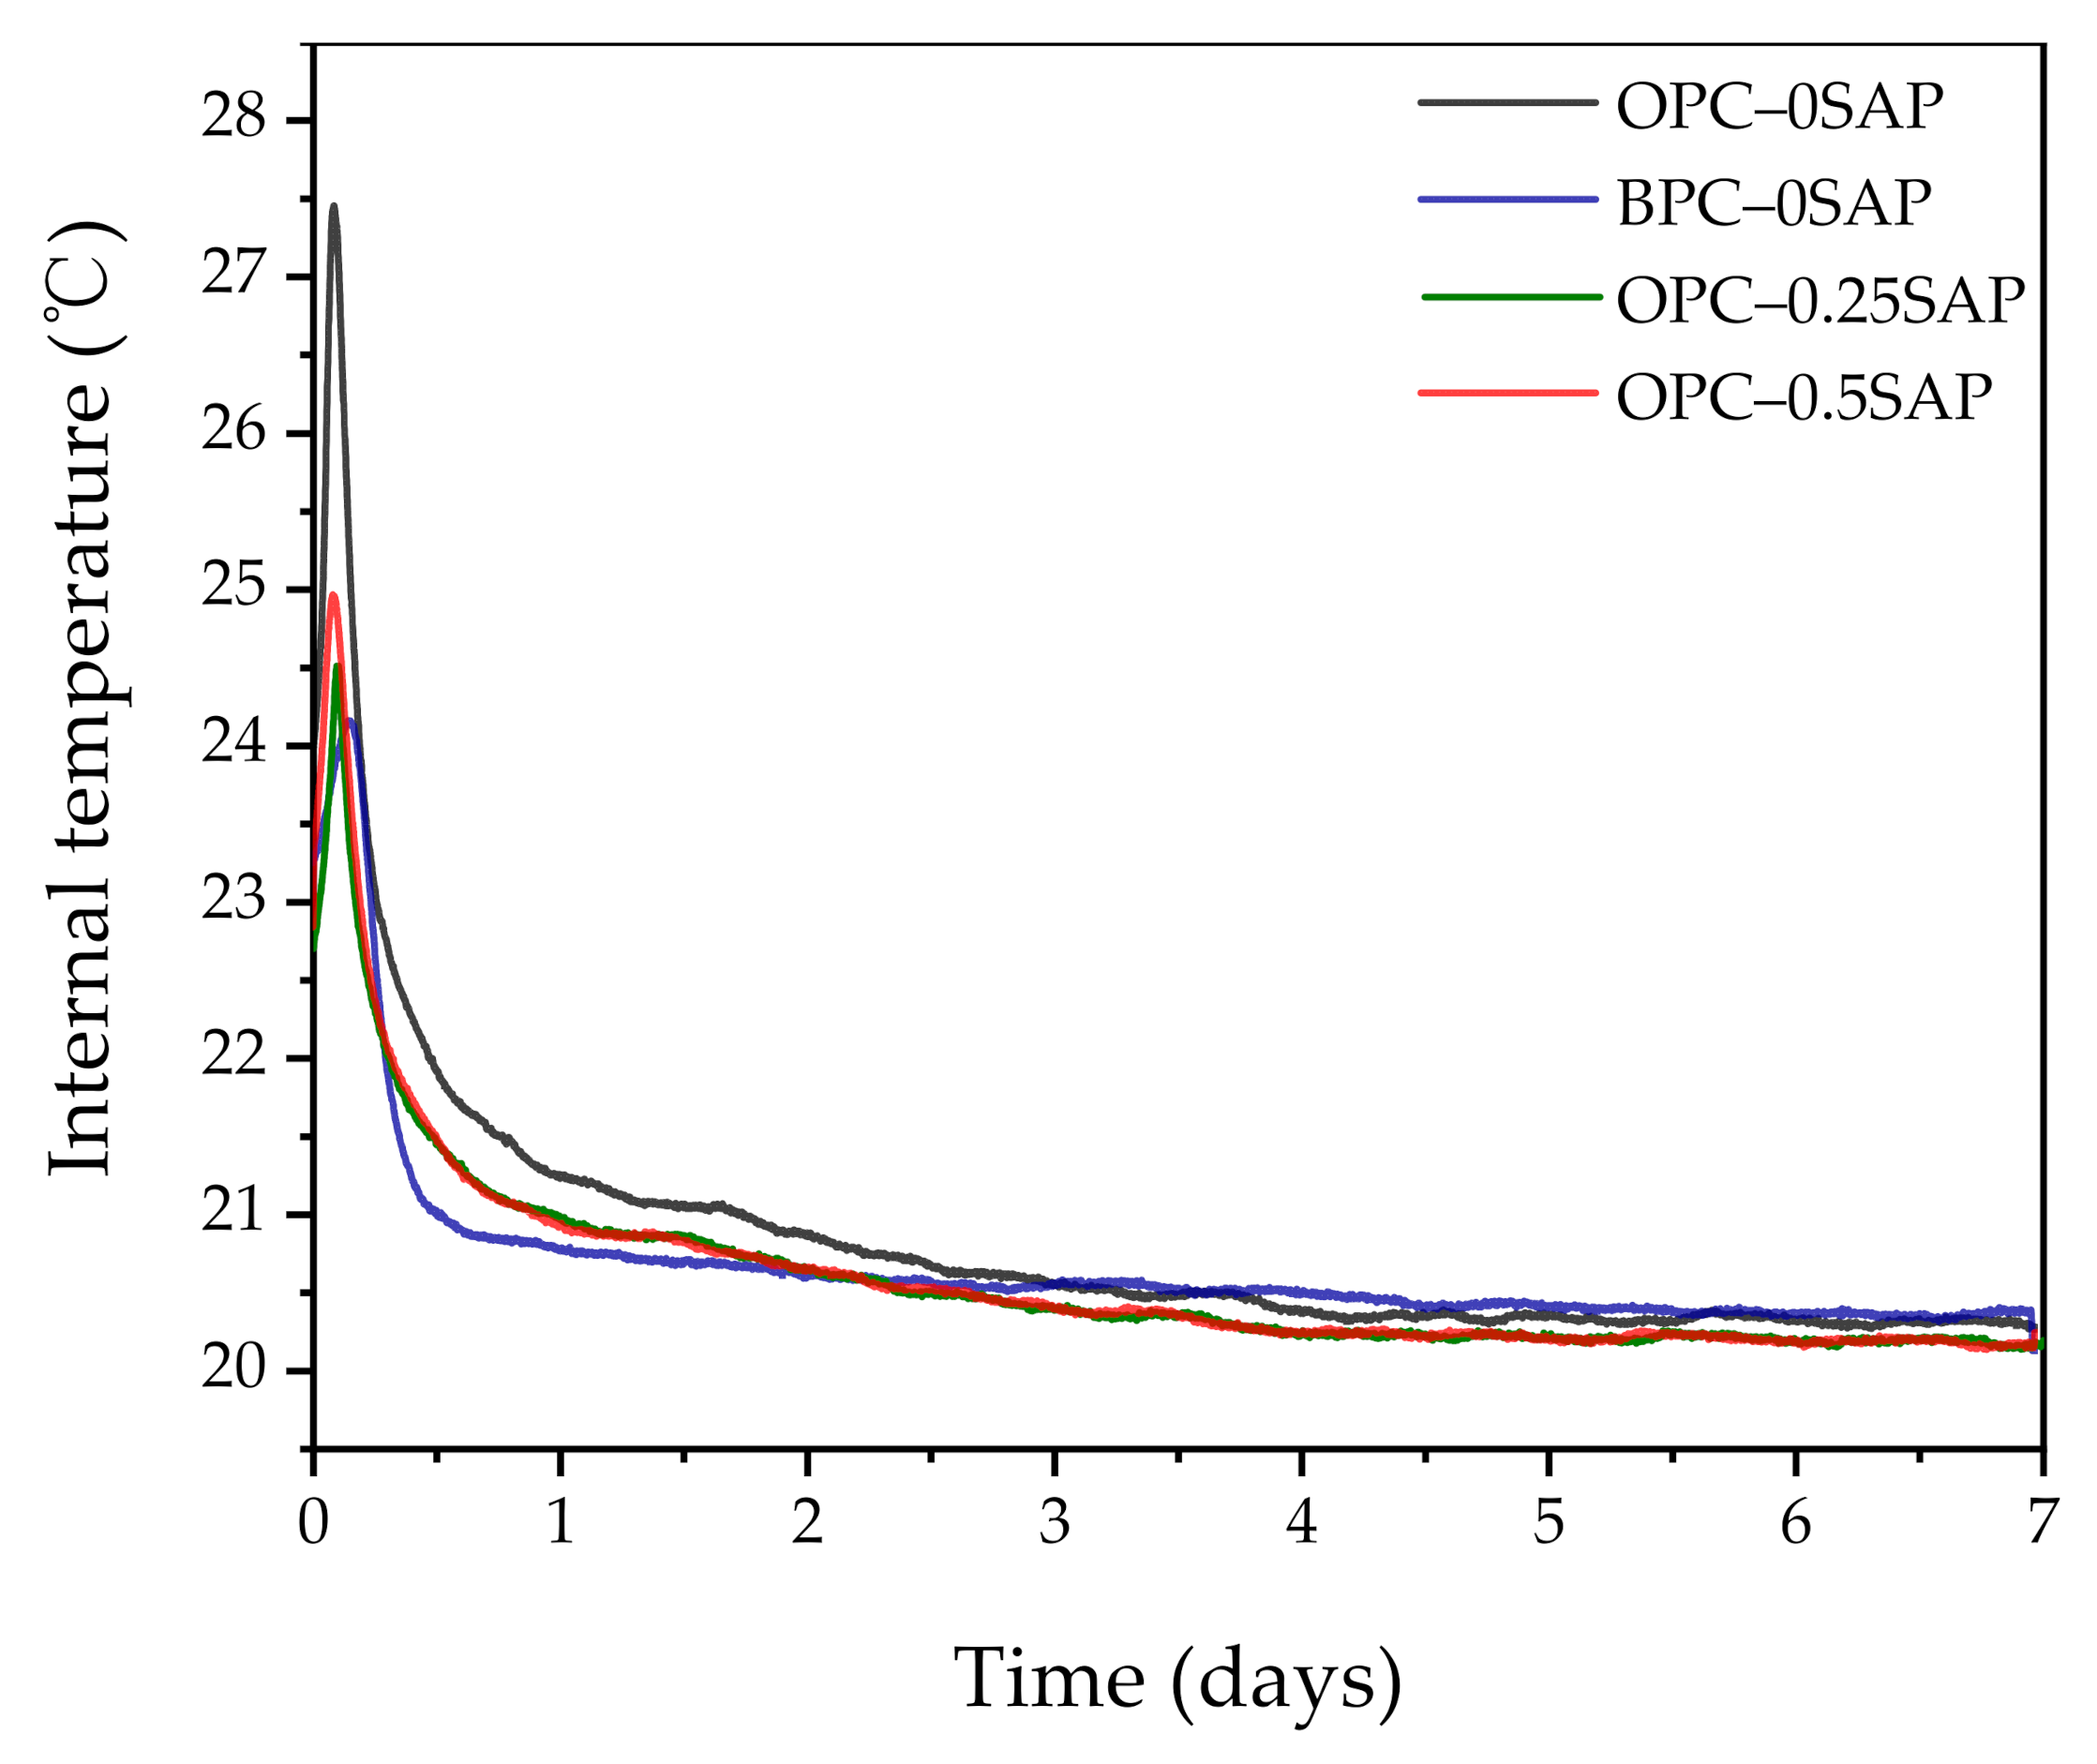
3.2. Autogenous Shrinkage (AS) Coupled with Internal Relative Humidity and Temperature

As shown in Figure 5, the development of AS can be divided into the following three stages: rapid growth period at initial ages, stable period at middle ages, and continuous growth period at later ages. There are five reasons for the change in AS: (i) cement hydration consumes water and the internal relative humidity decreases, resulting in a rapid increase in AS (shrinkage factor) [12]; (ii) the densification of the internal pore structure, resulting in increased AS (shrinkage factor) [33]; (iii) the pozzolanic reaction of silica fume and slag to produce dense C-S-H, as well as to promote AS development (i.e., shrinkage factor) [34]; (iv) the production of AFm and internal temperature changes leading to expansion (expansion factor) [35]; (V) limestone stabilizes the produced ettringite and causes expansion (expansion factor) [36,37]. The final macroresponse depends on changes in the dominant expansion and contraction factors.
At the initial ages, the AS contraction of all samples was significantly greater, while the AS of samples with SAP was significantly lower than that of the control group. This was due to the release of water from SAP during the reaction process, slowing down the decrease in internal relative humidity and effectively reducing AS development [12]. This decrease became more pronounced as the SAP content increased. It can be observed from Figure 6 that the internal relative humidity of samples containing SAP was significantly higher than that of the control at the beginning of the reaction.
In the stable period of middle ages, it was clearly observed that the OPC–0SAP and BPC–0SAP samples were stable and lasted longer than the samples with SAP. The macroperformance was more stable because the factors causing expansion and contraction offset each other.
During the continuous growth period of the late ages, the AS continued to increase as the reaction proceeded. The rate of AS development was significantly accelerated in the BPC–0SAP sample. Consistent with the strength trend, it showed a faster development trend at a later age. The AS of the BPC–0 samples at 7 days was lower than that of the samples doped with SAP. From the experimental results, it can be seen that the BPC can effectively reduce AS.
At 7 days of age, the AS values of OPC–0SAP, OPC–0.25SAP, and OPC–0.5SAP were –504.1, −447.6, and −399.2 μm/m, respectively. Compared with the control group, the reduction ratios of AS for OPC–0.25SAP and OPC–0.5SAP were 11.2% and 20.8%, respectively. Moreover, as shown in Figure 4, compared with the control group, the reduction ratios of strength for OPC–0.25SAP and OPC–0.5SAP were 8.1% and 32.2%, respectively. For the case of OPC–0.25SAP, the reduction in the AS sample was greater than the strength, while, for the case of OPC–0.5SAP, the reduction in the AS sample OPC–0.5SAP was lower than the strength. It should be noted that strength and AS are measured by different units, and they have different levels of importance. It is not wise to judge the benefit based on the comparisons between the strength loss ratio and AS reduction ratio.
At the age of 7 days, the AS values of OPC–0SAP and BPC–0SAP were −504.1 and −388.5 μm/m, respectively. Compared with the control group, the reduction ratio of AS for BPC–0SAP was 22.9%. Moreover, as shown in Figure 4, compared with the control group, the reduction ratio of strength for BPC–0SAP was 19.2%. The case of BPC–0SAP demonstrated that the reduction in AS was more obvious than for the strength.
Overall, the addition of SAP effectively reduced AS. The AS in the samples doped with BPC developed slowly and increased rapidly after the stable period. This trend is consistent with the internal relative humidity variation shown in Figure 6. The internal relative humidity of all samples gradually decreased when the curing age increased. This was due to the hydration of the cement and the decrease in water in the capillaries. However, the samples with SAP significantly delayed the rate of internal relative humidity reduction. In addition, the BPC-doped samples also retarded the reduction in internal relative humidity due to the slow reaction rate of C2S [38]. The low reaction rate of the BPC–0SAP sample at the early stage could be verified from the internal temperature shown in Figure 7. The internal temperature of the BPC–0SAP sample was lower compared to the other samples.
As shown in Figure 7, after the age of 1 day, the internal temperature was almost constant. We plotted the AS as a function of internal relative humidity from days 1 to 7. As shown in Figure 8, AS showed a linear relationship with the internal relative humidity. The coefficients of determination between AS and internal relative humidity were higher than 98%; hence, the reduction in internal relative humidity is the main reason for AS in SUHPP.

3.3. Isothermal Calorimetry

Figure 9 and Figure 10 show the rate of hydration heat and cumulative hydration heat change in the mixture. We found that hours 1–7 represented the dormant period, which was due to the increase in the effective w/c of samples OPC–0.25SAP and OPC–0.5SAP [39,40]. Yang et al. [41] indicated that when w/c increased, the transition from dormancy to the acceleration period was prolonged, which was consistent with the results obtained in this experiment.
The acceleration period occurred from hours 7 to 19. The peak of the main peak decreased significantly when SAP increased and became blunter. Moreover, the appearance of the main peak was delayed by 2.5–4.5 h due to the rapid resolution of SAP, which increased the effective w/c and reduced the initial reduction concentration in the pore solution, resulting in delayed cement hydration [41]. The experimental results of Justs et al. [40] indicated that within 30 h of the initial reaction, a reduced w/c shortened the dormancy period, and the main peak appeared earlier and more sharply. In addition, the BPC–0SAP sample showed a shoulder peak whose peak was higher than the peak of the main peak. The content of C3S in BPC was lower than OPC, resulting in a lower main peak in the BPC–0SAP sample than in the OPC–0SAP. In addition, limestone reacts with alumina in slag to form calcium alumina, thus forming a shoulder peak [42]. Shoulder peaks were also present in the other three groups of samples, but the main peaks and shoulder peaks were close to each other and did not show obvious shoulder peaks [34]. The heat flow of all samples stabilized after 36 h of hydration reaction.
As shown in Figure 10, the cumulative heat of hydration increases with the addition of SAP. The cumulative heat of hydration of both samples OPC–0.25SAP and OPC–0.5SAP was higher than that of the control after 24 h. The water entrained in SAP increased the w/c, and the higher w/c increased the degree of hydration of the sample, resulting in a higher cumulative hydration heat [43]. In contrast, the cumulative hydration heat of the BPC–0SAP samples was much lower compared to the control group. This was due to the fact that the early C2S hydration reaction was slower than C3S, releasing less hydration heat [33]. The cumulative hydration heat was released at 72 h and reduced by 15.9% compared to the control group. Further, it had much lower cumulative hydration heat than the samples mixed with SAP. The trend of cumulative hydration heat generally agreed with that of the internal temperature, as shown in Figure 7.

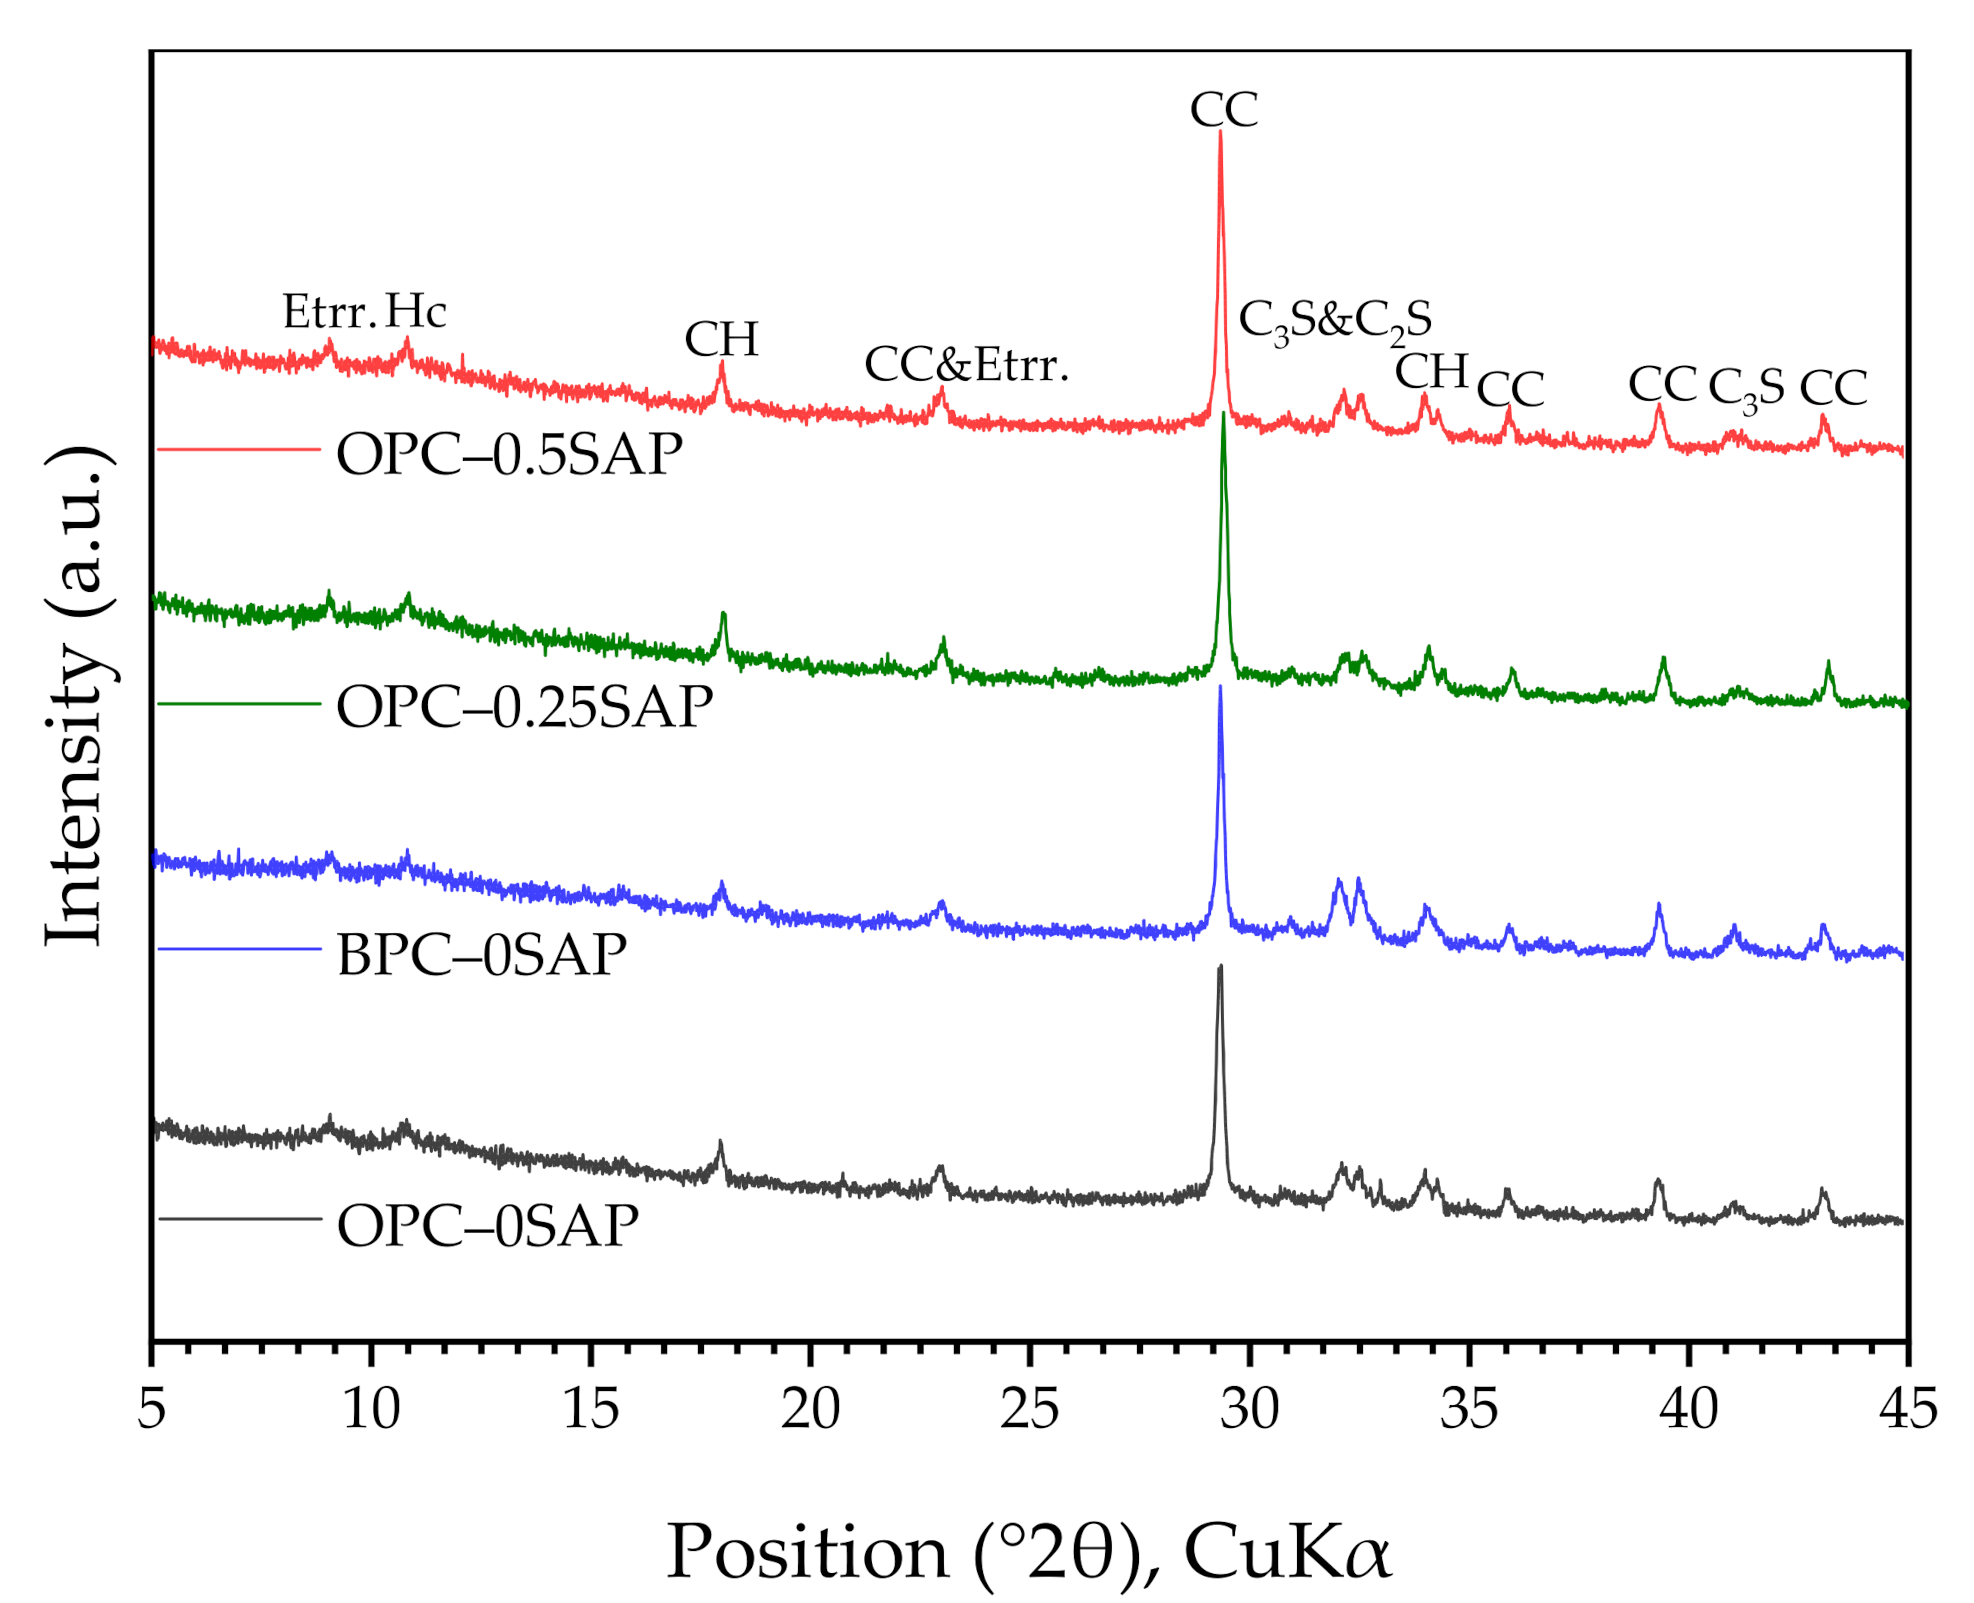
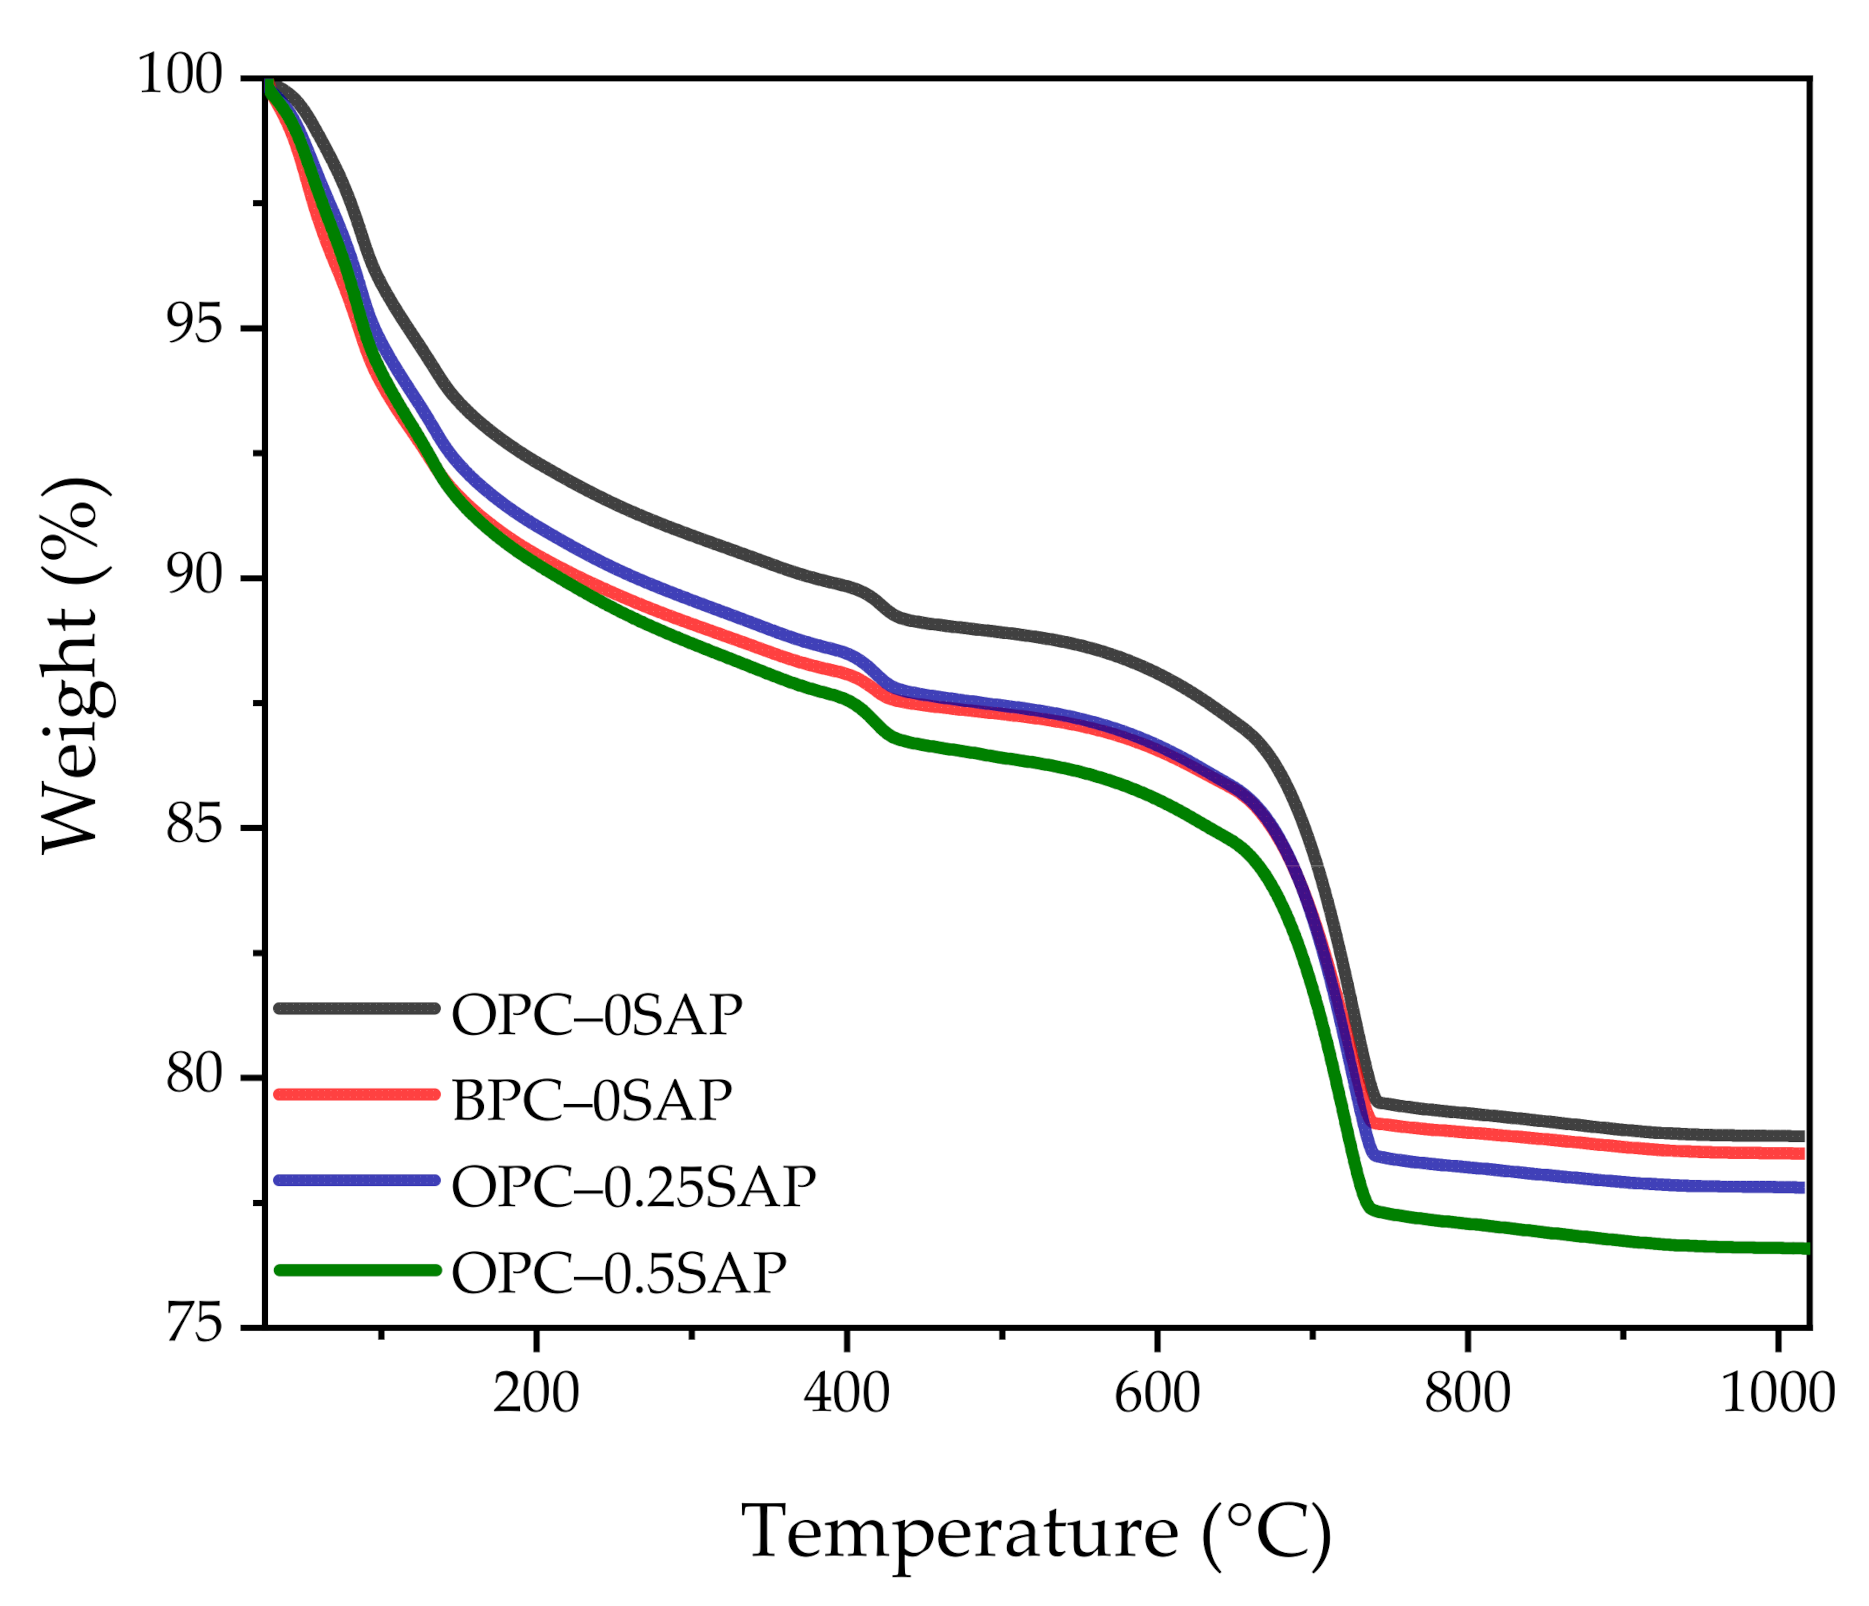
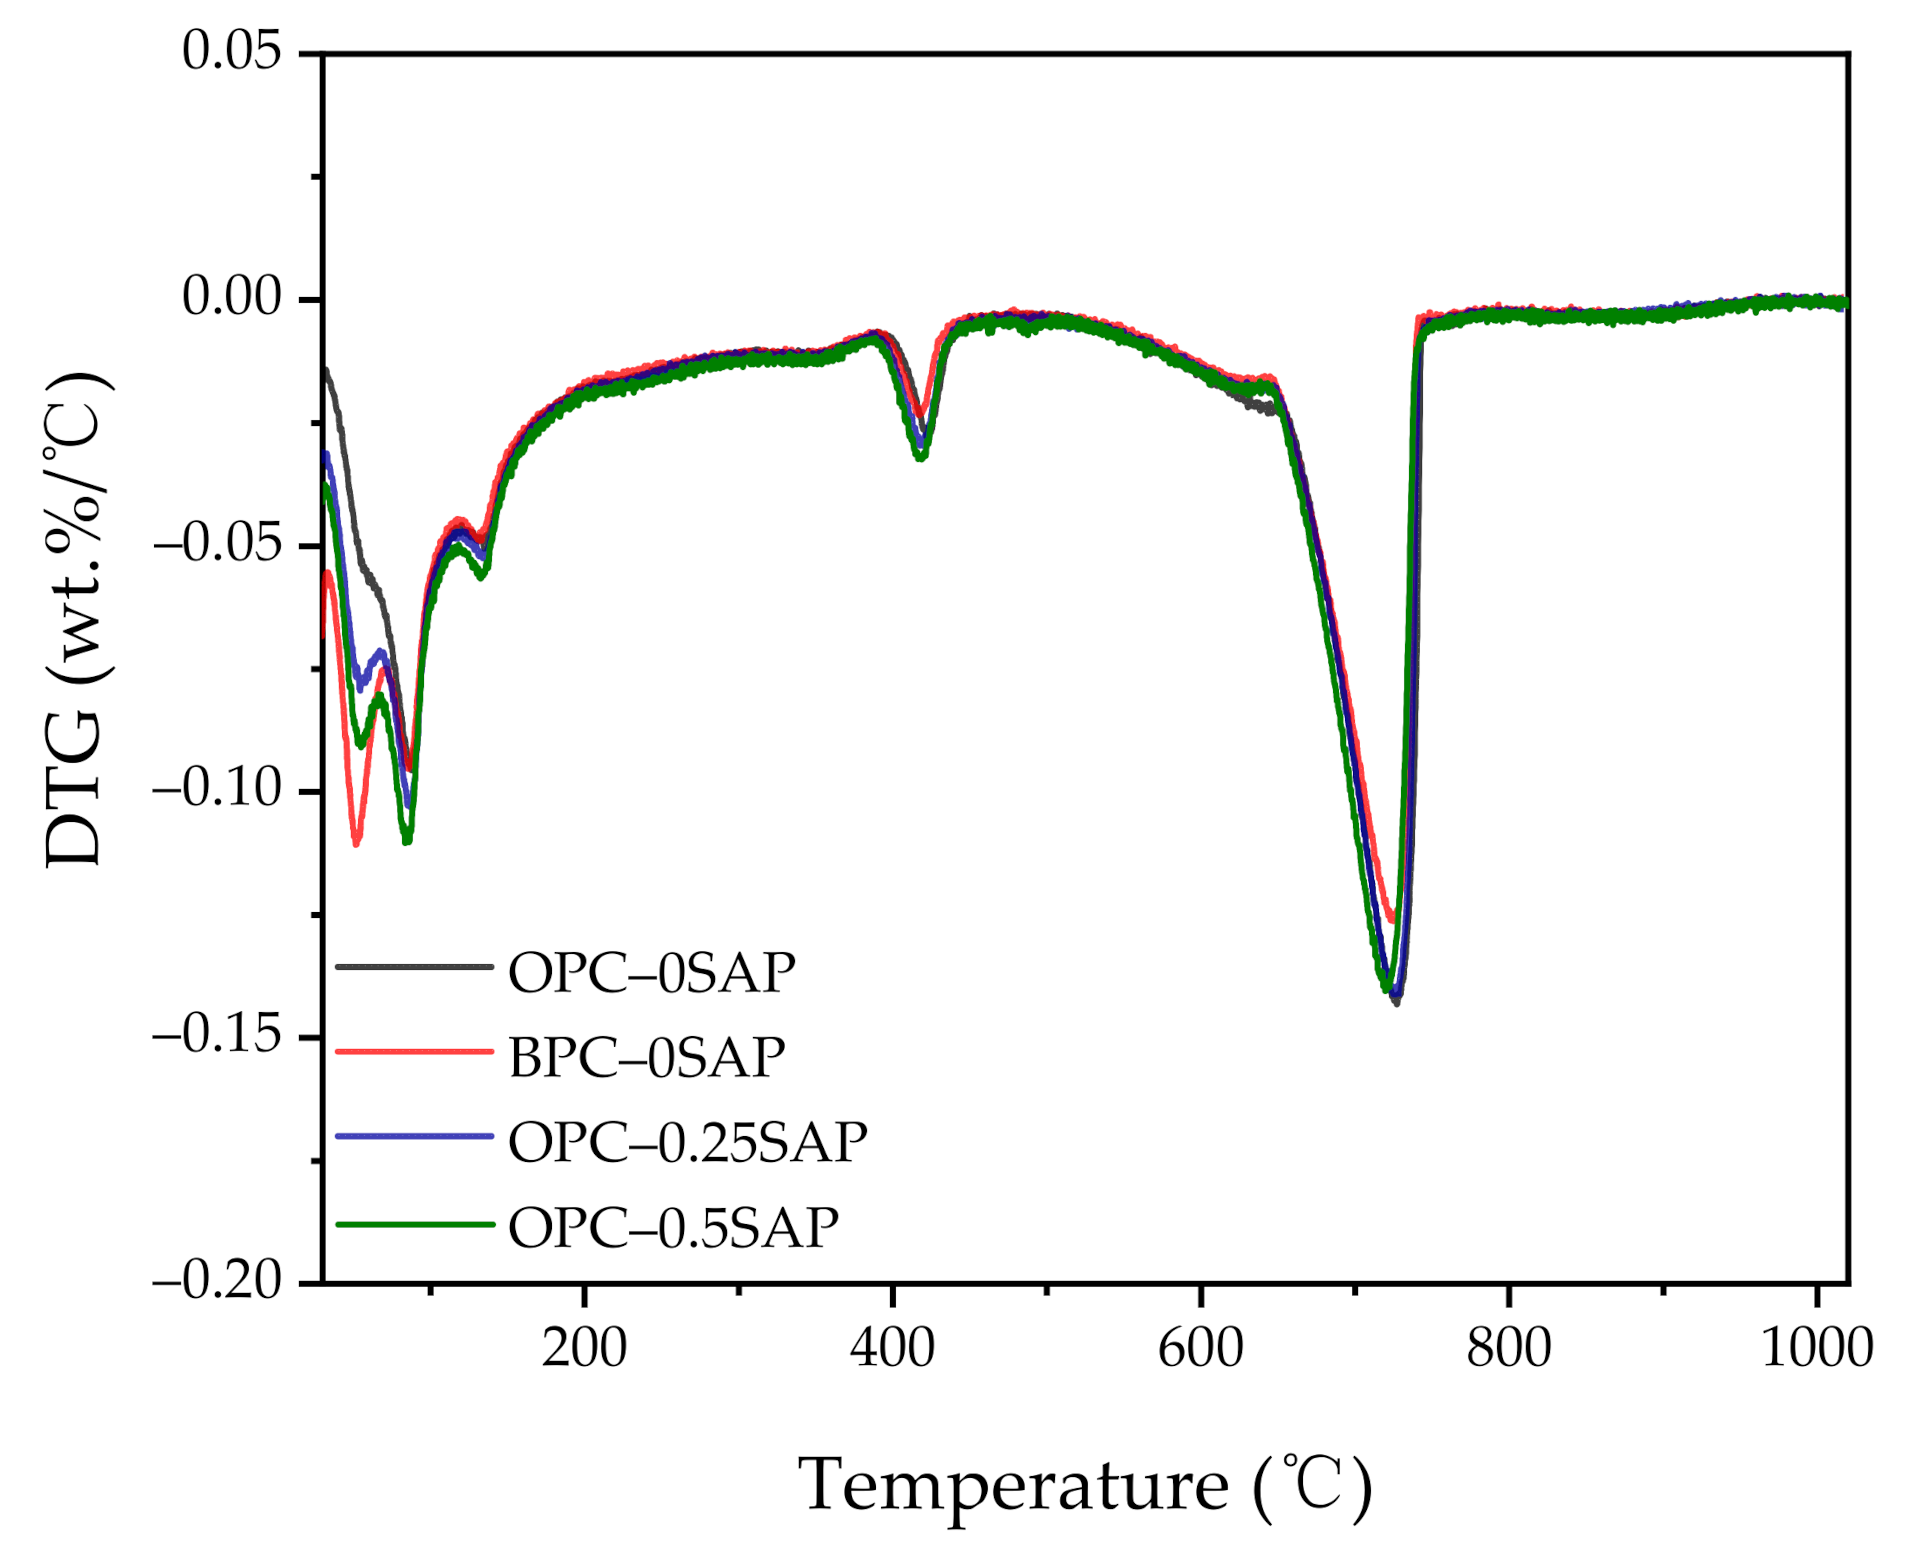
3.4. X-ray Diffraction (XRD) and Thermogravimetric Analysis (TGA)

Figure 11 shows the XRD spectra of the mixed cements at 28 days of hydration. It can be observed from the plots that the peaks of Ca(OH)2 in OPC–0.25SAP and OPC–0.5SAP were higher than OPC–0SAP. This was due to the release of water from SAP, which promoted the hydration reaction and produced more hydration product [16]. Moreover, compared with OPC, BPC had lower reactivity, and the content of calcium hydroxide (CH) in BPC-0SAP was lower than that in OPC–0SAP. The peak of C2S in BPC–0SAP was higher than other specimens. In addition, the formation of hemicarbonaluminate (Hc) was due to the reaction between the alumina phase and limestone powder.
In addition to the XRD spectral scan, the amount of hydration product in the samples was analyzed using thermal analysis techniques. Figure 12 and Figure 13 show the TGA and derivative thermogravimetric analysis (DTG) curves of the samples for 28 days. Weight loss can be observed in the temperature ranges of 400–450 °C and 650–750 °C, corresponding to dehydroxylation of CH and decarbonation of CaCO3, respectively [38,44]. The amount of CH was calculated as follows [45]:
CH = w 400 w 450 w 550 × 74 18 × 100 %
where w 400 and w 450 are the masses of samples at the temperatures of 400 and 450 °C, respectively. The item 74/18 indicates the ratio of CH molar weight to water.
The amount of combined water was calculated as follows [45]:
water = w 105 w 550 w 550 × 100 %
where w 105 is the mass of samples at the temperature of 105 °C.
Based on the above equations, the masses of CH and combined water (W) can be determined and are shown in Table 5.
Regarding the CH content, our experimental results showed that CHOPC-0.5SAP > CHOPC-0.25SAP > CHOPC–0SAP > CHBPC–0SAP. The increase in CH content with increasing SAP content indicates that the addition of SAP increased hydration. Moreover, the samples with BPC had a lower CH content compared to the control group because the reactivity of the BPC was lower than that of the OPC. The TGA analysis results showed agreement with the XRD results.
Regarding the combined water content, our experimental results show that WOPC-0.5SAP > WOPC-0.25SAP > WOPC–0SAP > WBPC–0SAP. The trend of combined water was similar to that of CH. The combined water content was much less than 25%, which was the theoretical maximum of the combined water for the full hydration of 1 g cement. This was due to the low water/binder ratio and dilution effect of mineral mixtures, such as silica fume, slag, and limestone. A low water/binder ratio restricts cement-based materials from hydrating, and the addition of the mineral admixture can lower the combined water content.

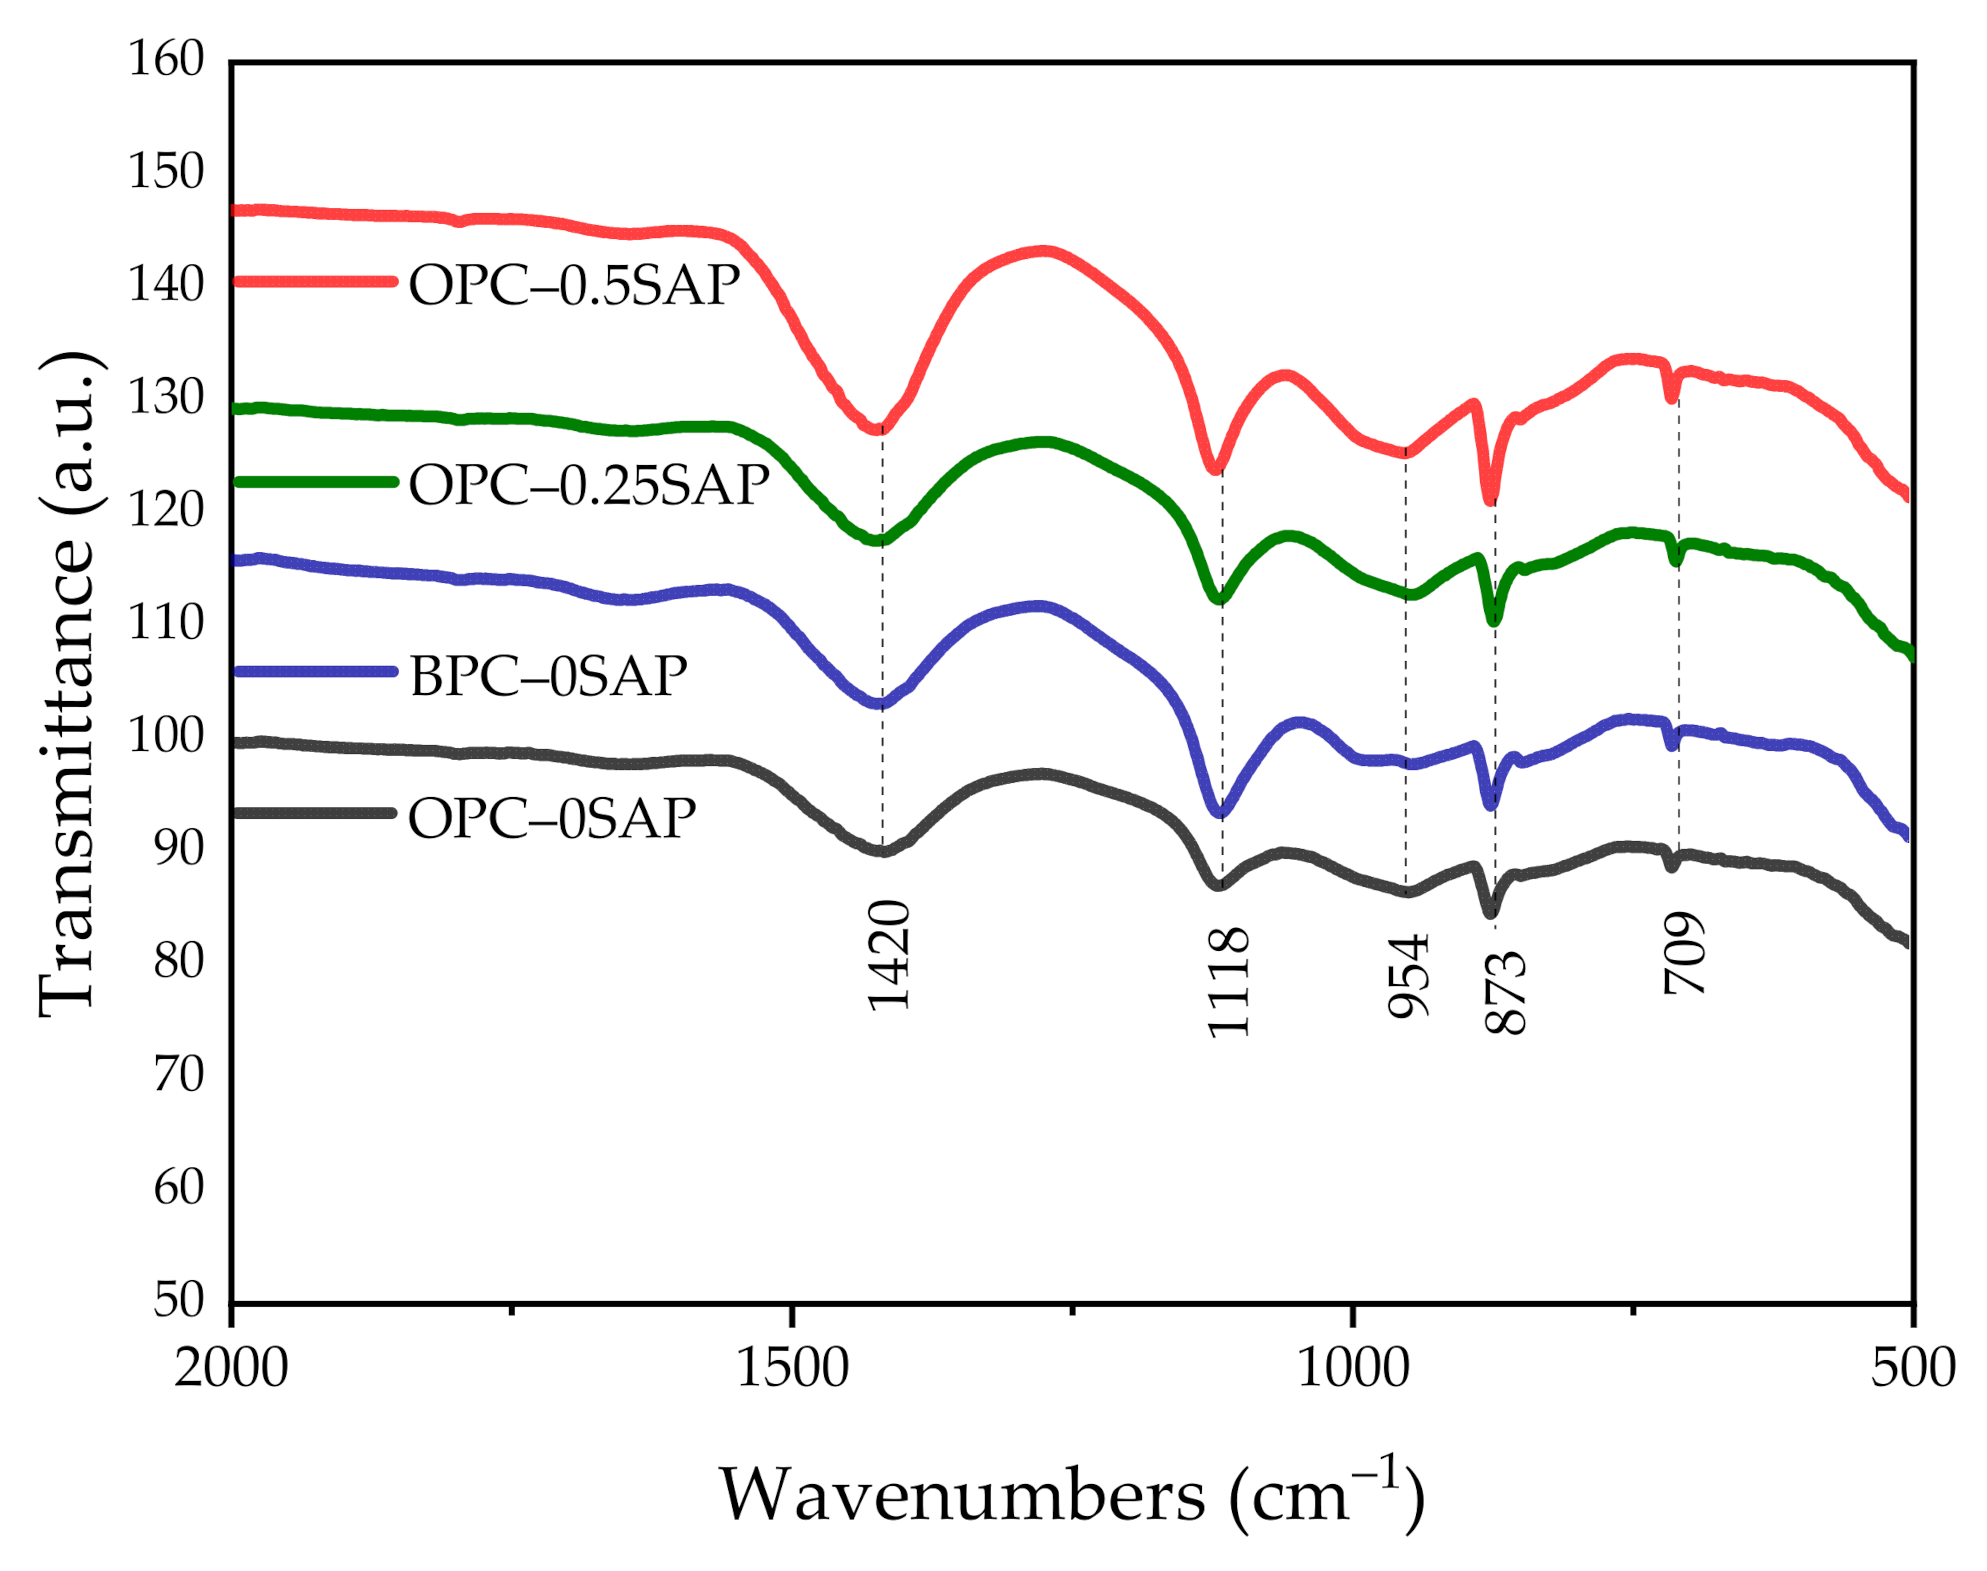
3.5. Attenuated Total Reflectance (ATR)–Fourier-Transform Infrared Spectroscopy (FTIR)

Figure 14 shows the ATR–FTIR spectra of the mixed samples in the range of 500–2000 cm−1. The 1420, 873 (out-of-plane vibration), and 709 cm−1 (in-plane bending) spectra in the scanned spectra correspond to CO32− (limestone) [46,47,48,49]. The 1118 and 954 cm−1 spectra represent the asymmetric stretching vibration of SO42− and the stretching vibration of Si-O at C-S-H, respectively [50,51]. The absorption peaks of the spectrum corresponding to the samples containing SAP at 954 cm−1 were significantly greater than those of the other two groups. The relative absorption peaks more obviously increased when the SAP content increased, which was attributed to the reaction of the C3S clinker at 800–970 cm−1 and the C-S-H formed by silica polymerization [46,52].

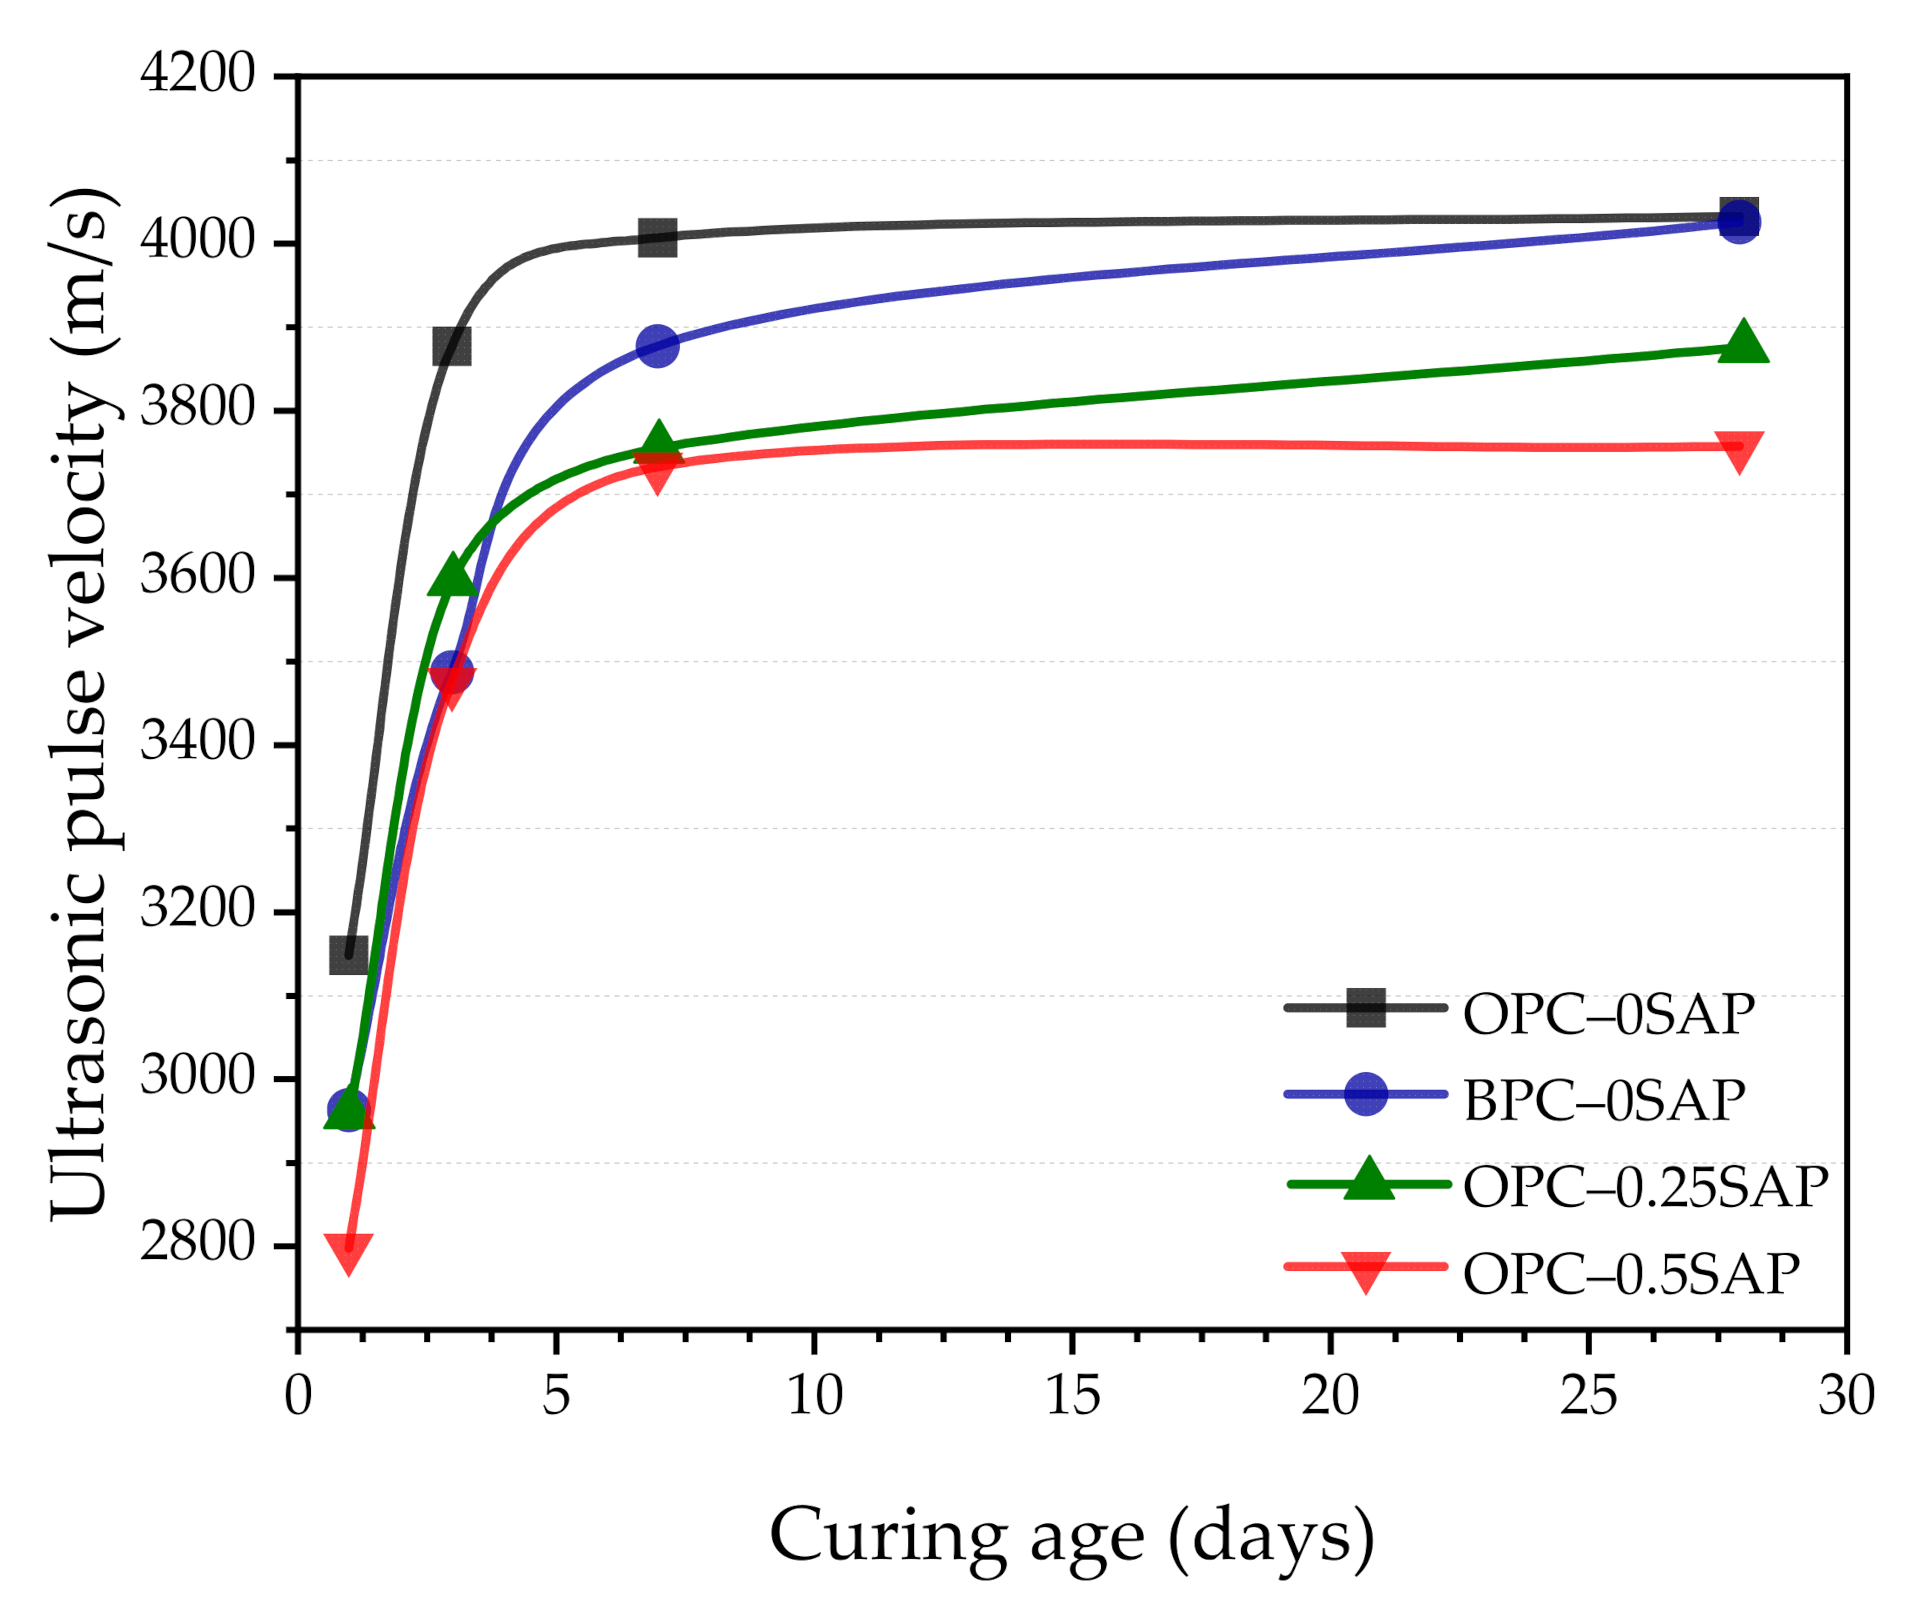
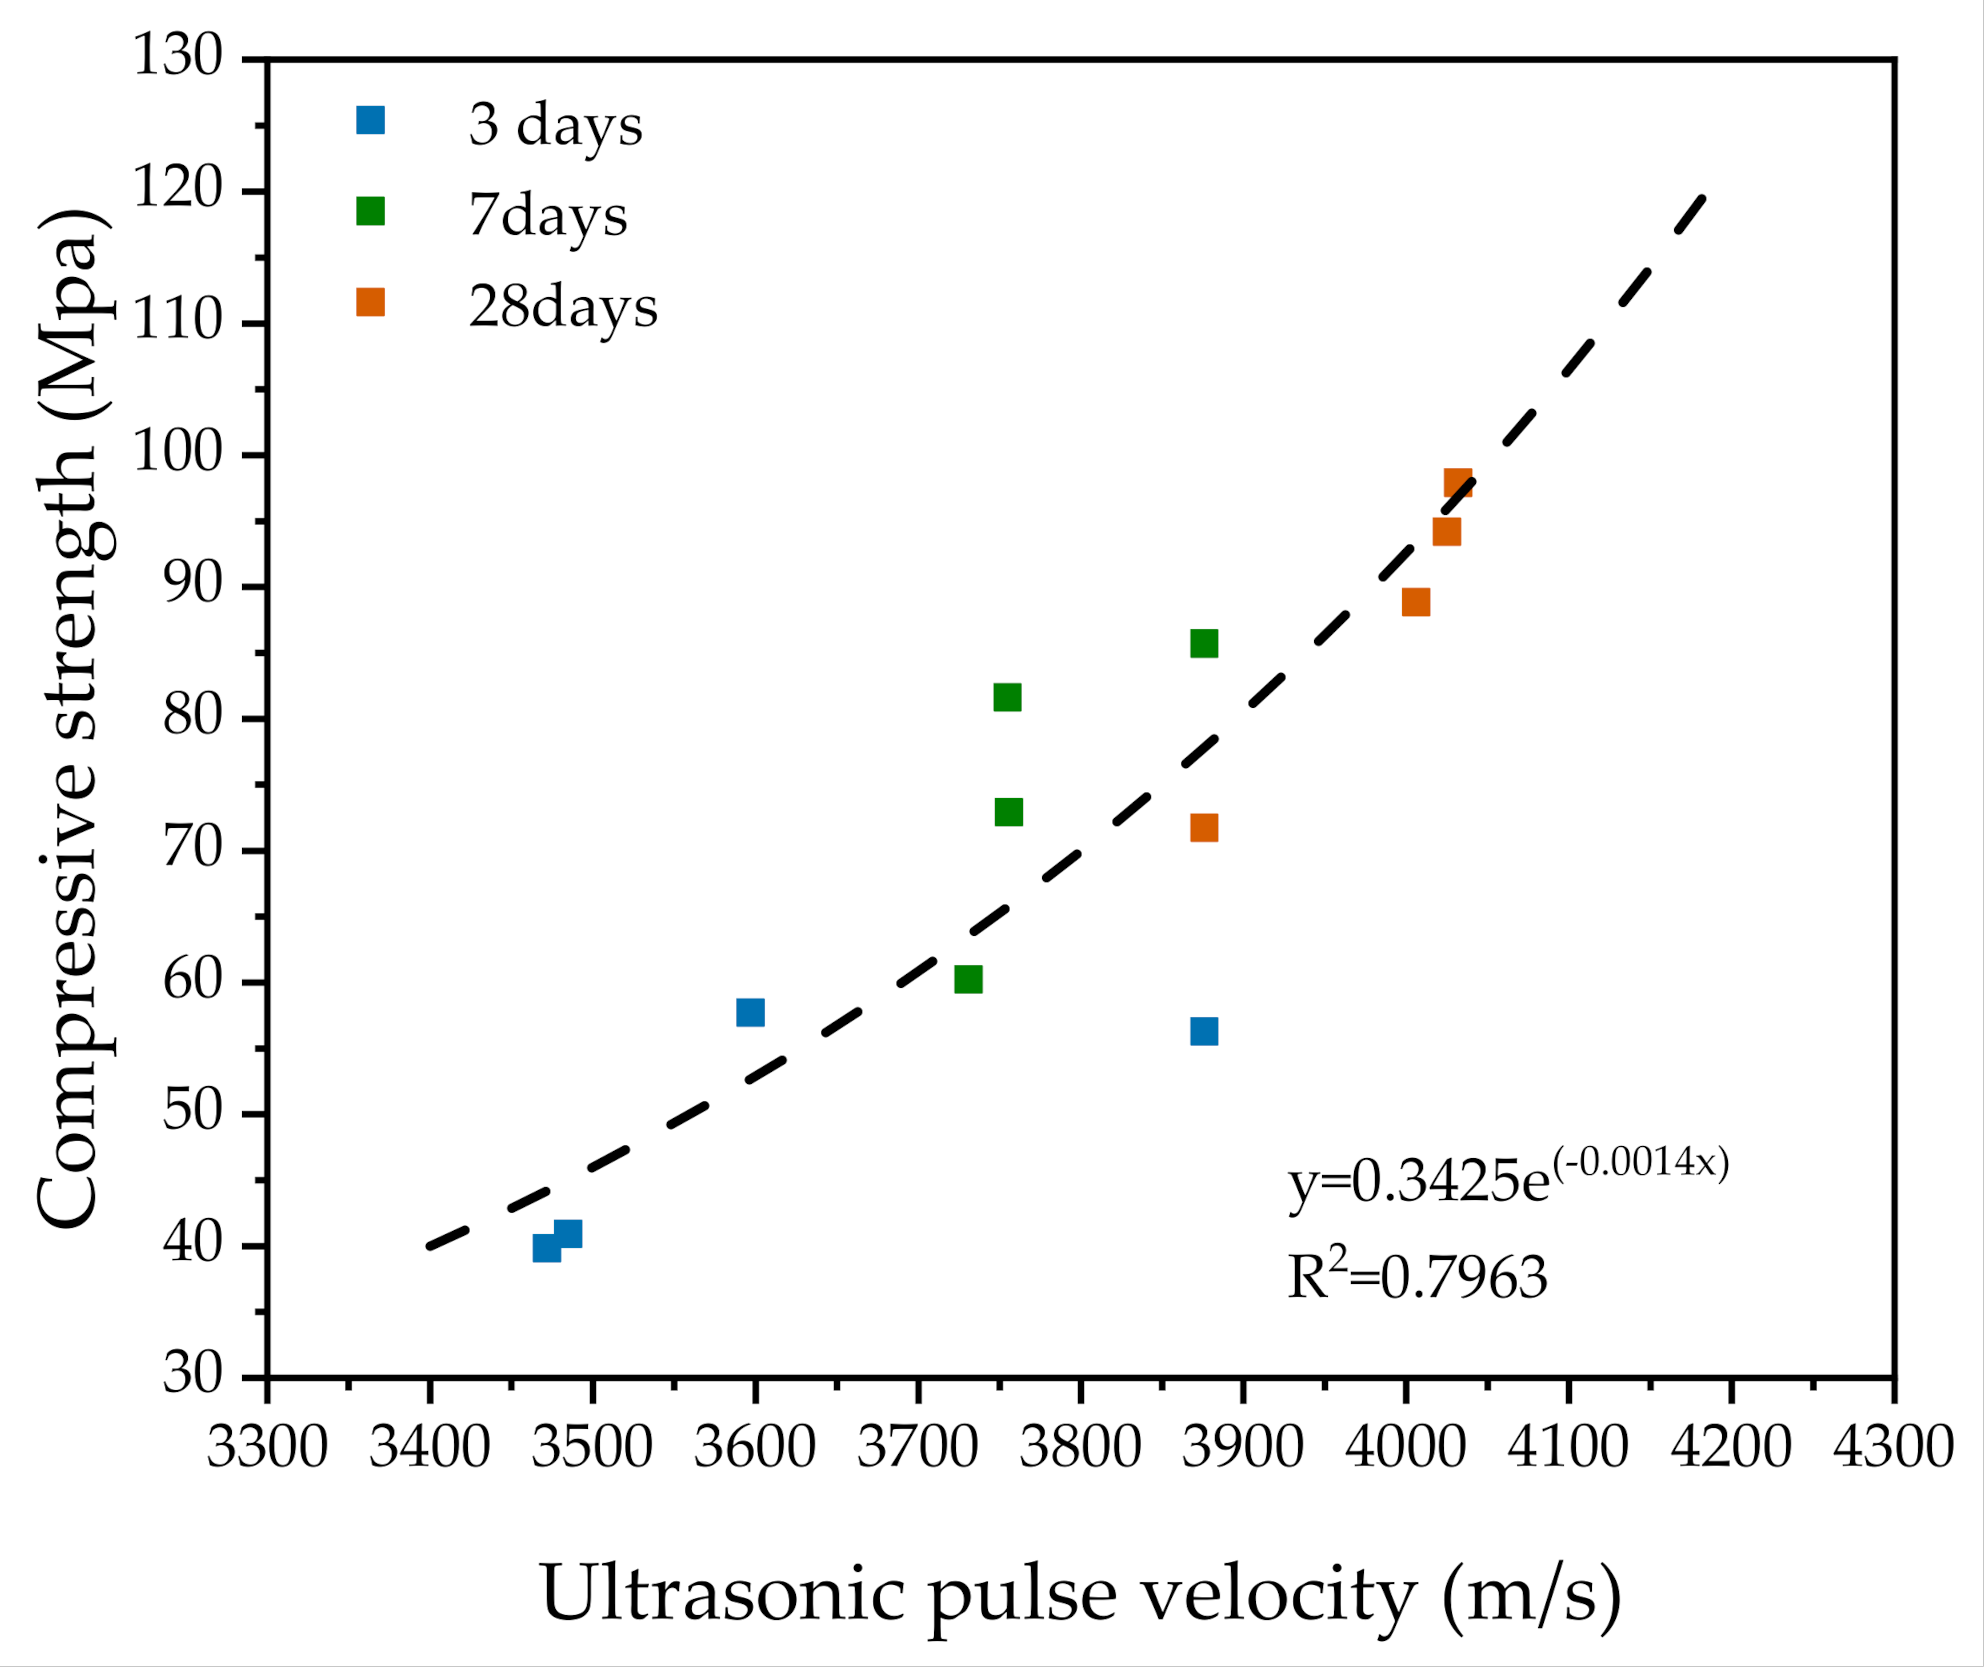
3.6. Ultrasonic Pulse Velocity (UPV)

Figure 15 shows the UPV mixture trend. The evolution of UPV was not only related to the density and elasticity of the material but also to the water content [53]. Higher SAP content makes higher effective w/c, and lower UPV [54,55]. After the dormant period, cement hydration produced a large amount of hydration product, wherein the degree of hydration increased, and the mixture had a lower porosity and a higher solid volume fraction, leading to an increase in UPV [55,56].
The UPV for all samples increased when curing age increased. There was fast growth at the early age and slow growth at the later age. The UPV of the OPC–0SAP sample was higher than that of the OPC–0.25SAP and OPC–0.5SAP samples. The difference gradually became larger as the SAP content increased. This was due to the fact that the higher the SAP addition and w/c, the lower the UPV. The BPC–0SAP sample grew at a lower rate than the other three sample groups (OPC–0SAP, OPC–0.25SAP, and OPC–0.5SAP) at the early age, but the growth rate significantly increased at the later age due to the high content of C2S contained in the BPC, which resulted in a slow initial reaction. C2S reacted in the late stages of hydration, increasing the degree of hydration and helping to increase the UPV at the later age [57,58]. This was in line with the trend of strength. The compressive strength of the samples at 3, 7, and 28 days regressed against the UPV, as shown in Figure 16. The strength was found to have a high exponential correlation with UPV. UPV can be a non-destructive test method for evaluating the strength development of SUHPP.

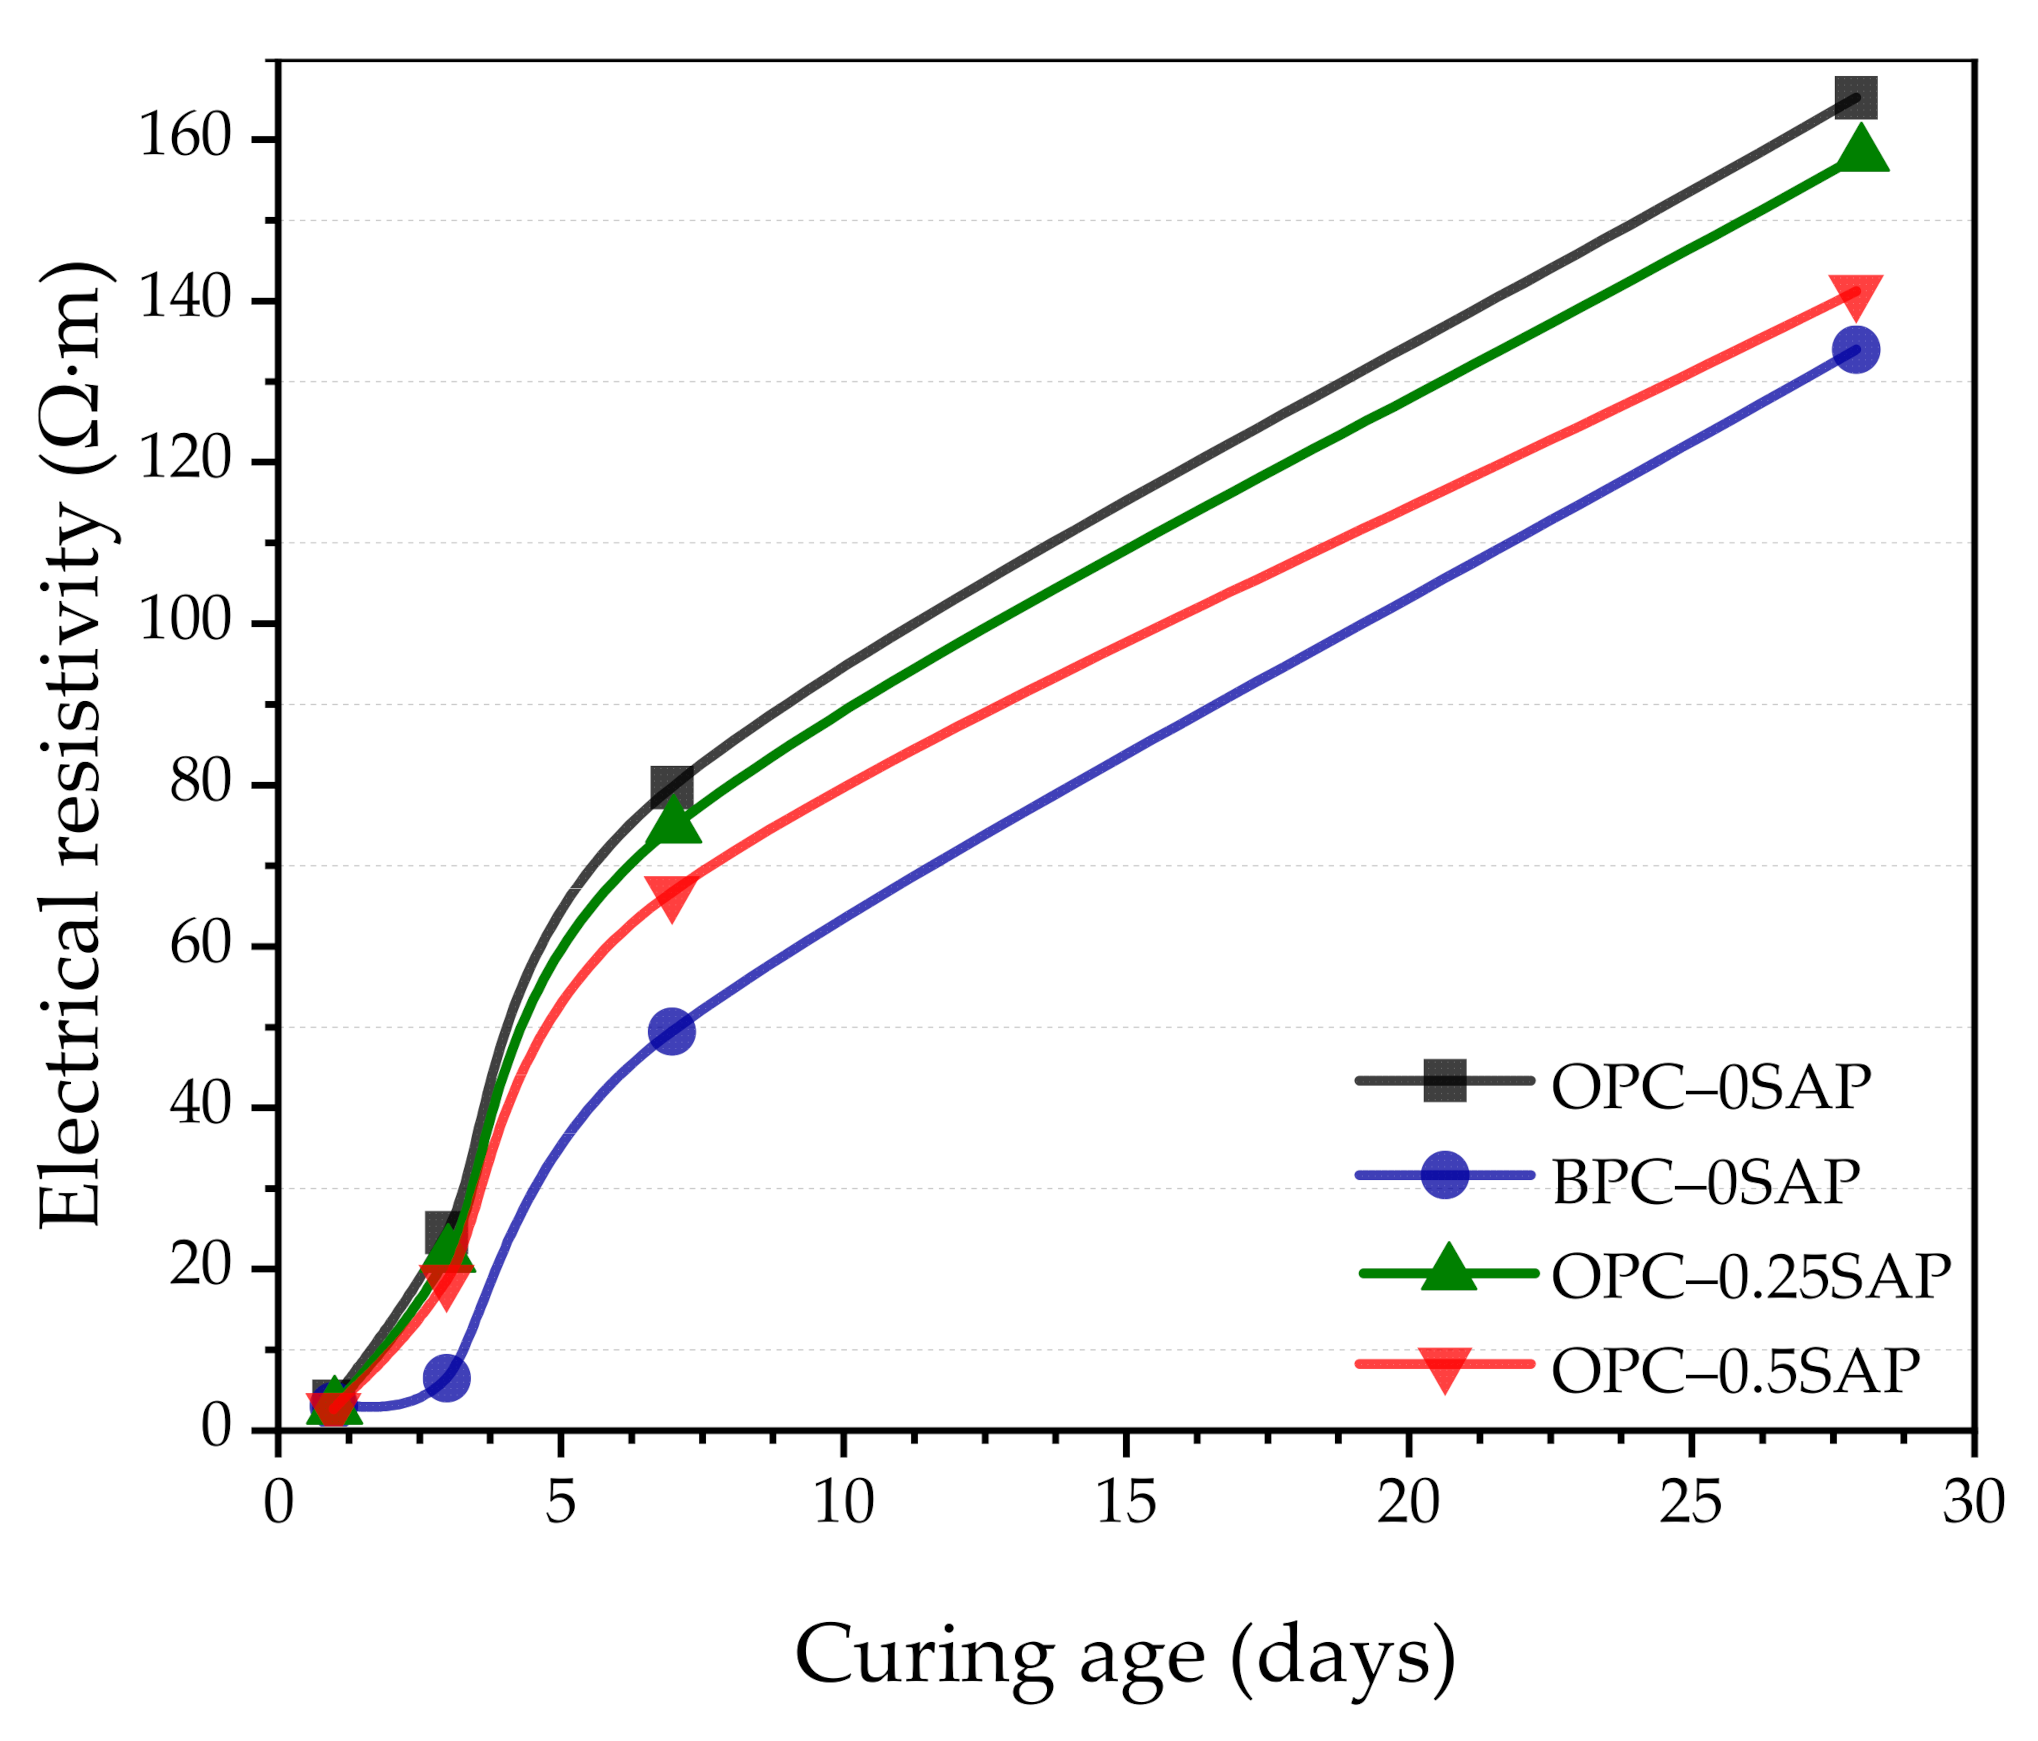
3.7. Electrical Resistivity

In this study, durability was evaluated based on electrical resistivity tests. For cement-based materials, as electrical resistivity increases, chloride diffusivity decreases and the service life of structures increases. Moreover, the increase in the electrical resistivity can lower the corrosion current, which is helpful for extending the service life.
Figure 17 shows the evolution of the samples’ electrical resistivity with the curing age. Electrical resistivity was mainly influenced by porosity and pore structure (microstructural characteristics) [59]. SAP was added to the mixture to act as an internal curing agent and to promote hydration. However, SAP forms large pores during the resolution process, resulting in increased porosity. The negative effect of porosity on electrical resistivity far exceeds the promoting effect of internal curing [51]. The C2S of BPC was hydrated at a later age and gradually refined the pore structure, resulting in a gradual increase in electrical resistivity [33].
The electrical resistivity of the samples OPC–0.25SAP, OPC–0.5SAP, and BPC–0SAP was lower than that of the control samples. The higher the admixture of SAP, the lower the electrical resistivity. This is attributed to the increased w/c of the samples with SAP and the increased porosity due to SAP resolution. In addition, the electrical resistivity of the BPC–0SAP sample was significantly lower than that of the other samples. However, a gradual increase in the growth rate was clearly observed with the increase in the curing age. This was due to the late C2S hydration, which gradually improved the microstructure. Wang et al. [60] also showed that cements containing higher C2S have a much denser pore structure at a later age, which can improve the properties of the mixture. A gradual acceleration of the resistivity growth rate of BPC–0SAP can be clearly observed in later stages. The densification of the pore structure also promoted the strength development (shown in Figure 4).

4. Discussion

The discussion items consist of (1) the comparison of SAP with classic fibers, (2) comparison of BPC with OPC, (3) comparison of the AS reduction mechanisms of SAP and BPC, (4) the expected practical application of SAP and BPC, and (5) future studies.
First, regarding AS reduction, SAP shows superior performance to classic polyester fibers. The mechanisms of AS reduction for SAP and classic polyester fibers are different. SAP can replenish water through internal curing, and classic polyester fibers can serve as internal restraints of AS [26]. Moreover, SAP affects the technological processes of concrete mixing. The mixing procedure of SAP-blended concrete is slightly more complex than that of traditional concrete, because the presoaked SAP turns into a hydrogel and is difficult to disperse in the mixture [12]. As shown in the mixing procedure (Figure 3), Step 2 involves adding 50% of water, SP, and/or additional water and mixing for 60 s, and Step 3 involves adding dry SAP powder into the mixer. In addition, compared with classic polyester fibers, the cost of SAP is much higher. However, considering the superior performance of SAP regarding AS reduction, SAP is a promising material for AS reduction in SUHPP.
Second, BPC specimens present lower AS than OPC specimens. Furthermore, BPC specimens have a lower hydration heat, a lower CH and combined water content, less electrical resistivity, and a similar late-age strength and UPV to OPC specimens. Moreover, because BPC concrete has a higher late-age strength than OPC concrete, BPC concrete has a stronger abrasion resistance [61]. In addition, compared with OPC, the cost of BPC is slightly higher. However, considering the advantages of BPC, such as low AS, low hydration heat, low CO2 emission, and high late-age strength, we believe that BPC is a promising material for the production of SUHPP.
Third, the mechanisms of AS reduction in SAP and BPC are different. SAP can be used for internal curing, and BPC can control the rate of hydration [26]. The AS reduction level of SAP can be designed through SAP content, absorption ability, and particle size [26]. The AS reduction level of BPC mainly depends on the reactivity of BPC. Moreover, the addition of SAP impairs late-age strength, while BPC concrete has a similar strength to OPC concrete.
Fourth, based on the experimental results of this study, SAP can be used as a component of high-strength concrete which has a low water/binder ratio [37]. SAP can lower the AS of hardening high-strength concrete and mitigate cracks due to AS. Moreover, BPC can be used as a binder of high-strength concrete and mass concrete because BPC can lower the AS of high-strength concrete and hydration heat [61]. BPC is helpful for the mitigation of early-age AS cracks and thermal cracks.
Fifth, this study focuses only on the basic properties of SUHPP. In future studies, more investigations should be carried out to evaluate other highly important material properties—for example, tensile strength, modulus of elasticity, and fracture energy.

5. Conclusions

This study presents a systematical experimental investigation of the effects of SAP and cement type on SUHPP performance. Four group specimens were produced: OPC–0SAP, OPC–0.25SAP, OPC–0.5SAP, and BPC–0SAP. The SAP contents of OPC–0SAP, OPC–0.25SAP, and OPC–0.5SAP were 0%, 0.25%, and 0.5%, respectively. The cement types used in OPC–0SAP and BPC–0SAP specimens were ordinary Portland cement and belite-rich Portland cement, respectively. Experimental items consisted of compressive strength, AS, isothermal calorimetry, XRD, TGA, ATR–FTIR, UPV, and electrical resistivity. The following conclusions were obtained:
(i)
At the early age of 3 days, the strength of OPC–0.25SAP samples was 2.5% higher than that of the control specimen. At the later age of 28 days, the compressive strengths of OPC–0.25SAP and OPC–0.5SAP were 12.5% and 25.5% lower than that of the control specimen, OPC–0SAP. This was due to the water release cavities created by SAP. In contrast, the strength of BPC–0SAP developed slowly at an early age, while the strength was similar to that of the control specimen, OPC–0SAP, at the later age of 28 days.
(ii)
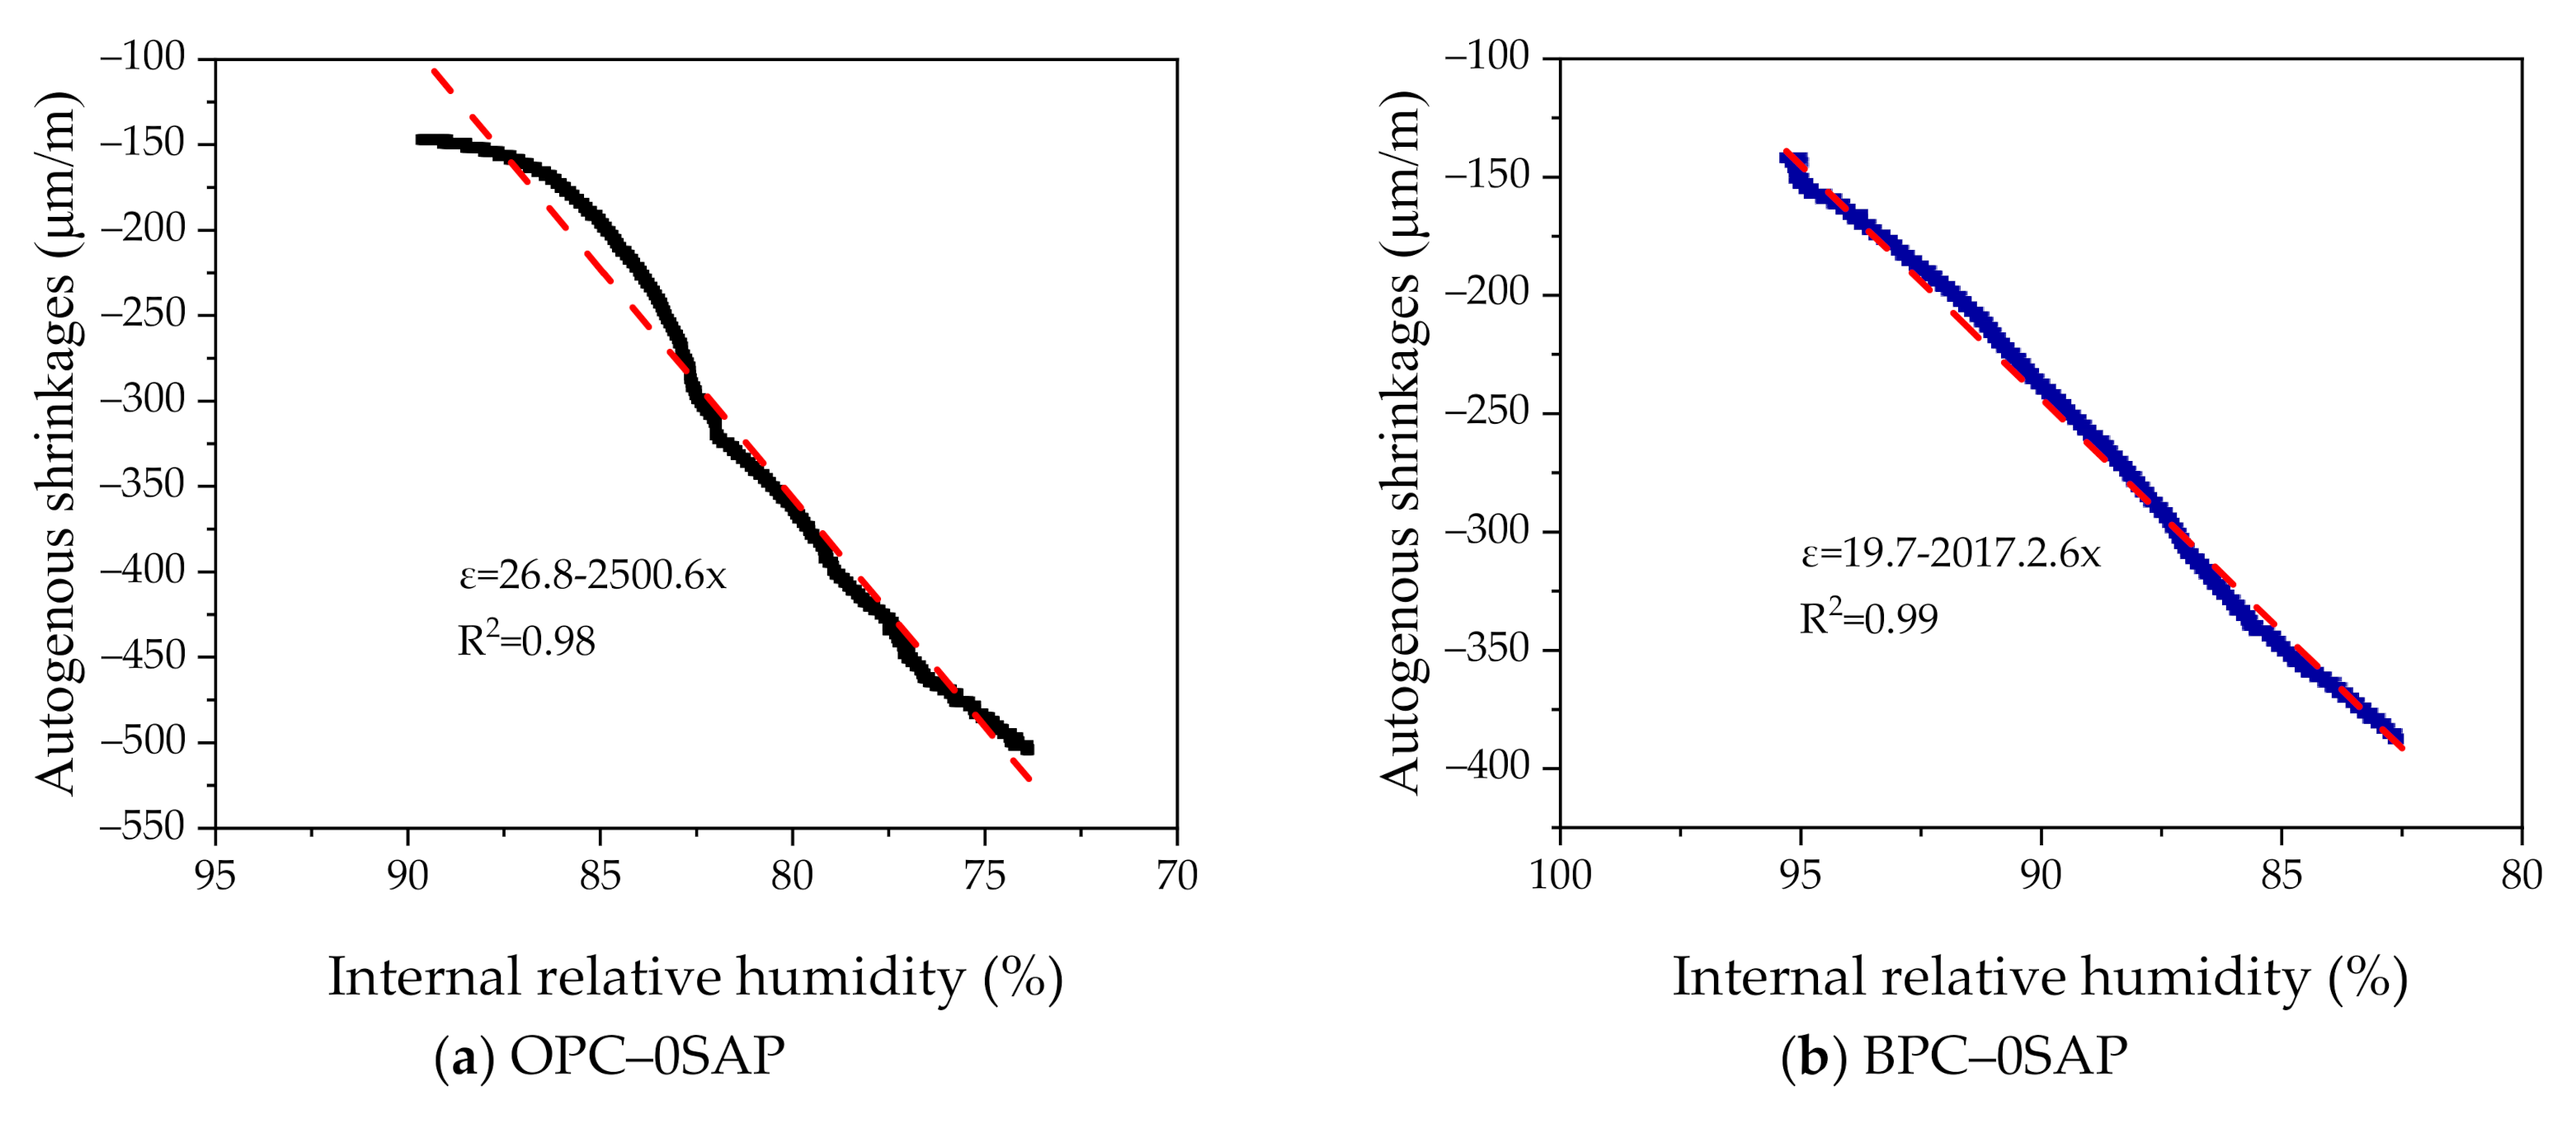
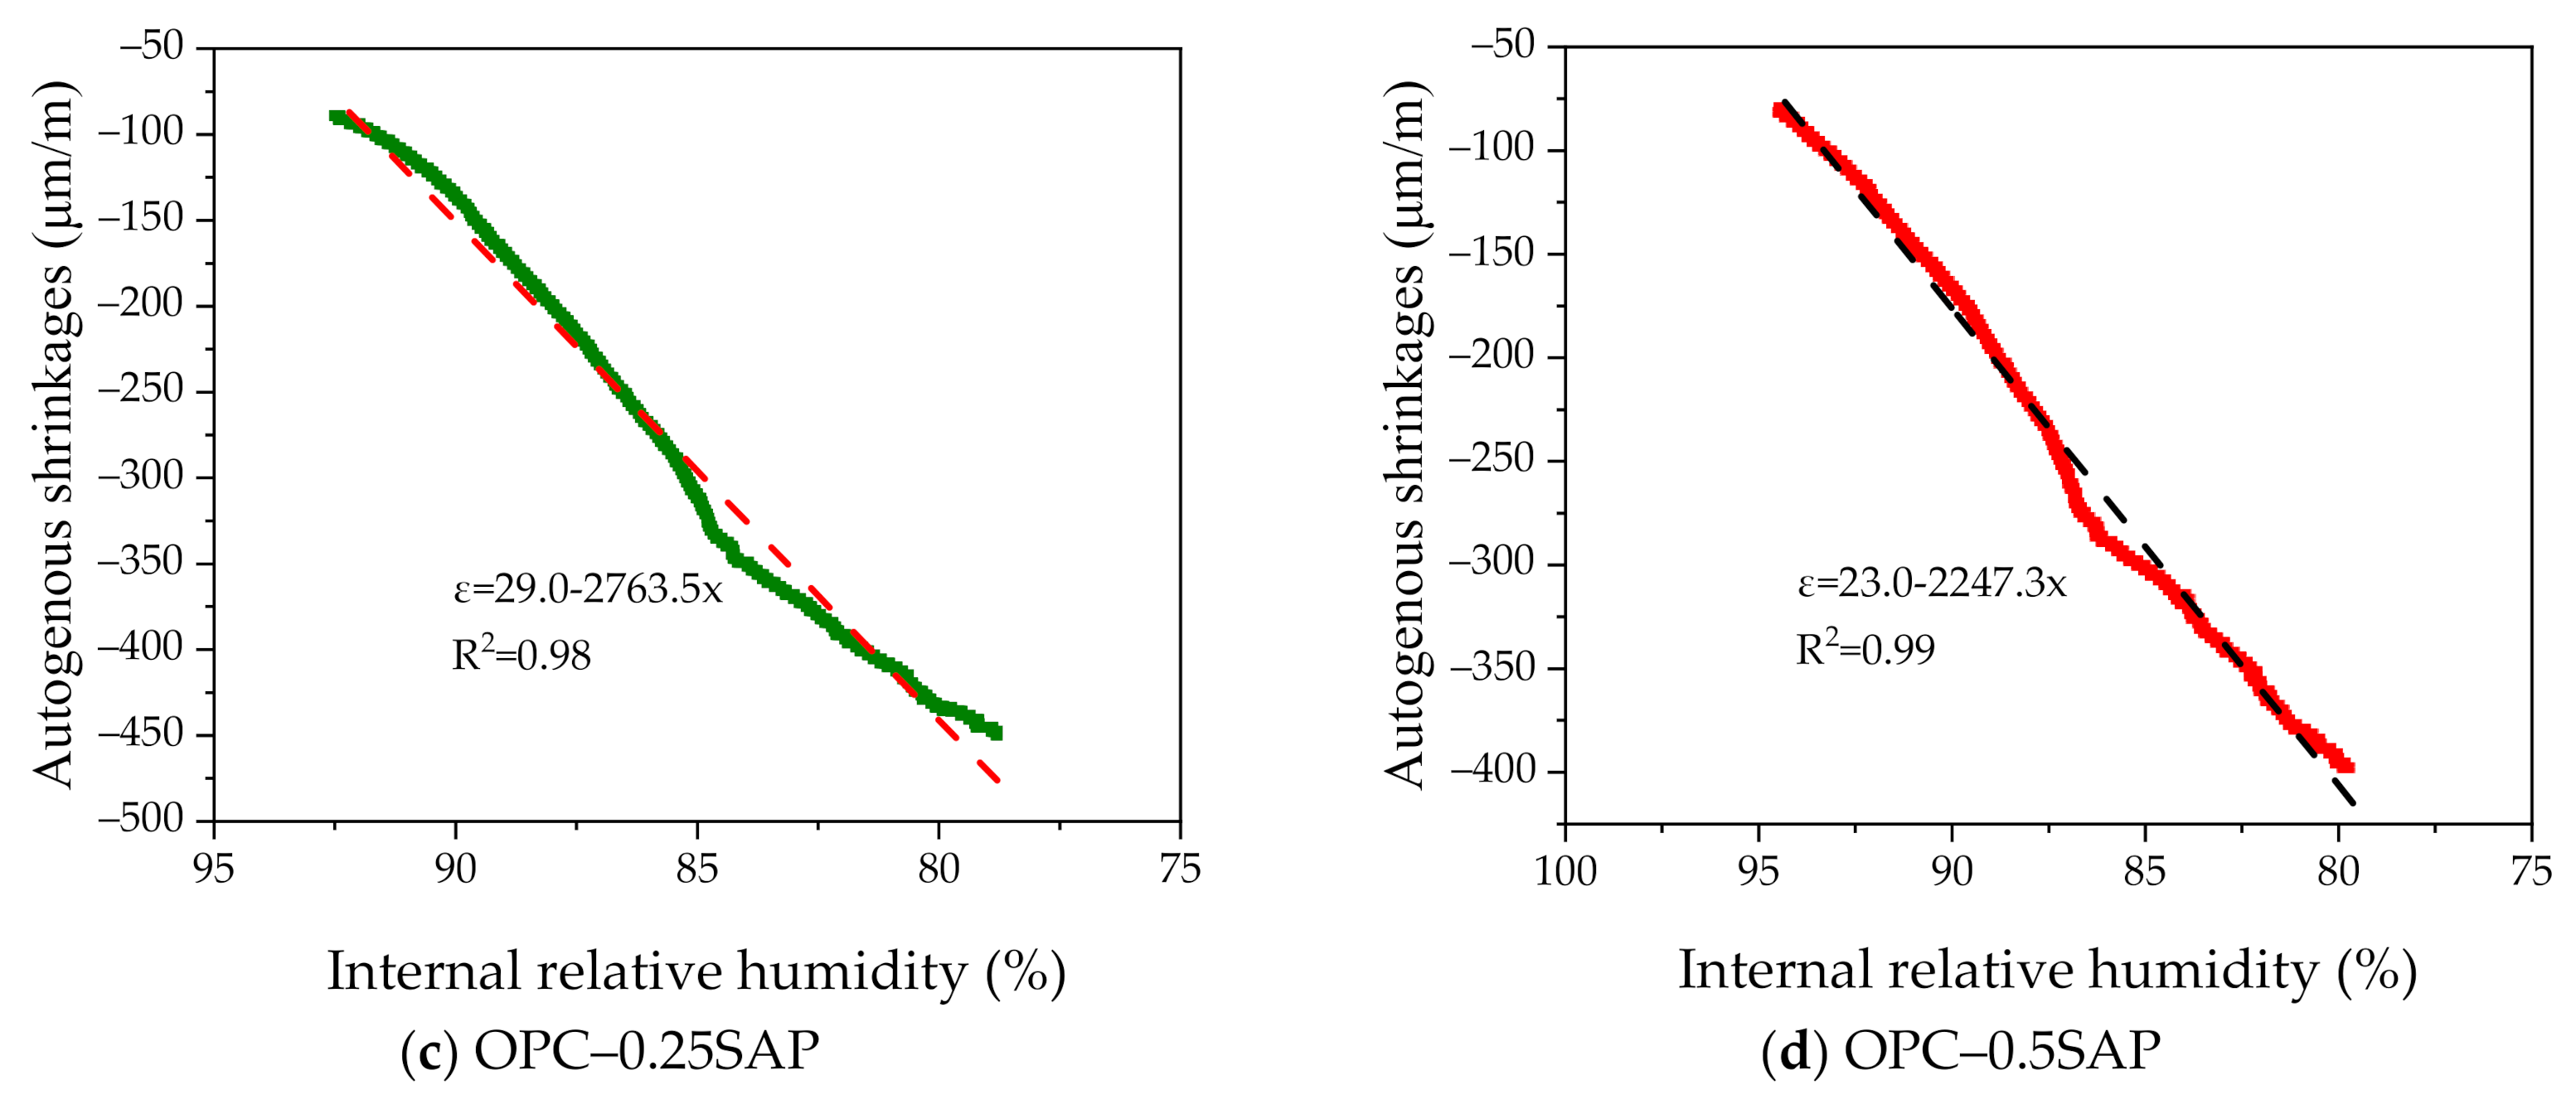
For the case of OPC–0.25SAP and BPC–0SAP, compared to the control group, the reduction in the AS sample was greater than the strength. However, for the OPC–0.5SAP sample, AS reduction was lower than the strength. Moreover, AS showed a linear relationship with the internal relative humidity. The coefficients of determination between AS and the internal relative humidity were higher than 98%. The reduction in internal relative humidity was the main reason for AS in the SUHPP.
(iii)
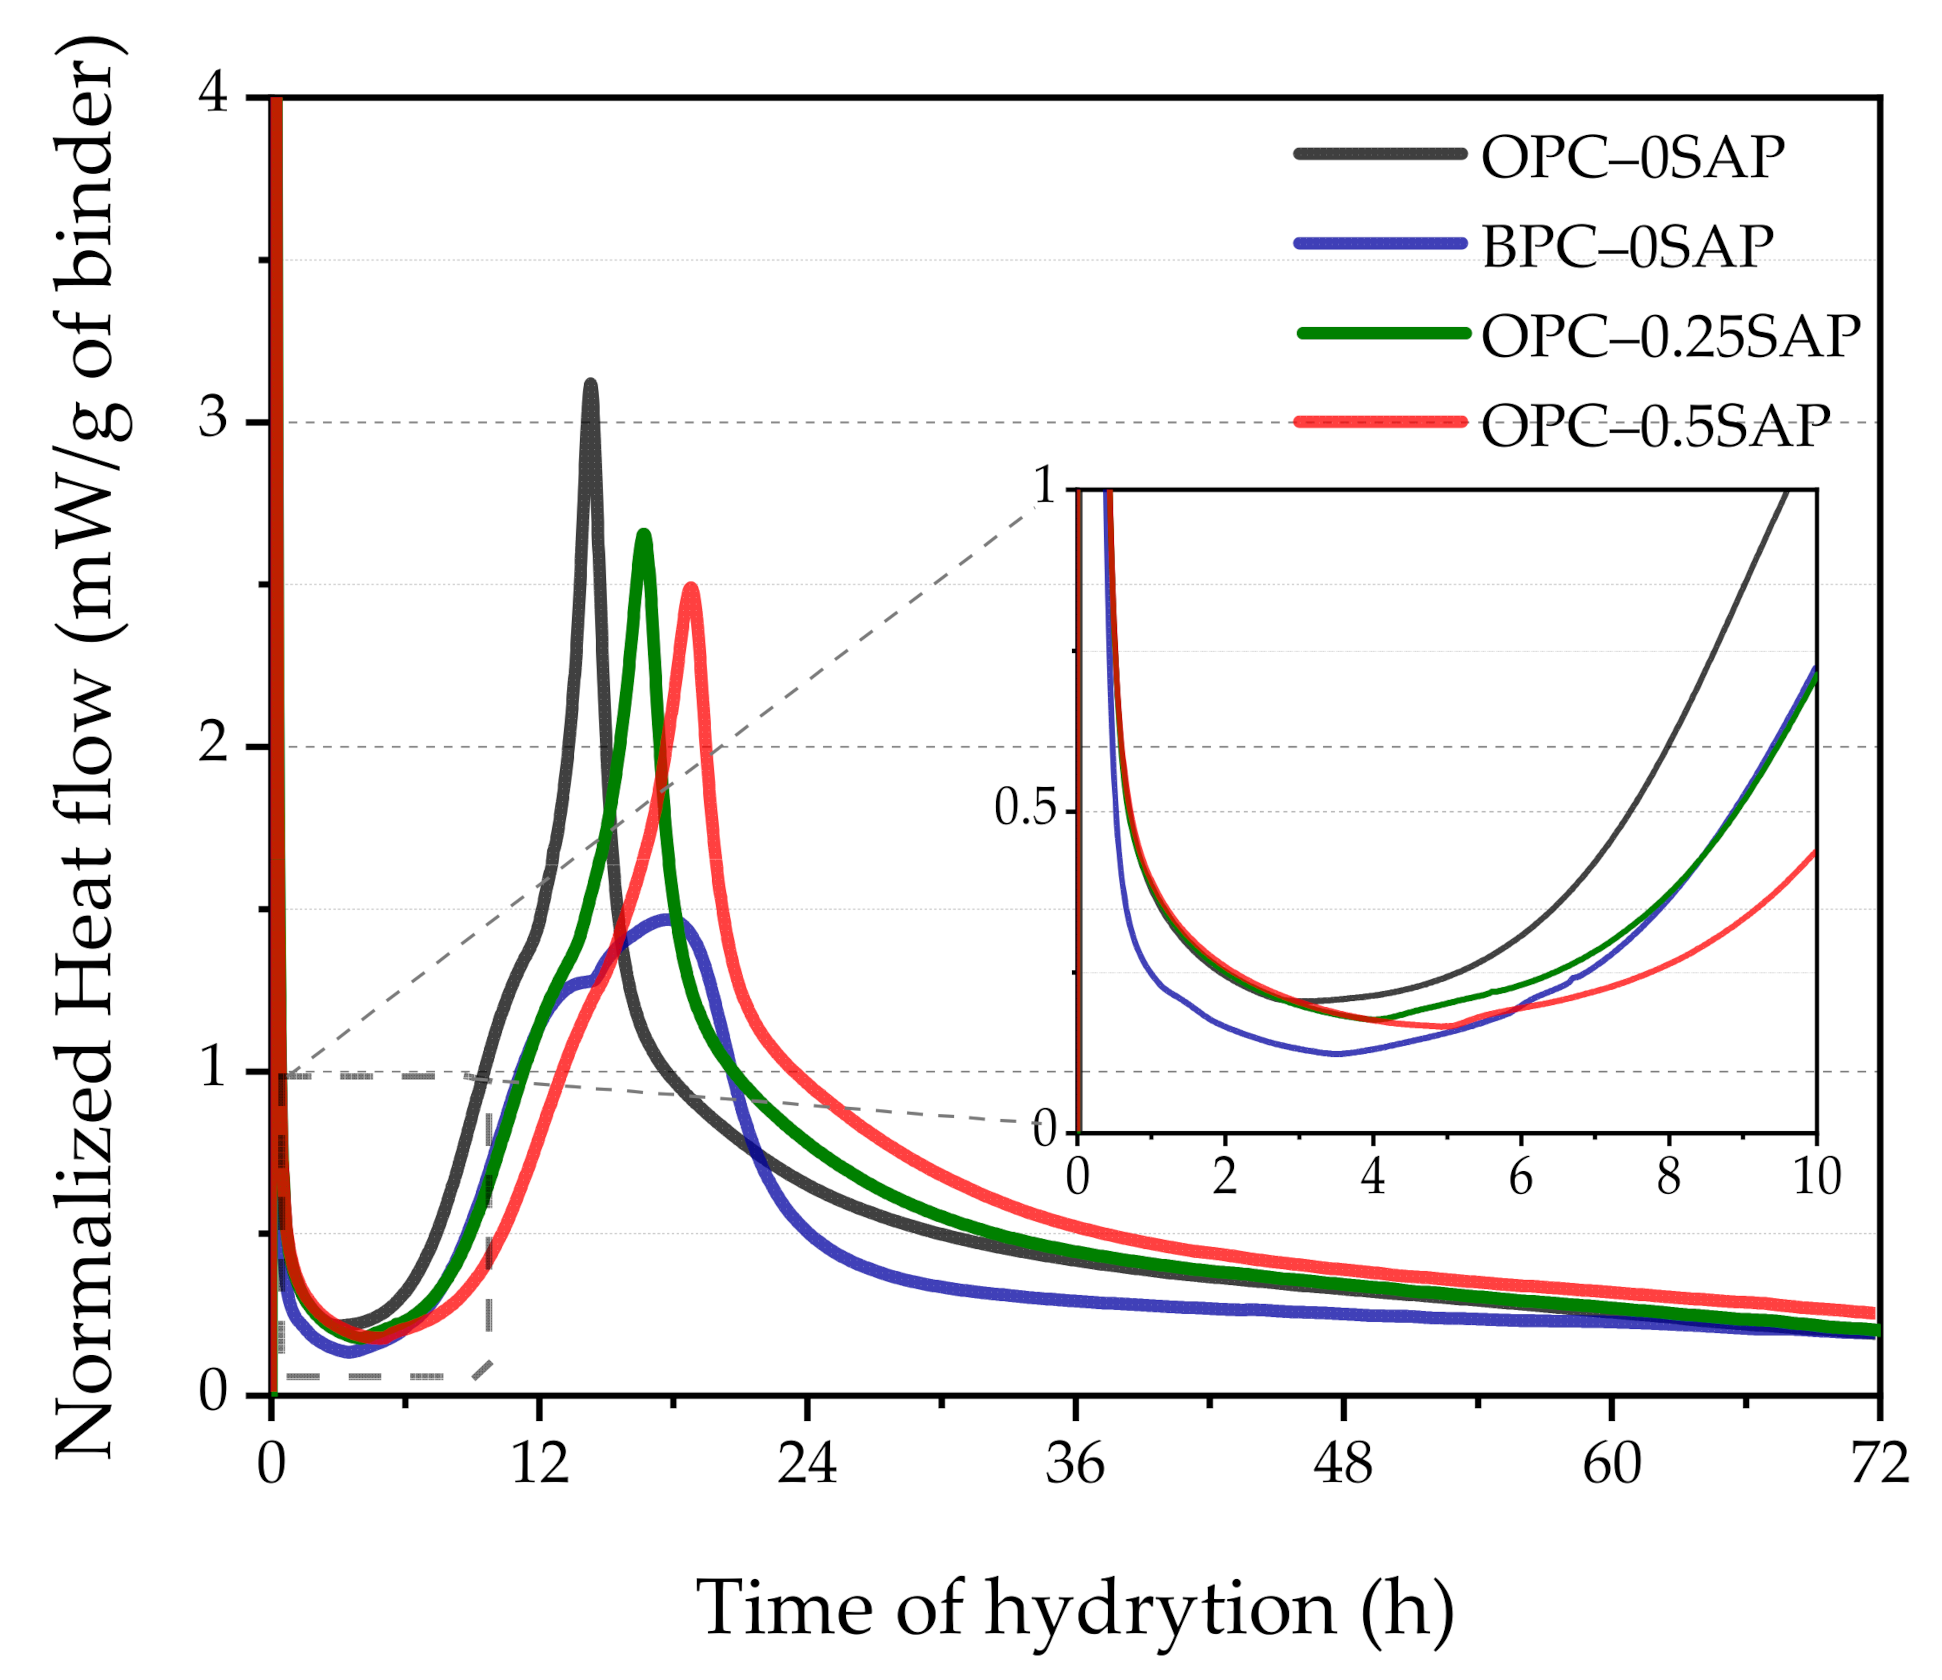
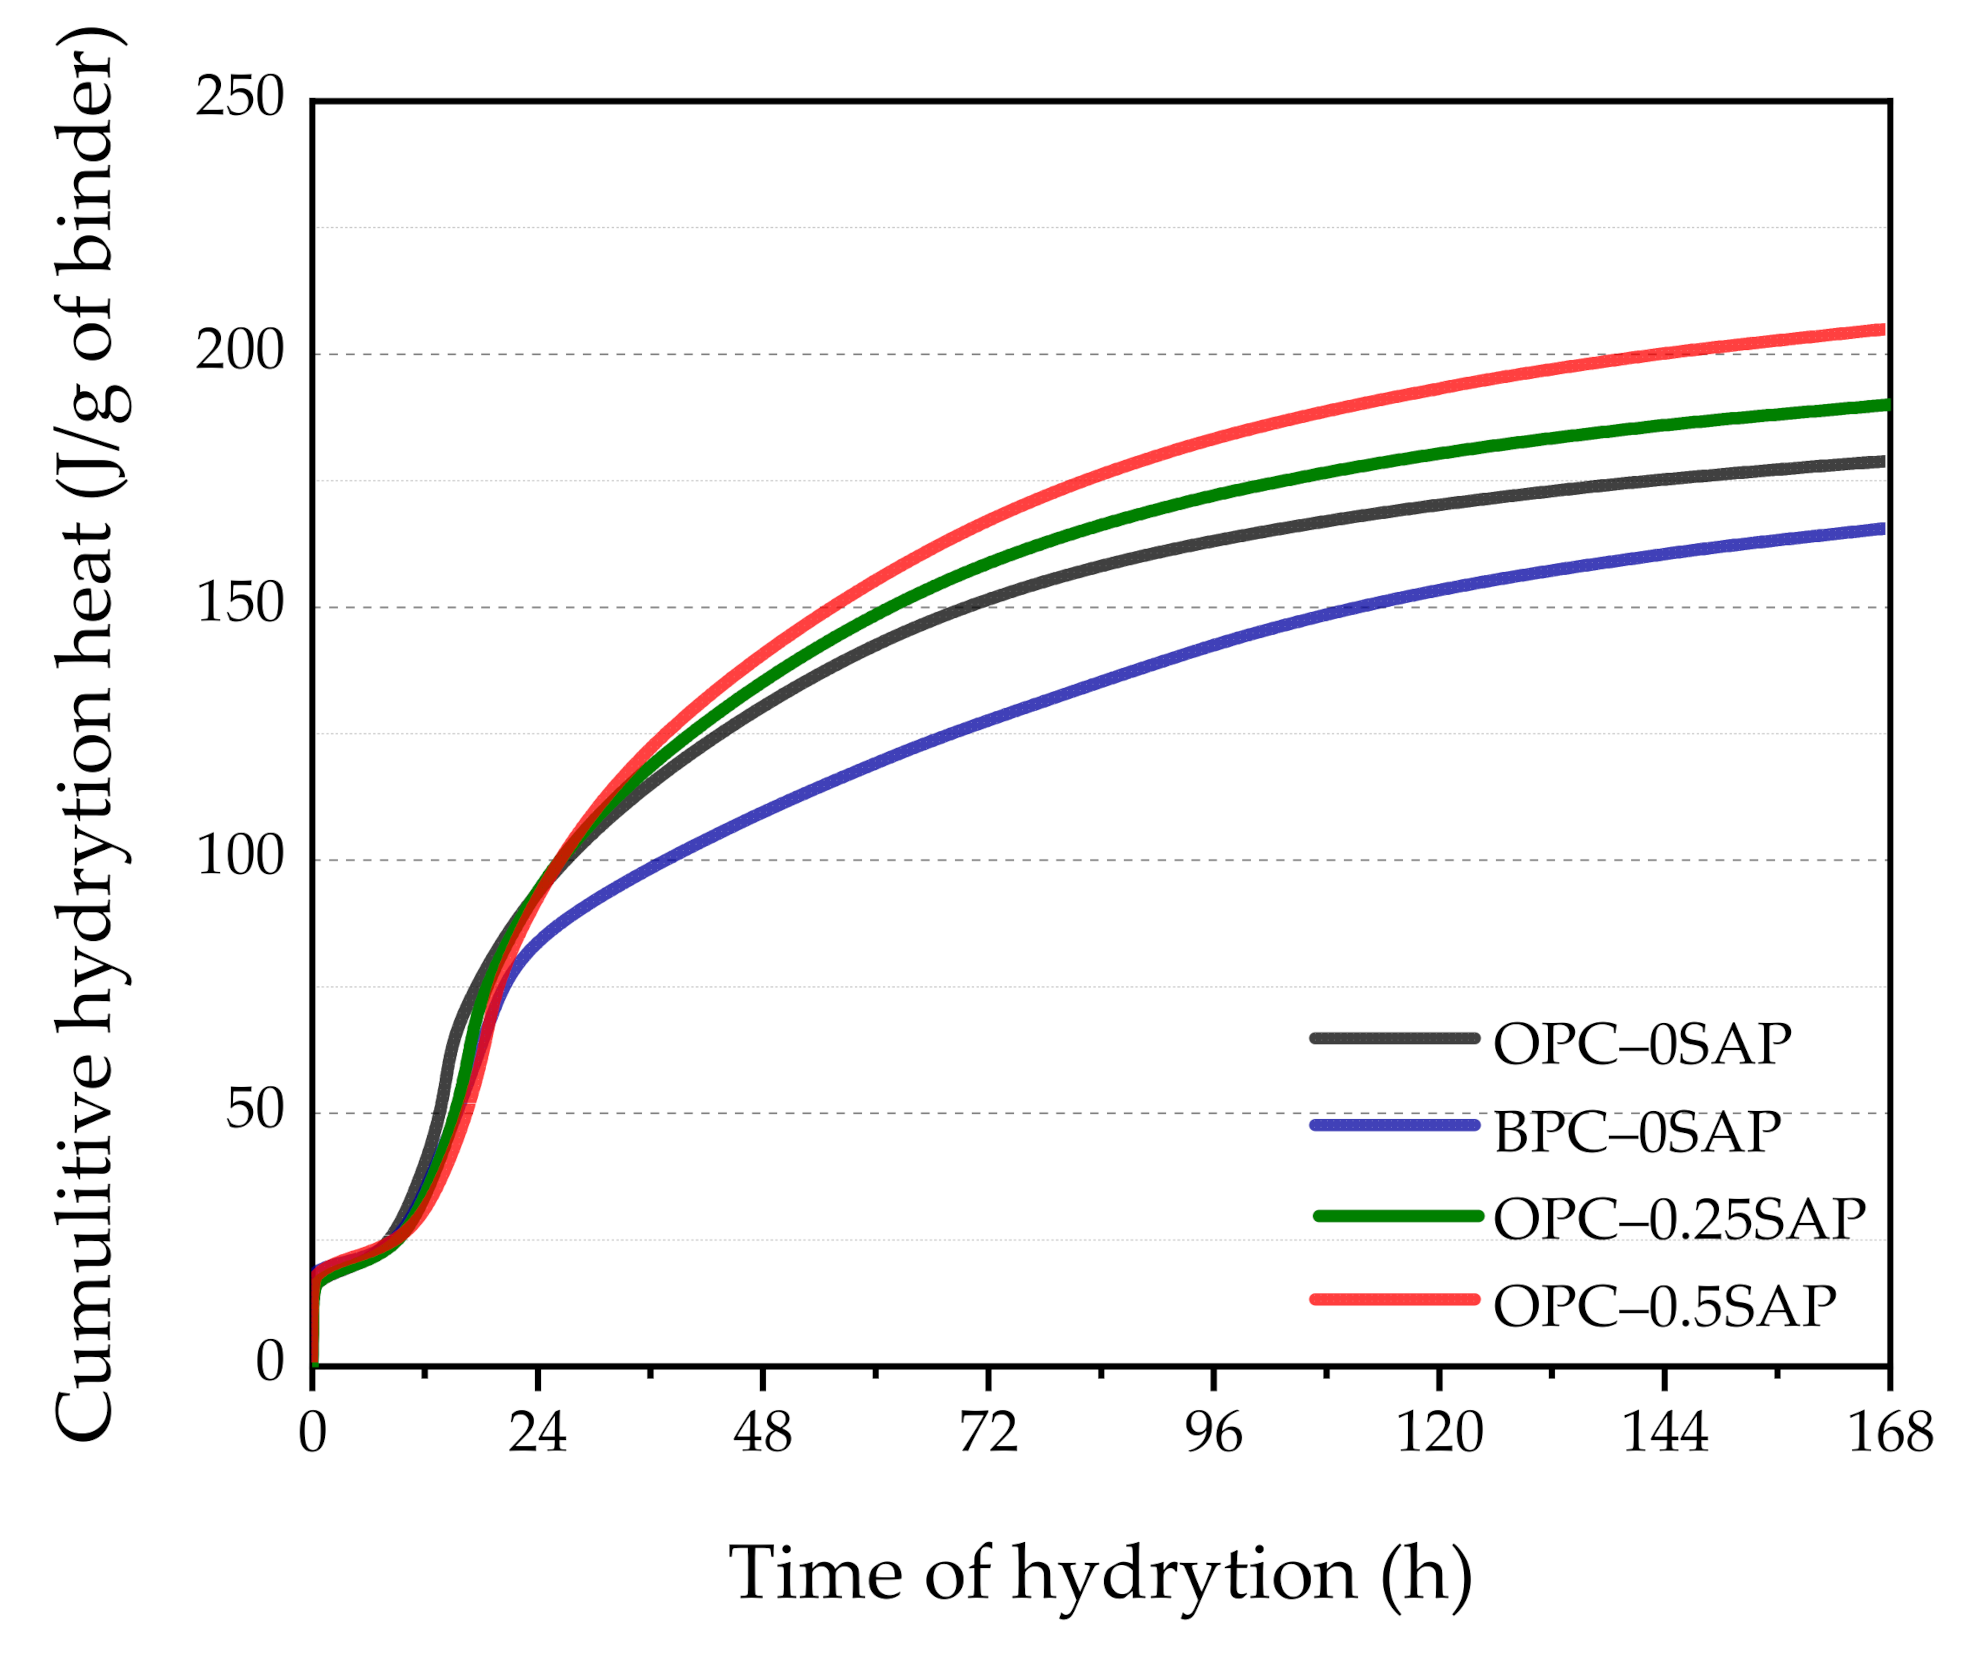
In terms of hydration heat, the additional water entrained by SAP increased the effective w/c and reduced the initial concentration of the pore solution, resulting in a delayed and blunter main peak of 2.5–4.5 h. The higher w/c increased the degree of hydration, and the cumulative hydration heat at 72 h was significantly higher than that of the control group. The mixture doped with BPC released 15.9% lower cumulative hydration heat at 72 h compared to the control group due to the slow rate of C2S development responses.
(iv)
TGA showed the following sequence of CH content: CHOPC-0.5SAP > CHOPC-0.25SAP > CHOPC–0SAP > CHBPC–0SAP. When the SAP content increased, the CH content also increased, indicating that the addition of SAP increased hydration. The samples with BPC had a lower CH content compared to the control group. The analysis results of CH from TGA showed agreement with those of the XRD. Moreover, TGA analysis showed that the trend of combined water was similar to CH. The combined water content was much lower than the theoretical maximum of combined water for the full hydration of 1 g cement. In addition, the ATR–FTIR results showed that the Si-O stretching vibration of C-S-H was enhanced when the SAP content increased.
(v)
In terms of UPV, the samples showed faster growth in 3 days because they were able to reach 86.3%–96.1%. For all specimens, there was an exponential correlation between compressive strength and UPV. UPV is a non-destructive test method for evaluating the strength development of SUHPP.
(vi)
In terms of electrical resistivity, the OPC–0.25SAP and OPC–0.5SAP samples showed lower electrical resistivity than the control group due to the increased porosity from SAP. The BPC–0SAP sample showed lower resistivity in the early stage. However, from 3 to 28 days, the electrical resistivity of BPC–0SAP showed a higher increment than other specimens.
In summary, as the content of SAP increases, the AS, strength, UPV, and electrical resistivity decrease, and the hydration heat, CH content, and combined water content increase. Moreover, compared with OPC specimens, BPC specimens show lower AS, electrical resistivity, hydration heat, CH, and combined water content and similar late-age strength and UPV. BPC was suitable for producing SUHPP.

Author Contributions

Conceptualization, M.-Y.X. and X.-Y.W.; methodology, M.-Y.X. and X.-Y.W.; validation, M.-Y.X., Y.-S.W., H.-S.L. and S.-J.K.; writing—original draft preparation, M.-Y.X.; writing—review and editing, M.-Y.X., X.-Y.W., Y.-S.W. and H.-S.L.; visualization, M.-Y.X. and S.-J.K.; supervision, X.-Y.W. All authors have read and agreed to the published version of the manuscript.

Funding

This research was supported by the Basic Science Research Program through the National Research Foundation of Korea (NRF), funded by the Ministry of Science, ICT and Future Planning (no. 2015R1A5A1037548), and an NRF grant (no. NRF-2020R1A2C4002093).

Institutional Review Board Statement

Not applicable.

Informed Consent Statement

Not applicable.

Data Availability Statement

The data presented in this study are available from the corresponding author upon a reasonable request.

Conflicts of Interest

The authors declare no conflict of interest.

References

  1. Liu, J.; Khayat, K.H.; Shi, C. Effect of superabsorbent polymer characteristics on rheology of ultra-high performance concrete. Cem. Concr. Compos. 2020, 112, 103636. [Google Scholar] [CrossRef]
  2. Heikal, M.; El Aleem, S.A.; Morsi, W. Characteristics of blended cements containing nano-silica. HBRC J. 2013, 9, 243–255. [Google Scholar] [CrossRef] [Green Version]
  3. Ghafari, E.; Ghahari, S.A.; Costa, H.; Júlio, E.; Portugal, A.; Durães, L. Effect of supplementary cementitious materials on autogenous shrinkage of ultra-high performance concrete. Constr. Build. Mater. 2016, 127, 43–48. [Google Scholar] [CrossRef]
  4. Yazıcı, H.; Yiğiter, H.; Karabulut, A.Ş.; Baradan, B. Utilization of fly ash and ground granulated blast furnace slag as an alternative silica source in reactive powder concrete. Fuel 2008, 87, 2401–2407. [Google Scholar] [CrossRef]
  5. Wang, C.; Yang, C.; Liu, F.; Wan, C.; Pu, X. Preparation of Ultra-High Performance Concrete with common technology and materials. Cem. Concr. Compos. 2012, 34, 538–544. [Google Scholar] [CrossRef]
  6. Justs, J.; Wyrzykowski, M.; Bajare, D.; Lura, P. Internal curing by superabsorbent polymers in ultra-high performance concrete. Cem. Concr. Res. 2015, 76, 82–90. [Google Scholar] [CrossRef]
  7. Kang, S.-H.; Hong, S.-G.; Moon, J. The effect of superabsorbent polymer on various scale of pore structure in ultra-high per-formance concrete. Constr. Build. Mater. 2018, 172, 29–40. [Google Scholar] [CrossRef]
  8. Hisseine, O.A.; Soliman, N.A.; Tolnai, B.; Tagnit-Hamou, A. Nano-engineered ultra-high performance concrete for controlled autogenous shrinkage using nanocellulose. Cem. Concr. Res. 2020, 137, 106217. [Google Scholar] [CrossRef]
  9. Li, L.; Dabarera, A.G.; Dao, V. Time-zero and deformational characteristics of high performance concrete with and without superabsorbent polymers at early ages. Constr. Build. Mater. 2020, 264, 120262. [Google Scholar] [CrossRef]
  10. Tu, W.; Zhu, Y.; Fang, G.; Wang, X.; Zhang, M. Internal curing of alkali-activated fly ash-slag pastes using superabsorbent polymer. Cem. Concr. Res. 2019, 116, 179–190. [Google Scholar] [CrossRef] [Green Version]
  11. Bentur, A.; Igarashi, S.-I.; Kovler, K. Prevention of autogenous shrinkage in high-strength concrete by internal curing using wet lightweight aggregates. Cem. Concr. Res. 2001, 31, 1587–1591. [Google Scholar] [CrossRef]
  12. De Meyst, L.; Kheir, J.; Filho, J.R.T.; Van Tittelboom, K.; De Belie, N. The Use of superabsorbent polymers in high performance concrete to mitigate autogenous shrinkage in a large-scale demonstrator. Sustain. J. Rec. 2020, 12, 4741. [Google Scholar] [CrossRef]
  13. Jensen, O.M.; Hansen, P.F. Water-entrained cement-based materials: I. Principles and theoretical background. Cem. Concr. Res. 2001, 31, 647–654. [Google Scholar] [CrossRef]
  14. Piérard, J.; Pollet, V.; Cauberg, N. In Mitigating autogenous shrinkage in HPC by internal curing using superabsorbent polymers. In Proceedings of the International RILEM Conference on Volume Changes of Hardening Concrete: Testing and Mitigation, Lyngby, Denmark, 20–23 August 2006; pp. 97–106. [Google Scholar]
  15. Kang, S.-H.; Hong, S.-G.; Moon, J. Shrinkage characteristics of heat-treated ultra-high performance concrete and its mitigation using superabsorbent polymer based internal curing method. Cem. Concr. Compos. 2018, 89, 130–138. [Google Scholar] [CrossRef]
  16. Liu, J.; Farzadnia, N.; Shi, C.; Ma, X. Shrinkage and strength development of UHSC incorporating a hybrid system of SAP and SRA. Cem. Concr. Compos. 2019, 97, 175–189. [Google Scholar] [CrossRef]
  17. Craeye, B.; Geirnaert, M.; De Schutter, G. Super absorbing polymers as an internal curing agent for mitigation of early-age cracking of high-performance concrete bridge decks. Constr. Build. Mater. 2011, 25, 1–13. [Google Scholar] [CrossRef]
  18. Zohourian, M.M.; Kabiri, K. Superabsorbent polymer materials: A review. Iran. Polym. J. 2008, 17, 451-477. [Google Scholar]
  19. Stefan, L.; Boulay, C.; Torrenti, J.-M.; Bissonnette, B.; Benboudjema, F. Influential factors in volume change measurements for cementitious materials at early ages and in isothermal conditions. Cem. Concr. Compos. 2018, 85, 105–121. [Google Scholar] [CrossRef]
  20. Liu, J.; Shi, C.; Ma, X.; Khayat, K.H.; Zhang, J.; Wang, D. An overview on the effect of internal curing on shrinkage of high performance cement-based materials. Constr. Build. Mater. 2017, 146, 702–712. [Google Scholar] [CrossRef] [Green Version]
  21. Snoeck, D.; Jensen, O.; De Belie, N. The influence of superabsorbent polymers on the autogenous shrinkage properties of cement pastes with supplementary cementitious materials. Cem. Concr. Res. 2015, 74, 59–67. [Google Scholar] [CrossRef]
  22. Mönnig, S. Superabsorbing Additions in Concrete: Applications, Modelling and Comparison of Different Internal Water Sources. Master’s Thesis, Universität Stuttgart, Stuttgart, Germany, 2009. [Google Scholar]
  23. Song, C.; Choi, Y.C.; Choi, S. Effect of internal curing by superabsorbent polymers—Internal relative humidity and autogenous shrinkage of alkali-activated slag mortars. Constr. Build. Mater. 2016, 123, 198–206. [Google Scholar] [CrossRef]
  24. Beushausen, H.; Gillmer, M.; Alexander, M. The influence of superabsorbent polymers on strength and durability properties of blended cement mortars. Cem. Concr. Compos. 2014, 52, 73–80. [Google Scholar] [CrossRef]
  25. Naqi, A.; Jang, J.G. Recent Progress in green cement technology utilizing low-carbon emission fuels and raw materials: A review. Sustainability 2019, 11, 537. [Google Scholar] [CrossRef] [Green Version]
  26. Yang, L.; Shi, C.; Wu, Z. Mitigation techniques for autogenous shrinkage of ultra-high-performance concrete—A review. Compos. Part B Eng. 2019, 178, 107456. [Google Scholar] [CrossRef]
  27. Kang, S.-H.; Hong, S.-G.; Moon, J. Absorption kinetics of superabsorbent polymers (SAP) in various cement-based solutions. Cem. Concr. Res. 2017, 97, 73–83. [Google Scholar] [CrossRef]
  28. ASTM International. Standard Test Method for Compressive Strength of Hydraulic Cement Mortars (Using Portions of Prisms Broken in Flexure); ASTM International: West Conshohocken, PA, USA, 2014. [Google Scholar]
  29. ASTM International. Standard Test Method for Autogenous Strain of Cement Paste and Mortar; ASTM International: West Conshohocken, PA, USA, 2014. [Google Scholar]
  30. Lin, R.-S.; Park, K.-B.; Wang, X.-Y.; Zhang, G.-Y. Increasing the early strength of high-volume Hwangtoh–Cement systems using bassanite. J. Build. Eng. 2020, 30, 101317. [Google Scholar] [CrossRef]
  31. Kacimi, L.; Simon-Masseron, A.; Salem, S.; Ghomari, A.; Derriche, Z. Synthesis of belite cement clinker of high hydraulic re-activity. Cem. Concr. Res. 2009, 39, 559–565. [Google Scholar] [CrossRef]
  32. Koumpouri, D.; Angelopoulos, G. Effect of boron waste and boric acid addition on the production of low energy belite cement. Cem. Concr. Compos. 2016, 68, 1–8. [Google Scholar] [CrossRef]
  33. Wang, L.; Jin, M.; Wu, Y.; Zhou, Y.; Tang, S. Hydration, shrinkage, pore structure and fractal dimension of silica fume modified low heat Portland cement-based materials. Constr. Build. Mater. 2021, 272, 121952. [Google Scholar] [CrossRef]
  34. Zhang, G.-Z.; Cho, H.-K.; Wang, X.-Y. Effect of nano-silica on the autogenous shrinkage, strength, and hydration heat of ultra-high strength concrete. Appl. Sci. 2020, 10, 5202. [Google Scholar] [CrossRef]
  35. Darquennes, A.; Staquet, S.; Delplancke-Ogletree, M.-P.; Espion, B. Effect of autogenous deformation on the cracking risk of slag cement concretes. Cem. Concr. Compos. 2011, 33, 368–379. [Google Scholar] [CrossRef]
  36. Duran-Herrera, A.; De-León-Esquivel, J.; Bentz, D.; Valdez-Tamez, P. Self-compacting concretes using fly ash and fine limestone powder: Shrinkage and surface electrical resistivity of equivalent mortars. Constr. Build. Mater. 2019, 199, 50–62. [Google Scholar] [CrossRef]
  37. Xuan, M.-Y.; Han, Y.; Wang, X.-Y. The Hydration, mechanical, autogenous shrinkage, durability, and sustainability properties of cement–limestone–slag ternary composites. Sustain. J. Rec. 2021, 13, 1881. [Google Scholar] [CrossRef]
  38. Jang, J.; Lee, H. Microstructural densification and CO2 uptake promoted by the carbonation curing of belite-rich Portland cement. Cem. Concr. Res. 2016, 82, 50–57. [Google Scholar] [CrossRef]
  39. Langan, B.W.; Weng, K.; Ward, M.A. Effect of silica fume and fly ash on heat of hydration of Portland cement. Cem. Concr. Res. 2002, 32, 1045–1051. [Google Scholar] [CrossRef]
  40. Justs, J.; Wyrzykowski, M.; Winnefeld, F.; Bajare, D.; Lura, P. Influence of superabsorbent polymers on hydration of cement pastes with low water-to-binder ratio. J. Therm. Anal. Calorim. 2014, 115, 425–432. [Google Scholar] [CrossRef]
  41. Yang, J.; Wang, F.; Liu, Z.; Liu, Y.; Hu, S. Early-state water migration characteristics of superabsorbent polymers in cement pastes. Cem. Concr. Res. 2019, 118, 25–37. [Google Scholar] [CrossRef]
  42. Scrivener, K.L.; Juilland, P.; Monteiro, P.J. Advances in understanding hydration of Portland cement. Cem. Concr. Res. 2015, 78, 38–56. [Google Scholar] [CrossRef]
  43. Dai, J.; Wang, Q.; Lou, X.; Bao, X.; Zhang, B.; Wang, J.; Zhang, X. Solution calorimetry to assess effects of water-cement ratio and low temperature on hydration heat of cement. Constr. Build. Mater. 2021, 269, 121222. [Google Scholar] [CrossRef]
  44. Lin, R.-S.; Lee, H.-S.; Han, Y.; Wang, X.-Y. Experimental studies on hydration–strength–durability of limestone-cement-calcined Hwangtoh clay ternary composite. Constr. Build. Mater. 2021, 269, 121290. [Google Scholar] [CrossRef]
  45. De Weerdt, K.; Ben Haha, M.; Le Saout, G.; Kjellsen, K.; Justnes, H.; Lothenbach, B. Hydration mechanisms of ternary Portland cements containing limestone powder and fly ash. Cem. Concr. Res. 2011, 41, 279–291. [Google Scholar] [CrossRef]
  46. Ylmén, R.; Jäglid, U.; Steenari, B.-M.; Panas, I. Early hydration and setting of Portland cement monitored by IR, SEM and Vicat techniques. Cem. Concr. Res. 2009, 39, 433–439. [Google Scholar] [CrossRef]
  47. Trezza, M.; Lavat, A. Analysis of the system 3CaO Al2O3–CaSO4· 2H2O–CaCO3–H2O by FT-IR spectroscopy. Cem. Concr. Res. 2001, 31, 869–872. [Google Scholar] [CrossRef]
  48. Hughes, T.L.; Methven, C.M.; Jones, T.G.; Pelham, S.E.; Fletcher, P.; Hall, C. Determining cement composition by Fourier transform infrared spectroscopy. Adv. Cem. Based Mater. 1995, 2, 91–104. [Google Scholar] [CrossRef]
  49. Lin, R.-S.; Wang, X.-Y.; Lee, H.-S.; Cho, H.-K. Hydration and microstructure of cement pastes with calcined hwangtoh clay. Materials 2019, 12, 458. [Google Scholar] [CrossRef] [Green Version]
  50. Mollah, M.; Yu, W.; Schennach, R.; Cocke, D.L. A Fourier transform infrared spectroscopic investigation of the early hydration of Portland cement and the influence of sodium lignosulfonate. Cem. Concr. Res. 2000, 30, 267–273. [Google Scholar] [CrossRef]
  51. Wehbe, Y.; Ghahremaninezhad, A. Combined effect of shrinkage reducing admixtures (SRA) and superabsorbent polymers (SAP) on the autogenous shrinkage, hydration and properties of cementitious materials. Constr. Build. Mater. 2017, 138, 151–162. [Google Scholar] [CrossRef]
  52. Lin, R.-S.; Han, Y.; Wang, X.-Y. Macro–meso–micro experimental studies of calcined clay limestone cement (LC3) paste sub-jected to elevated temperature. Cem. Concr. Compos. 2021, 116, 103871. [Google Scholar] [CrossRef]
  53. Shariq, M.; Prasad, J.; Masood, A. Studies in ultrasonic pulse velocity of concrete containing GGBFS. Constr. Build. Mater. 2013, 40, 944–950. [Google Scholar] [CrossRef]
  54. Van Breugel, K.; Fraaij, A. Experimental Study on Ultrasonic Pulse Velocity Evaluation of the Microstructure of Cementitious Material at Early Age; Delft University of Technology: Delft, The Netherlands, 2001. [Google Scholar]
  55. Ye, G.; Lura, P.; Van Breugel, K.; Fraaij, A. Study on the development of the microstructure in cement-based materials by means of numerical simulation and ultrasonic pulse velocity measurement. Cem. Concr. Compos. 2004, 26, 491–497. [Google Scholar] [CrossRef]
  56. Huang, H.; Gao, X.; Wang, H.; Ye, H. Influence of rice husk ash on strength and permeability of ultra-high performance concrete. Constr. Build. Mater. 2017, 149, 621–628. [Google Scholar] [CrossRef]
  57. Wang, L.; Dong, Y.; Zhou, S.; Chen, E.; Tang, S. Energy saving benefit, mechanical performance, volume stabilities, hydration properties and products of low heat cement-based materials. Energy Build. 2018, 170, 157–169. [Google Scholar] [CrossRef]
  58. Chen, T.; Gao, X.; Qin, L. Mathematical modeling of accelerated carbonation curing of Portland cement paste at early age. Cem. Concr. Res. 2019, 120, 187–197. [Google Scholar] [CrossRef]
  59. Neithalath, N.; Weiss, J.; Olek, J. Characterizing Enhanced Porosity Concrete using electrical impedance to predict acoustic and hydraulic performance. Cem. Concr. Res. 2006, 36, 2074–2085. [Google Scholar] [CrossRef]
  60. Wang, L.; Yang, H.; Zhou, S.; Chen, E.; Tang, S. Mechanical properties, long-term hydration heat, shinkage behavior and crack resistance of dam concrete designed with low heat Portland (LHP) cement and fly ash. Constr. Build. Mater. 2018, 187, 1073–1091. [Google Scholar] [CrossRef]
  61. Wang, L.; Yang, H.; Dong, Y.; Chen, E.; Tang, S. Environmental evaluation, hydration, pore structure, volume deformation and abrasion resistance of low heat Portland (LHP) cement-based materials. J. Clean. Prod. 2018, 203, 540–558. [Google Scholar] [CrossRef]
Figure 1. Particle size distribution of each component.
Materials 14 01497 g001
Figure 2. Scanning electron microscope (SEM) images of dried superabsorbent polymer (SAP) particles (magnification scale is 100).
Materials 14 01497 g002
Figure 3. Mixing procedure for composite mixture paste.
Materials 14 01497 g003
Figure 4. The effect of the amount of SAP added at different ages (3, 7, and 28 days) and the type of cement on the compressive strength. (a) Development of compressive strength at different ages; (b) relative compressive strength of specimen.
Materials 14 01497 g004aMaterials 14 01497 g004b
Figure 5. Autogenous shrinkage (AS) of sustainable ultra-high-performance paste (SUHPP) hydrated for 7 days.
Materials 14 01497 g005
Figure 6. Variation in internal relative humidity with the age of curing.
Materials 14 01497 g006
Figure 7. Variation in internal temperature with the age of curing.
Materials 14 01497 g007
Figure 8. Correlation between AS and the internal relative humidity of specimen.
Materials 14 01497 g008aMaterials 14 01497 g008b
Figure 9. Exothermic rate of hydration of the mixed paste at 20 °C.
Materials 14 01497 g009
Figure 10. Cumulative heat change of the mixed paste during 72 h of mixing.
Materials 14 01497 g010
Figure 11. X-ray diffraction (XRD) spectra of the mixed cement paste at 28 days. Ettr.: ettringite; Hc: hemicarboaluminate; CH: calcium hydroxide; CC: calcite.
Materials 14 01497 g011
Figure 12. Thermogravimetric analysis (TGA) curves of all samples.
Materials 14 01497 g012
Figure 13. Derivative thermogravimetric analysis (DTG) curves of all samples.
Materials 14 01497 g013
Figure 14. ATR–FTIR spectra of all samples for 28 days.
Materials 14 01497 g014
Figure 15. Variation in ultrasonic pulse velocity (UPV) of the mixture with the curing age.
Materials 14 01497 g015
Figure 16. Correlation between UPV and compressive strength corresponding to 3, 7, and 28 days of hydration.
Materials 14 01497 g016
Figure 17. Changes in electrical resistivity of samples at different curing ages.
Materials 14 01497 g017
Table 1. The chemical composition of the materials.
OxidesOrdinary
Portland Cement
(%)
Belite-Rich
Portland Cement
(%)
Silica Fume
(%)
Limestone
Filler
(%)
Blast-Furnace
Slag
(%)
CaO64.763.270.5759.1938.29
SiO221.126.6594.5236.12
Al2O35.072.360.730.2114.82
Fe2O33.142.850.220.47
MgO0.890.960.490.456.49
Na2O0.190.06
TiO20.220.62
SO31.612.120.261.61
Loss onignition2.320.891.5939.211.16
Table 2. Mineralogical composition of the clinker.
Mineralogical CompositionOPC (%)BPC (%)
3CaO·SiO2 (C3S)59.8929.06
2CaO·SiO2 (C2S)15.3154.48
3CaO·Al2O3 (C3A)8.121.43
4CaO·AlO3·Fe2O3 (C4AF)9.568.67
Table 3. Mixture design of sustainable ultra-high-performance paste (SUHPP).
NumberBinders (%)SAP
(%)
Water
(%)
Additional
Water
(%)
SP
(%)
Cement
(OPC/BPC)
Silica FumeLimestoneSlag
OPC–0SAP5010202002001.2
BPC–0SAP5010202002001.2
OPC–0.25SAP501020200.25202.51.2
OPC–0.5SAP501020200.52051.2
Table 4. Experimental methods and test ranges.
NO.Experimental MethodTotal Number of Test SamplesStandard DeviationSample SizeTest Time
1Compressive strength36Within ±0.05% of the indicated load50 × 50 × 50 mm3, 7, and 28 days
2Autogenous shrinkage coupled with relative humidity and temperature40.001 μm/m; ±0.5% RH; ±0.1 °CØ29 × 430 mm1–7 days
3Isothermal calorimetry4±20 μW5 g paste72 h
4X-ray diffraction4λ = 1.5406 Å
2θ = 0.013°
Powder28 days
5Thermogravimetric analysis40.1 μgPowder28 days
6Attenuated total reflectance–Fourier-transform infrared spectroscopy4±0.01 cm−1Powder28 days
7Ultrasonic pulse velocity360.5 μs50 × 50 × 50 mm1, 3, 7, and 28 days
8Electrical resistivity12±0.2 to ±2 kΩ cmØ100 × 200 mm1, 3, 7, and 28 days
Table 5. The mass of calcium hydroxide (CH) and combined water (W).
SamplesCH (g/g)Combined Water (g/g)
OPC–0SAP3.44%7.90%
BPC–0SAP2.99%7.62%
OPC–0.25SAP3.95%8.38%
OPC–0.5SAP4.32%8.94%
Publisher’s Note: MDPI stays neutral with regard to jurisdictional claims in published maps and institutional affiliations.

