
Kinetics of Dehydroxylation and Decarburization of Coal Series Kaolinite during Calcination: A Novel Kinetic Method Based on Gaseous Products


Abstract
:1. Introduction
2. Experiment and Methods
2.1. Raw Materials
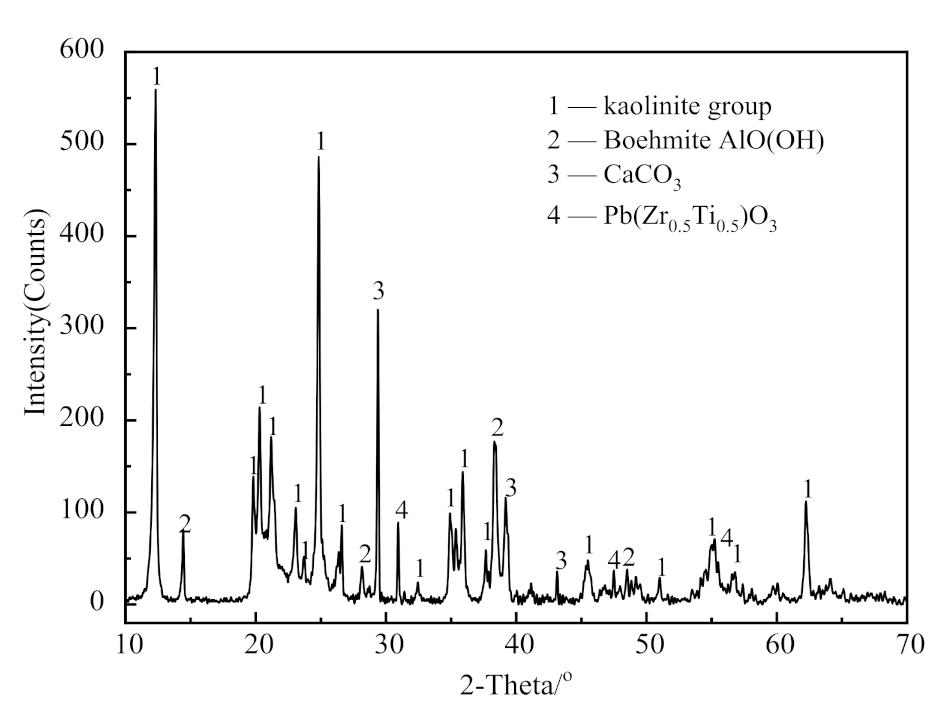
2.1.1. XRD Analysis
2.1.2. XRF Analysis
2.1.3. Flammability Analysis
2.2. TG-FTIR-MS Analysis
2.3. Theory and Mathematical Methods
3. Results and Discussion
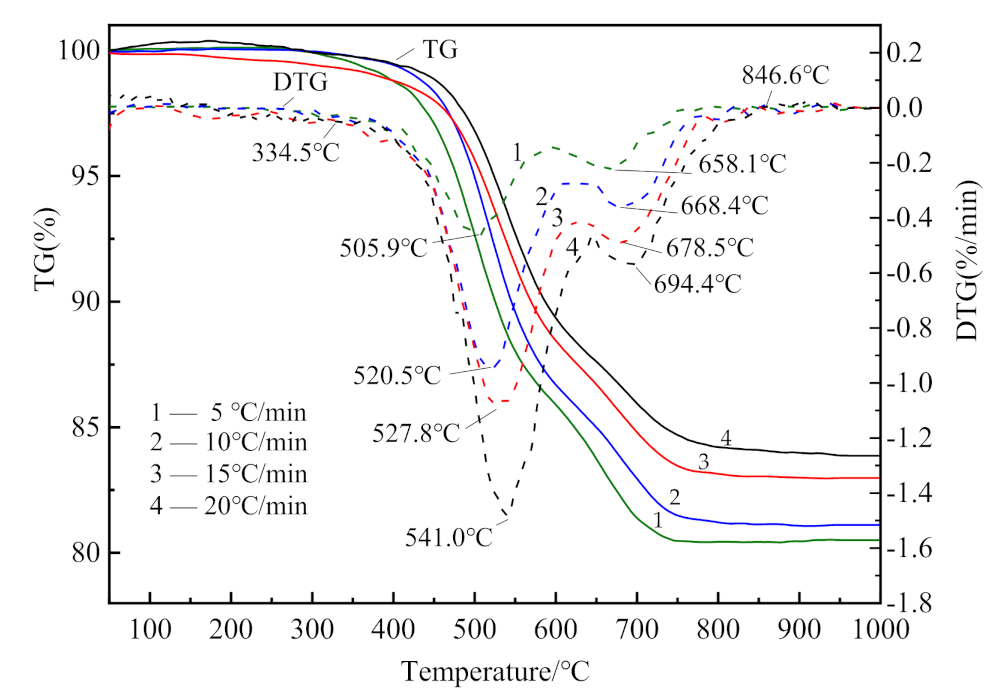
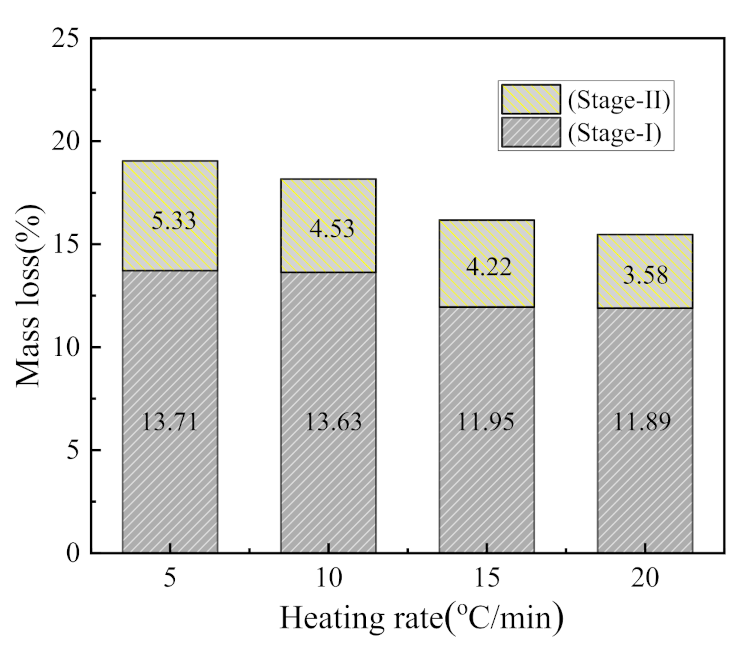
3.1. Thermal Analysis
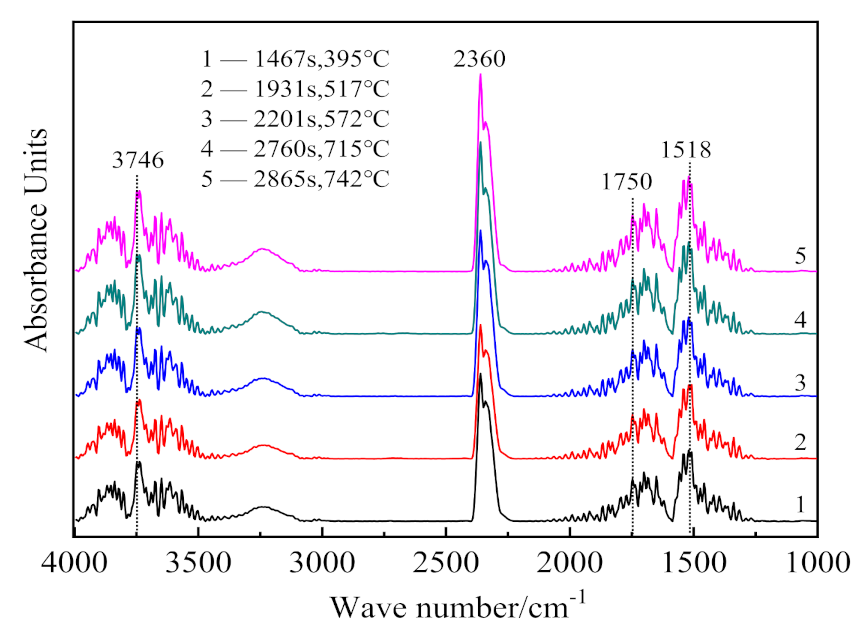
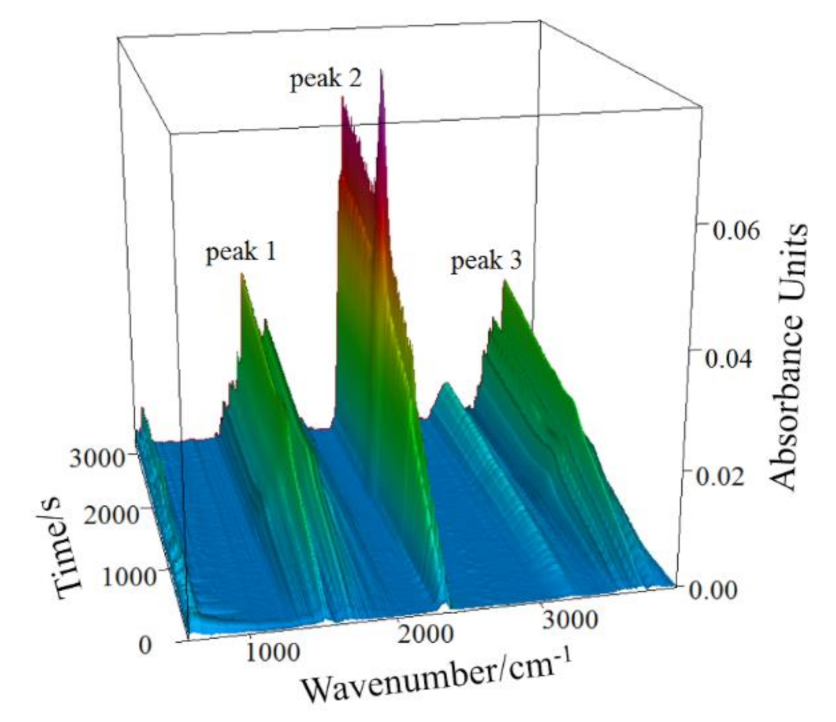
3.2. Infrared Analysis
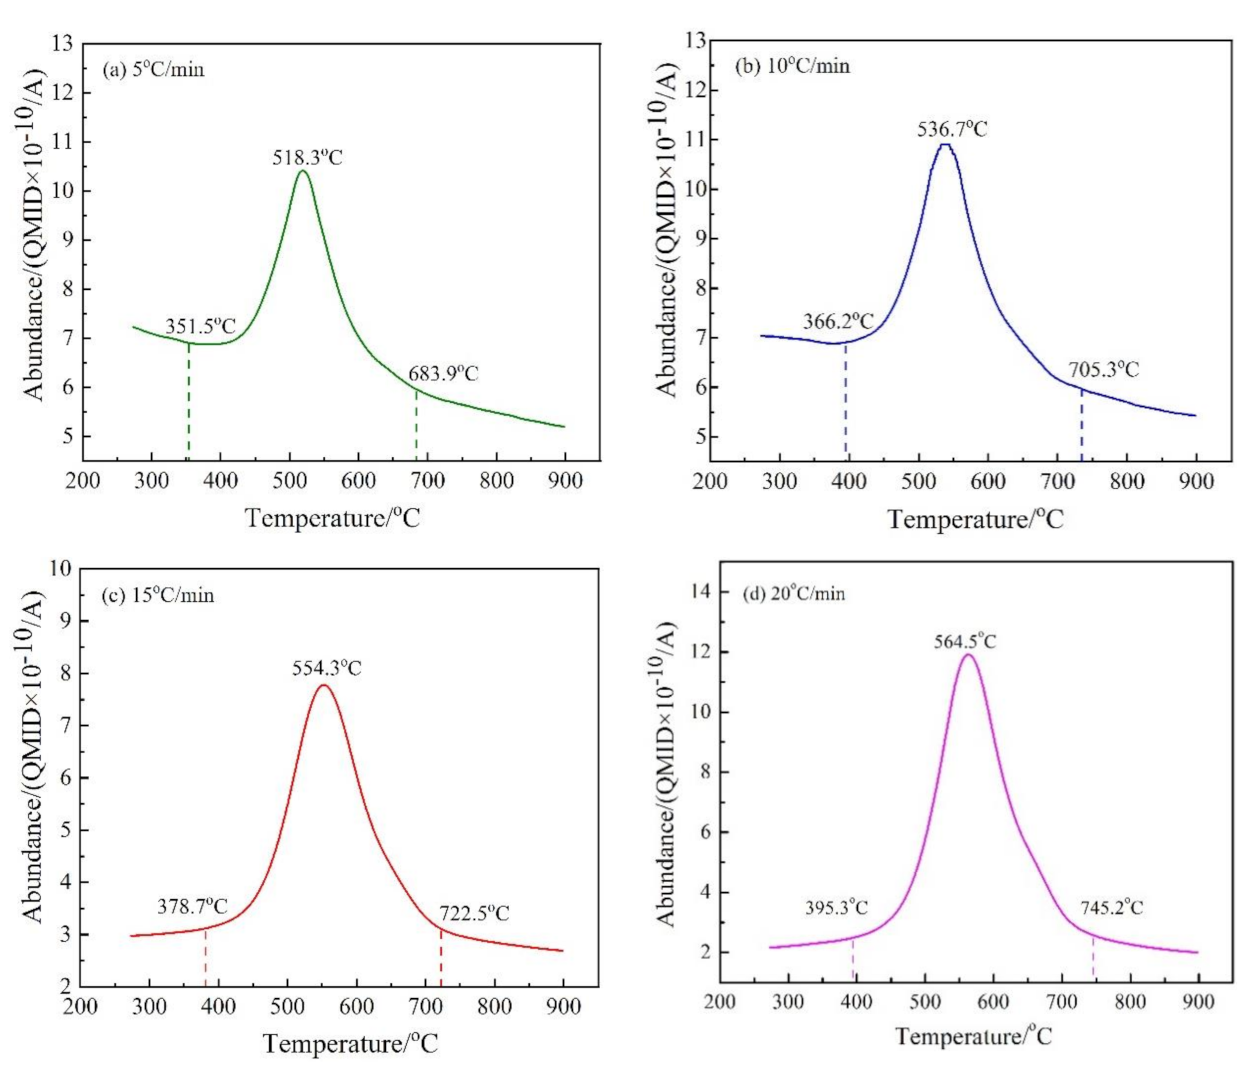
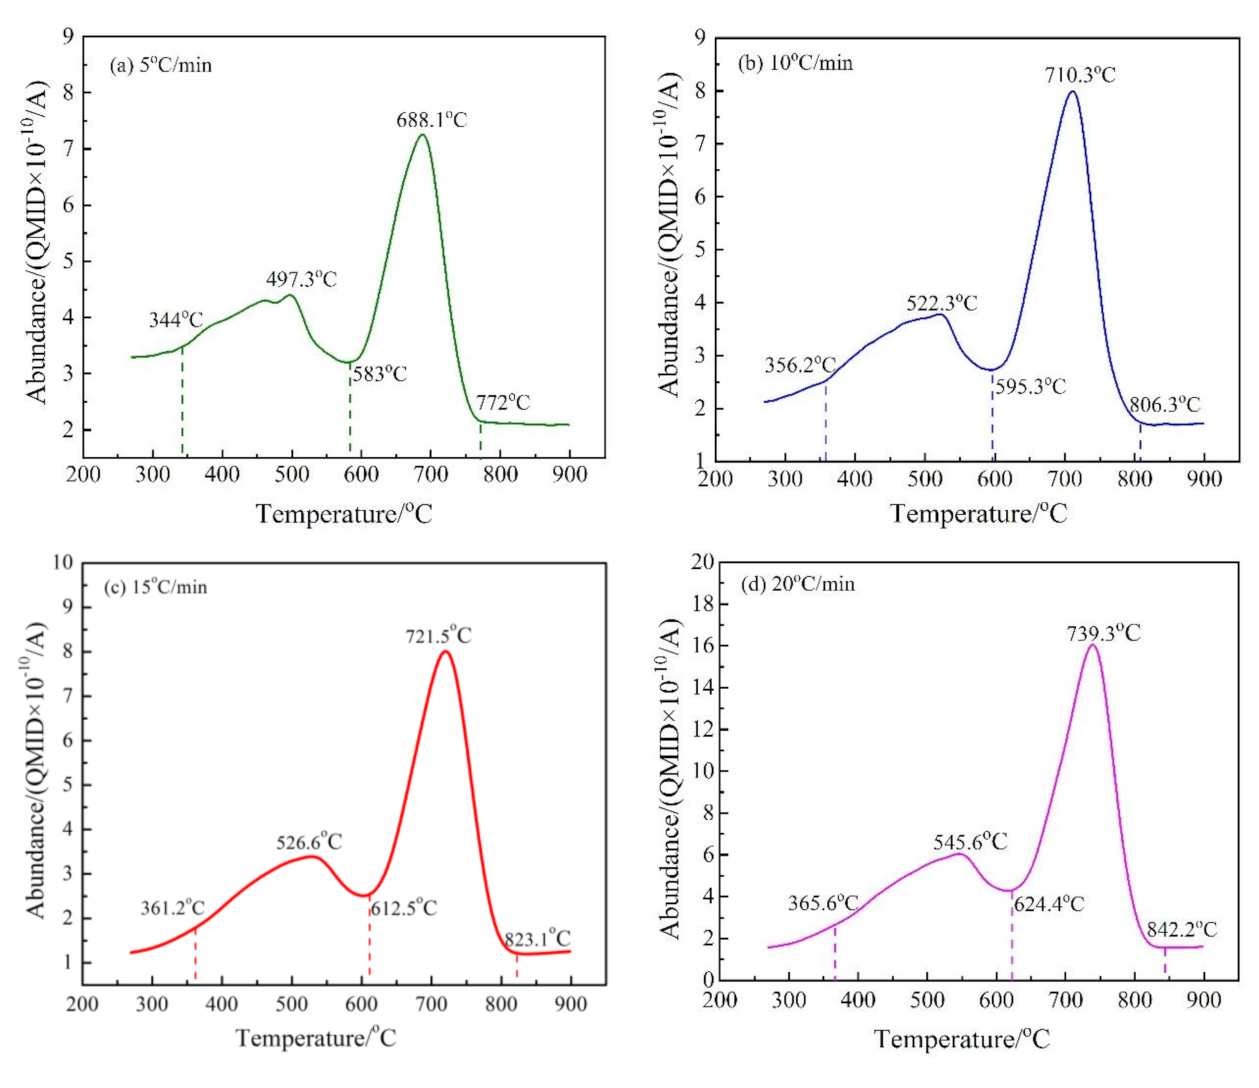
3.3. Mass Spectrometry Analysis
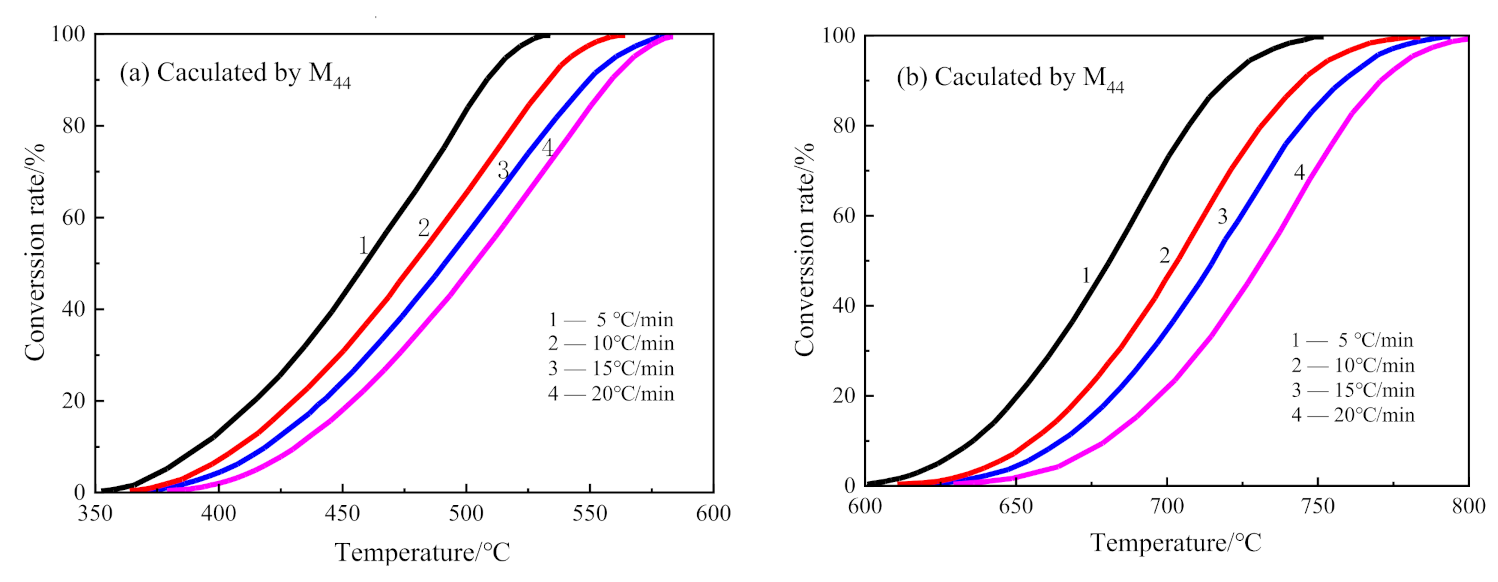
3.4. Kinetics Analysis
3.5. Comparative Analysis of New Methods and Traditional Methods
4. Conclusions
- (1)
- The dehydroxylation reaction in CSK calcination conforms to the A2/3 mechanism model, the temperature range is 350–850 °C, and the activation energy is 182.71 kJ·mol−1. The decarburization in CSK calcination is a two-step reaction; the temperature range in the first step is 350–550 °C, and in the second is 580–830 °C. The first step decarburization reaction conforms to the A2/3 mechanism function, and the activation energy is 160.94 kJ·mol−1. The second step decarburization reaction follows the B3 mechanism function, wherein the activation energy is 215.47 kJ·mol−1.
- (2)
- The TG-FTIR-MS method is suitable for analyzing the characteristics and kinetics of dehydroxylation and decarburization in CSK calcination. It is also a theoretical tool for the kinetic analysis of other types of complex reactions.
Author Contributions
Funding
Institutional Review Board Statement
Informed Consent Statement
Data Availability Statement
Conflicts of Interest
References
- Qin, Z. New advances in coal structure model. Int. J. Min. Sci. Technol. 2018, 28, 541–559. [Google Scholar] [CrossRef]
- He, J.F.; Yao, Y.K.; Lu, W.; Long, G.H.; Bai, Q.; Wang, H.F. Cleaning and upgrading of coal-series kaolin fines via decarburization using triboelectric separation. J. Clean. Pro. 2019, 228, 956–964. [Google Scholar] [CrossRef]
- Bu, X.N.; Evans, G.; Xie, G.Y.; Peng, Y.L.; Zhang, Z.G.; Ni, C.; Ge, L.H. Removal of fine quartz from coal-series kaolin by flotation. Appl. Clay Sci. 2017, 143, 437–444. [Google Scholar] [CrossRef]
- Liu, Y.Y.; Lei, S.M.; Huang, T.; Ji, M.J.; Li, Y.; Fan, Y.M. Research on mineralogy and flotation for coal-series kaolin. Appl. Clay Sci. 2017, 136, 37–42. [Google Scholar] [CrossRef]
- Yuan, S.; Li, Y.J.; Han, Y.X.; Gao, P. Effects of carbonaceous matter additives on kinetics, phase and structure evolution of coal-series kaolin during calcination. Appl. Clay Sci. 2018, 165, 124–134. [Google Scholar] [CrossRef]
- Xu, X.H.; Lao, X.B.; Wu, J.F.; Zhang, Y.X.; Xu, X.Y.; Li, K. Microstructural evolution, phase transformation, and variations in physical properties of coal series kaolin powder compact during firing. Appl. Clay Sci. 2015, 115, 76–86. [Google Scholar] [CrossRef]
- Sun, T.; Ge, K.Y.; Wang, G.M.; Geng, H.N.; Shui, Z.H.; Cheng, S.K.; Chen, M. Comparing pozzolanic activity from thermal-activated water-washed and coal-series kaolin in Portland cement mortar. Constr. Build. Mater. 2019, 227, 117092. [Google Scholar] [CrossRef]
- Cao, Z.; Cao, Y.D.; Dong, H.J.; Zhang, J.S.; Sun, C.B. Effect of calcination condition on the microstructure and pozzolanic activity of calcined coal gangue. Int. J. Miner. Process. 2016, 146, 23–28. [Google Scholar] [CrossRef]
- Li, L.X.; Zhang, Y.M.; Zhang, Y.F.; Sun, J.M.; Hao, Z.F. The thermal activation process of coal gangue selected from Zhungeer in China. J. Therm. Anal. Calorim. 2016, 126, 1559–1566. [Google Scholar] [CrossRef]
- Ptáček, P.; Frajkorova, F.; Šoukal, F.; Opravil, T. Kinetics and mechanism of three stages of thermal transformation of kaolinite to metakaolinite. Powder Technol. 2014, 264, 439–445. [Google Scholar] [CrossRef]
- Kuang, J.Z.; Yuan, W.Q.; Li, L.; Hu, J.; Xu, L.Y. Effects of Er(NO3)3, Nd(NO3)3 and Y(NO3)3 on kinetics of dehydroxylation of kaolinite. Powder Technol. 2016, 301, 581–589. [Google Scholar] [CrossRef]
- Gasparini, E.; Tarantino, S.C.; Ghigna, P.; Riccardi, M.P.; Cedillo-González, E.I.; Siligardi, C.; Zema, M. Thermal dehydroxylation of kaolinite under isothermal conditions. Appl. Clay Sci. 2013, 80–81, 417–425. [Google Scholar] [CrossRef]
- Horváth, I. Kinetics and compensation effect in kaolinite dihydroxylation. Ther. Acta 1985, 85, 193–198. [Google Scholar] [CrossRef]
- Levy, J.H.; Hurst, H.J. Kinetics of dehydroxylation, in nitrogen and water vapour, of kaolinite and smectite from Australian Tertiary oil shales. Fuel 1993, 72, 873–877. [Google Scholar] [CrossRef]
- Mustafa, V.; Betul, Y. Gasification kinetics of Thrace region coal by thermogravimetry analysis. J. Pet. Sci. Eng. 2020, 188, 106869. [Google Scholar] [CrossRef]
- Bei, L.; Gang, L.; Wei, G.; Hai, Y.C.; Ming, S.B.; Li, M.; Jun, D.; Chi, M.S. Study of combustion behaviour and kinetics modelling of Chinese Gongwusu coal gangue: Model-fitting and model-free approaches. Fuel 2020, 268, 117284. [Google Scholar] [CrossRef]
- Zhang, Y.Y.; Guo, Y.X.; Cheng, F.Q.; Yan, K.Z.; Cao, Y. Investigation of combustion characteristics and kinetics of coal gangue with different feedstock properties by thermogravimetric analysis. Ther. Acta 2015, 614, 137–148. [Google Scholar] [CrossRef]
- Mehmooda, M.A.; Ahmad, M.S.; Liu, Q.; Liu, C.G.; Tahir, M.H.; Aloqbi, A.A.; Tarbiah, N.I.; Alsufiani, H.M.; Gull, M. Helianthus tuberosus as a promising feedstock for bioenergy and chemicals appraised through pyrolysis, kinetics, and TG-FTIR-MS based study. Energy Convers. Manag. 2019, 194, 37–45. [Google Scholar] [CrossRef]
- Liang, B.; Wang, J.B.; Hu, J.H.; Li, C.F.; Li, R.K.; Liu, Y.; Zeng, K.; Yang, G. TG-MS-FTIR study on pyrolysis behavior of phthalonitrile resin. Polym. Degrad. Stab. 2019, 169, 108954. [Google Scholar] [CrossRef]
- Zangaro, G.; Carvalho, A.; Ekawa, B.; Nascimento, A.; Nunes, W.; Fernandes, R.; Parkes, G.; Ashton, G.; Ionashiro, M.; Caires, F. Study of the thermal behavior in oxidative and pyrolysis conditions of some transition metals complexes with Lornoxicam as ligand using the techniques: TG-DSC, DSC, HSM and EGA (TG-FTIR and HSM-MS). Ther. Acta 2019, 681, 178399. [Google Scholar] [CrossRef]
- Qiao, Y.Y.; Wang, B.; Zong, P.J.; Tian, Y.L.; Xu, F.F.; Li, D.W.; Li, F.L.; Tian, Y.Y. Thermal behavior, kinetics and fast pyrolysis characteristics of palm oil: Analytical TG-FTIR and Py-GC/MS study. Energy Convers. Manag. 2019, 199, 111964. [Google Scholar] [CrossRef]
- Bi, H.B.; Wang, C.X.; Lin, Q.Z.; Jiang, X.D.; Jiang, C.L.; Bao, L. Combustion behavior, kinetics, gas emission characteristics and artificial neural network modeling of coal gangue and biomass via TG-FTIR. Energy 2020, 213, 118790. [Google Scholar] [CrossRef]
- Song, H.J.; Liu, G.R.; Zhang, J.Z.; Wu, J.H. Pyrolysis characteristics and kinetics of low rank coals by TG-FTIR method. Fuel Process. Technol. 2017, 156, 54–460. [Google Scholar] [CrossRef]
- Ding, L.; Zhou, Z.J.; Guo, Q.H.; Lin, S.J.; Yu, G.S. Gas evolution characteristics during pyrolysis and catalytic pyrolysis of coals by TG-MS and in a high-frequency furnace. Fuel 2015, 154, 222–232. [Google Scholar] [CrossRef]
- Cai, J.M.; Chen, Y.; Liu, R.R. Isothermal kinetic predictions from nonisothermal data by using the iterative linear integral isoconversional method. J. Energy Inst. 2014, 87, 183–187. [Google Scholar] [CrossRef]
- Hu, R.Z.; Wu, S. A numerical method of computing the kinetic parameters Exothermic decomposition of energetic materials via the exothermic rate equation. J. Therm. Anal. Calorim. 1995, 1, 885–902. [Google Scholar] [CrossRef]
- Xie, H.Q.; Yu, Q.B.; Duan, W.J.; Wang, K.; Li, X.H.; Shi, X.B. Pyrolysis characteristics and kinetics of lignin derived from three agricultural wastes. J. Renew. Sustain. Energy 2013, 5, 063119. [Google Scholar] [CrossRef]
- Cepeliogullar, O.; Haykiri-Acma, H.; Yaman, S. Kinetic modelling of RDF pyrolysis: Model-fitting and model-free approaches. Waste Manag. 2016, 48, 275–284. [Google Scholar] [CrossRef]
- Hu, R.Z.; Shi, Q.Z. Thermal Analysis Kinetics; Science Press: Beijing, China, 2001; pp. 86–125. [Google Scholar]
- Khan, M.I.; Khan, H.U.; Azizli, K.; Sufian, S. The pyrolysis kinetics of the conversion of Malaysian kaolin to metakaolin. Appl. Clay Sci. 2017, 146, 152–161. [Google Scholar] [CrossRef]
- Irfan, K.; Azizli, K.; Sufian, S.; Man, Z.; Khan, A.S. Simultaneous preparation of nano silica and iron oxide from palm oil fuel ash and thermokinetics of template removal. RSC Adv. 2015, 5, 20788–20799. [Google Scholar] [CrossRef]
- Vyazovkin, S. Isoconversional Kinetics of Thermally Stimulated Processes; Springer: Berlin/Heidelberg, Germany, 2015; pp. 125–210. [Google Scholar]
- Davarcioglu, B.; Ciftci, E. The clay minerals observed in the building stones of Aksaray-Guzelyurt area (Central Anatolia-Turkey) and their effects. Int. J. Phys. Sci. 2010, 5, 1734–1743. [Google Scholar] [CrossRef]
- Shokrlu, Y.H.; Maham, Y.; Tan, X.; Babadagli, T.; Gray, M. Enhancement of the efficiency of in situ combustion technique for heavy-oil recovery by application of nickel ions. Fuel 2013, 105, 397–407. [Google Scholar] [CrossRef]
- Chakravartula, S.S.; Steven, S.C. Infrared Study of Strongly and Weakly Adsorbed CO2 on Fresh and Oxidatively Degraded Amine Sorbents. J. Phys. Chem. C 2013, 117, 9196–9205. [Google Scholar] [CrossRef]
- Carlos, R.N.; Encncarnacion, R.A.; Ana, L.; Alejandro, B.N.; Miguel, O.H. Thermal decomposition of calcite: Mechanisms of formation and textural evolution of CaO nanocrystals. Am. Miner. 2009, 94, 578–593. [Google Scholar] [CrossRef]


| SiO2 | Al2O3 | CaO | TiO2 | Fe2O3 | K2O | MgO | SO3 | P2O5 | PbO | Zr2O3 |
|---|---|---|---|---|---|---|---|---|---|---|
| 38.42 | 34.77 | 4.20 | 1.35 | 0.39 | 0.13 | 0.08 | 0.05 | 0.07 | 0.67 | 0.18 |
| Moisture | Ash | Volatile | Total Sulfur | Total Moisture | Carbon | Hydrogen | Nitrogen |
|---|---|---|---|---|---|---|---|
| 1.00 | 82.8 | 14.74 | 0.03 | 1.06 | 2.62 | 1.53 | 0.07 |
| Symbol of g(α) | The Sequence Number of Function | Equation Name | Expression of G(α) Function |
|---|---|---|---|
| D1 | 1 | One-dimensional diffusion | α2 |
| D2 | 2 | Two-dimensional diffusion | α + (1 − α)ln(1 − α) |
| 1D3 | 6 | Tri-dimensional diffusion (spherically symmetric) | [1 − (1 − α)1/3]2 |
| 2D3 | 7 | Tri-dimensional diffusion (cylindrically symmetric) | 1 − 2α/3 − (1 − α)2/3 |
| A1 | 16 | Nucleation and growth (n = 1) | −ln(1 − α) |
| A2/3 | 17 | Nucleation and growth (n = 3/2) | [−ln(1 − α)]3/2 |
| A2 | 13 | Nucleation and growth (n = 1/2) | [−ln(1 − α)]1/2 |
| A3 | 11 | Nucleation and growth (n = 1/3) | [−ln(1 − α)]1/3 |
| R2 | 31 | Shrinking core (cylindrically symmetric) | 1 − (1 − α)1/2 |
| R3 | 29 | Shrinking core (spherically symmetric) | 1 − (1 − α)1/3 |
| P2 | 24 | Power law | α1/2 |
| P3 | 23 | Power law | α1/3 |
| C2 | 37 | Chemical reaction | (1 − α)−1 − 1 |
| C1.5 | 38 | Chemical reaction | (1− α)−1/2 |
| Heating Rate (°C/min) | Temperature (°C), Stage-I | Temperature (°C), Stage-II | ||||
|---|---|---|---|---|---|---|
| Starting Temperature | Peak Temperature | Ending Temperature | Starting Temperature | Peak Temperature | Ending Temperature | |
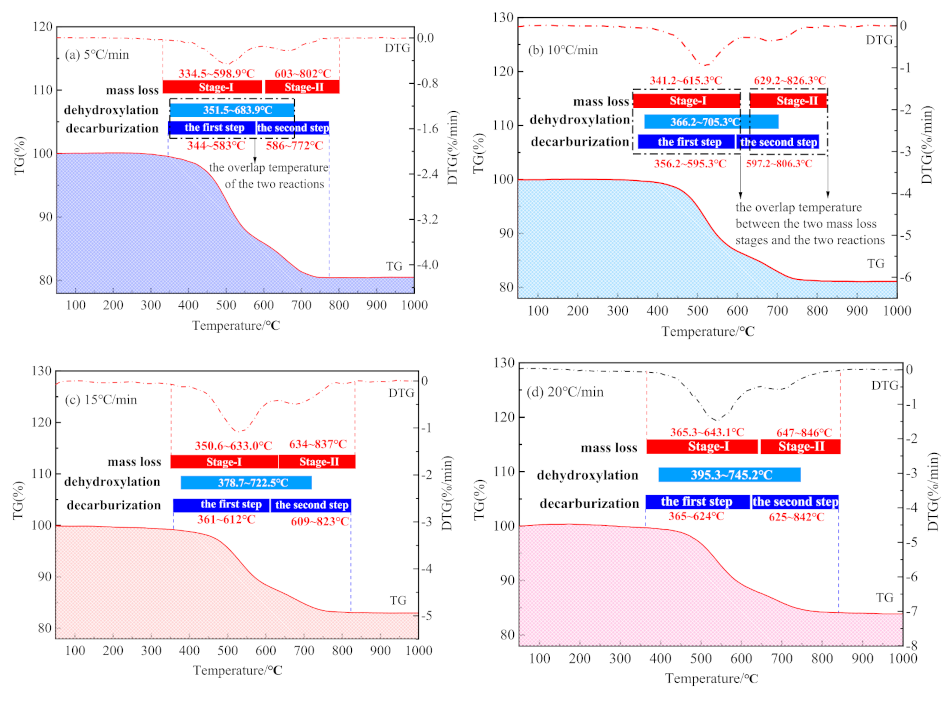
| 5 | 334.5 | 505.9 | 598.9 | 603.2 | 658.1 | 802.2 |
| 10 | 341.2 | 520.5 | 615.3 | 629.2 | 668.4 | 826.3 |
| 15 | 350.6 | 527.8 | 633.0 | 633.1 | 678.5 | 837.3 |
| 20 | 365.3 | 541.0 | 643.1 | 647.2 | 694.4 | 846.6 |
| Method | Heating Rate (°C/min) | Activation Energy Ea (kJ·mol−1) | Pre-Exponential Factor log A (s−1) | Linear Correlation Coefficient r | Sequence Number of Function |
|---|---|---|---|---|---|
| The general integration | 5 | 188.32 | 9.82185 | 0.987462 | 17 |
| 10 | 179.81 | 9.24424 | 0.987345 | 17 | |
| 15 | 170.41 | 8.58677 | 0.989268 | 17 | |
| 20 | 178.20 | 9.05905 | 0.988422 | 17 | |
| Mac Callum–Tanner | 5 | 194.34 | 10.30910 | 0.989254 | 17 |
| 10 | 186.10 | 9.74108 | 0.989288 | 17 | |
| 15 | 176.88 | 9.08622 | 0.991059 | 17 | |
| 20 | 184.91 | 9.58110 | 0.990282 | 17 | |
| Satava–Sestak | 5 | 191.68 | 10.05920 | 0.989254 | 17 |
| 10 | 183.89 | 9.53854 | 0.989288 | 17 | |
| 15 | 175.18 | 8.93795 | 0.991059 | 17 | |
| 20 | 182.77 | 9.38547 | 0.990282 | 17 | |
| Average | 182.71 | 9.44588 | 0.989355 |
| Method | Heating Rate (°C/min) | Activation Energy Ea (kJ·mol−1) | Pre-Exponential Factor log A (s−1) | Linear Correlation Coefficient r | Sequence Number of Function |
|---|---|---|---|---|---|
| The general integration | 5 | 160.36 | 9.00977 | 0.995881 | 17 |
| 10 | 155.24 | 8.61711 | 0.995719 | 17 | |
| 15 | 153.77 | 8.49211 | 0.996107 | 17 | |
| 20 | 162.34 | 9.04798 | 0.995623 | 17 | |
| Mac Callum–Tanner | 5 | 164.94 | 9.37296 | 0.996463 | 17 |
| 10 | 160.12 | 8.99238 | 0.996383 | 17 | |
| 15 | 158.86 | 8.88716 | 0.996754 | 17 | |
| 20 | 167.67 | 9.46579 | 0.996290 | 17 | |
| Satava–Sestak | 5 | 163.94 | 9.29719 | 0.996463 | 17 |
| 10 | 159.36 | 8.95256 | 0.996383 | 17 | |
| 15 | 158.17 | 8.84942 | 0.996754 | 17 | |
| 20 | 166.49 | 9.37322 | 0.996290 | 17 | |
| Average | 160.94 | 9.02980 | 0.996259 |
| Method | Heating Rate (°C/min) | Activation Energy Ea (kJ·mol−1) | Pre-Exponential Factor log A (s−1) | Linear Correlation Coefficient r | Sequence Number of Function |
|---|---|---|---|---|---|
| The general integration | 5 | 210.63 | 9.00166 | 0.995259 | 29 |
| 10 | 211.22 | 9.05133 | 0.998382 | 29 | |
| 15 | 204.71 | 8.72449 | 0.994881 | 29 | |
| 20 | 217.44 | 9.35466 | 0.996899 | 29 | |
| Mac Callum–Tanner | 5 | 219.45 | 9.68081 | 0.995962 | 29 |
| 10 | 220.41 | 9.75185 | 0.996033 | 29 | |
| 15 | 214.06 | 9.42612 | 0.995686 | 29 | |
| 20 | 227.10 | 10.0888 | 0.997376 | 29 | |
| Satava–Sestak | 5 | 211.38 | 9.29337 | 0.995962 | 29 |
| 10 | 216.30 | 9.35931 | 0.996033 | 29 | |
| 15 | 210.30 | 9.06746 | 0.995686 | 29 | |
| 20 | 222.60 | 9.66119 | 0.997376 | 29 | |
| Average | 215.47 | 9.37175 | 0.996295 |
| Symbol of g(α) | Sequence Number of Function | Equation Name | Expression of g(α) Function |
|---|---|---|---|
| A2/3 | 17 | Random nucleation and growth (n = 3/2) | [−ln(1 − α)]3/2 |
| B3 | 29 | Shrinking core (spherically symmetric) | 1 − (1 − α)1/3 |
| C2 | 37 | Chemical reaction | (1 − α)−1 − 1 |
| Method | Heating Rate (°C/min) | Activation Energy Ea (kJ·mol−1) | Pre-Exponential Factor log A (s−1) | Linear Correlation Coefficient r | Sequence Number of Function |
|---|---|---|---|---|---|
| Agrawal | 5 | 147.19 | 7.18 | 0.998738 | 17 |
| 10 | 163.56 | 8.32 | 0.996484 | 17 | |
| 15 | 147.22 | 7.22 | 0.998580 | 17 | |
| 20 | 147.65 | 7.24 | 0.997282 | 17 | |
| Satava–Sestak | 5 | 152.40 | 7.61 | 0.998981 | 17 |
| 10 | 168.30 | 8.68 | 0.997072 | 17 | |
| 15 | 152.96 | 7.69 | 0.998877 | 17 | |
| 20 | 153.56 | 7.71 | 0.997831 | 17 | |
| Average | 154.11 | 7.71 | 0.997981 |
| Method | Heating Rate (°C/min) | Activation Energy Ea (kJ·mol−1) | Pre-Exponential Factor log A (s−1) | Linear Correlation Coefficient r | Sequence Number of Function |
|---|---|---|---|---|---|
| Agrawal | 5 | 257.46 | 11.81 | 0.998230 | 37 |
| 10 | 254.14 | 11.70 | 0.998209 | 37 | |
| 15 | 262.60 | 12.19 | 0.995548 | 37 | |
| 20 | 254.31 | 11.64 | 0.997943 | 37 | |
| Satava–Sestak | 5 | 261.61 | 12.16 | 0.999009 | 37 |
| 10 | 256.83 | 11.85 | 0.998378 | 37 | |
| 15 | 265.09 | 12.32 | 0.996072 | 37 | |
| 20 | 223.76 | 12.63 | 0.993748 | 37 | |
| Average | 254.48 | 12.04 | 0.997142 |
| Kinetic Method | Reaction | Activation Energy Ea (kJ·mol−1) | Pre-Exponential Factor log A (s−1) | Linear Correlation Coefficient r | Sequence Number of Function |
|---|---|---|---|---|---|
| TG-FTIR-MS | dehydroxylation | 182.71 | 9.44 | 0.989355 | 17 |
| the first step decarburization | 160.94 | 9.02 | 0.996259 | 17 | |
| the second step decarburization | 215.47 | 9.37 | 0.996295 | 29 | |
| Traditional method (TG) | the mass loss of first stage | 154.11 | 7.71 | 0.998000 | 17 |
| the mass loss of second stage | 254.48 | 12.04 | 0.997123 | 37 |
Publisher’s Note: MDPI stays neutral with regard to jurisdictional claims in published maps and institutional affiliations. |
© 2021 by the authors. Licensee MDPI, Basel, Switzerland. This article is an open access article distributed under the terms and conditions of the Creative Commons Attribution (CC BY) license (http://creativecommons.org/licenses/by/4.0/).
Share and Cite
Cheng, S.; Jiu, S.; Li, H. Kinetics of Dehydroxylation and Decarburization of Coal Series Kaolinite during Calcination: A Novel Kinetic Method Based on Gaseous Products. Materials 2021, 14, 1493. https://doi.org/10.3390/ma14061493
Cheng S, Jiu S, Li H. Kinetics of Dehydroxylation and Decarburization of Coal Series Kaolinite during Calcination: A Novel Kinetic Method Based on Gaseous Products. Materials. 2021; 14(6):1493. https://doi.org/10.3390/ma14061493
Chicago/Turabian StyleCheng, Simeng, Shaowu Jiu, and Hui Li. 2021. "Kinetics of Dehydroxylation and Decarburization of Coal Series Kaolinite during Calcination: A Novel Kinetic Method Based on Gaseous Products" Materials 14, no. 6: 1493. https://doi.org/10.3390/ma14061493
APA StyleCheng, S., Jiu, S., & Li, H. (2021). Kinetics of Dehydroxylation and Decarburization of Coal Series Kaolinite during Calcination: A Novel Kinetic Method Based on Gaseous Products. Materials, 14(6), 1493. https://doi.org/10.3390/ma14061493