1. Introduction
In engineering applications, where harsh operating conditions prevail such as in mineral industry, soil processing, and agriculture, tribological investigation of the operational variable dependent, location-specific wear and damage mechanisms are particularly important [
1,
2]. The demand of extended lifetime for machine elements and an increase in cost efficiency urges developing new materials, and the most cost-effective wear-resistant materials should be identified and applied [
3]. In 1986, the total annual cost due to wear in the agricultural sector of Canada reached around
$940 million [
4]. In agricultural machinery wear parts are frequently produced from specific steels, e.g., tillage tools, which are exposed to abrasive wear are made of 27MnB5 [
1]. Other components such as slurry pumps, extruders, pipes carrying ores, and coal slurry nozzles are exposed to slurry abrasive wear in power plants and mineral processing industries [
5,
6]. The equipment and components used in slurry transport experience multiple wear modes and damage mechanisms in the form of abrasion, slurry erosion, and corrosion. [
7,
8]. Straight pipes are good examples of abrasion caused by sliding and rolling particles [
3]. These conditions can also be encountered in agricultural applications where crop transport (e.g., wet paddy rice) and cultivation can cause similar problems [
9]. The agricultural and mining machine components operate in a wide range of conditions that shape the abrasive wear. The harmonization of environmental and technical requirements is a complex aspect in the selection and development of the applied structural materials. Therefore, in abrasion areas sometimes light and corrosion-resistant polymers [
10] or aluminum alloys are used, even when foamed [
11], but where the presence of mass and strength is essential (e.g., tillage and cultivators), the use of different steels is preferred. Generally, alloyed martensitic steels are utilized in these applications, often with hard alloy coatings to aid the wear resistance [
12].
Surface damage to a tribological pair is usually caused by consecutive small steps induced by wear micro-mechanisms. At the micro-level, the four different modes of abrasion are micro-ploughing, where the material is plastically deformed and displaced, micro-cutting, defined as micro-machining with chip removal, micro-fatigue, and micro-cracking [
13]. The micro-mechanisms generate physical modification at the surface whether or not material removal happens. In this way, the resulted surface damage on the material is the summarized outcome of one or more micro-mechanisms leading to macroscale damage in the form of grooves caused by abrasive particles [
14]. In accordance with the tribo-system characterization, the experienced macro-wear is the result of a complex tribo-system response influenced by the testing conditions besides the materials in contact [
15]. To select the best candidate material to optimize a tribological system, the tribosystem elements (contacting materials, their geometry and surface topography, the configuration of contact, the relative motion, the loading condition, and the environment with possible intermediates) need to be investigated [
13].
The accurate prediction of abrasion behaviour of the materials is difficult as numerous parameters govern the abrasion phenomenon. Researchers concluded that the abrasive wear rate within a wear regime is usually inversely proportional to the hardness of the abraded body [
14,
16,
17]. Proportional relation was found to the normal load [
18,
19,
20,
21], and the sliding velocity [
18,
22]. Effect of particle size [
18,
23,
24,
25], shape [
16,
17], and the type [
18] of abrasive media on the wear have been studied. These findings were also confirmed by pin-on-disc testing of different abrasion-targeted steels with different microstructures including ferritic stainless steel, medium alloyed ferritic carbon steel, and medium alloyed martensitic carbon steel [
2]. The basic relationships between material properties and specific wear have been investigated in numerous works of research, however the involved material properties are often limited to tensile properties besides the hardness. Quite a few materials have been considered to be used for abrasive slurry transport [
3], but their wear resistance may vary according to the system properties and possible newly developed materials have not been investigated. Furthermore, testing is often done in standardized test set-ups, where connection to a specific application is limited. Due to the different abrasion forms that can be present in a wide range, the present investigation is expanded to multiple test systems, which was not connected in the literature previously.
Multiple research was performed to estimate the abrasion resistance based on well-defined mechanical properties, e.g., Vickers hardness [
14,
26,
27], ultimate tensile strength and yield strength [
17,
28,
29,
30], and uniform elongation [
31]. Non-linear connections have been found between the abrasive wear resistance and the hardness along with the tensile properties for multi-phase low alloyed steels [
17,
32,
33]. The reported contradictory dependencies against basic mechanical properties were explained with limited data sets, imperfect separation of microstructural and compositional effects, an overly simplified statistical analysis, the use of different testing methods, or the absence of a unique correlation [
15]. The abrasive wear resistance of wall lining materials in iron ore mining was investigated [
34]. The wear rate was found to have a proportional relationship to the Knoop hardness values, therefore the hardness tests could be used to represent the abrasive wear ranking of the studied lining materials. The wear behavior of 7075 and 7075/5 wt% Al
2O
3 alloyed composites was investigated with a focus on microstructure, density, and hardness, produced by powder metallurgy [
35]. Analysis of variance (ANOVA) highlighted the percentage contribution of particle size (11.48%), sliding velocity (0.6%), and applied load (86.9%) on the wear. The experimental data of this work were correlated by reference to dimensional analysis considerations followed by least-squares polynomial regression [
36]. The influence of particle impact velocity, density, concentration, and hardness on the erosion wear was identified, however the effect of the impact angle was neglected. Dry sliding wear behavior of composites was investigated using a pin-on-disc set-up with different loads (10 N, 20 N, 30 N, 40 N), sliding velocity and wt% of MoB (1–4) as variables [
37]. ANOVA was used to study the significance and influence of parameters on the material loss, and the correlation between parameters was obtained by a regression equation. MoB content of the composites was observed to be the most dominant factor (57.09%), followed by sliding velocity and load. A broad investigation was performed on low alloyed steels to analyze the connection between abrasion resistance and standard mechanical properties of the materials. [
15]. ASTM G65 standard abrasion test was used for 20 chemically identical steel samples and 20 with different chemical compositions and microstructure but with similar mechanical properties. A strong linear connection between the wear performance and some mechanical properties was found for the chemically identical samples, however the samples with similar mechanical properties showed weaker correlations. In the recent research work by Bustillo et al. [
38], artificial intelligence models were used to forecast the surface wear based on the surface isotropy levels. For mass loss, the radial basis networks (RBFs) method resulted in the most precise prediction, whereas for surface deformation, the multilayer perceptrons (MLPs) technique brought the best results in terms of indicator Ra. Matuszewski et al. [
39] developed mathematical models based on experimental results to describe the connection of the surface wear and the studied influencing factors (e.g., load, velocity, surface parameters). The output parameters included mass loss, change in geometry, as well as surface roughness parameters. Their study enabled to predict the wear process of kinematic pairs with conformal contact.
Numerous investigations can be found in the literature, where the researchers connect the abrasion resistance of steels to their standard mechanical properties as determined in simple tensile and hardness testing [
15]. However, many unclear or even contradictory correlations have been found, partly due to small data sets, distinct testing methods, and relatively straightforward data processing techniques. A comprehensive evaluation of the abrasion sensitivity in martensitic steels for different test systems—taking into account tensile, hardness, impact and compressive mechanical properties and the dimensionless numbers that can be formed from them—is not in the literature yet, but that could support the proper steel material selection and developments for a given application.
Understanding the material behavior under different abrasive wear conditions is an important aspect from a design point of view to propose better-performing wear-resistant machine parts. To determine the wear performance, further laboratory tests are required to cover a wide range of abrasion processes in different tribo-systems. Taking the different abrasion forms that can be present in a wide range into consideration, our investigation is expanded to multiple test systems. Correlation analyses were performed to investigate the connection of abrasive wear features with extended mechanical property combinations (hardness H, ultimate tensile strength σM, yield strength σY, Young modulus E, uniform elongation εM, fracture elongation εB, Charpy ISO 148-1 W, compressive strength σc, compressive modulus Ec) in single- and multi-asperity tests systems and also in a slurry containing system, which can model different abrasive modes on the surfaces. Single-asperity scratch tests were performed with various loads, indenter tip radius, and attack angle in order to study the abrasive scratch-resistance of the materials. Pin-on-disc tests were used with various loads, sliding distance, and abrasive particles to investigate the material response in a multi-asperity contact abrasion process. The material behavior was further studied in a slurry-abrasion test system with different sliding velocity, distance, and impact angle of the abrasives. Large amounts of measured tribo data were processed by multiple linear regression models using IBM SPSS 25 software to determine and evaluate the abrasive sensitivity of wear performance and the change of 3D surface topography to material properties and to test system characteristics. In this way, not only was the wear performance of the materials compared in the different test systems, but the significance and contributions of parameters on wear behaviour were studied. A correlation analysis was performed on the processed data between abrasion resistance and extended mechanical properties by regression models. The abrasion sensitivity of the tested materials was evaluated considering a broad range of influencing parameters.
2. Materials and Methods
As mentioned in the introduction, three test methods have been used for a broad study about abrasion resistance of the selected abrasion targeted steels: A scratch test, an abrasive pin-on-disc test, and a slurry pot system. The resistance of a material to abrasion by one single indenting point is measured using single-asperity contact scratch testing [
40]. It simulates an ideal scenario in controlled conditions, where a single pass indenter abrades on a clean surface. However, this scenario is rarely encountered in real applications. As previously reported [
41], the wear rates determined only from single scratch tests are not a proper representation of the true behavior of the steel in high-stress abrasion conditions. In the multi-asperity contact abrasive pin-on-disc, the contact surface of the steel samples interacts with new SiC particles during the sliding resulting in surface deformation and wear of the specimen. The mentioned wear process was found to be dominant in case of agricultural tines and cultivator elements operating below 5 m/s [
1]. Abrasive slurry erosion was accomplished in the slurry pot system, which is often encountered in agriculture (e.g., when wet, soil contaminated crops are harvested, and in mining in the environment of abrasive slurry (e.g., slurry pipes).
2.1. Materials
In this investigation, the wear performance of 3 materials was studied. Two different abrasion-resistant martensitic steels with the same chemical composition but different post-processing. After hot rolling, material “FM” is water quenched and coiled at room temperature, resulting in a fresh martensitic structure. Reheating followed by air cooling results in a low tempered martensitic structure of material “TM”. The third tested material was a more ductile multiphase steel (material “MP”), characterized by martensitic structure along with small fractions of retained austenite. The chemical composition of all tested materials is shown in
Table 1.
The characteristic features and properties of the three materials are summarized in
Table 2.
2.2. Abrasive Scratch Test
The steel specimens for the single-asperity scratch test were processed through grinding and polishing following ASTM G171—03(2017). The surface topography of the prepared steel samples was investigated in unworn and post-mortem conditions using a non-contact optical profilometer (Taylor Hobson CCI HD, Leicester, UK). Rockwell-type diamond indenters were used to create the scratches with different indenter geometry and load conditions on a modified pin-on-disc test-rig.
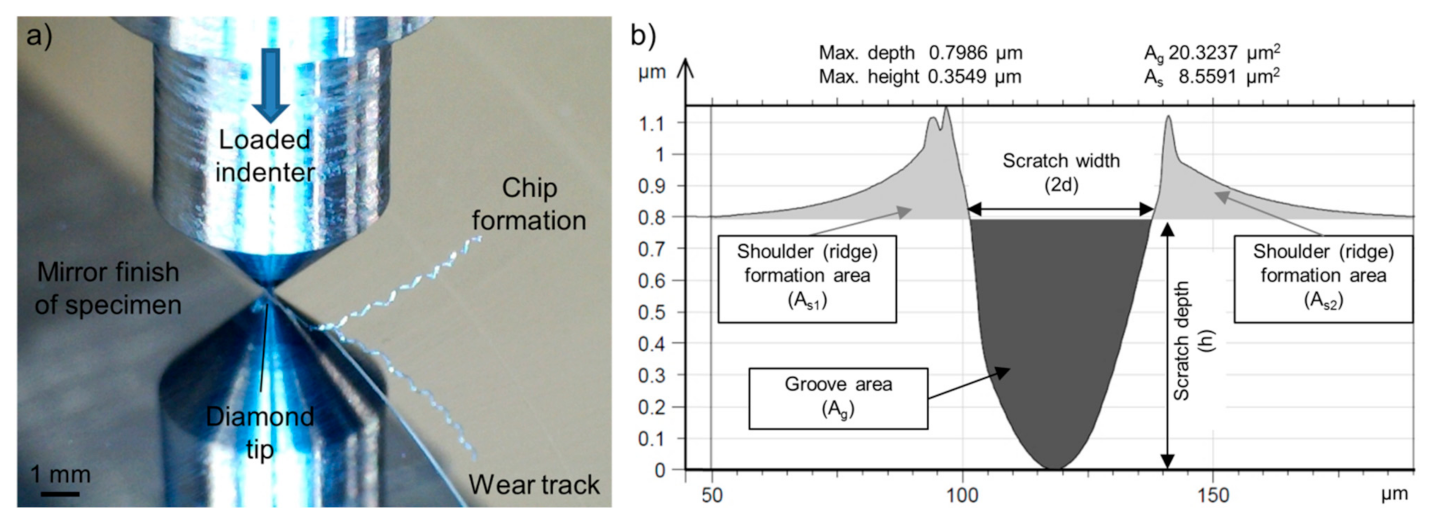
Figure 1a shows a scratch process of the loaded indenter engaging the polished specimen surface and removing material through micro-cutting mechanism.
TalyMap software (version 6.2, Digital Surf, Besançon, France) was used to extract the 3D surface data of the wear track. Multiple cross-section profiles were processed along the wear track from defined locations (2 profile/µm). The derived data were then merged into one cross-section profile to study, as seen in
Figure 1b.
The wear micro-mechanisms were identified with the degree of penetration (Dp) of the wear groove, which was calculated from the averaged cross-section profile after the scratch tests. Dp not only serves as a tool to identify the micro-abrasion processes from the wear track geometry but also gives an indication about the wear severity [
42]. From the literature [
43], the Dp is calculated by dividing the groove depth (
h) (µm) with the half-width of the profile at the surface level (d) (µm).
As it can be seen in
Figure 1b, the value of the groove area (
Ag), as well as the shoulder/ridge areas (A
s1, A
s2) are derived from the software. In order to get the volume of the groove (
Vg (mm
3)) and of the ridges/shoulders (
Vs [mm
3]) the values are multiplied with the scratch length. The wear volume is the difference between the shoulder volume to the groove volume. Different Dp value ranges are associated with each wear micro-mechanism. The material hardness influences these ranges. The transition in micro-mechanism from micro-ploughing to micro-cutting is induced by increasing the attack angle of the abrading particle, hence increase of Dp [
17,
44].
To compare the wear performance of the tested materials, the specific wear rate
k (mm
3/Nm) was calculated according to the literature [
45]:
where
N is the normal load (N) and s is the sliding distance (m).
In the abrasive scratch tests, where single-asperity contact between the loaded indenter and the material surface induces the deformation, test variables of normal load (0.9 N, 1.3 N, 5.8 N, 10.8 N), attack angle (30°/45° corresponding to cone angle 120°/90°), and indenter tip radius (25 µm, 50 µm, 100 µm, 200 µm) for all the three different steel grades were used. A constant sliding speed of 0.45 mm/s was applied throughout the 30 mm long scratch. Tests were repeated three times for extreme and intermediate test conditions.
2.3. Pin-on-Disc Test
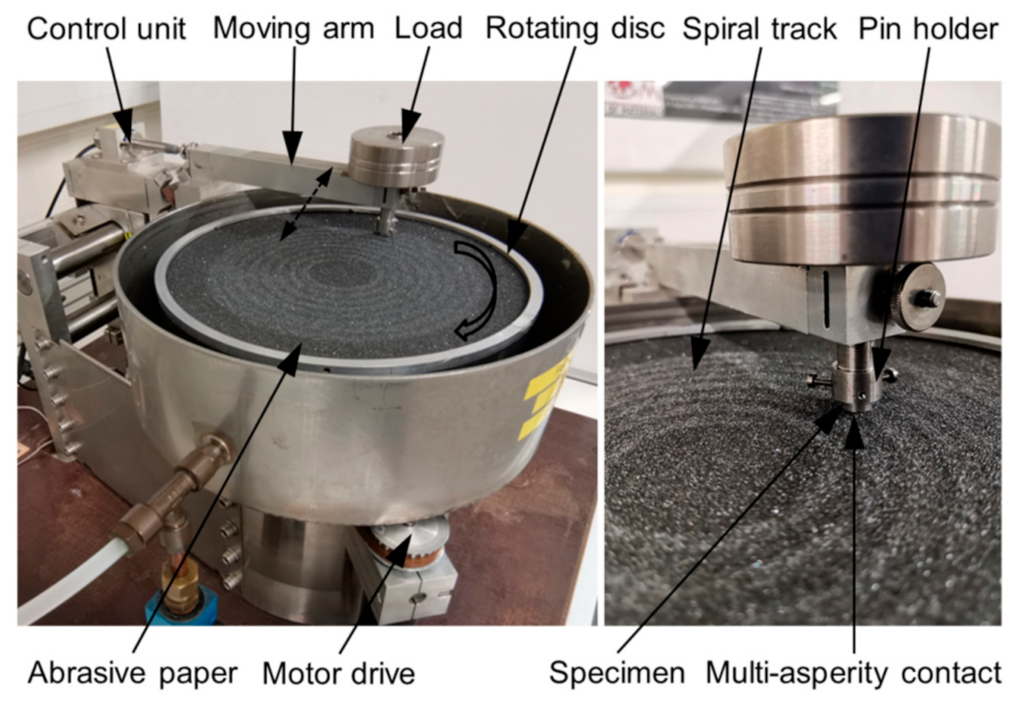
Pin-on-disc tests were performed according to ASTM G132 [
46] multi-asperity testing. The test set-up (developed at Labo Soete, Gent, Belgium) is shown in
Figure 2.
As confirmed from the literature [
47], the machined surface structure isotropy affects the progress of material removal, however the same material processing and specimen preparation was used for this investigation, which enables the comparison of the materials. Cylindrical pin samples (diameter 8mm and height 5 mm) were produced from steel sheets using laser cutting technology. The uniform specimen preparation method included the processing of the contact surface with P80 sandpaper to a sliding distance of 3 m under 12 N load, followed by polishing with P800 with the same settings. After the mechanical finishing, an ultrasonic cleaning followed, before checking the pre-test 2D surface topography. The final surface state was characterized perpendicular to the one-way oriented surface grooves, with Ra ~ 1 µm average Rz of 8.3 µm, Rq of 1.6 µm. In the test system, four types of SiC abrasive papers were applied (P80—200 µm, P120—100 µm, P180—50 µm, P800—25 µm) introducing different average attack angles (P80—28°, P120—32°, P180—35°, P800—45°) [
48]. In the pin-on-disc tests, the multi-asperity contact between the loaded specimen and the used different abrasive papers under relative motion at 100 mm/s invoked the material removal. The material loss was tracked by an electronic balance with an accuracy of 0.1 mg. Samples were measured in unworn condition and after every 3 m sliding. Keyence VR 5200 microscope (Keyence, Osaka, Japan) was used to examine the 3D worn surface topography. Furthermore, the post-mortem steel samples were checked for their Vickers hardness on the contact surface at 10 distinct locations. The sliding distance up to 9 m, the applied normal loads (4.5 N, 11.4 N, 17.3 N, 24.2 N), and the abrasive particle size and attack angle were considered as test variables. For the extreme and intermediate cases, three replicates were performed. The ambient conditions were registered as the following: 21–23 °C, 45–55% RH.
2.4. Slurry-Pot Test System
In a more complex multi-asperity contact test system, the specimens were tested in abrasive slurry. The test configuration was designed to experimentally simulate the wear of components that experiences abrasive erosion wear mechanisms. This test set-up enables to test in a more complex environment closer to the real application, where co-existing wear mechanism occurs e.g., on agricultural tines [
1]. Although more uncertainties are involved in the slurry-contact mechanism, the effects of the controlled wear-influencing parameters are investigated. The method also provides an efficient ranking of materials in terms of wear rate.
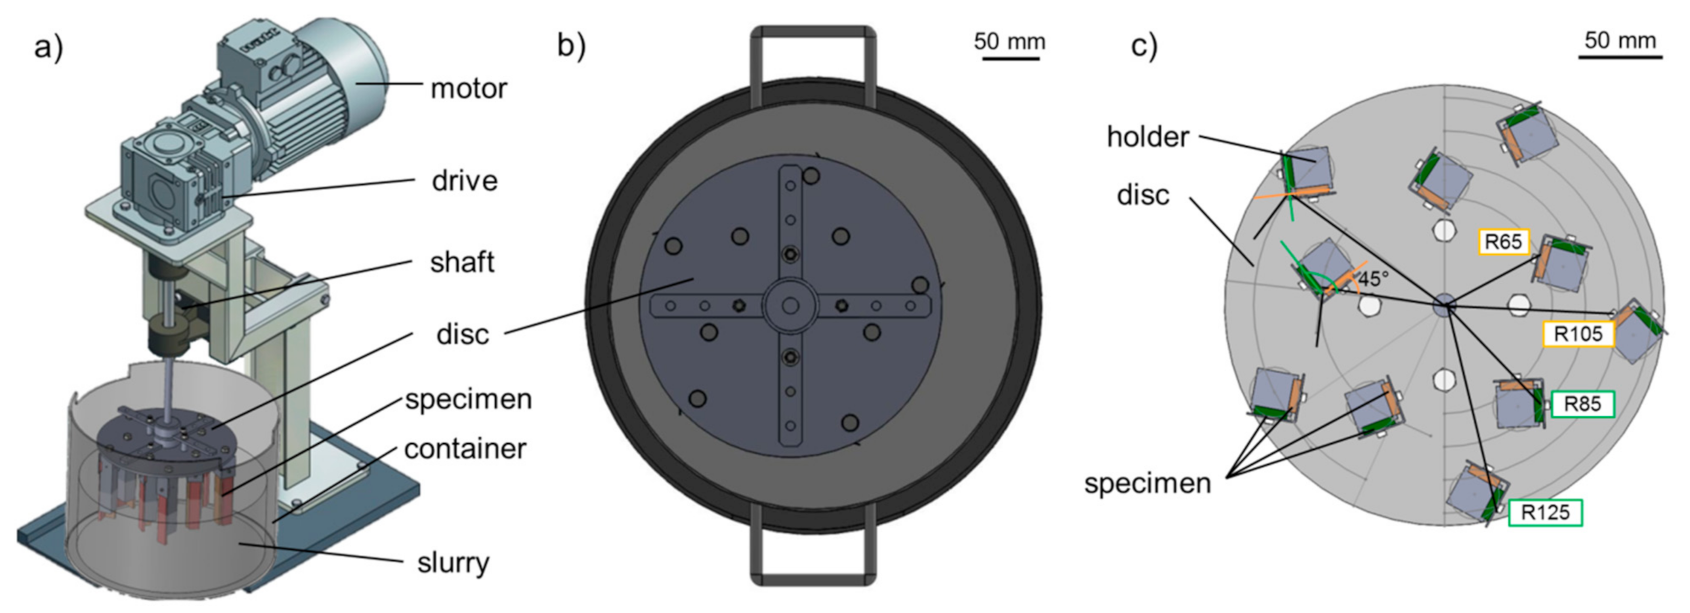
The concept of the test rig is shown in
Figure 3a. The test set-up was developed and manufactured in MATE, Gödöllő, Hungary. The rotating disc is driven by a three-phase induction motor on a vertical shaft through a 1:10 worm drive. The shaft is supported by ball bearings. The disc is eccentrically placed in a cylindrical container (
Figure 3b) to provide better mixing of the media in the container, which is accommodated with slurry formed from abrasive media and water in a 4:1 ratio.
The used abrasive medium was corundum (Korund EKF-10, MOTIM, Mosonmagyaróvár, Hungary). This is a crystalline form of Al
2O
3, a rock-forming mineral. The average size of a new corundum particle is in the range of 2000–2360 µm, with 3.87 kg/dm
3 density and 9.0 Mohs hardness/2050 Knopp kN/mm
2. The effectiveness of an abrasive depends on its hardness, shape, grain density, and grain size. The smaller the grains, the slower their effect, but the angular shape results in increased abrasion [
49].
On the disc, vertically mounted specimen holder columns are placed on two different radii (75, 115 mm), five pieces on each radius.
Figure 3c shows the bottom view of the disc with the mounted holders and specimens in different configurations. On each specimen holder column, two specimens are mounted perpendicular to each other. These holders could be rotated around their axis to set the orientation angle of the specimen with respect to the slurry flow direction. Due to the geometry of the specimen holders, the center of the specimens was placed on four different radii (65, 85, 105, 125 mm). The samples on radius 65 mm and 105 mm were facing the center of rotation (center shaft), and the samples on radius 85 mm and 125 mm were facing the pot wall. The top 20 mm of the specimen—where they are mounted to the specimen holder—is protected with an extra plate to keep a reference, unworn zone on each sample. In static position, the specimens were covered in the slurry to a depth of 60 mm depth (half of the specimen height).
Figure 3.
(
a) Test rig concept [
50]; (
b) top view of the eccentric placed disc in pot; (
c) bottom view of the disc with the mounted specimen on radii 65, 85, 105, 125 mm in different angle configuration.
Figure 3.
(
a) Test rig concept [
50]; (
b) top view of the eccentric placed disc in pot; (
c) bottom view of the disc with the mounted specimen on radii 65, 85, 105, 125 mm in different angle configuration.
During operation, the rotation of the shaft agitates the slurry and causes the moving specimen to slide and impact against the abrasive in the slurry. Depending on the location of the samples on the holder, collisions occur with different impact mean velocity values and in different angles. Tests were performed at a rotational speed of 140 rounds/min and a room temperature of 21 ± 1 °C. The slurry pot was placed inside a container with a continuous flow of cooling water, providing the cooling through the pot walls.
In the developed abrasive slurry test configuration, the effect of sliding distance, sliding velocity, and collision impact angle on the material loss was investigated. The change in surface topography and hardness was also monitored. Slurry pot testing of 20 specimens was carried out for 9 × 20 h of operation. All three materials were tested with the same conditions, and the cycle was repeated to ensure three repetitions for each material. The testing parameters and conditions are shown in
Table 3.
At every 20 h intermediate pause, the slurry was replaced with fresh abrasives, and the samples were investigated for their weight and hardness of the worn zone. After cleaning the specimens, the surface roughness was monitored with Mitutoyo Surftest SJ 211 (Kawasaki, Japan) stylus 2D profilometry. The hardness was measured with Zwick (Ulm, Germany) Roell Indentec 81,875 A/B tester using a diamond tip indenter and 30 kg (~300 N) indentation force. On all specimens, 10 indents were in the worn zone and on the unworn reference zone. After 180 h of testing the specimen were investigated with Keyence (Osaka, Japan) VR-5200 wide-area 3D microscopy to analyze the worn specimen surface topography change caused by wear.
2.5. Evaluation Methodology
In the single-asperity scratch test system, the wear groove characteristics (groove width 2d (µm), groove depth h (µm), groove area Ag (µm2), ridge/material shoulder area As (µm)) were registered under 32 system conditions (different normal loads FN (N), different indenter cone angle (°), different indenter tip radius r (µm)) in the function of sliding distance, s (m). A specific wear rate was calculated (wear volume normalized with load and sliding distance) (mm3/N·m) for the material ranking.
In the pin-on-disc test system: Wear as mass loss [g], worn surface hardness was registered under 16 system conditions (different normal loads FN (N), different abrasive size d (µm) with different attack angle α (°)) as a function of sliding distance, s (m). Materials were ranked based on the wear (g/km).
In the slurry-pot system, to track the wear evolution, the mass (g) of the steel specimen was registered after 20 h of testing, which corresponds to one-ninth of the total sliding path. The relative wear (%) has been calculated and normalized to sliding distance (km). The results were compared in function of the defined impact angle α (°) and circumferential velocity v (m/s). The change of the worn surface hardness was also tracked in the function of the sliding distance s (m).
For both multi-asperity contact test systems, the surface topography was investigated before testing and in post-mortem condition. The following 2D surface parameters were extracted (ISO 4287): Ra (µm), Rz (µm), Rp (µm), Rv (µm), Rt (µm), Rc (µm), Rq (µm), Rsm (µm), Rsk [-], Rku [-].
The measured data were investigated as a function of the properties of the examined steels (
Table 2) and the dimensionless numbers formed from these properties. The combined or derived dimensionless numbers are as follows:
the ratio between hardness and elasticity modulus,
the ratio between ultimate tensile strength/yield strength,
the ratio between fracture elongation/elongation at maximum tensile load,
(=W) the ratio between Charpy impact strength at 20 °C/Charpy impact strength at −40 °C,
the ratio between combined tensile performance/combined bulk-surface stiffness,
the ratio between compression modulus/compression strength,
the ratio between combined Hardness-strain capability/yield strength,
the ratio between yield strength/combined compression—strain capability,
the ratio between combined Charpy ratio and strain capability/combined tensile strength,
the ratio between elongation at maximum tensile load/yield strength,
the ratio between Charpy impact strength ratio/fracture elongation,
the multiplication of combined Charpy impact strength ratio and elastic tensile behaviour.
The statistical analysis relies on multiple linear regression models. Such models are useful if one examines how a dependent variable depends on several independent variables at one time, assuming that the dependence is (approximately) linear. Let
be the number of independent variables then the formulization of such model is
where
is the dependent variable and
are the independent variables. For a more detailed description of such models (in material science as well) see e.g., the authors’ previous paper [
10]. The statistical evaluation of the models was carried out by using IBM SPSS 25. For our models, the stepwise method was used to enter a new variable into a specific linear regression model.
3. Results and Discussion
3.1. Scratch Test
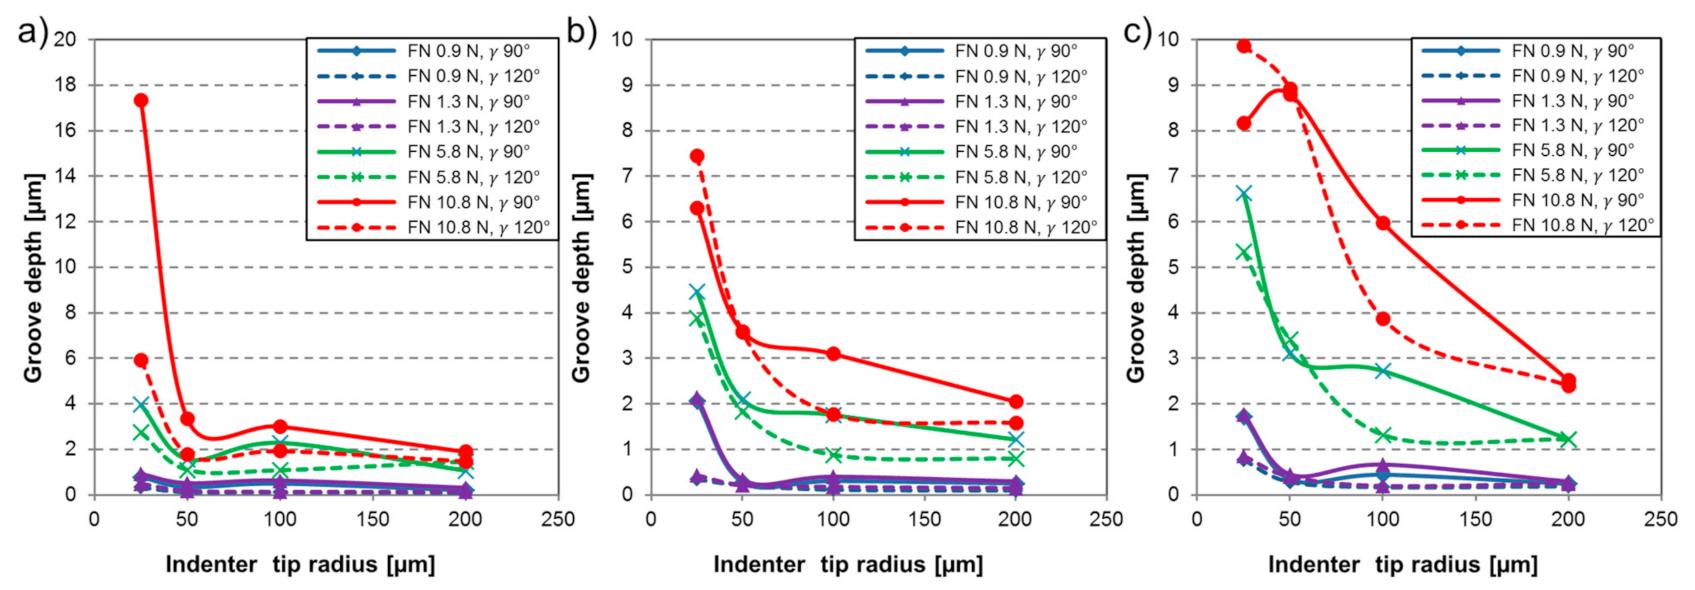
The wear grooves were analyzed (groove depth and width as well as groove and ridge areas) to calculate the Dp and the specific wear rate of the materials.
Figure 4 shows the depth of the wear grooves as a function of the indenter geometry and the applied load. Testing with higher loads evidenced in deeper grooves, however an increase in the tip radius resulted in the opposite effect. The cone angle was also found to have an inverse relation to the depth of the wear track. Hence, decrease in the attack angle generally created less-deep grooves, except for tests on the highest load with 25 µm tip radius in the case of TM and MP steel. The sharpest indenter (25 µm tip radius with 90° cone angle) with 10.8 N normal load provoked the highest stress concentration, leading to the deepest wear groove. Overall, the MP steel experienced the deepest scratches compared to the other investigated materials under the same testing conditions, which forecasts an inferior wear performance. It was reported in the literature [
27], that lower material hardness promotes more severe material removal with deeper wear grooves with increased degree of penetration. To confirm this observation, the Dp values of the wear grooves were investigated.
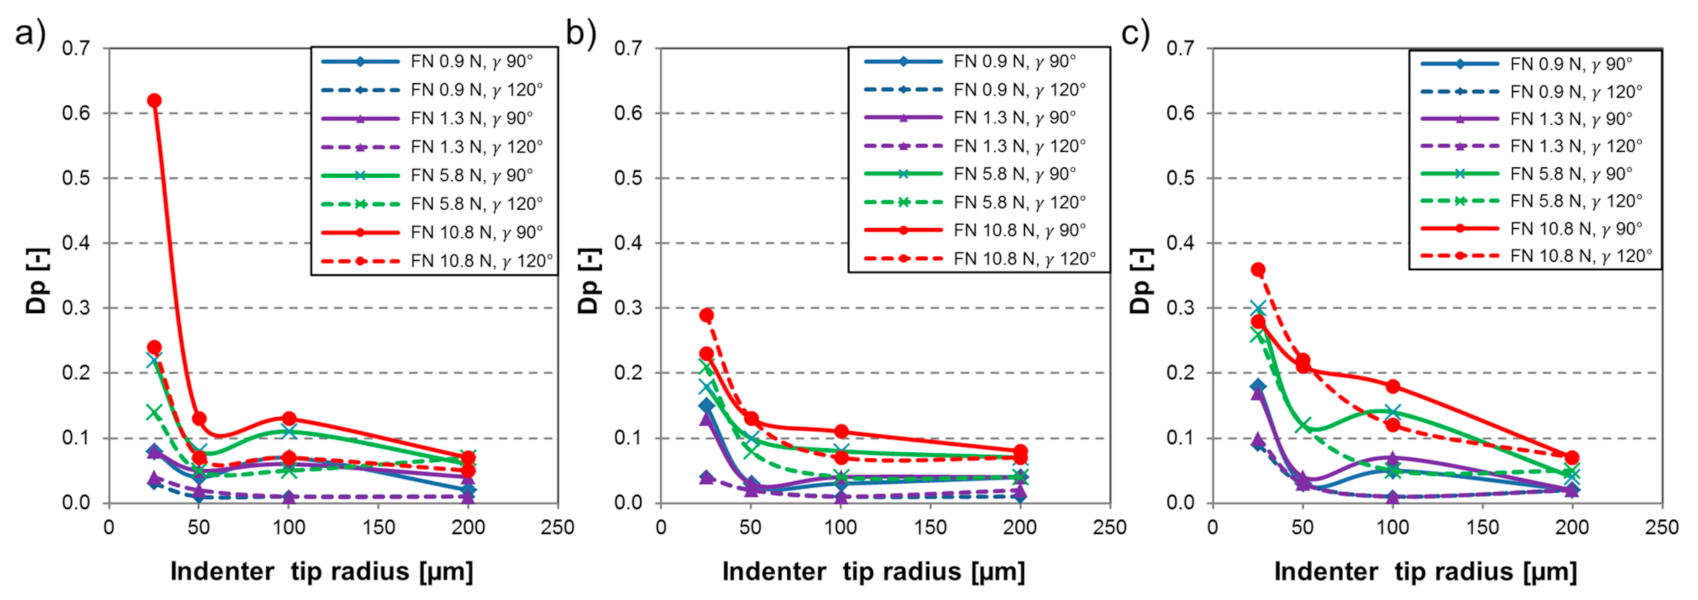
Figure 5 shows the Dp as a function of the indenter geometry and various applied normal loads. Dp range of 0–0.1 specifies that only plastic deformation of the material takes place through micro-ploughing. Above this zone, a transition happens with wedge formation to micro-cutting, where the material is removed, and chip is generated.
Overall, the MP material experienced wear grooves with elevated degree of penetration values compared to the martensitic steels. The sole exception is the test on FM material with the sharpest indenter (r 25 µm,
90°) and 10.8 N normal load (F
N). The applied load was found to have a proportional relation with the Dp. Grooves characterized with low degree of penetration were reported [
25] to represent plastic deformation with features of ridge formation along the wear track. In this way, test results on ~1 N load levels were characterized as micro-ploughing. A transition to micro-cutting was evident when testing with 5.8 N normal load. Further increase of the applied load resulted in more deep penetration of the indenter leading to elevated Dp and material removal through micro-cutting wear micro-mechanism. The influence of the indenter geometry was analyzed. The effect of the attack angle on the wear mechanism was previously investigated [
51]. A proportional relation was confirmed between the attack angle, in general, the decrease in attack angle reduced the Dp.
The material volume loss was normalized with the load and the sliding distance to get the specific wear rate, which is plotted against the tip radius in
Figure 6. Concerning wear resistance, the best performing material according to the single-asperity tests was the TM—tempered martensitic material, followed by FM—fresh martensitic. The MP material was prone to micro-cutting and suffered more significant material loss. The distinct wear performance of the investigated martensitic and MP materials could be interpreted as a consequence of the different material hardness (
Table 2). Comparing the martensitic materials, the initially slightly softer (−13 HV) TM steel performs best, which could be explained with the beneficial influence of the tempering process.
The test conditions (load, indenter cone angle, indenter tip radius, material) influenced the transition between the different micro-mechanisms. In order to investigate the dependence of scratch characteristics on the material properties and test system characteristics, multiple linear regression models were constructed. In these models, the independent variables coming from test systems were the cone angle “
”, the load “F
N”, and the tip radius “
r”, further independent variables were the material properties and the dimensionless indicators formed from them (that is in equation (2) the dependent variable
is scratch width, and the independent variables
are the previously mentioned ones). According to this, the best fitting model of the possible ones (using the method of least squares) for the scratch width was
the model turned out to be statistically relevant, that is, it significantly differs from a constant function, since the F-value was 377 and
p < 0.001. The obtained coefficients
,
and
of the respective independent variables are presented in
Table 4 (see the second column).
The model with the specific coefficients takes the form
For this model, the goodness-of-fit is R2 = 0.89. The load has the highest effect on the scratch width, while among the material parameters e.g., has some effect, this can be seen from the extent and the ranking of the absolute value of the Beta-coefficients.
The best fitting model of the possible ones for the scratch depth was
the model is relevant (F = 43 and
p < 0.001).
Table 5 summarizes the coefficients of the model.
For this model, the goodness-of-fit is R2 = 0.572. The load has the highest effect on the scratch depth, followed by the tip radius, while among the material parameters e.g., has some effect.
The best fitting model of the possible ones for the Dp was
which turned out to be relevant (F = 35 and
p < 0.001). The coefficients of the model are summarized in
Table 6.
For this model, the goodness-of-fit is R
2 = 0.533. The load has the highest effect on the Dp, followed by the tip radius and the cone angle. This verified the results from
Figure 5.
The best fitting model of the possible ones for the groove area (
Ag) was
the model is relevant since F = 51 and
p < 0.001. The coefficients of model (6) are presented in
Table 7.
For this model, the goodness-of-fit is R2 = 0.622. The normal load has the highest effect on the groove area, followed by the tip radius. Among the material parameters has some effect.
For the resulting wear, multiple linear regression models were constructed to see the sensitivity of material properties and test system characteristics on it. In the test systems, the sliding distance “
s”, the load “F
N”, the tip radius “
r”, and the cone angle “
” were considered as independent variables, as well as the material properties and the indicators formed from them. According to this, the best fitting model of the possible ones for the wear volume was
the model is relevant (the F-value was 57 and
p < 0.001). The coefficients of the model are presented in
Table 8.
For this model, the goodness-of-fit is R
2 = 0.374. The load has the highest effect on the wear volume, followed by the sliding distance. In this case, the dominant influence of the load on the material loss confirms previous literature findings [
20]. Among the material parameters the
has some effect.
Based on the above discussed linear models,
Table 9 summarizes the abrasive sensitivity for the resulted scratch characteristics (width, depth, degree of penetration, groove area, and volume). The factors are in increasing order of effect. The abrasive sensitivity is the extent how the independent variables (test variables and material properties and indicators formed from them) affect a dependent variable (e.g., wear) which is related to the standardized regression coefficients. Therefore, the higher the absolute value of the corresponding standardized regression coefficient is, the higher the abrasive sensitivity of the dependent variable is (wear, groove characteristics) with respect to the independent variable.
3.2. Pin-on-Disc Test
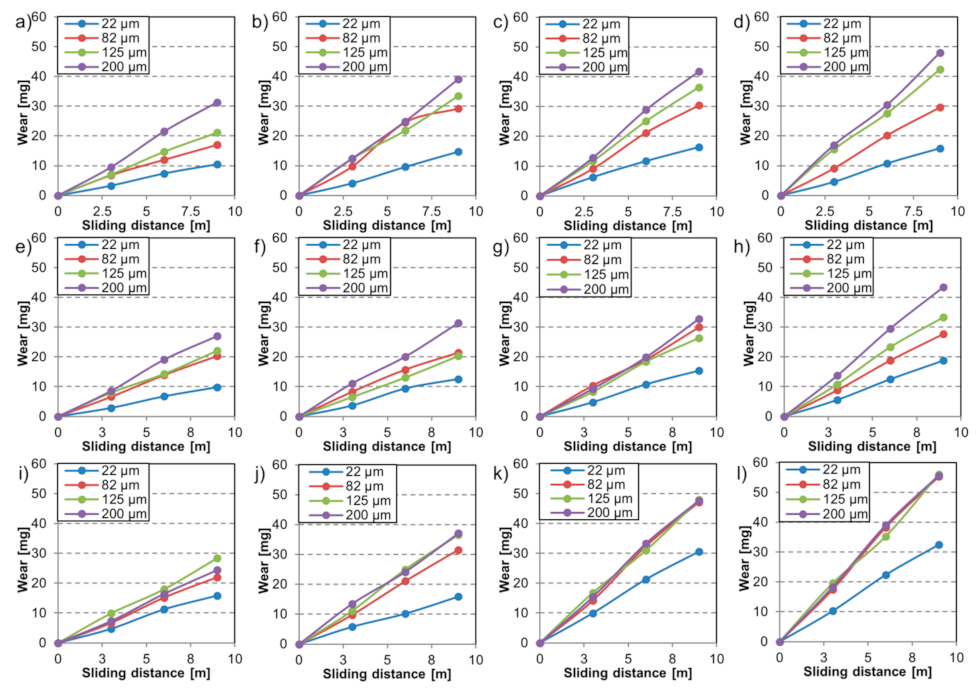
The mass loss [mg] as a function of the sliding distance for the tested materials during the multi-asperity tests is shown in
Figure 7. Increasing the load and the abrading particle size resulted in more severe wear.
As reported in the literature [
52,
53], the slope of the wear curves increases proportionally with the abrasive size up to the critical particle size (CPS). Upon entering this critical size range, the wear behavior may change [
24]. This was confirmed in the tests with MP material, where the adjustment in wear rate was evident above 82 µm abrasive particle size (
Figure 7i–l). The wear rate stabilized for the MP material in case of these conditions. The effect of the load was found to be more straightforward. Testing with higher load was always followed by more severe material loss.
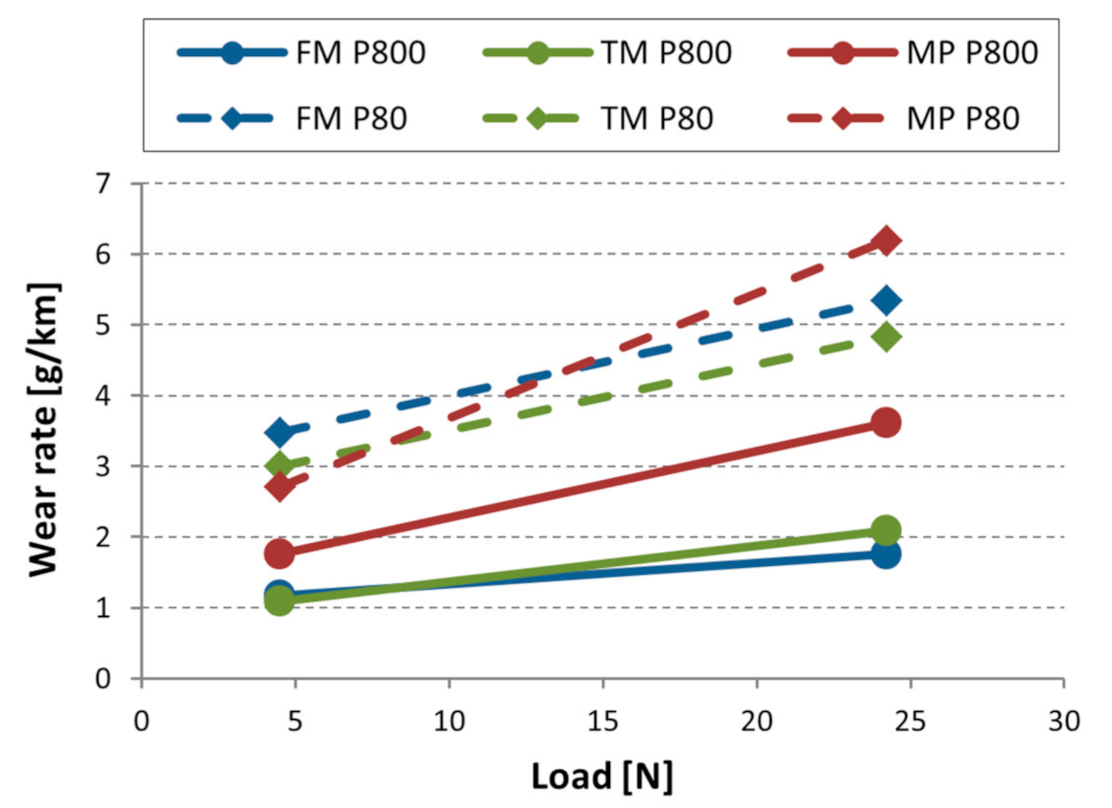
The role of particle size and attack angle was already reported [
54]. “Spike value” was introduced as a quantitative feature that takes the sharpness and size of the particle into consideration [
55]. The smaller average particle size of the P800 paper would anticipate inferior material removal than on a P80 paper. However, the higher attack angle of the embedded P800 particles due to their smaller tip radius mitigates this effect. Generally, higher attack angles enhance the micro-cutting process.
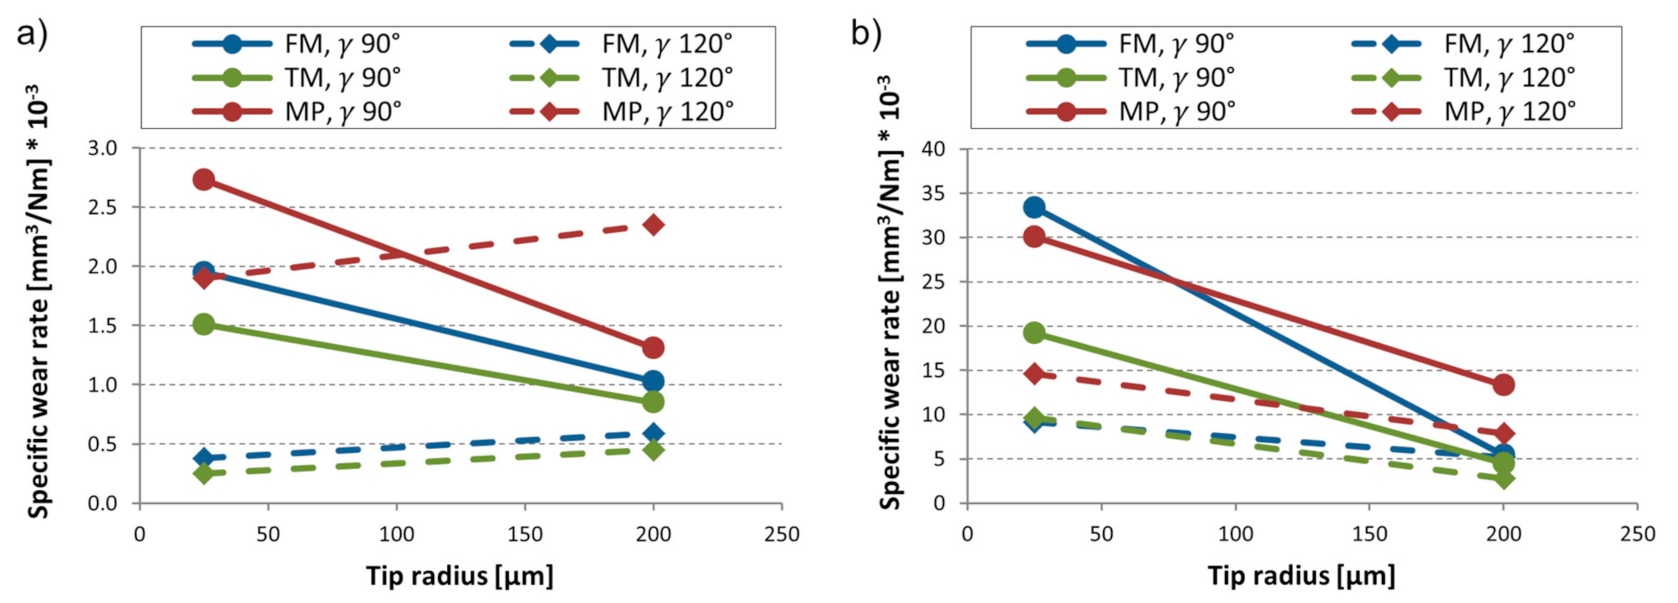
Figure 8 shows the wear rate (g/km) in function of the normal load for the tested materials. Comparing the materials regarding wear resistance, in general, TM material performed best in front of the FM material. MP steel experienced more severe material removal. Overall, the material ranking is in line with the wear trends observed in case of the single-asperity scratch tests.
The results are influenced by the material properties originating from its microstructure and the hardness differences [
56]. During the multi-asperity testing, the contact surface of the steel samples interacts with new abrasive particles when running on a spiral path inducing work hardening. For this reason, the hardness change was also investigated. In the most severe wear condition (P80 200 µm abrasive with 24.2 N load) the initial values of 478 HV for FM, 465 HV for TM, and 367 HV of MP changed to 504 HV, 488 HV, and 376 HV, respectively.
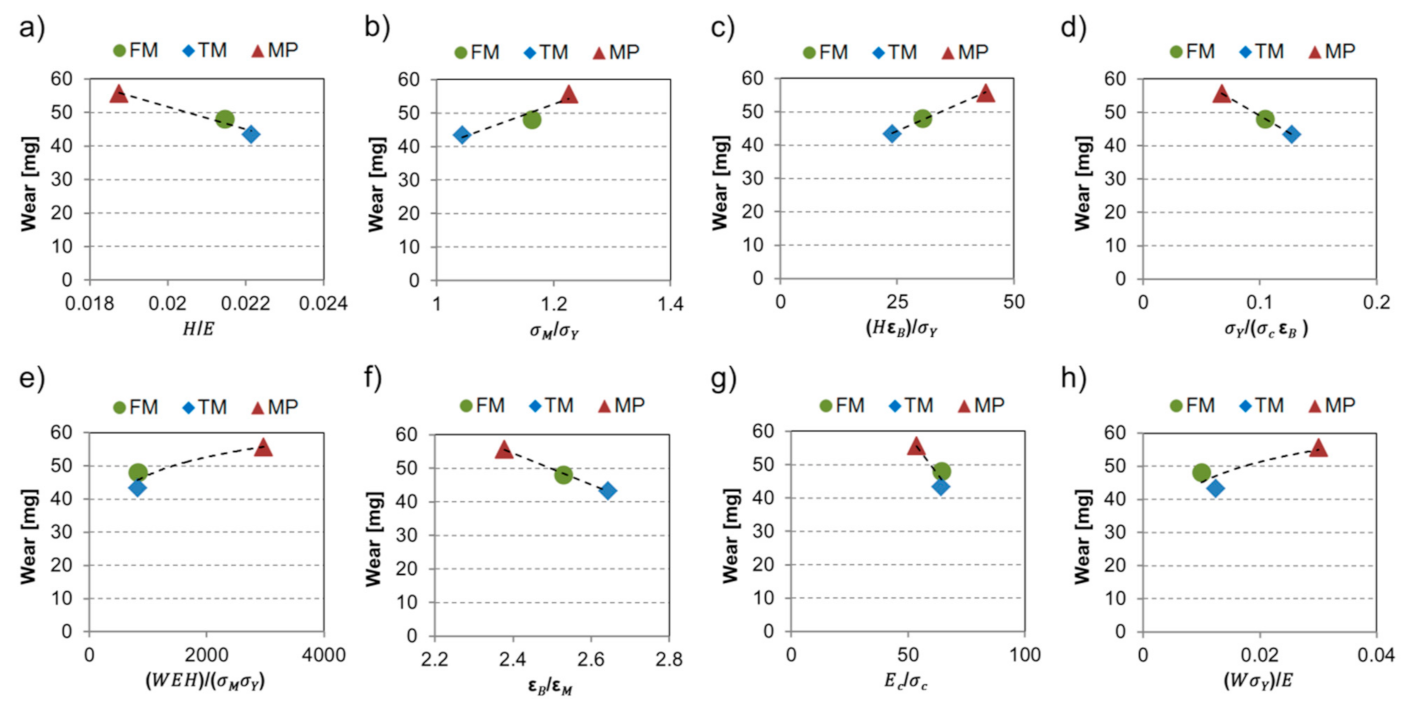
Figure 9 shows the most severe wear condition values in function of the formed dimensionless numbers originated from the material properties. This offers an indication of the effect of derived factors on the wear trend for each material. Proportional relations were found between the material loss and
, as well as
. Increased wear was observed by rising these dimensionless number values. In the case of
and
, a similar trend was found. Inverse relations were established between values
,
,
,
and the wear of the tested steels.
Similar to the previous discussions, again multiple linear regression models are investigated to see how the resulted wear depends on the material properties as well as the testing variables. The independent variables were the parameters sliding distance “s”, load “F
N”, and abrasive particle size “d”, together with the material properties and the dimensionless parameters derived from them. According to this, the best fitting model of the possible ones was
the F-value of the model was 261 and
p < 0.001, which again means that the model is relevant.
Table 10 summarizes the coefficients of the model.
For this model, the goodness-of-fit is R2 = 0.848. On the wear of the test sample the time of the experiment (sliding distance) has the highest effect, furthermore, the material related parameter has some effect.
The best fitting model of the possible ones for the change of the contact surface hardness was
the model is relevant (F = 699 and
p < 0.001). In
Table 11, the coefficients of the model are presented.
For this model, the goodness-of-fit is R2 = 0.994. The material parameter has a dominant effect on the hardness change, while the sliding distance also plays a role.
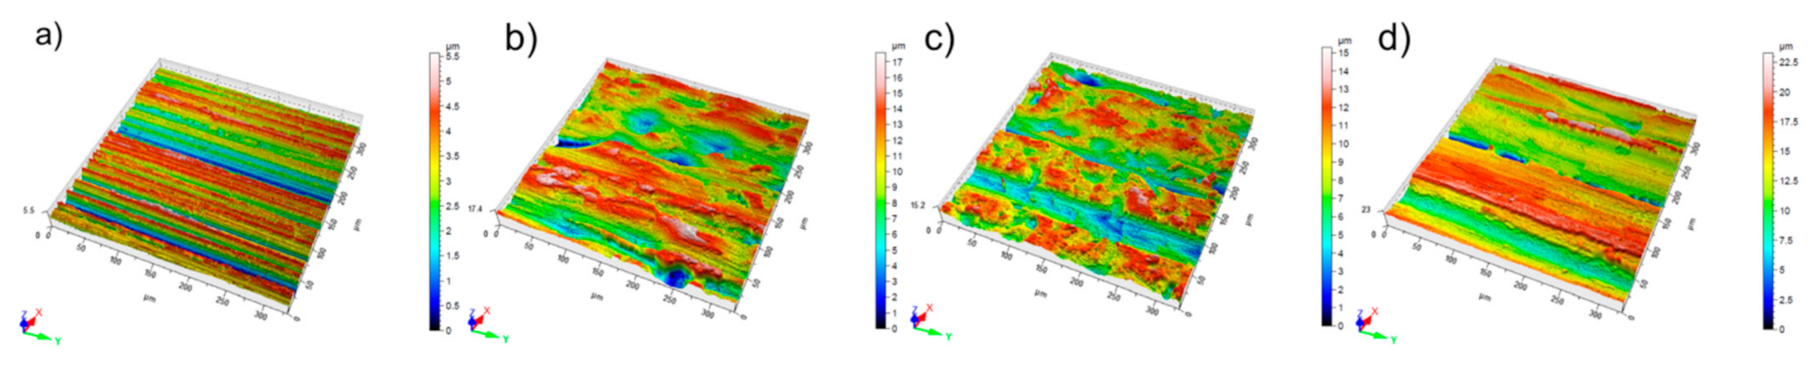
The effect of wear tests resulting in the most severe wear (P80 tests with 24.2 N) was studied on the change in surface roughness parameters. To investigate the change of the surface topography, white light optical microscopy was used.
Figure 10 shows the original 3D surface characteristics and their worn condition, and
Table 12 summarizes the roughness values.
All the materials suffered deformation, with material deposition to form new hills and valleys. The clearest grooves were identified on the MP material indicating a dominant micro-cutting effect with continuous chip generation and material removal. The groove depth values from
Figure 10 are in line with the measured wear from
Figure 7.
For the surface roughness parameters as dependent variables, multiple linear regression models were built, where the independent variables were sliding distance “s”, load “F
N”, and abrasive particle size “d”, besides the material properties and the indicators formed from them. According to this, the best fitting model for the change in Ra among the possible ones was
where the F-value of the model was 43 and
p < 0.001, which means the model is relevant. The coefficients of the model are summarized in
Table 13.
For this model, the goodness-of-fit is R2 = 0.493. The size of the abrasive in the experiment has the highest effect on the change in Ra of the worn surface, followed by the sliding distance. The effect of material parameters is negligible. Change in the Rz, Rt, Rp, Rv Rc, and Rq parameters follow the same trend, where the size of the abrasive particles has the highest effect on the change of the roughness parameter, followed by the sliding distance. However, the following surface roughness parameters showed different dominant dependence.
The best fitting model of the possible ones for the change in Rsm was
the model is relevant (F = 30 and
p < 0.001). The coefficients of the model are presented in detail in
Table 14.
For this model, the goodness-of-fit is R2 = 0.431. The size of the abrasive in the experiment has the highest effect on the change in Rsm of the worn surface, while the only material parameter with some effect is .
The best fitting model of the possible ones for the change in Rsk was
the model is relevant since the F-value was 53 and
p < 0.001. In
Table 15, the coefficients of the model are presented.
For this model, the goodness-of-fit is R2 = 0.645. In this case, the sliding distance in the experiment has the highest effect on the change of Rsk, among the material parameters has some effect. The size of the abrasive particle resulted in a minor effect.
The best fitting model among the possible ones for the change in Rku was
which is relevant (F = 86 and
p < 0.001).
Table 16 summarizes the coefficients of the model.
For this model, the goodness-of-fit is R2 = 0.658. The sliding distance in the experiment has the highest effect on the Rku of the worn surface and is the only material parameter with a significant, but mediocre effect.
According to the above-presented results it can be seen that besides the initial hardness and the Charpy impact strength the elasticity modulus and the tensile parameters play role in the change of surface parameters. These results are in line with the influence of applied loads on the micro-geometry. The micro-geometry of the moving steel surfaces under normal load suffers shear, bending, and compressive effects mainly, resulting in the appearance of plastic deformation, wedge formation, and micro-cutting [
57,
58].
Table 17 summarizes the findings on the discussed linear models with respect to the abrasive sensitivity for wear and the resulted surface roughness parameters. The factors that play role are presented in increasing order of effect.
3.3. Slurry Pot Test System
In the slurry-pot system, the material samples move in a slurry medium at four circumferential speeds and two angles of impact and suffer abrasive erosion on the surface. The different specimen positions modified the contact areas with the slurry due to the centrifugal action of the slurry flow. For adequate comparison of wear for different radii, the contact area (specimen area exposed to wear) has been taken into account, and the values were normalized accordingly.
Figure 11 shows the relative mass loss (%) as a function of sliding distance, where the initial mass was normalized with the specimen area exposed to wear. For a better comparison of the relative mass loss values, an extra vertical line is drawn at 60 km sliding distance for all radii. The standard deviation in the mass loss (%), including the repetitions, was below 0.1%. All materials showed a similar trend with a linear increase in wear. The relative wear of the specimen placed on radius 105 mm is an order of magnitude higher than the rest of the samples. Similarly, specimen mounted on radius 65 mm suffered severe wear, hence the effect of specimen orientation (angle of attack) had a more significant role on the wear severity than the difference in the radius (higher testing speed). This phenomenon could be explained by the effect of the centrifugal force on the slurry. The centrifugal force pushes the abrasive particles in a radial direction to the 45° oriented specimen surfaces, resulting in more severe material removal.
Despite the higher circumferential velocity of the slurry abrasive particles on radius 125 mm, less wear was recognized on these samples than on samples mounted on radius 85 mm (for the same orientation). This result can be attributed to the observed wear mechanisms. On specimen mounted on radius 125 mm significant pitting was also observed, except on the multiphase steel. Due to the custom design configuration of the slurry pot tester, both abrasion and erosion were co-existing. The material properties, the specimen radius, and orientation affected the wear mechanisms and the severity of the wear. In erosion literature, materials are classified as ductile or brittle based on the dependence of their erosion rate on the angle of impingement. Ductile materials have a maximum erosion rate at low angles (~15–30°), while brittle materials experience a peak erosion rate close to 90° [
59]. The tested materials are considered more brittle than ductile, except the retained austenitic multiphase steel due to its microstructure and lower hardness [
60]. The tests confirmed that the MP steel performed better against surface erosion, however suffered severe abrasion. As
Figure 11 shows, the mass loss curves of the MP steel are clearly over the mass loss of the martensitic materials in most cases. TM was the best performing in most of the cases, closely followed by FM material.
Overall, TM resulted in an average mass loss of 0.0753 (%/100 km), while FM experienced more severe wear (0.0815%/100 km). The least wear-resistant multiphase steel averaged 0.0881 (%/100 km) mass loss during the slurry pot tests. The hardness of the worn zone of the specimens was monitored during the slurry pot tests.
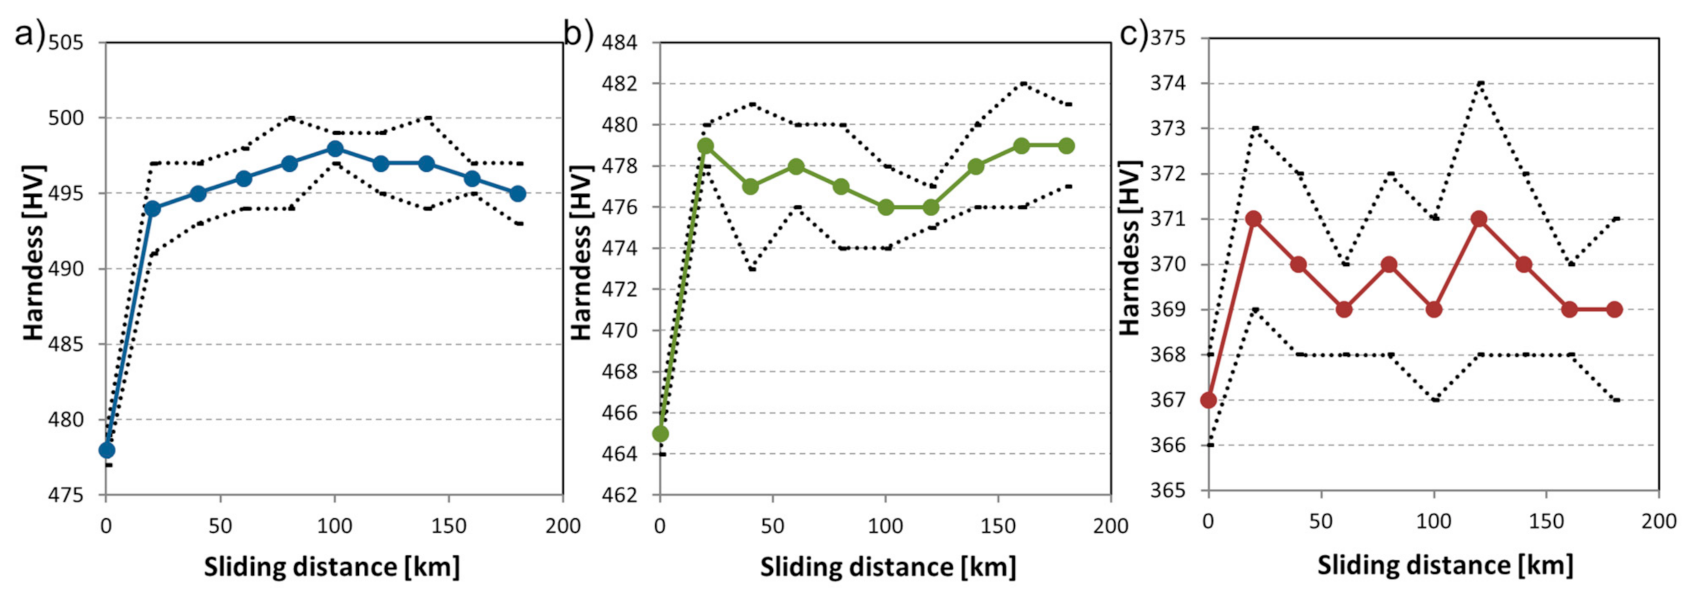
Figure 12 shows the hardness change of all tested materials in the function of the operating time.
The hardness gain was already present after the first 20 h of testing. The two best-performing martensitic materials experienced an average +15 HV hardness gain. The MP steel experienced only a minor hardening and a more significant material removal through abrasion mechanism.
Finally, similar analysis based on multiple linear regression models were carried out to study the sensitivity of material properties and test system parameters on the wear. The independent variables were the sliding distance “s”, the sliding velocity “v”, and the impact angle “α”; furthermore, the material properties and the indicators based on them. The mass loss is normalized (
) with the contact area to exclude the different areas of contact originating from the different radii. According to this, the best fitting model for the wear of the possible ones was
since F = 65 and
p < 0.001, it means the model is relevant. The coefficients of it are presented in
Table 18.
For this model, the goodness-of-fit is R
2 = 0.626. The sliding distance has the highest influence on the wear of the test sample, followed by the impact angle and the velocity. The effect of material parameters is negligible. The model confirmed the less dominant role of the impact velocity compared to the impact angle (as concluded from
Figure 11) in this test system.
The best fitting model among the possible ones for the hardness gain was
the model is relevant (F-value was 8959 and
p < 0.001). The coefficients of the model are presented in detail in
Table 19.
For this model, the goodness-of-fit is R2 = 0.996. From the material parameters had the highest effect on the hardness change. The compression strength and modulus () also played a role as well as the time of the experiment (sliding distance).
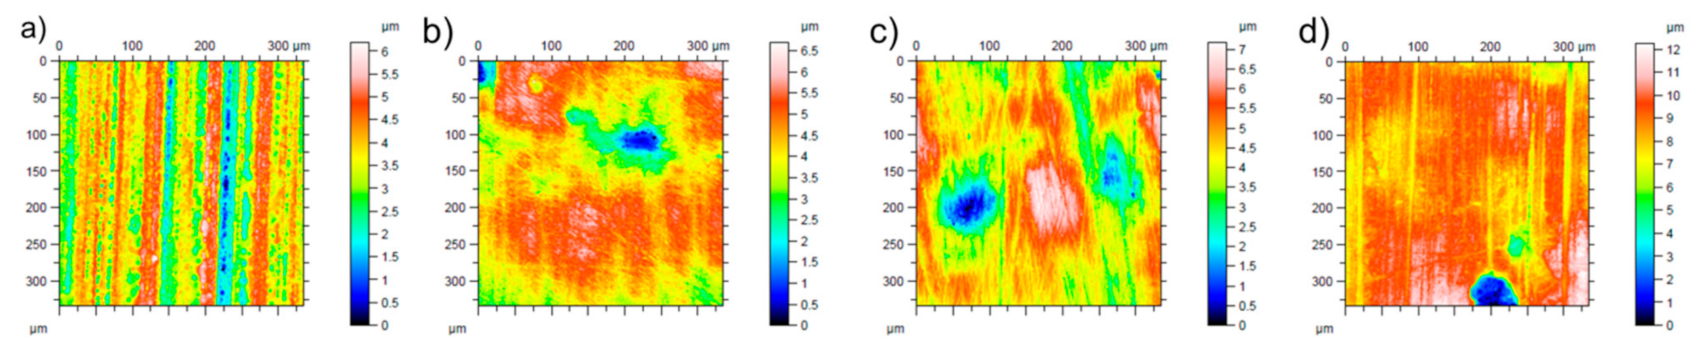
The change in the surface topography of the tested specimens was also investigated with an optical profilometer (
Figure 13). Before testing, the surface roughness parameters of all specimens were similar due to the same manufacturing process. After testing, surface roughness values, which are shown in
Table 20, of the specimen resulted in the most severe wear condition. The surface of the contact area roughened and also experienced minor pitting due to the abrasive erosion. TM material surface roughened most indicating a less effective material removal through abrasive polishing, which was confirmed by the mass loss plots (
Figure 11).
For all cases, the results are polished surfaces in different degrees with micro-cut grooves indicating abrasion, as well as co-existing micro-pits in different severity due to the abrasive erosion.
Similarly to the previous discussions, multiple linear regression models were evaluated to see the dependence of the surface roughness parameters on the duration of the test (sliding distance), the velocity of the test specimen, the contact angle, and the material properties. Since the roughness parameters of the examined materials have a high deviation, therefore for most of the models the goodness-of-fit varied in a large extent (between 0.27 and 0.72) and mostly, only one explanatory variable had a significant effect. Change in the surface roughness parameters of Ra, Rt, Rz, Rp, Rv Rc, Rq, and Rsm followed the same trend, where the sliding distance in the experiment has the highest effect on the change of the roughness parameter, e.g., the best fitting model among the possible ones for Rt was
the model is relevant (F = 83 and
p < 0.001).
Table 21 summarizes the coefficients of the model.
For this model, the goodness-of-fit is R
2 = 0.782. The sliding velocity in the experiment has the highest effect on the Rt. The effect of other parameters was negligible. However, the Rsk surface roughness parameter showed different results. The best fitting model among the possible ones for Rsk was
the model is relevant since F = 7 and
p < 0.001. The coefficients of the model are presented in
Table 22.
For this model, the goodness-of-fit is R2 = 0.401. The sliding velocity in the experiment has the highest effect on the Rsk of the worn surface followed by the sliding distance.
Table 23 summarizes the abrasive sensitivity for wear, hardness change, and the resulted surface roughness parameters based on the results of the above discussed linear models. The factors are presented in increasing order of effect.
4. Conclusions
This study investigated the abrasive wear behavior of newly developed martensitic and multiphase steels and enabled the ranking of them in different abrasion conditions. Three different test systems represented a broad range of the abrasion wear mechanism, simulating different material responses to the complex appearance of abrasion in the targeted wear parts. Comparing the test systems, the tested materials ranked similarly based on their wear performance, however in each configuration, the dominant variable of the wear mechanism differed.
The significance and contributions of test parameters, extended material properties, and the dimensionless features formed from them were investigated on the wear behavior and the surface deformation. Correlation between parameters was obtained by multiple linear regression models.
In terms of wear resistance, the tempered martensitic steel performed best across all the investigated test systems, closely followed by the fresh martensitic structured material. The multiphase steel resulted in the most severe material loss.
- -
The normal load was the driving factor in the material removal in the abrasive scratch tests, followed by the sliding distance. The dimensionless number had a mediocre effect, while the indenter tip radius had a slight influence on the wear mechanism.
- -
The dominant variable affecting the surface topography of the materials in the scratch tests was found to be the normal load, followed by the tip radius. However, sensitivity to the material’s compression properties , was found in case of groove depth and groove area. The width of the scratch was influenced by the parameter .
- -
In the abrasive pin-on-disc test system, the sliding distance and the abrasive particle size were found to be dominant on the wear severity, followed by the normal load. From the material parameters had a slight effect.
- -
Considering the worn surface topography, the particle size was found to be the dominant shaping factor followed by the sliding distance. The effect of on the microgeometry was clear in the case of the parameters Rsm and Rsk.
- -
Considering the hardness change, the parameter was found to have a significant effect, the model describing the hardness change resulted an R2 value of 0.994.
- -
Proportional relations between the wear values of the materials and the dimensionless numbers of , as well as were established in case of the most severe wear testing conditions (P80, 24.2 N).
- -
There are reciprocal relations between values , , , and the wear of the materials. Increasing these dimensionless number values resulted in lower wear.
- -
In the slurry pot test system, the sliding speed and the impact angle was found to have a significant effect on the wear, followed by the sliding distance. The effect of material factors was negligible in this case.
- -
Considering the surface deformation, only the sliding distance appeared to have a significant effect on the worn surface topography.
- -
Specimen experienced hardening of the abraded contact surface, which remained approximately constant afterward. Sensitivity analysis proved that for the hardness gain, the variable had a significant influence. The material’s compression properties (, ) were also found to have an effect.
Mathematical models were developed based on experimental results in different complexity test systems to determine the relationship between the wear, change of surface parameters and the test variables, material properties, and dimensionless features formed from them. This investigation aids the design of an optimized tribo-system by enabling the prediction of the wear process in complex abrasive environment for the investigated steels.


 ,
, 


