Review

Refractory Metal (Nb) Intermetallic Composites, High Entropy Alloys, Complex Concentrated Alloys and the Alloy Design Methodology NICE—Mise-en-scène Patterns of Thought and Progress

by
Panos Tsakiropoulos
Department of Materials Science and Engineering, Sir Robert Hadfield Building, The University of Sheffield, Mappin Street, Sheffield S1 3JD, UK
Mise-en-scène: Putting on stage.
Materials 2021, 14(4), 989; https://doi.org/10.3390/ma14040989
Submission received: 11 January 2021 / Revised: 10 February 2021 / Accepted: 16 February 2021 / Published: 19 February 2021

Abstract

:
The paper reflects on the usefulness of the alloy design methodology NICE (Niobium Intermetallic Composite Elaboration) for the development of new Nb-containing metallic ultra-high-temperature materials (UHTMs), namely refractory metal (Nb) intermetallic composites (RM(Nb)ICs), refractory high entropy alloys (RHEAs) and refractory complex concentrated alloys (RCCAs), in which the same phases can be present, specifically bcc solid solution(s), M5Si3 silicide(s) and Laves phases. The reasons why a new alloy design methodology was sought and the foundations on which NICE was built are discussed. It is shown that the alloying behavior of RM(Nb)ICs, RHEAs and RCCAs can be described by the same parameters. The practicality of parameter maps inspired by NICE for describing/understanding the alloying behavior and properties of alloys and their phases is demonstrated. It is described how NICE helps the alloy developer to understand better the alloys s/he develops and what s/he can do and predict (calculate) with NICE. The paper expands on RM(Nb)ICs, RHEAs and RCCAs with B, Ge or Sn, the addition of which and the presence of A15 compounds is recommended in RHEAs and RCCAs to achieve a balance of properties.

1. Introduction

The targets given to the aerospace industry by international regulatory authorities regarding the environmental impact (noise, emissions) of aircraft in the future could be met with changes in airframes and aeroengines. The contribution of the latter to meet the targets is the reduction of CO2 by 30% and of the NOx certification metric by 75% [1]. New materials are considered necessary to manufacture components that would enable critical parts of future aeroengines to operate at significantly higher temperatures (≥1850 °C) than those currently possible in high-pressure turbines (HPT) where coated and internally cooled single crystal Ni-based superalloy blades are used with turbine entry temperatures (TETs) not exceeding 1600 °C. In other words, there is a need for ultra-high-temperature materials (UHTMs) with capabilities beyond those of Ni-based superalloys [1,2,3].
The UHTMs must comply with specific property goals about creep, fracture toughness and oxidation. These goals are as follows: (a) for material density ρ = 7 g/cm3 the creep strength should be greater than 170 MPa at a creep rate of 2 × 10⁻⁸ s−1 at 1200 °C, (b) the fracture toughness of critical components should be ≥20 MPa√m and (c) the recession rate due to oxidation should be less than 0.25 μm/h at 1315 °C (to attain the oxidation life at 1315 °C of 2nd generation single crystal Ni-based superalloys at 1150 °C) [1,4]. The toughness goal requires the UHTMs to show some degree of metallic behavior to distinguish them from ceramic UHTMs. The latter is not considered in this paper.
Refractory metal intermetallic composites (RMICs), refractory (metal) high entropy alloys (RHEAs), and refractory (metal) complex concentrated alloys (RCCAs) proffer a paradigm for advanced metallic UHTMs to replace Ni-based superalloys [3]. RMICs include Nb-silicide-based alloys (RM(Nb)ICs) and Mo-silicide-based alloys (RM(Mo)ICs). The latter are not considered in this paper. The Nb-silicide-based alloys are referred to as RM(Nb)ICs from now on in this paper.
The paradigm about advanced metallic UHTMs is shared by the members of the international materials science and engineering community. Research on RMICs started in the 1990s and on RHEAs and RCCAs in 2010. The early research on RM(Nb)ICs originated in the USA, resulted in numerous patents, e.g., [5,6] and reviews of the processing, microstructure and properties of alloys, e.g., [2,4] and was followed with individual, national and international research programs in Europe, South America, Asia, the Far East and Russia. Research on RHEAs and RCCAs is nowadays ongoing in almost all parts of the world. Since the reviews on RM(Nb)ICs in early 2000, new research has addressed the alloying behavior and properties of RM(Nb)ICs and their phases. Since 2018, this research was published in [7,8,9,10,11] and was reviewed by the author in [1,3] and also resulted in a new patent [12]. Research on RHEAs and RCCAs was reviewed in 2018 in [13]. Lately, the RHEAs and RCCAs that were reviewed in [13] were compared with RM(Nb)ICs in [3]. Research on RM(Mo)ICs originated in the USA in the 1990s and resulted in patents, e.g., [14,15] and reviews, e.g., [16,17,18].
Alloys with refractory metal (RM) additions that satisfy the “standard definition” of HEAs as well as alloys where the higher or lower concentration of elements is above or below 35 and 5 at.%, i.e., the upper and lower limits in the “standard definition”, are designated, respectively RHEAs (elemental concentrations are in the range 35–5 at.%) and RCCAs (elemental concentrations can be >35 and <5 at.%) [13]. Some RM(Nb)ICs are also HEAs; others are also RHEAs or RCCAs, e.g., [1,3,19,20,21]. Not all RM(Nb)ICs are HEAs, RHEAs or RCCAs [1,3].
As many as twenty-three and twelve alloying elements have been reported, respectively in RM(Nb)ICs, and RHEAs or RCCAs, albeit not all in the same metallic UHTM, namely Al, B, C, Ce, Cr, Dy, Er, Fe, Ga, Ge, Hf, Ho, In, Mo, Nb, Si, Sn, Ta, Ti, V, W, Y, Zr, where underlined and in italics are the elements that can be found in the chemistry, respectively of RHEAs or RCCAs [1,3,13] and “state of the art” Ni-based superalloys for blade applications. Has realism been increasingly unrealistic in some research? Is Cervantes’s saying “paciencia y barajar” (“have patience, and keep shuffling the cards”) (keep shuffling the elements in our case) endorsed by researchers? How can one design/select metallic UHTMs to meet the property goals? How can one decide which elemental additions and concentrations are appropriate in a metallic UHTM? Are all (or which of) the aforementioned elements essential to meet the property goals? Which of these elements are the key ones to achieve a balance of properties? Are the challenges in alloy design/selection that arise from (i) the lack (and often disagreement) of thermodynamic data for key binary and ternary systems [1,3], (ii) the sensitivity of elemental additions and alloys to interstitial contamination [3,13] and (iii) the pest oxidation phenomenon [1,3], and the scale-up of alloy production and confirmation/reproducibility of results produced from small buttons [3] overlooked (disregarded, ignored)?
The RM(Nb)ICs are multiphase alloys with microstructures that consist of intermetallic(s) (M3Si and M5Si3 silicides (M = RM and/or transition metal (TM)), C14 Laves phase and A15 compounds) with/without bcc solid solution(s) [1,3]. The RHEAs and RCCAs can be (a) single-phase bcc solid solution, (b) two (or more?) solid solutions (of same or different crystal structure), (c) mixture of solid solution(s) and intermetallic(s) (Laves and M5Si3 silicide(s?)) [13]. The early research associated HEAs, RHEAs, and RCCAs with (a), the subsequent research revealed that the microstructure of some as produced single-phase solid solution alloys can change to (b) or (c) at elevated temperatures or that RHEAs and RCCAs can be produced with (b) or (c). Some of the aforementioned elements are added (i) in RM(Nb)ICs to suppress pest oxidation, increase oxidation resistance at high temperatures and suppress scale spallation, increase toughness, increase room, intermediate and high-temperature strength and decrease creep deformation [1,3,19] and (ii) in RHEAs and RCCAs to improve oxidation or room and high-temperature strength [3,13] (currently there is no data about the toughness and creep properties of RHEAs and RCCAs).
Einstein asserted that scientific research requires imagination, which often takes visual forms [22] that can become the starting points for some work. RM(Nb)ICs, RHEAs and RCCAs share the same alloying additions, and the parameters δ, Δχ, VEC, ΔHmix, ΔSmix and Ω (= TmΔSmix/∣ΔHmix∣) (see Appendix A) describe their alloying behavior as they do for HEAs [1,3,8,13,23]. The values of these parameters for bcc solid solutions, metallic UHTMs and HEAs overlap (Table 1). There are visual equivalents that can be used to explain the alloying behavior of alloys and their phases. The alloy design methodology NICE [1] (Niobium Intermetallic Composite Elaboration) has made it possible to construct such visual forms, namely maps based on the aforementioned parameters. Indeed, RM(Nb)ICs, RHEAs and RCCAs not only share common alloying elements, but they also share “common ground in parameter maps” [3,24,25]. Maps of aforementioned parameters, for example δ versus ΔHmix or ΔSmix, have been produced in studies of phase stability in HEAs and to compare the latter with bulk metallic glasses (BMGs).
In this paper, I reflect on the utility of NICE to design and develop new metallic UHTMs with Nb one of the alloying additions, drawing on my recent publications [1,3,7,8,9,10,11] and, where it is appropriate, on papers that I have co-authored with members of the research group. I discuss (i) why a new alloy design methodology was sought for metallic UHTMs and the foundations on which NICE was built, (ii) how NICE helps one to understand better the alloys s/he develops, and (iii) what one can do and predict (calculate) with NICE. In this paper, I do not cover the processing, oxidation and fracture toughness of metallic UHTMs, about which the interested reader could refer to [3]. In addition, I do not compare the properties of RM(Nb)ICs with those of the RHEAs and RCCAs that were reviewed by Senkov et al. in [13]; an interested reader could consult the ref [3]. However, in this paper, I expand on RM(Nb)ICs with B, Ge or Sn additions, some of which are also RHEAs and RCCAs [19], and in doing so, I confirm that the above elements are key additions in RHEAs and RCCAs to achieve a balance of properties.
In this paper, my approach to the subject matter is to provide a brief coverage/review of the alloying of RM(Nb)ICs (discussed in the refs [7,8,9,10,11] that dealt closely with issues that pertain to the alloys and their phases) and to show how my ideas that were instigated from these studies, despite their having been conceived and organized separately over many years, converged and were unified in NICE [1] to give a perspicuous and straightforward account of a new alloy design methodology that is useful both for RM(Nb)ICs and for RHEAs and RCCAs [1,3,19,20,21,24,25]. I use this opportunity to draw attention to RM(Nb)ICs and RCCAs with B, Ge or Sn additions and expand on the data presented in [1,3,7,8,9,10,11] and, most recently, in [19,26]. The structure of the paper is as follows: First, we return to the alloying behavior of metallic UHTMs and their phases, then an overview of properties of alloys and phases and of relationships between alloys and their phases is given, and finally, the alloy design/selection methodology NICE is revisited.

2. Alloying Behavior of RM(Nb)ICs, RHEAs and RCCAs and Their Phases

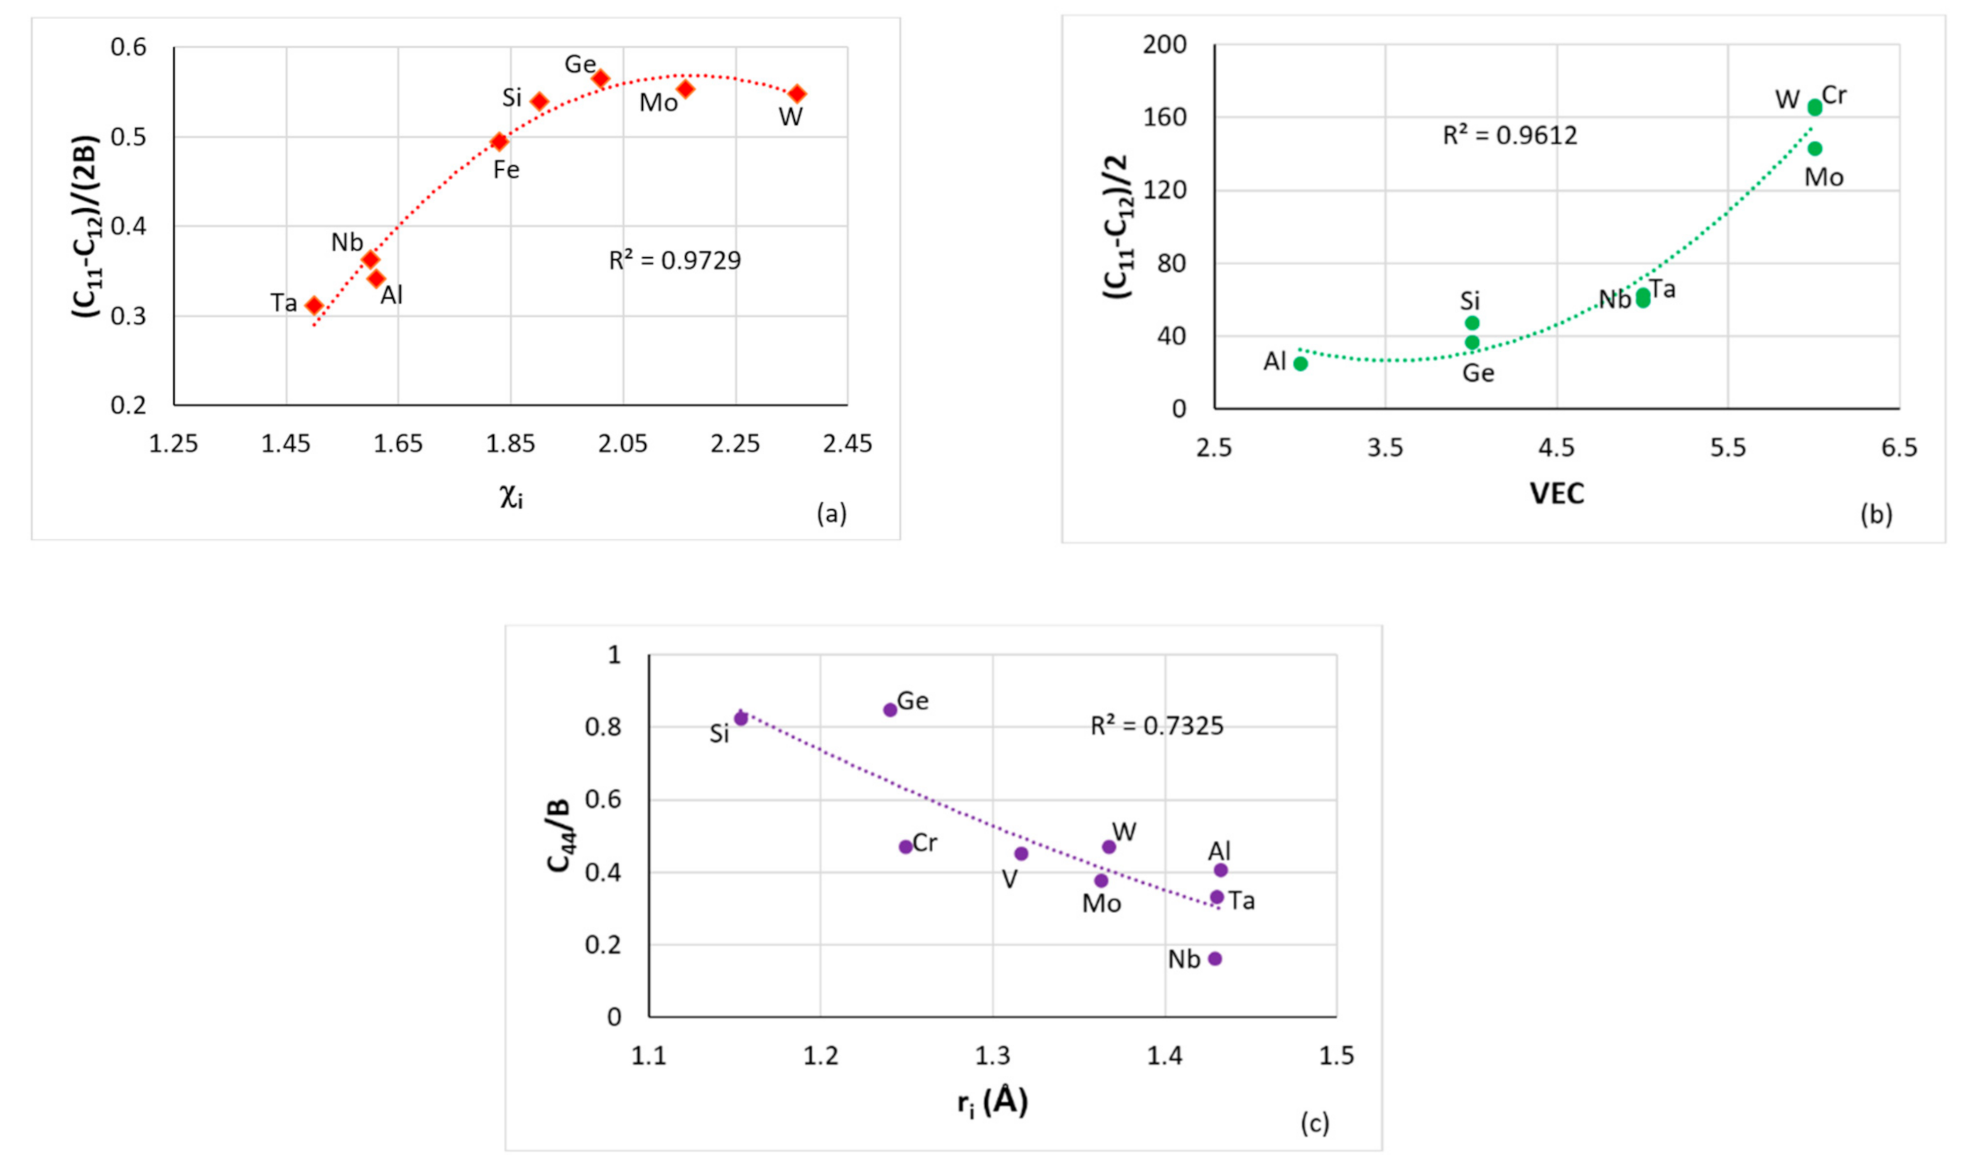
Alloying elements mentioned in the previous section fall in different groups in plots (a) of diffusivity versus atomic size ri or Pauling electronegativity χi [7], (b) of functions of elastic constants Cij (e.g., the Zener anisotropy constant) versus ri or χi or the number of valence electrons per atom filled into the valence band (VEC) [8] (see also Figure 1) and (c) of Young’s modulus versus ri or χi [8]. Remarkably, in (a) and (c), where B is included in the data, the B always belongs in specific groups with/without the elements Al, Cr, Ge, Hf, Si, Sn, Ti and with/without RMs [7,8]. The elements Al, B, Cr, Ge, Hf, Si, Sn, Ti are key additions for improving the oxidation resistance of RM(Nb)ICs, meaning suppressing pest oxidation and improving oxidation resistance at high temperatures [1,3], and suppressing scale spallation [1,3,19,20,21,25,26]. To the author’s knowledge, additions of B, Ge or Sn have not been reported in RHEAs, and RCCAs studied to date and were not reported for the RCCAs reviewed in [13], but they have been used only in RM(Nb)ICs some of which are also RHEAs or RCCAs, e.g., [3,19,20,21,25]. We return to these three elements as alloying addition(s) in metallic UHTMs below in this section and in the following sections.
Figure 1 shows plots of elastic constants Cij, shear modulus G and bulk modulus B versus atomic size ri, Pauling electronegativity χi and VEC of cubic (Figure 1a,d) and hexagonal (Figure 1d) symmetry elements. Note that Fe currently is not used as elemental addition in RHEAs or RCCAs [13] and that in Figure 1a the group and R2 value do not significantly change if Fe were to be excluded. In Figure 1d, note (i) that the elements Hf, Nb, Mo, W or Hf, Ti, Al, Cr, Si, Ge could be grouped together (see Figure 1e), (ii) that the latter six elements improve oxidation resistance in RM(Nb)ICs [1] as well as in RM(Nb)ICs that are also RCCAs [3,19,26,27] and suppress pest oxidation [27], (iii) that the former four elements are key additions (a) in RM(Nb)ICs for bcc solid solution strength and alloy strength [3] and for meeting the creep goal [3,12] and (b) in RCCAs for enhanced strength [3,13] and for improved oxidation resistance when added together with Al, Cr, Ti and Si [13]. Recently, our research group suggested that RM(Nb)ICs, RHEAs and RCCAs of the Nb-Mo-W-Ti-Cr-Hf-Al-Ge-Si-Sn system are worthy of development owing to their promise to meet property goals and/or offer a balance of properties [19]. Such metallic UHTMs could be protected by environmental coatings (ECs) of the bond coat (BC)/thermally grown oxide (TGO)/top coat (TC) type with BC consisting of αAl2O3 scale forming HEAs of the Nb-Ti-Si-Al-Hf system [19,20,21] (compatible with the metallic UHTM substrate) with/without αAl2O3 or Cr2O3 and SiO2 scale forming Si-rich intermetallic alloys of the Al-Cr-Fe-Nb-Si-Ti system [28] that are also compatible with the aforementioned HEA BC [28,29]. We return to ECs for metallic UHTMs in Section 5.
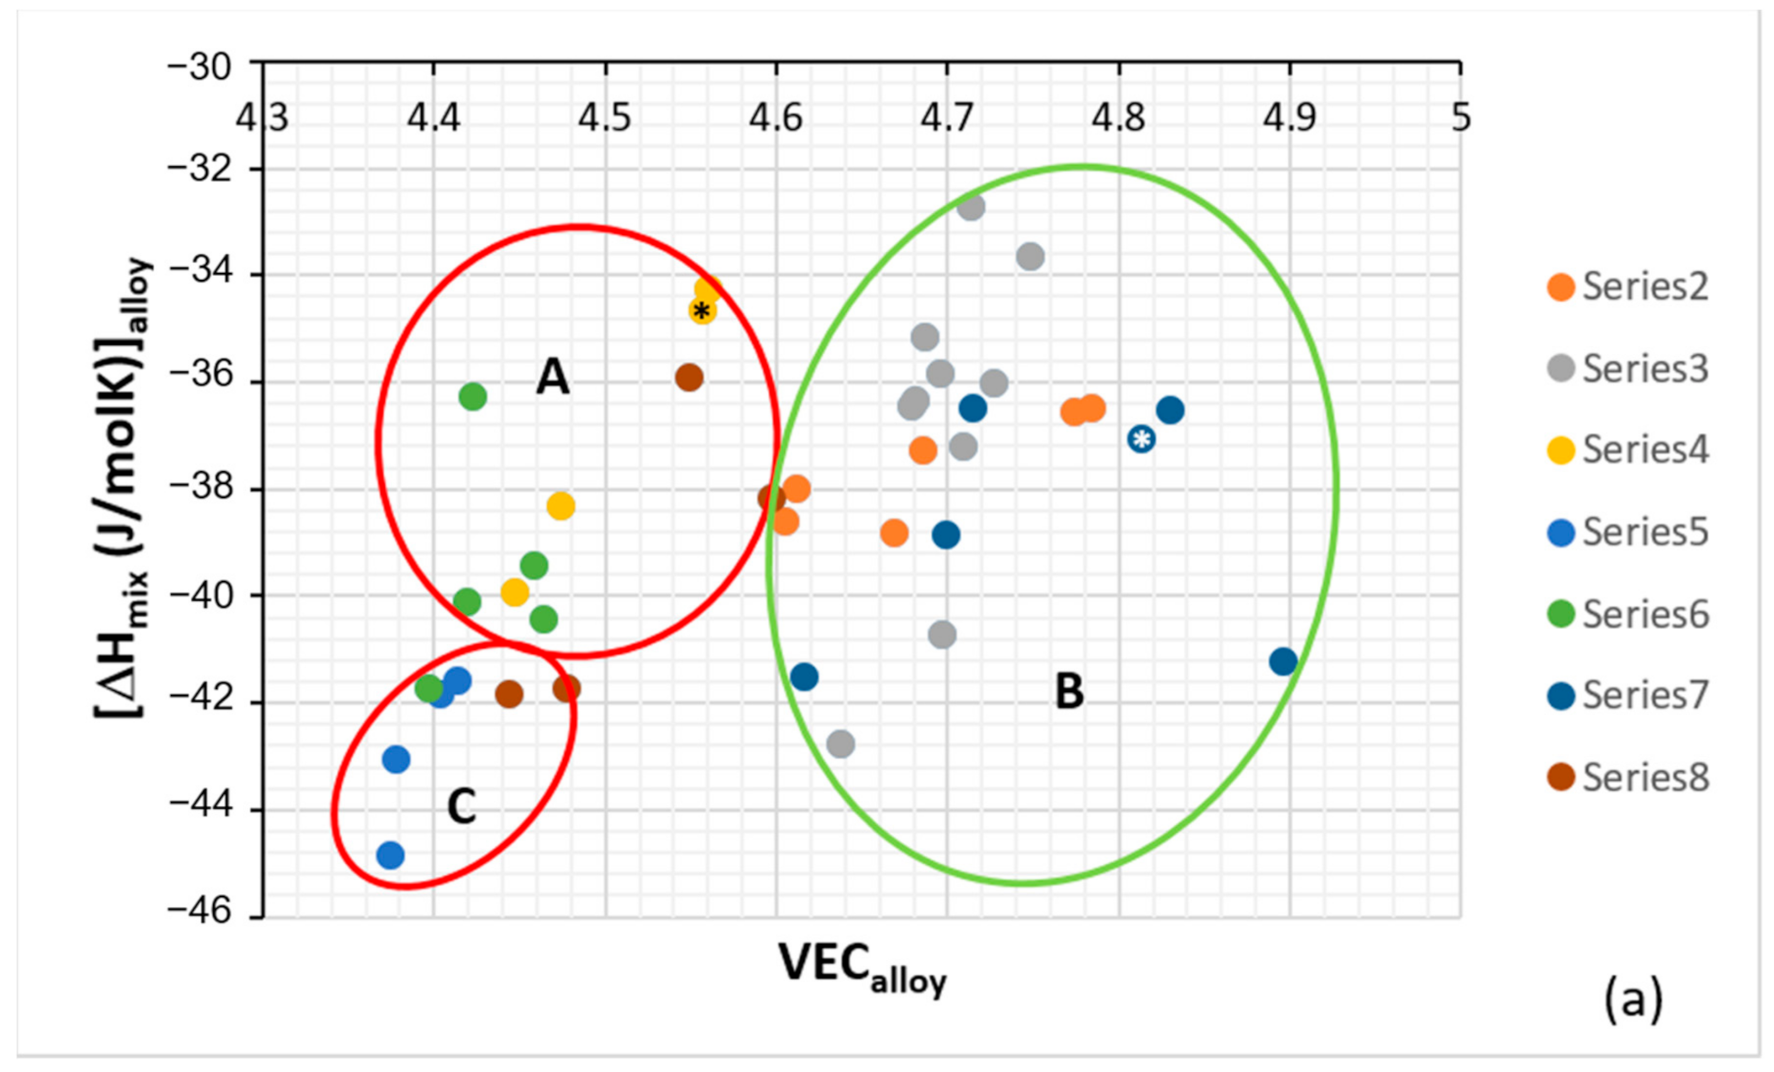
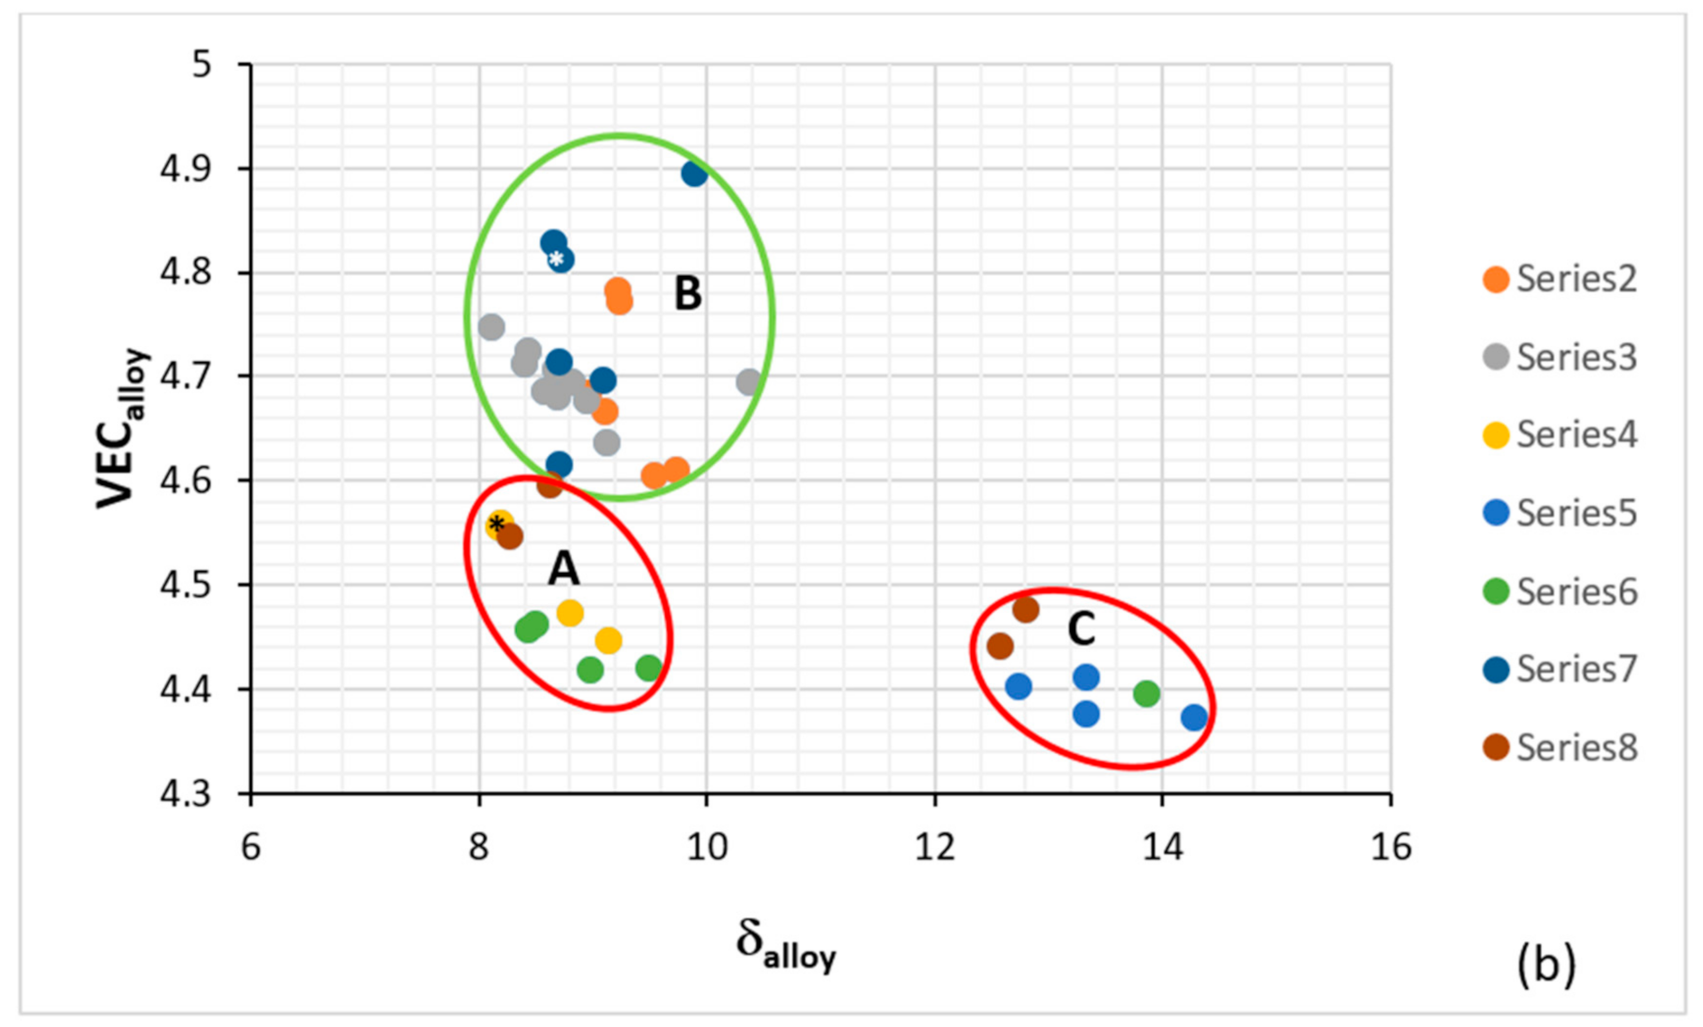
Metallurgists have used atomic size, electronegativity, the heat of mixing ΔHmix, the entropy of mixing ΔSmix and VEC to study alloys prior to HEAs, for example, for the study of rapidly solidified (RS) alloys and metallic glasses. The role of the researcher is not so much to collect and analyze data as to bring “trained judgment” to bear on the data. One often needs to capture similarities as well as differences (s) in his/her data. Consideration (i) of the alloying behavior of RM(Nb)ICs using the same parameters, namely Δχ (based on Pauling electronegativity), δ (based on atomic size), VEC, ΔHmix, ΔSmix, Ω that are used (1) for the study of HEAs [23] and (2) to compare the latter with BMGs, e.g., [30], and (ii) of the (a), (b) and (c) in the first paragraph of this section and Figure 1, necessitated scrutiny of our work from a new perspective. We did not just consider “what do these parameters refer to?” but “how do we use these parameters?” what roles may possibly have in alloy design and how these roles change, overlap, and can be shown/demonstrated. This experience confronted me with new ways of interpreting our work that exceeded the limits of what can be perceived and visualized in familiar terms and made possible (A) the classification of the RM(Nb)ICs (and RCCAs) in groups, (B) new ways of presenting data (Figure 2, also see [8] and Figure 19 in [3]), and (C) the comparison of RM(Nb)ICs with RCCAs [3] and with HEAs and metallic glasses (Table 1). To sift and assess raw data required some form of visual representation and thus an element of informed subjectivity. After assessing the data, it was decided to separate all the alloys with boron addition, and in doing so, it was discovered that these alloys formed a separate group (group C) in parameter maps, see Figure 2. This then steered scrutiny of the data of the boron-free alloys, and in doing so, it was discovered that alloys that meet or have the potential to meet the creep property goal could form a separate group (group B) in parameter maps, see Figure 2. The grouping of alloys shown in Figure 2 considered RM(Nb)ICs based on the alloys KZ5, and YG8 with nominal compositions, respectively Nb-24Ti-18Si-5Al-5Cr [31] and Nb-20Si-5Hf-5Mo-3 W [32], of which the former meets the toughness goal, and the latter is close to meeting the creep goal [3,12], with additions of other TMs, RMs and simple metal (SM) and metalloid (Met) elements.
Remarkably, (a) groups A and B in Figure 2 fall within the areas occupied by RCCAs in similar maps, for example, the Δχ versus δ map in Figure 19 in [3] (otherwise stated, the RHEAs and RCCAs include some RM(Nb)ICs), (b) oxidation-resistant metallic UHTMs can be found in all three groups A, B and C in Figure 2 and (c) some of the RM(Nb)ICs in group C are also RHEAs and RCCAs (see below and following sections) with exceptional oxidation resistance [3]. In essence, (i) the alloying behavior of RM(Nb)ICs, RHEAs and RCCAs can be presented in Δχ versus δ, ΔHmix versus VEC and VEC versus δ maps and (ii) there are RHEAs and RCCAs with B, Ge or Sn addition that are also RM(Nb)ICs [1,3,19] (or to put it in another way, some RM(Nb)ICs with B, Ge or Sn addition can also be RHEAS and RCCAs).
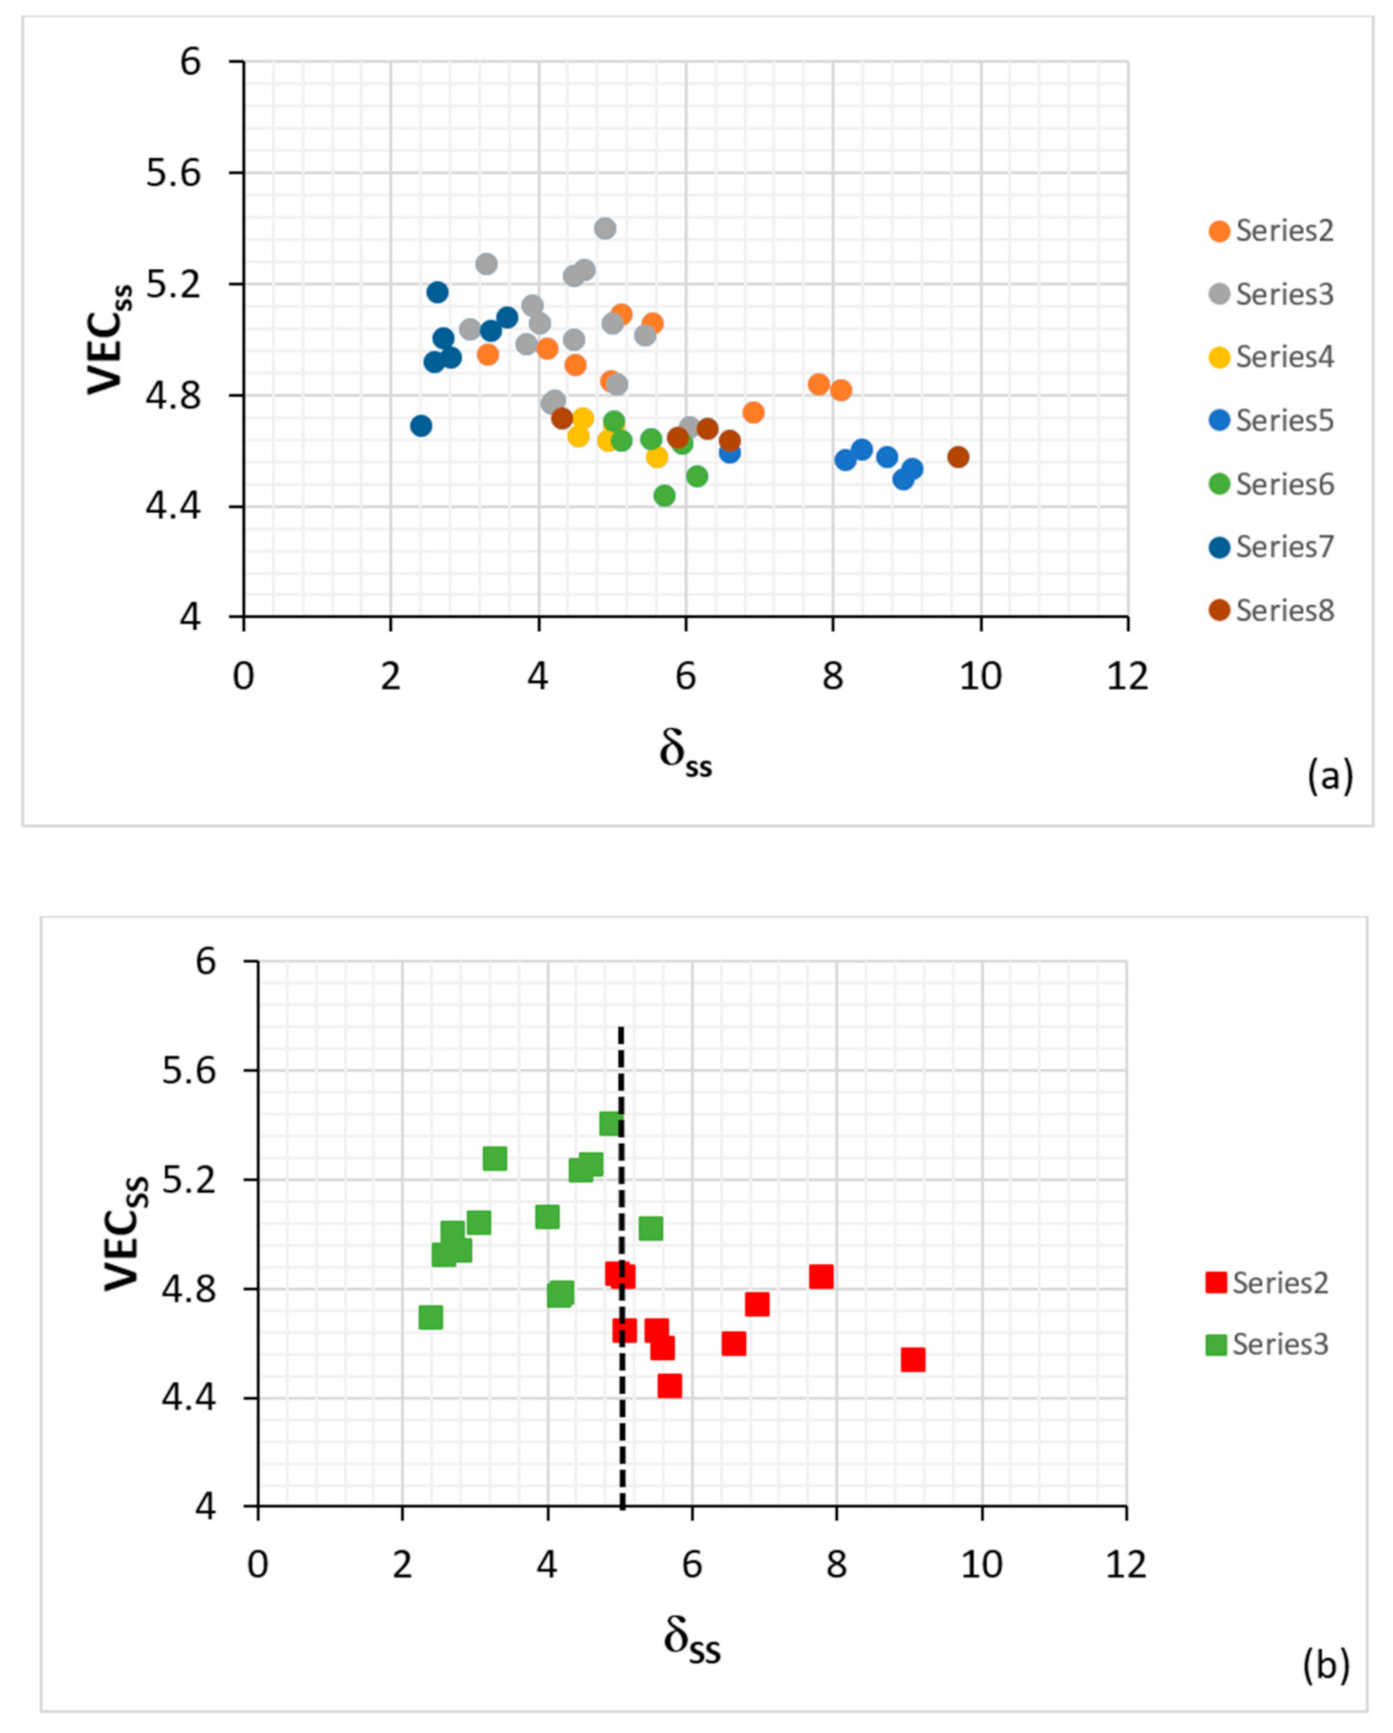
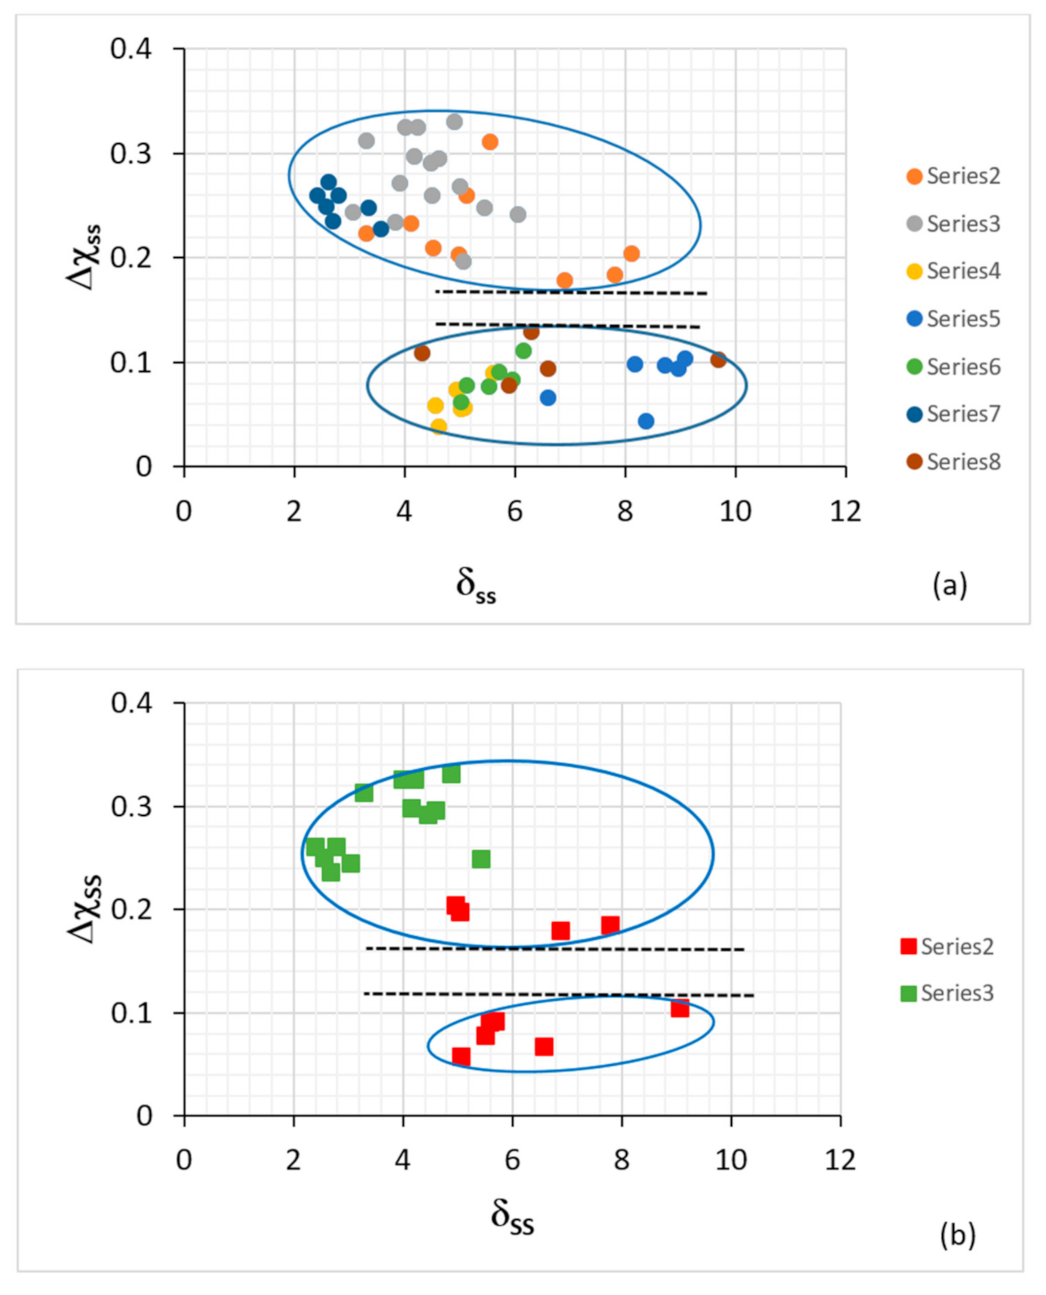
If the alloying of metallic UHTMs can be described using the parameters Δχ, δ, VEC, ΔHmix, ΔSmix, Ω, why the phases that are present in the microstructures of these materials were not studied using these parameters before the publication of [7,9,10,11]? A reasonable answer is that it is partly a matter of where researchers “point their instruments” to collect data and partly a matter of what they instructed their instruments to find for them. In our research group, we used reliable quantitative chemical analysis data (EPMA and EDS with standards) for RM(Nb)ICs and their phases and created maps for their bcc solid solutions (Figure 3) [7,8,9,10,11]. In RM(Nb)ICs, three types of bcc Nb solid solution (Nbss) can form, namely “normal” Nbss, Si-free Nbss and Ti-rich Nbss [7]. In RCCAs, one or more solid solutions can form [13]. The Ti-rich Nbss is observed in as-cast (AC) RM(Nb)ICs. Figure 3a shows the VECss versus δss map for all the bcc solid solutions in AC and heat-treated (HT) RM(Nb)ICs (the chemical compositions of the solid solutions in this figure were given in table 1 in [7]) and would suggest that VECss decreases as δss increases, like the parameter (ΔHmix)ss in the (ΔHmix)ss versus δss map [3,7]. Figure 3b shows that the Si-free Nbss has δss less than approximately 5, which is also the case in the (ΔHmix)ss versus δss map for RM(Nb)ICs [7], whereas the solid solutions of RCCAs have 4 < δ < 6 [3]. The parameter Δχss would suggest that there exist no bcc Nb solid solutions in RM(Nb)ICs for 0.13 < Δχss < 0.18 (Figure 4a), and that the Si-free Nbss has Δχ > 0.24 (Figure 4b). The same gap exists in the case of solid solution RCCAs [3], and there is also a gap in the Δχ values of eutectics with Nbss and Nb5Si3 [11]. Are these gaps “real” or just “an upshot of the available experimental data”? My response to this question is as follows: “There is actually a certain value in not finding data in some part of a map, in other words in having gaps in parameter values. They are some of those areas where the absence of evidence currently is evidence”.
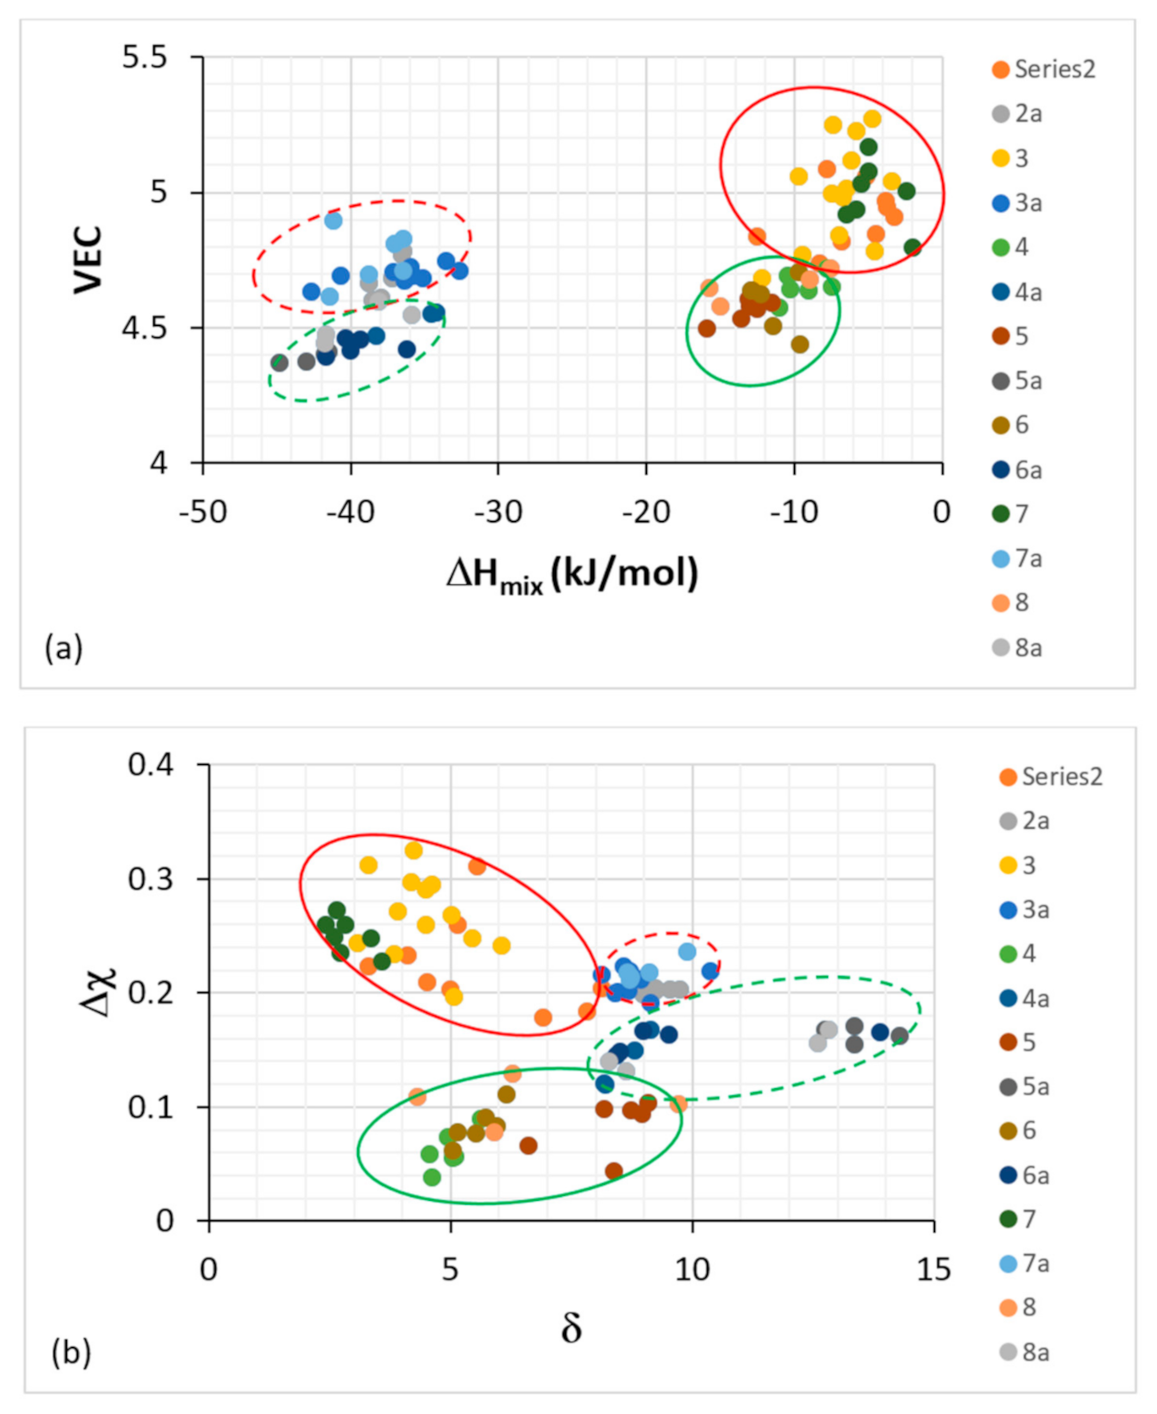
The alloys and their solid solutions can also be presented together in maps of the aforementioned parameters [8], and they can be separated into distinctly different groups in VEC versus ΔHmix, Δχ versus δ (Figure 5), and Δχ versus ΔHmix and Δχ versus Ω maps [8] in which the B-containing alloys and solid solutions occupy separate groups. Basically, (i) the alloying behavior of solid solutions in RM(Nb)ICs, and solid solution RHEAs and RCCAs can be presented in Δχ versus δ, Δχ versus VEC, ΔHmix versus δ and VEC versus δ maps [1,3] and (ii) the data includes solid solutions in RM(Nb)ICs with B, Ge or Sn addition that are (the alloys) also RHEAs and RCCAs [1,3,19,26].
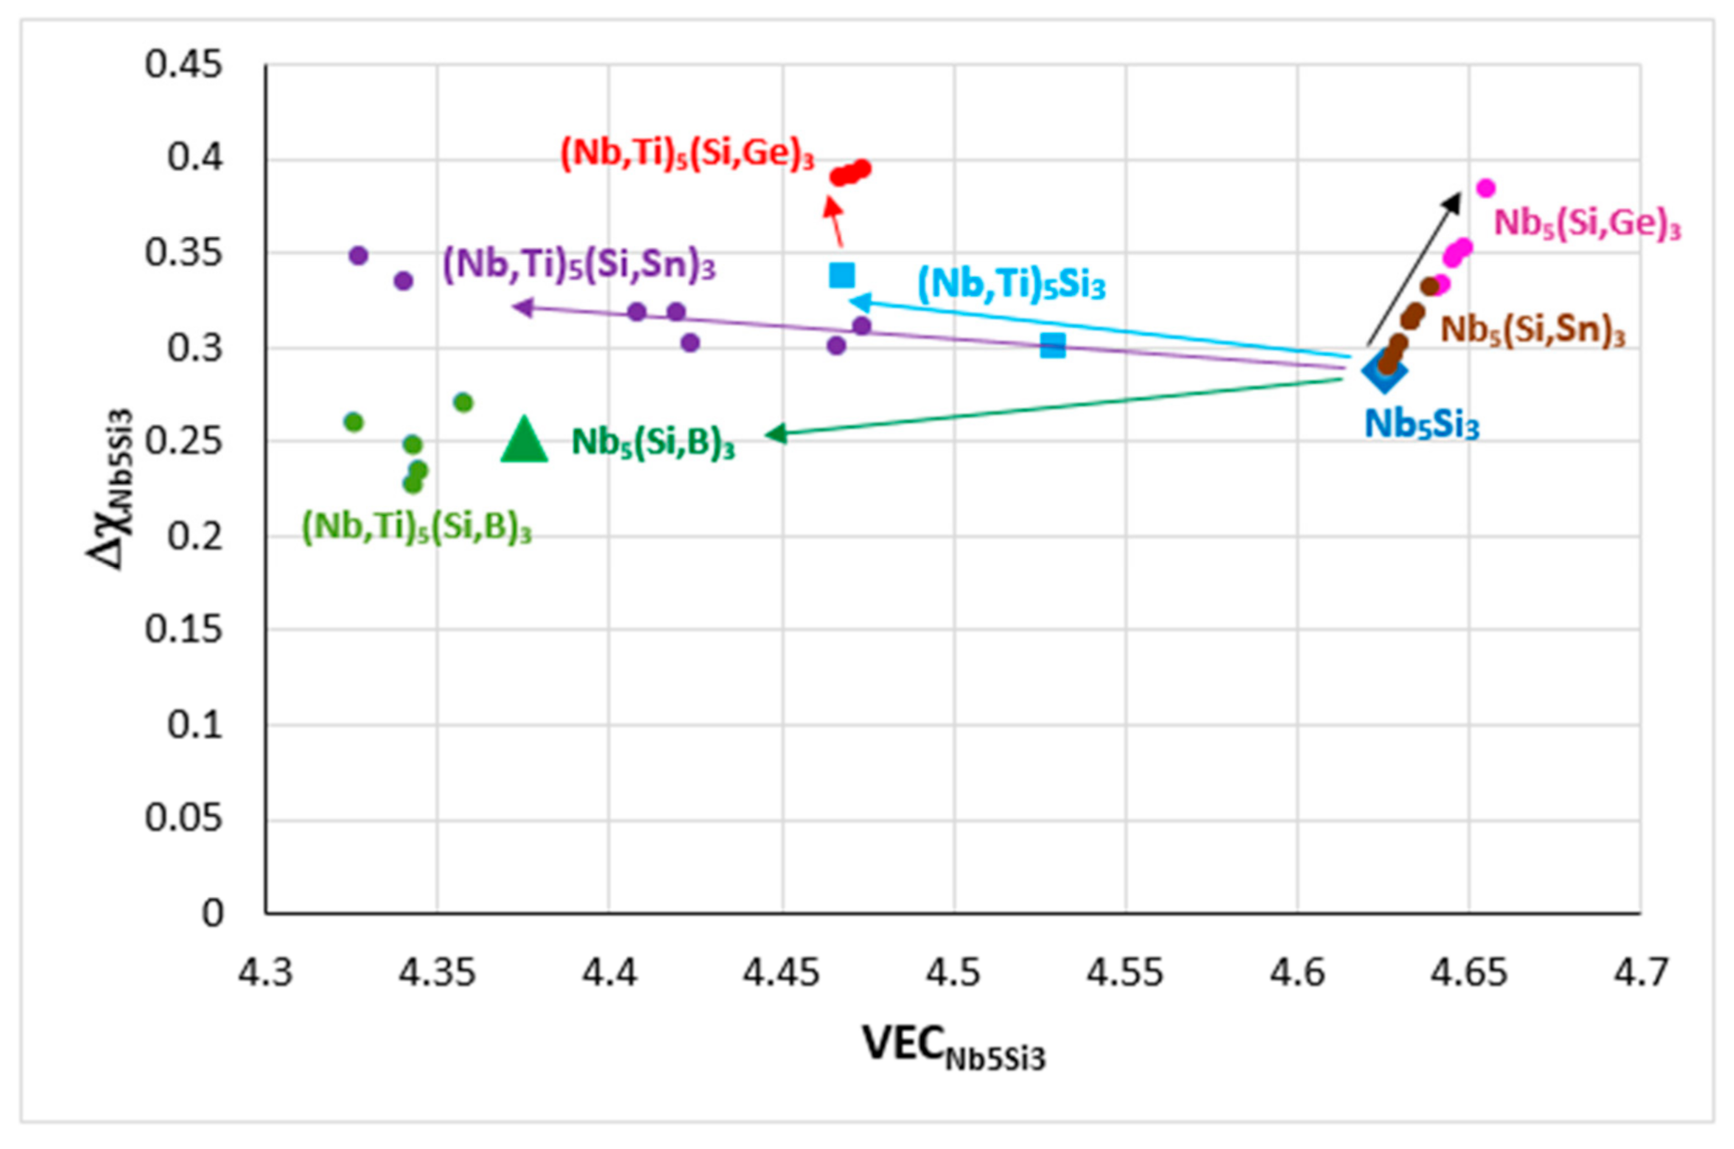
The alloying behavior of Nb5Si3 is shown in Figure 6. The substitution of Si by Sn in Nb5(Si,Sn)3 increases both VEC and Δχ, these parameters increase further when Si is substituted by Ge in Nb5(Si,Ge)3 (shown by the black arrow in Figure 6), whereas the substitution of Si by B in Nb5(Si,B)3 has the opposite effect, causing a significant decrease of VEC and a small decrease of Δχ (shown by the green arrow). The substitution of Nb by Ti in the silicide decreases VEC and slightly increases Δχ in (Nb,Ti)5Si3 (blue arrow) and the changes of VEC and Δχ are enhanced in (Nb,Ti)5(Si,Ge)3 and (Nb,Ti)5(Si,Sn)3 (purple and red arrows, respectively), whereas, for the Nb5Si3 alloyed with B and Ti, the VEC is decreased further compared with the Nb5(Si,B)3. Similarly, with the RM(Nb)ICs alloyed with B, which, as we have seen, occupy a separate area (C) in parameter maps (Figure 2), the alloyed 5–3 silicide with the addition of B also occupies a distinct, separate area in Figure 6. The effect of B on the alloying behavior of Nb5Si3 is also shown in Figure 7, where the data are for RM(Nb)ICs based on KZ5 (Nb-24Ti-18Si-5Al-5Cr, nominal composition [31]) with additions of B, Ge, Hf or Sn. Note (a) the remarkable linear fit of data and (b) that the diamond data points correspond to RM(Nb)ICs that are also RCCAs.
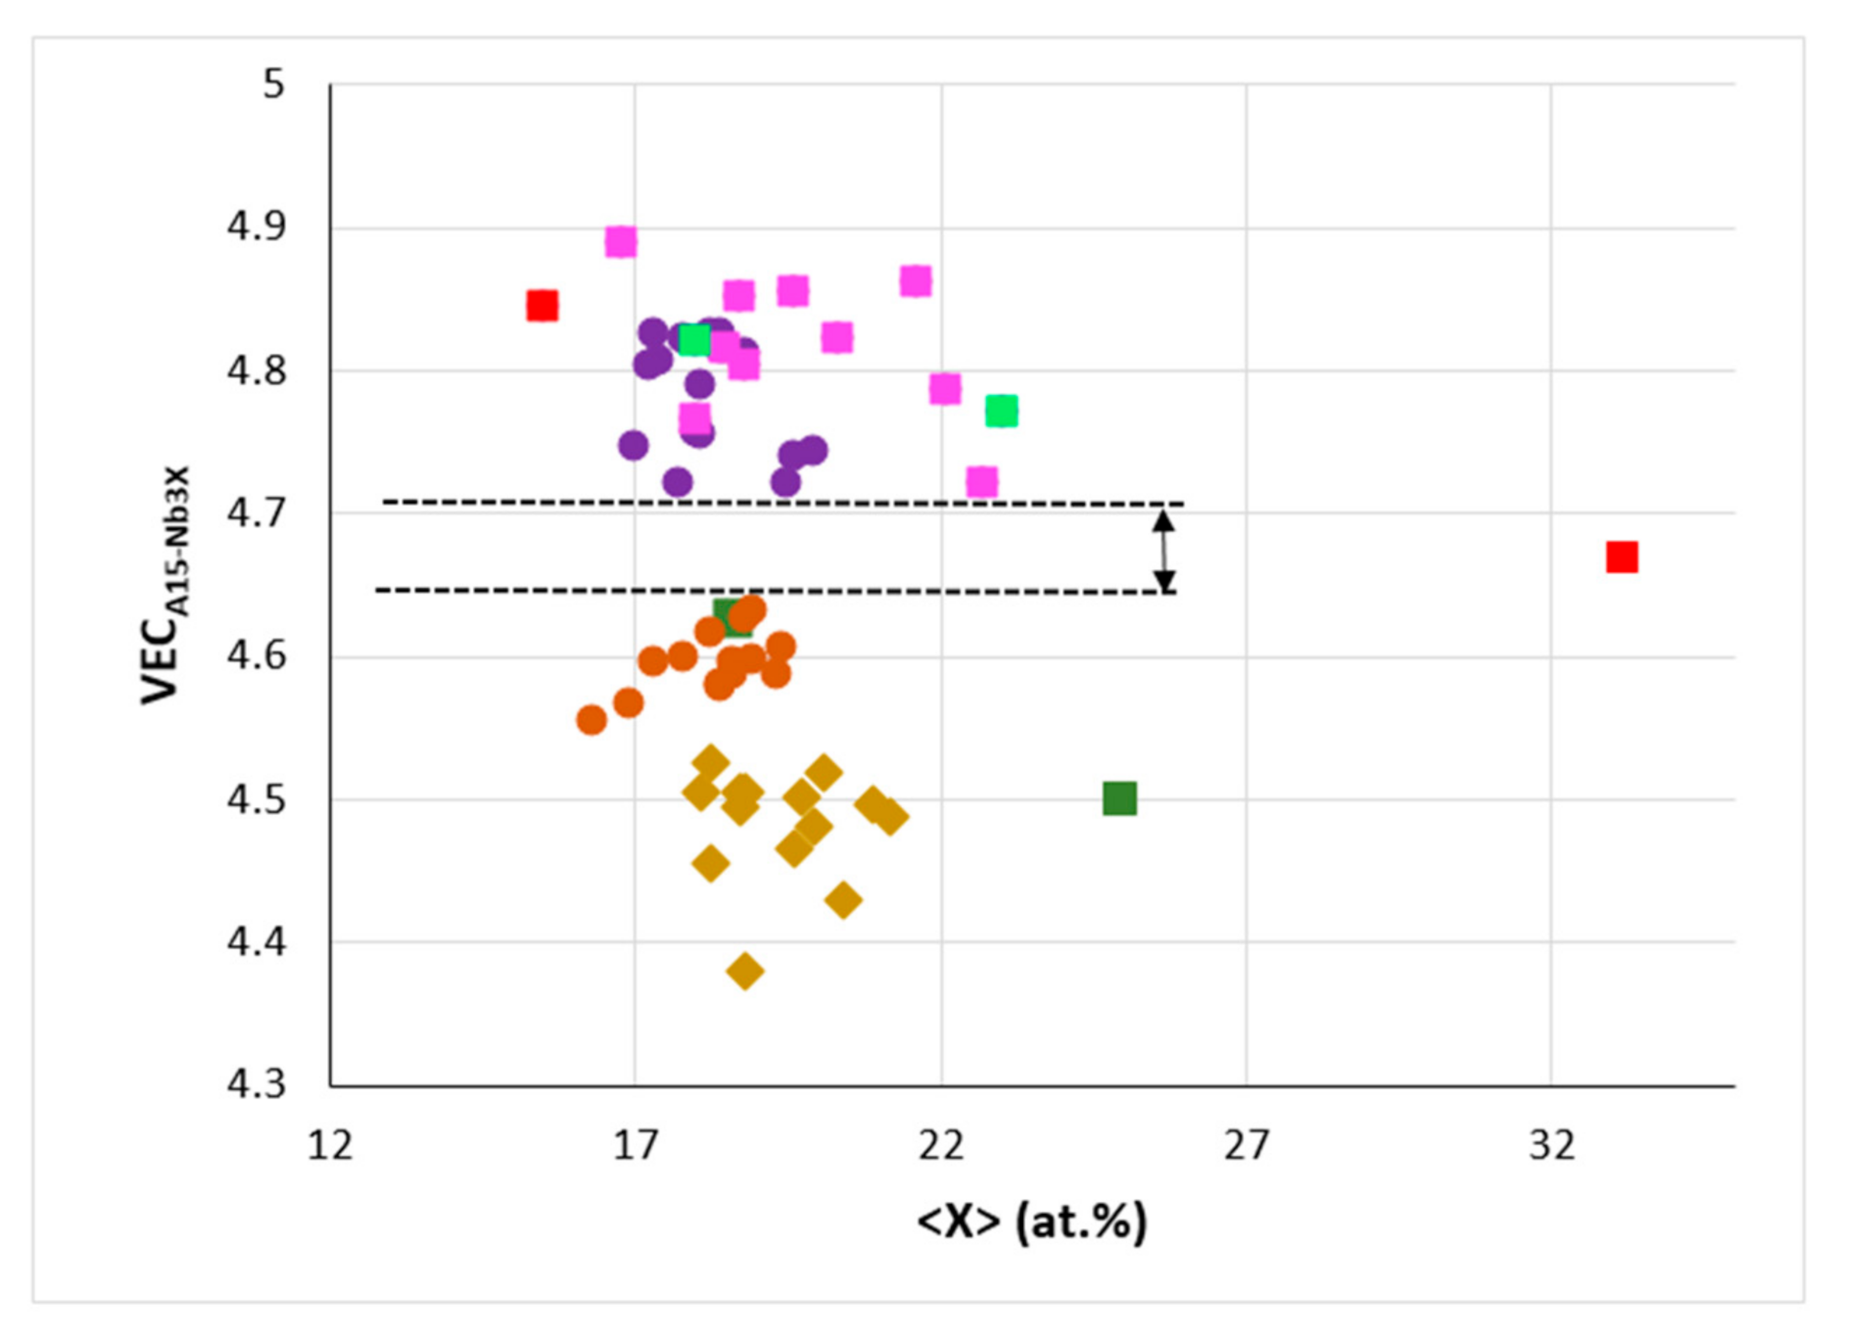
The alloying behavior of the C14-NbCr2 Laves phase and A15-Nb3X compounds (X = Al, Ge, Si, Sn) was discussed in [10] and of eutectics with Nbss and Nb5Si3 in [11]. In the refs [10,11], maps of the aforementioned parameters can be found. The data in Figure 8 shows that the parameter Δχ of A15-Nb3X (i) decreases with increasing <X> = Al + Ge + Si + Sn, (ii) is in the range 0.855 to 1.04 for the alloyed Nb3X where Nb is substituted by Cr, Fe, Hf, Mo, Ti or W and (iii) does not deviate significantly from the trend established by the data for the unalloyed Nb3Al, Nb3Ge, Nb3Sn. A similar decrease of the parameter Δχ of C14-NbCr2 occurs with alloying, but in the case of the Laves phase, the substitution of Nb and Cr by alloying additions shifts the data to higher Δχ values compared with the unalloyed Laves phase [10]. Remarkably, there is a gap (from 4.628 to 4.721) in the values of the parameter VEC of alloyed A15-Nb3X even though the data point for Sn rich Nb3Sn falls in this gap (Figure 9). The same gap was shown in the Δχ versus VEC map in [10]. Essentially, the alloying behavior of the intermetallics that can be stable in the microstructures of RM(Nb)ICs, some of which are also RHEAs or RCCAs, can be described using maps of the aforementioned parameters. Unfortunately, there is no data for the Laves phases and M5Si3 silicides that are observed in the RHEAs and RCCAs that were reviewed in [13] to enable the construction of maps and to compare them with those of the intermetallic compounds in RM(Nb)ICs.
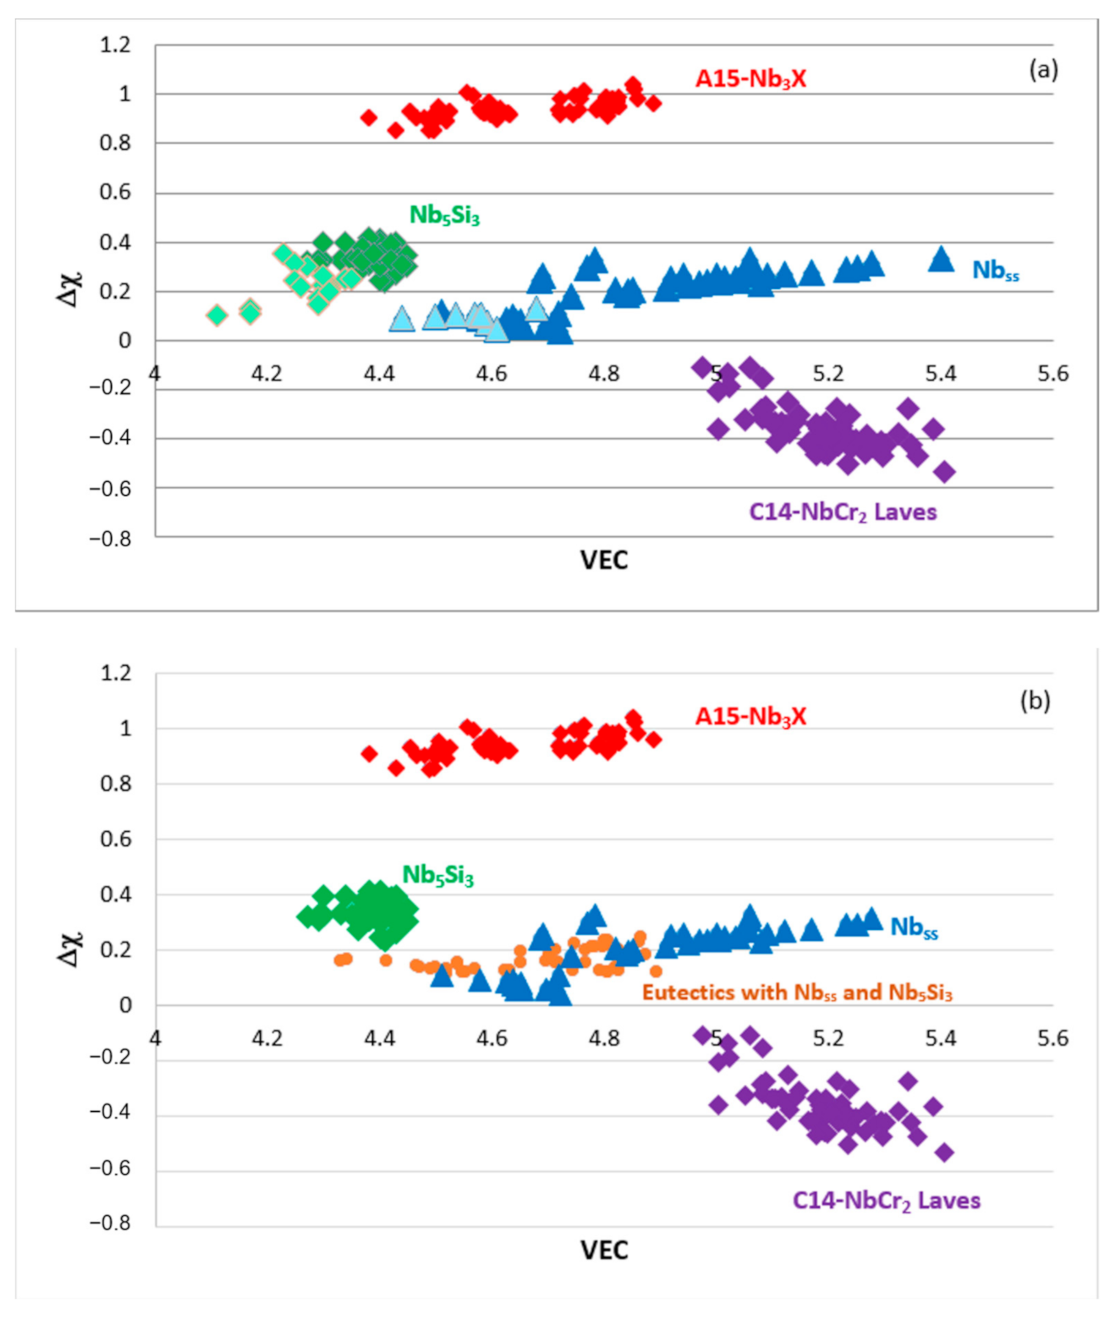
The Δχ versus VEC maps of the phases in RM(Nb)ICs are shown in Figure 10. These and the Δχ versus VEC map in Figure 16 in [3] are the “master maps” of metallic UHTMs (excluding RM(Mo)ICs). Note (a) that Figure 10 is a correction of Figure 5 in [1], in which by mistake, the labels for the A15-Nb3X and C14-NbCr2 phases were swapped, (b) that the B-containing Nbss and Nb5Si3 “sit” in the left-hand side of the map in Figure 10a, (c) that eutectics with Nbss and Nb5Si3 are positioned in the area between approximately 0.12 < Δχ < 0.25 and 4.3 < VEC < 4.9 that is also occupied by the bcc solid solution (Figure 10b), (d) that the data for the bcc solid solution RCCAs studied by Senkov et al. [13] and the HEA Nbss and HEA eutectics with Nbss and Nb5Si3 in RM(Nb)ICs that satisfy the standard definition of HEAs fall in the area of the Nbss and eutectics with Nbss and Nb5Si3 in Figure 10b, as discussed in [3].
The parameters Δχ, δ, VEC, ΔHmix, ΔSmix, Ω can be seen as being nothing more than guidelines to make alloys. This they do with a certain monotonous consistency. In this sense, they are like the keys of the piano, each playing a single note, but combine them (in NICE as we discuss below) as you would combine piano keys, and you can create “melodies of infinite variety”. Put all these parameters together (in NICE as we discuss below), and you have “the great symphony of RM(Nb)ICs, HEAs, RHEAs, RCCAs”.

3. Alloying Behavior of RM(Nb)ICs, RHEAs and RCCAs and Properties of Alloys and Phases

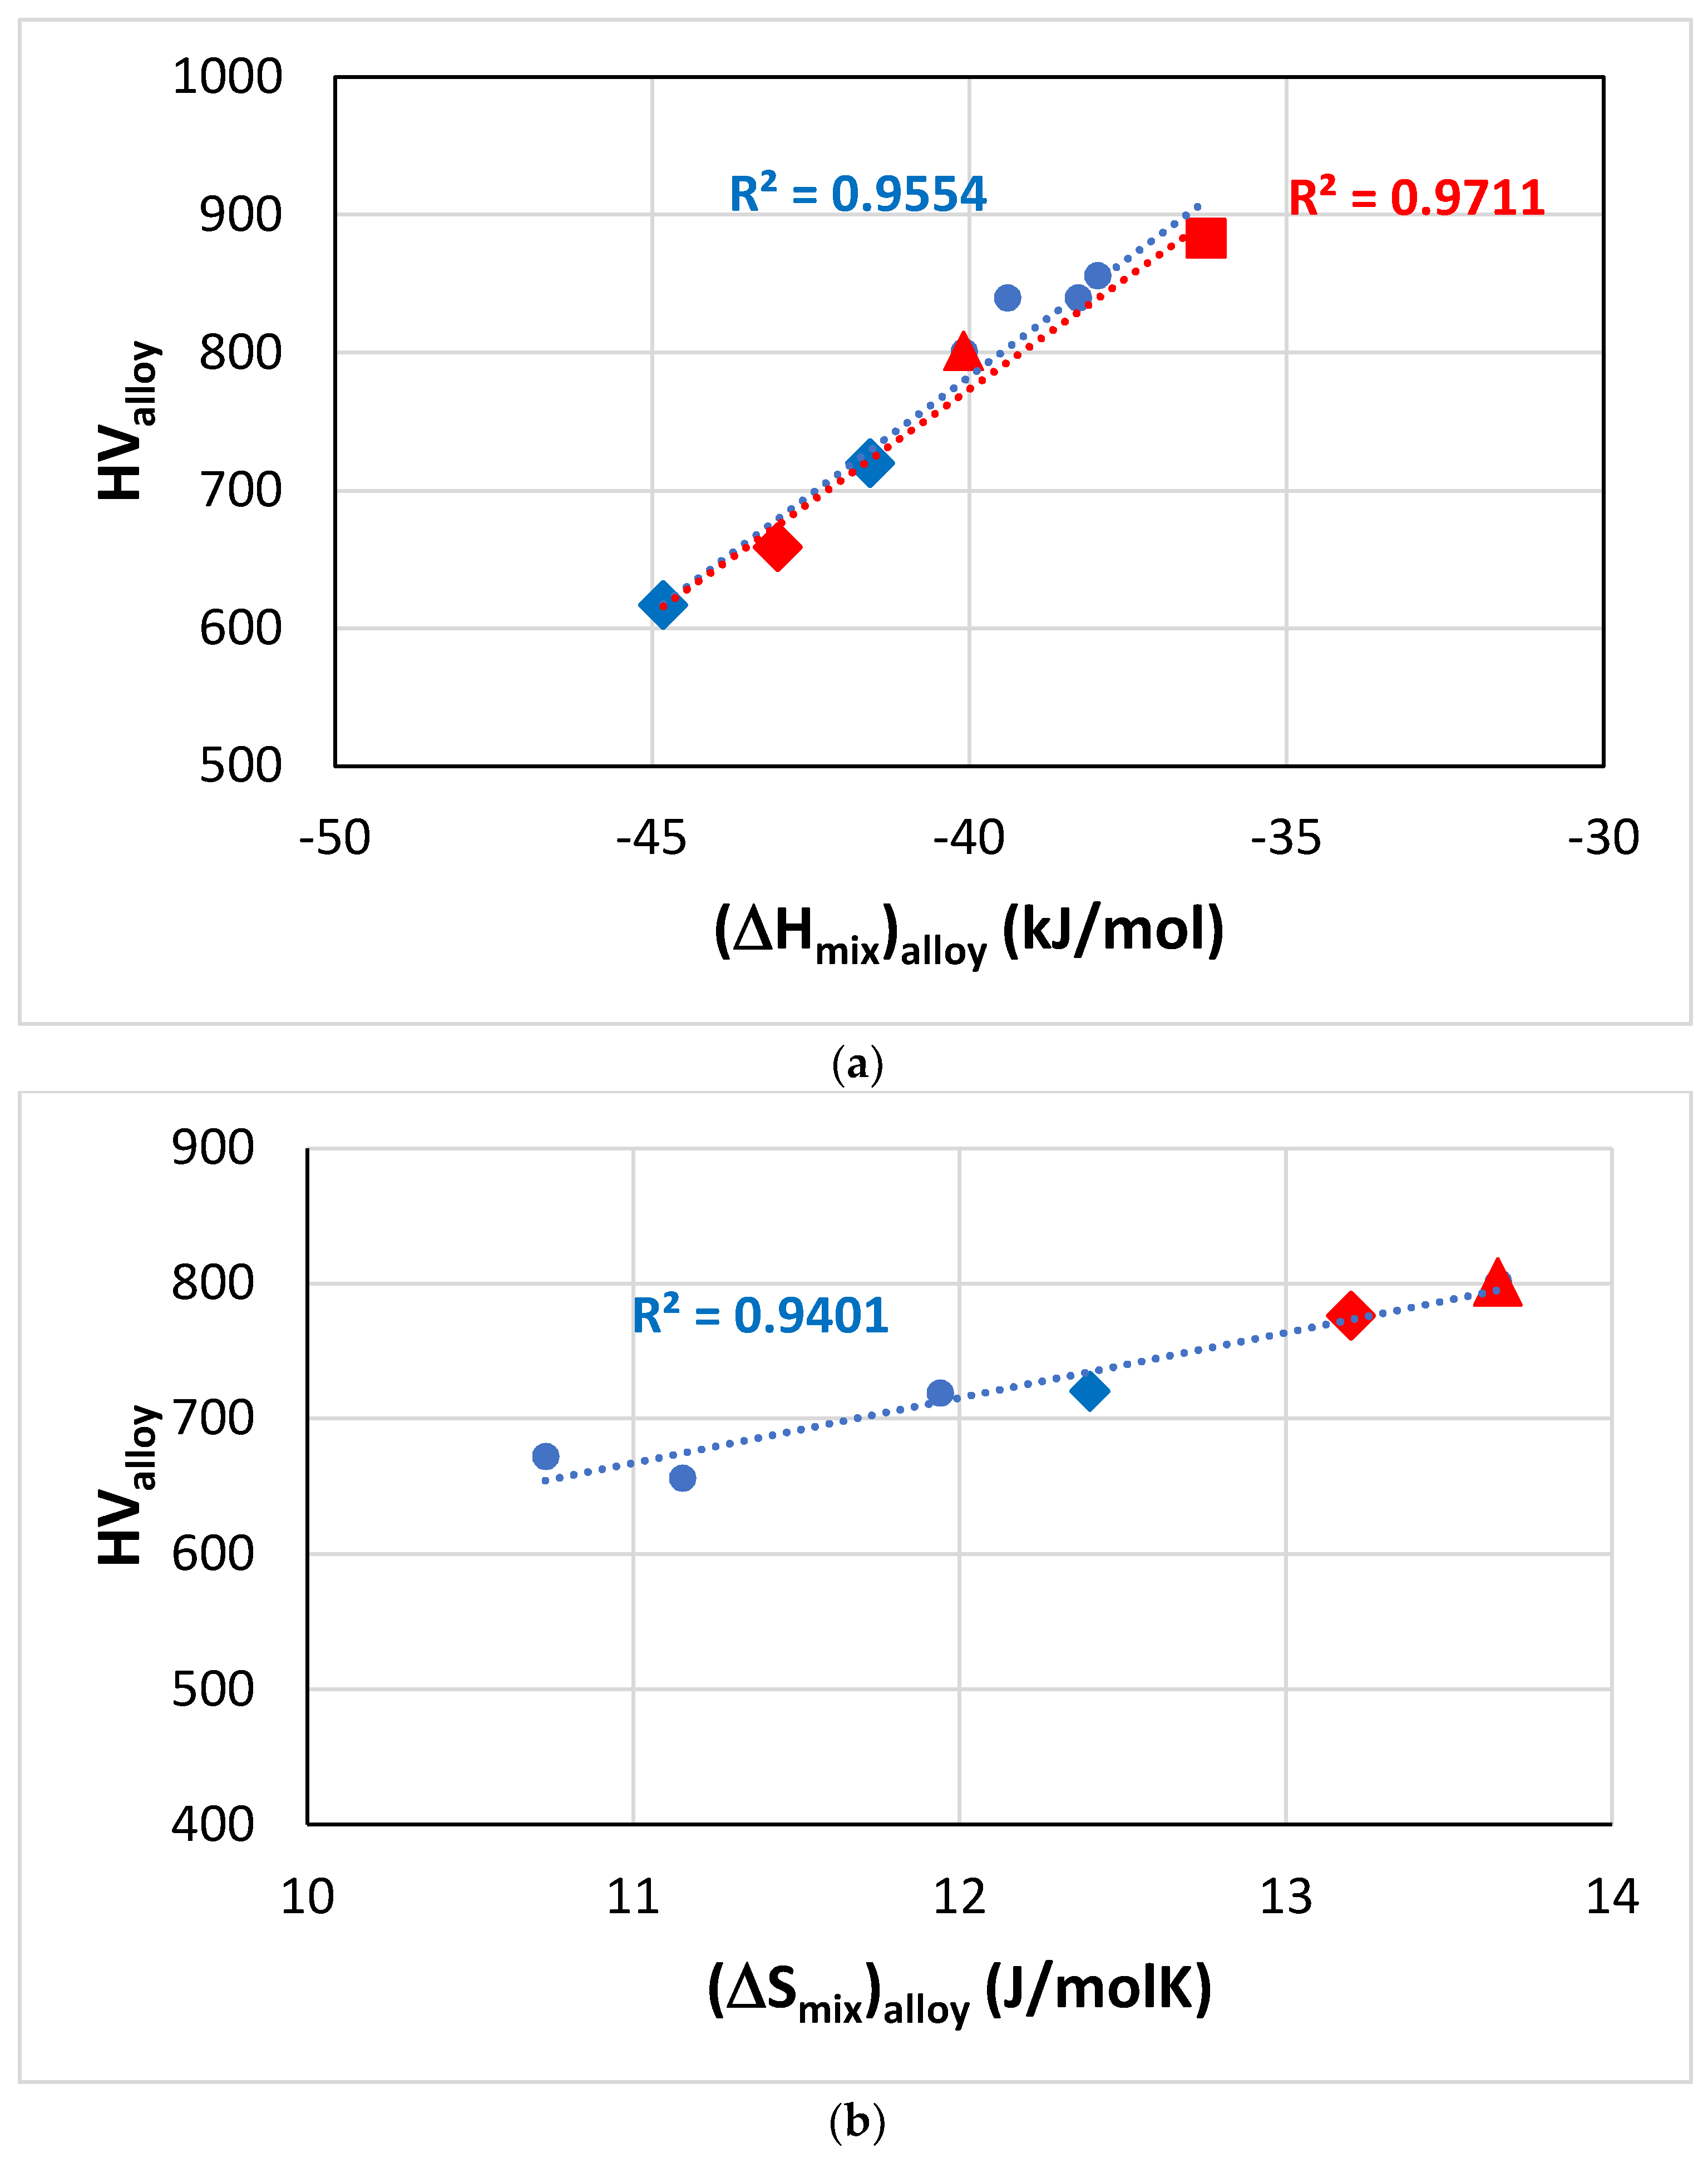
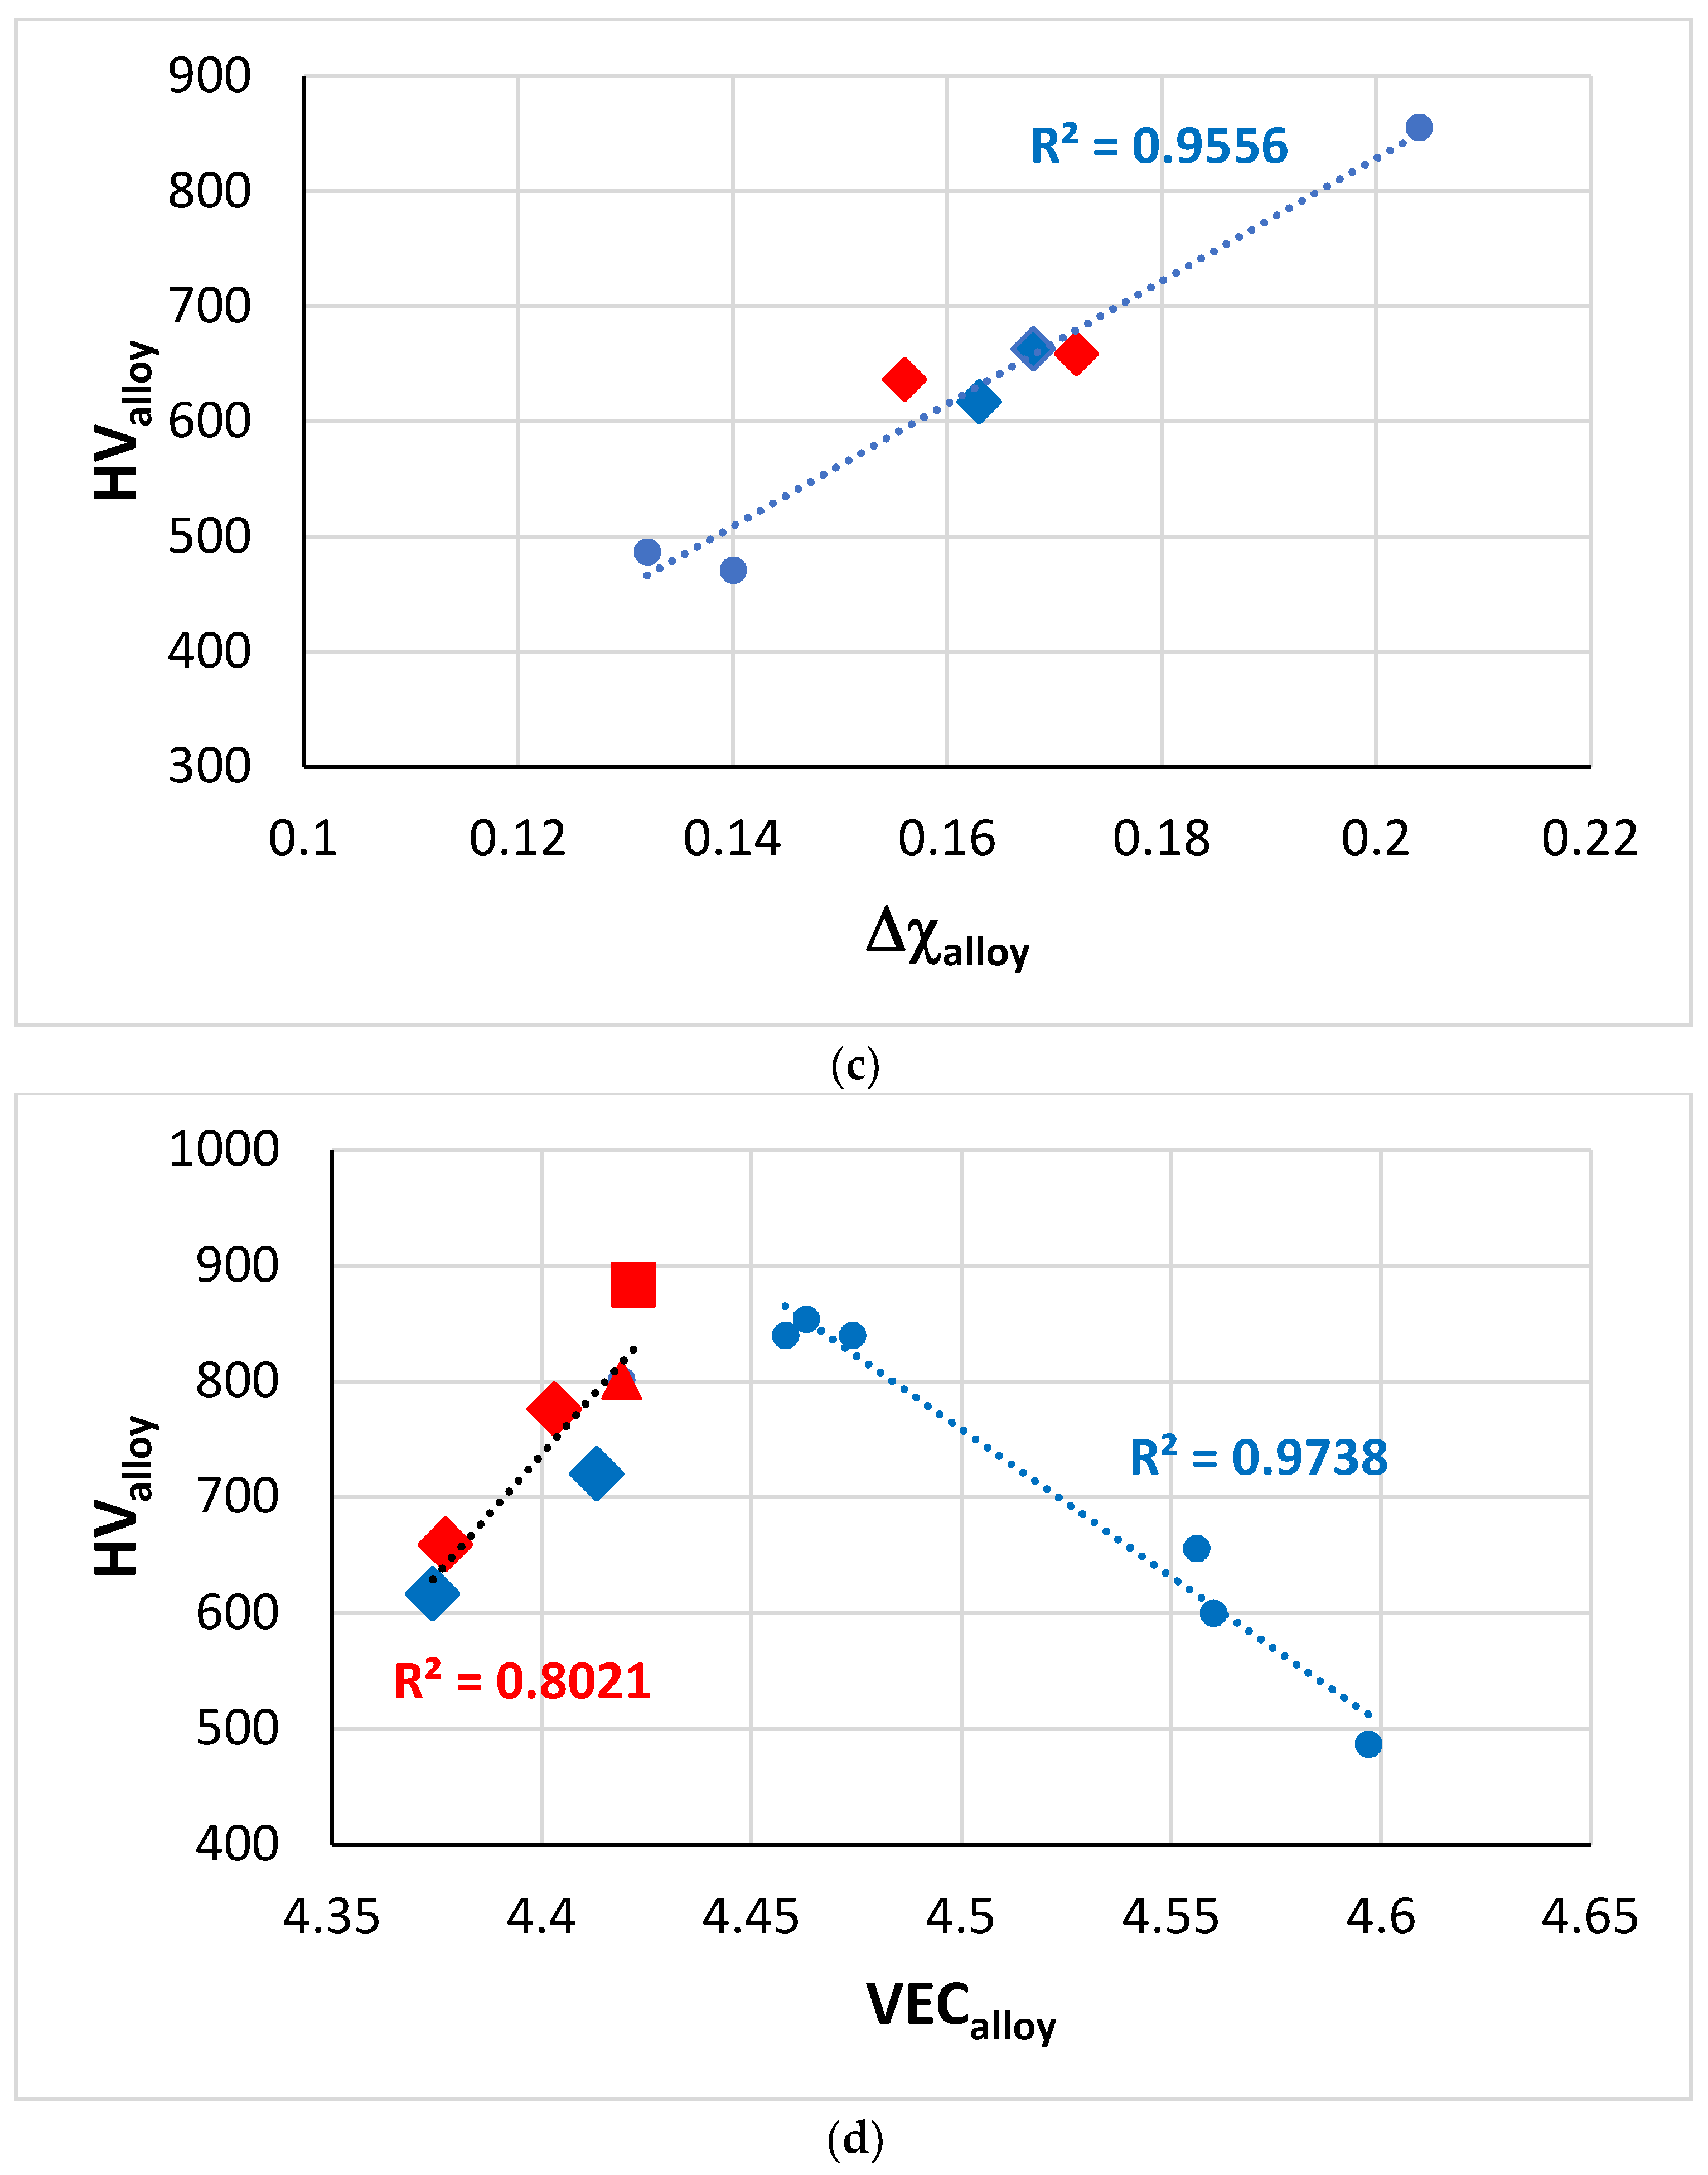
The Vickers hardness of RM(Nb)ICs, some of which are also RCCAs, increases with increasing (ΔHmix)alloy, (ΔSmix)alloy or Δχalloy (Figure 11a,c). Only the parameter VECalloy can separate the hardness of RM(Nb)ICs-RCCAs with B, Ge or Sn addition, which increases with VECalloy, from the hardness of RM(Nb)ICs that are not RCCAs, which decreases with VECalloy (Figure 11d). The latter trend was also exhibited in the room temperature strength (calculated from hardness) versus the VECalloy plot discussed in [3], where it should be noted that the data includes Ti-free RM(Nb)ICs.
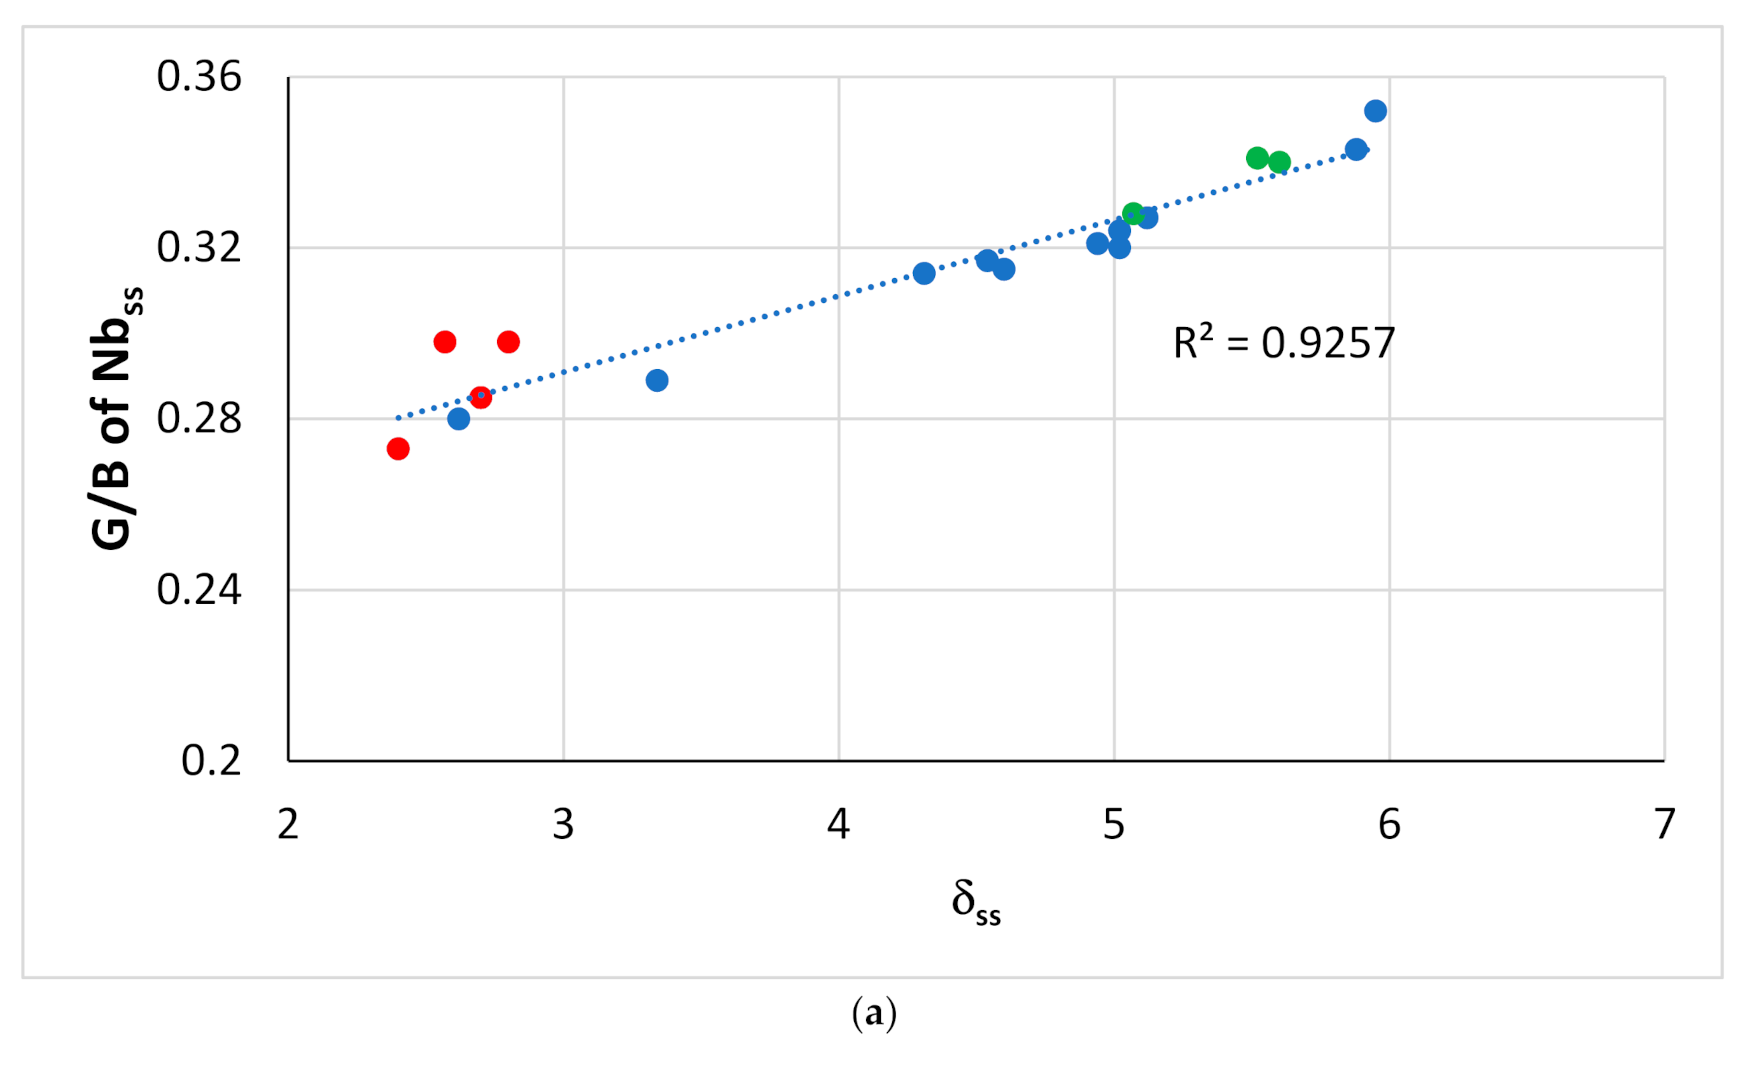
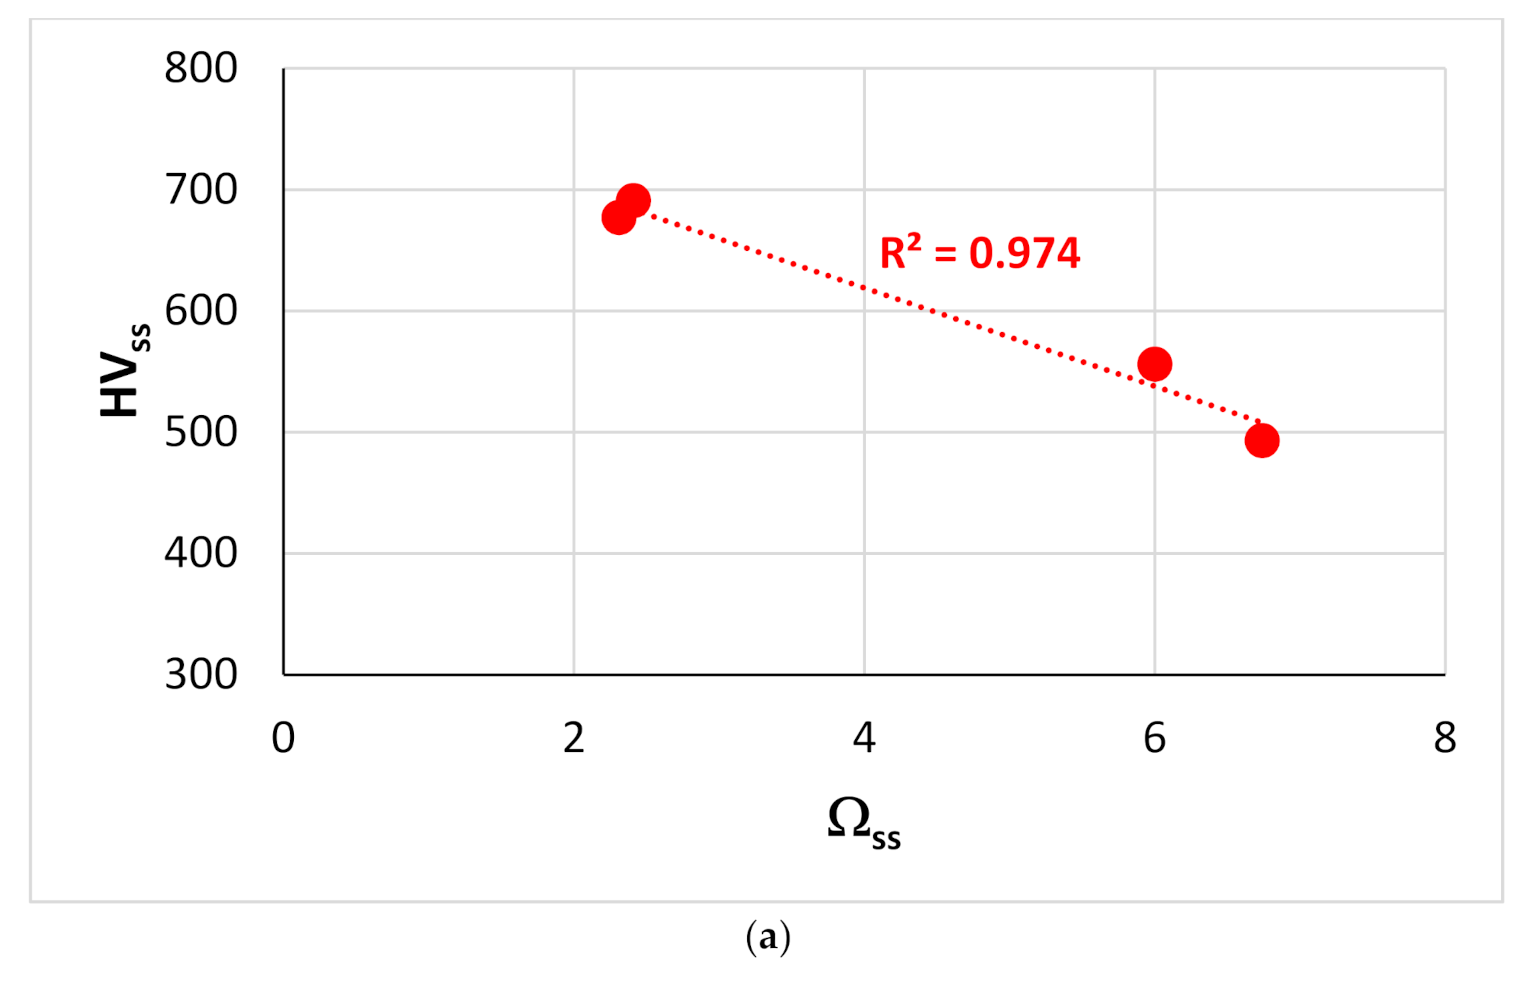
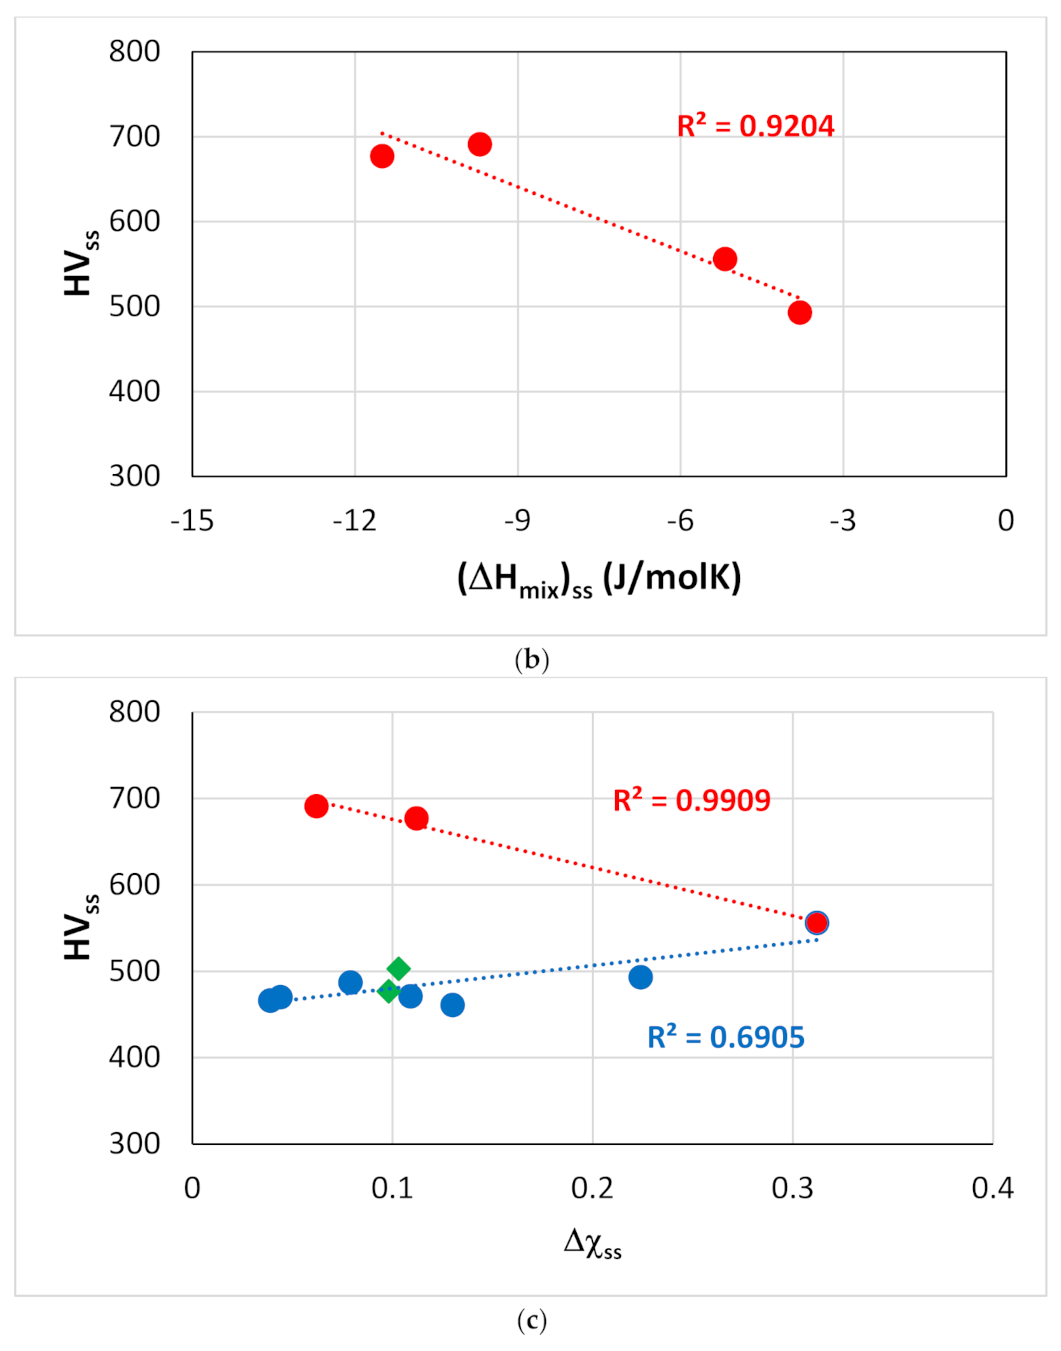
Figure 12 shows that the G/B ratio (Pugh’s ratio) of the bcc solid solution formed in RM(Nb)ICs without B addition, respectively, increases and decreases with the parameters δss and Δχss of the solid solution (the ratio G/B of the Nbss also decreases with VECss, figure not shown). Pugh [35] predicted ductile behavior for G/B < 0.5. Figure 13 shows the Vickers hardness of solid solutions (HVss) formed in RM(Nb)ICs versus the parameters (a) Ωss, (b) (ΔHmix)ss and (c) Δχss. The HVss decreases with Ωss, (ΔHmix)ss or Δχss for the solid solutions with Al, Cr, Ge, Hf, Mo, Nb, Si, Sn, Ti or W and increases with Δχss for solid solutions that contain B and Ta, but not Ge. None of the solid solutions in this figure is a HEA/RHEA/RCCA, but the two solid solutions that belong in RM(Nb)ICs that are also RCCAs were formed in alloys with B addition. Note that the hardness HVss of Nbss in B-free as-cast RM(Nb)ICs increases with δss [3].
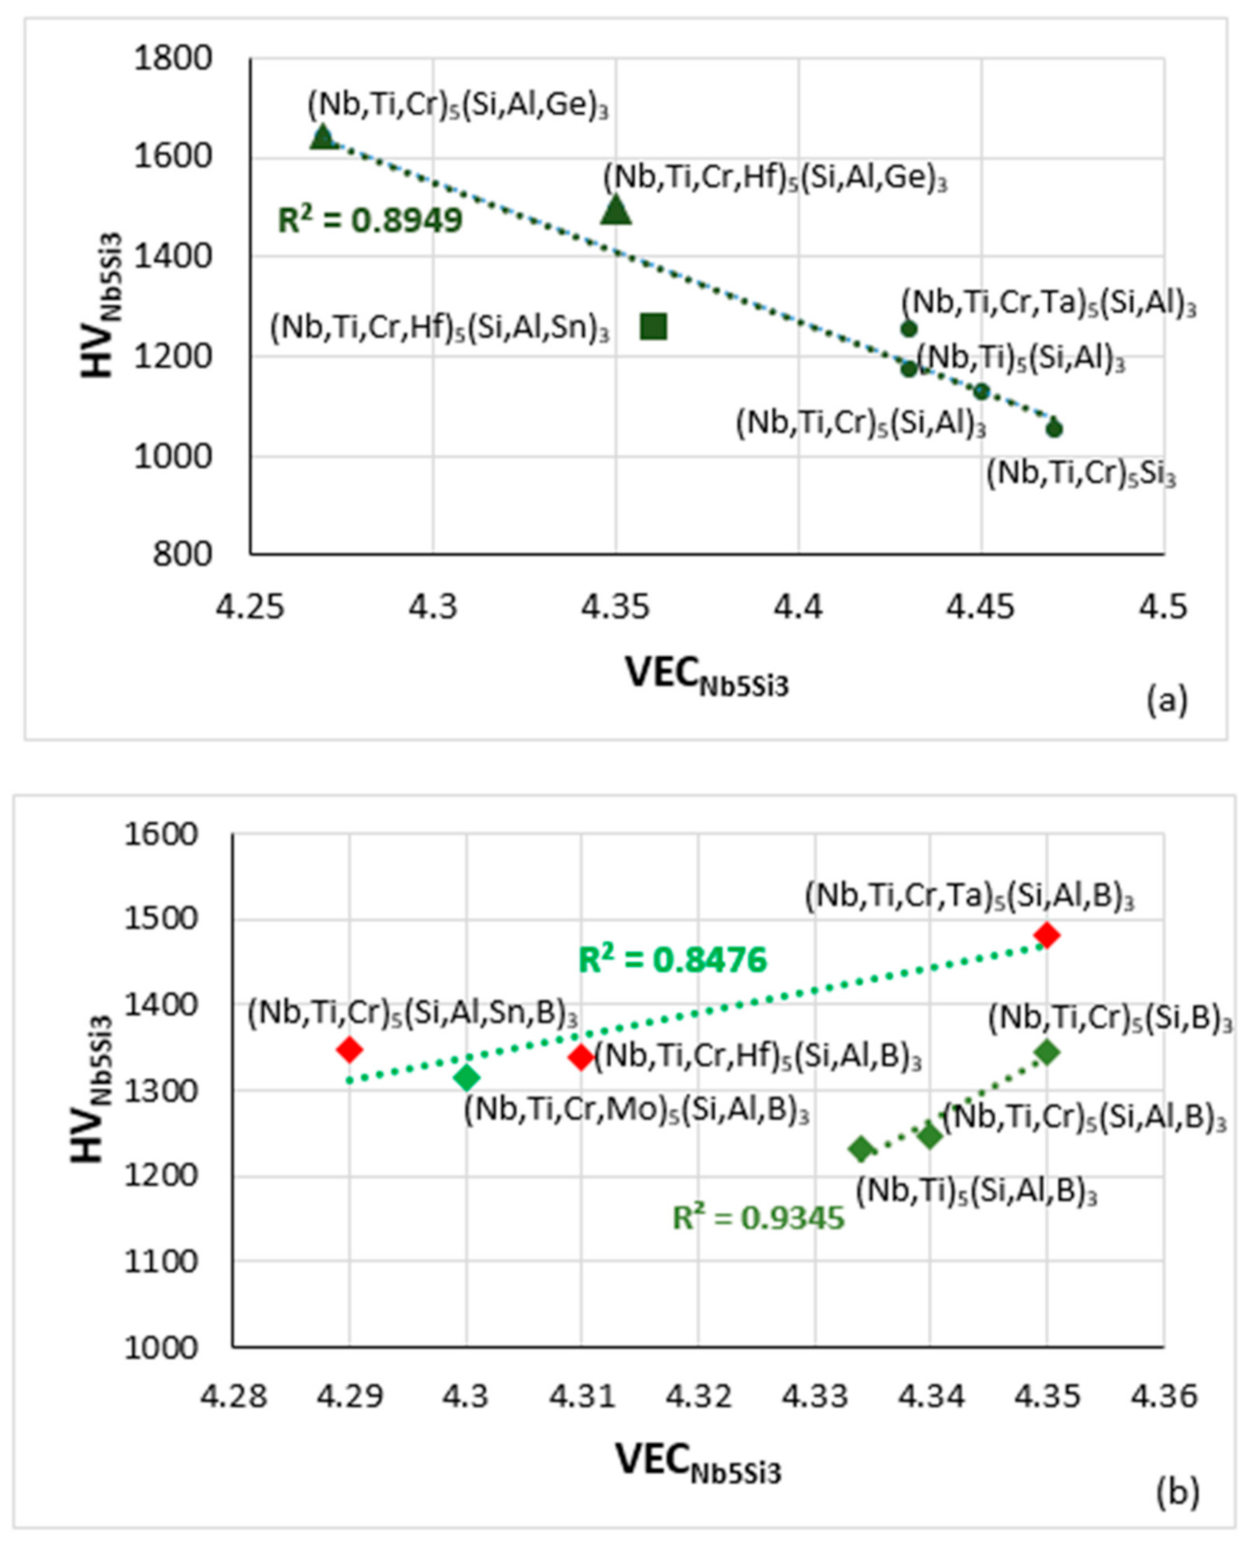
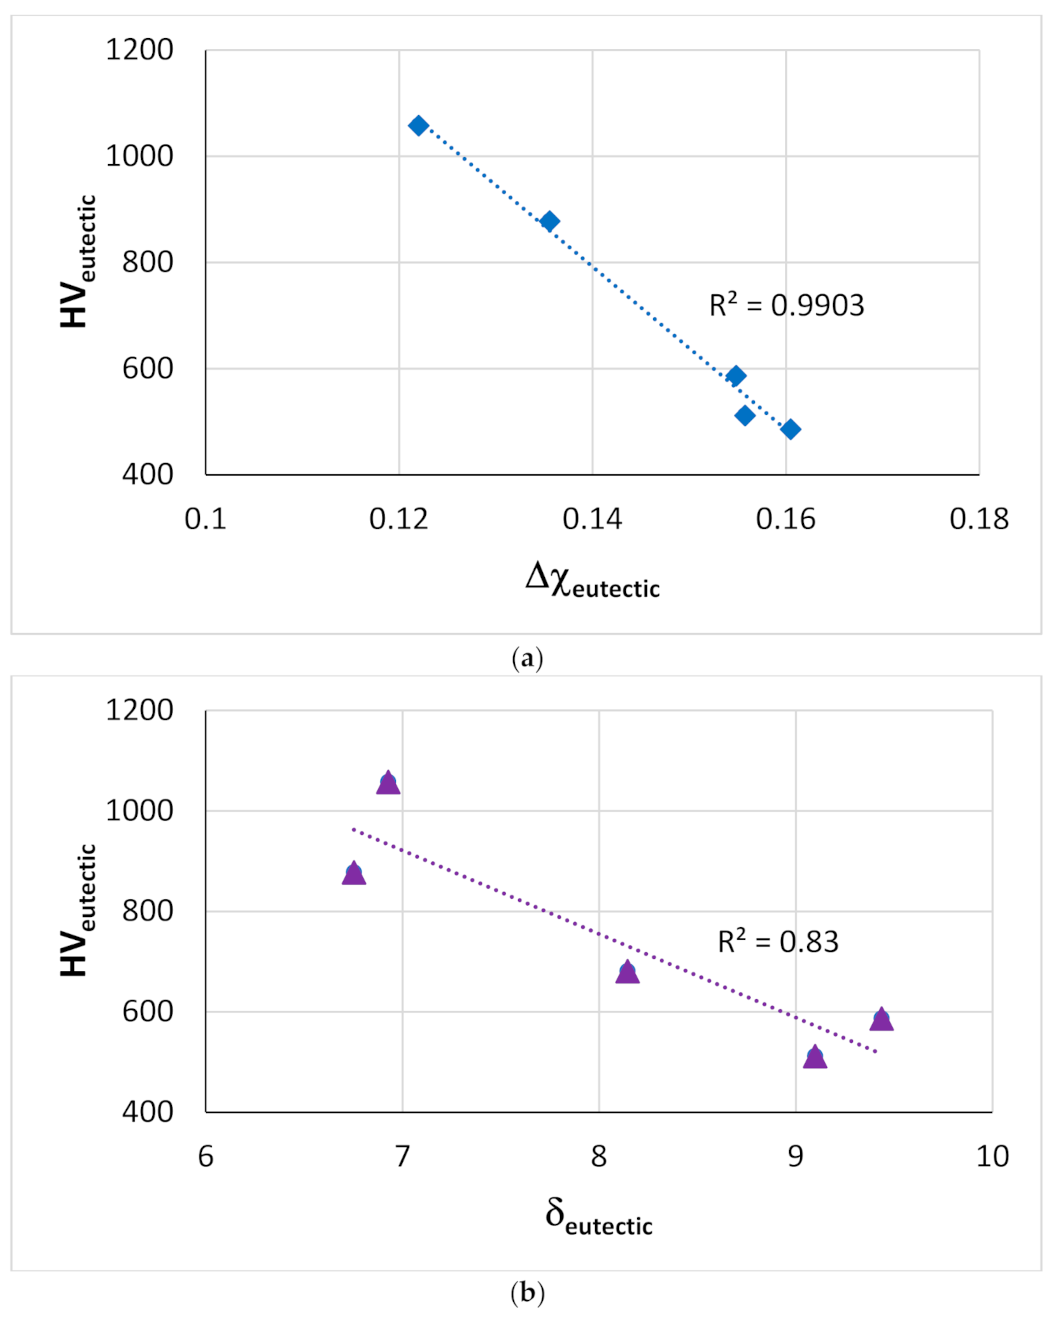
The effect of alloying additions on the hardness of Nb5Si3 was discussed in [9], where it was shown (i) that among the elements that substitute Si, the addition of Ge has the strongest effect regarding the increase of hardness, whereas Al, B and Sn decrease the hardness, and (ii) that among the elements that substitute Nb the addition of Cr, Hf and Ti has the opposite effect reducing the hardness compared with the binary Nb5Si3 [36,37]. Figure 14 shows that the Vickers hardness of alloyed Nb5Si3 decreases with VECNb5Si3 for RM(Nb)ICs without B addition that is not RCCAs (Figure 14a), whereas the HVNb5Si3 increases with VECNb5Si3 for RM(Nb)ICs with B addition (Figure 14b). Note that the data in Figure 14b (a) does not include alloys with simultaneous addition of B and Ge, but (b) includes data for Nb5Si3 in RM(Nb)ICs that are also RCCAs (red diamonds). In RM(Nb)ICs, the Vickers hardness of eutectics with Nbss and Nb5Si3 increases with VECeutectic [11] and decreases with increasing Δχeutectic or δeutectic in Ti-free RM(Nb)ICs, respectively with Al, Cr, Ge, Hf, Nb, Si, Sn and Cr, Ge, Hf, Nb, Si, Sn alloying elements (Figure 15).
In RM(Nb)ICs, the Vickers hardness of alloyed A15-Nb3X (X = Al, Ge, Si or Sn) increases with increasing ΔχA15 or VECA15 [10]. The increase of the creep rate of alloyed Nb5Si3 compared with the binary silicide [1] is linked with the shift of the position of Nb5Si3 in parameter maps (Figure 6, and [9]), namely with changes in the parameters ΔχNb5Si3 and VECNb5Si3. Furthermore, there are relationships between the creep rate of RM(Nb)ICs and the parameters δalloy, Δχalloy or VECalloy [1]. Unfortunately, there is no data about the creep of RHEAs and RCCAs and about the properties of the M5Si3 and Laves phase(s) that are observed in these UHTMs. No RHEAs and RCCAs with A15-Nb3X compounds have been studied to date outside our research group [19,25,26].
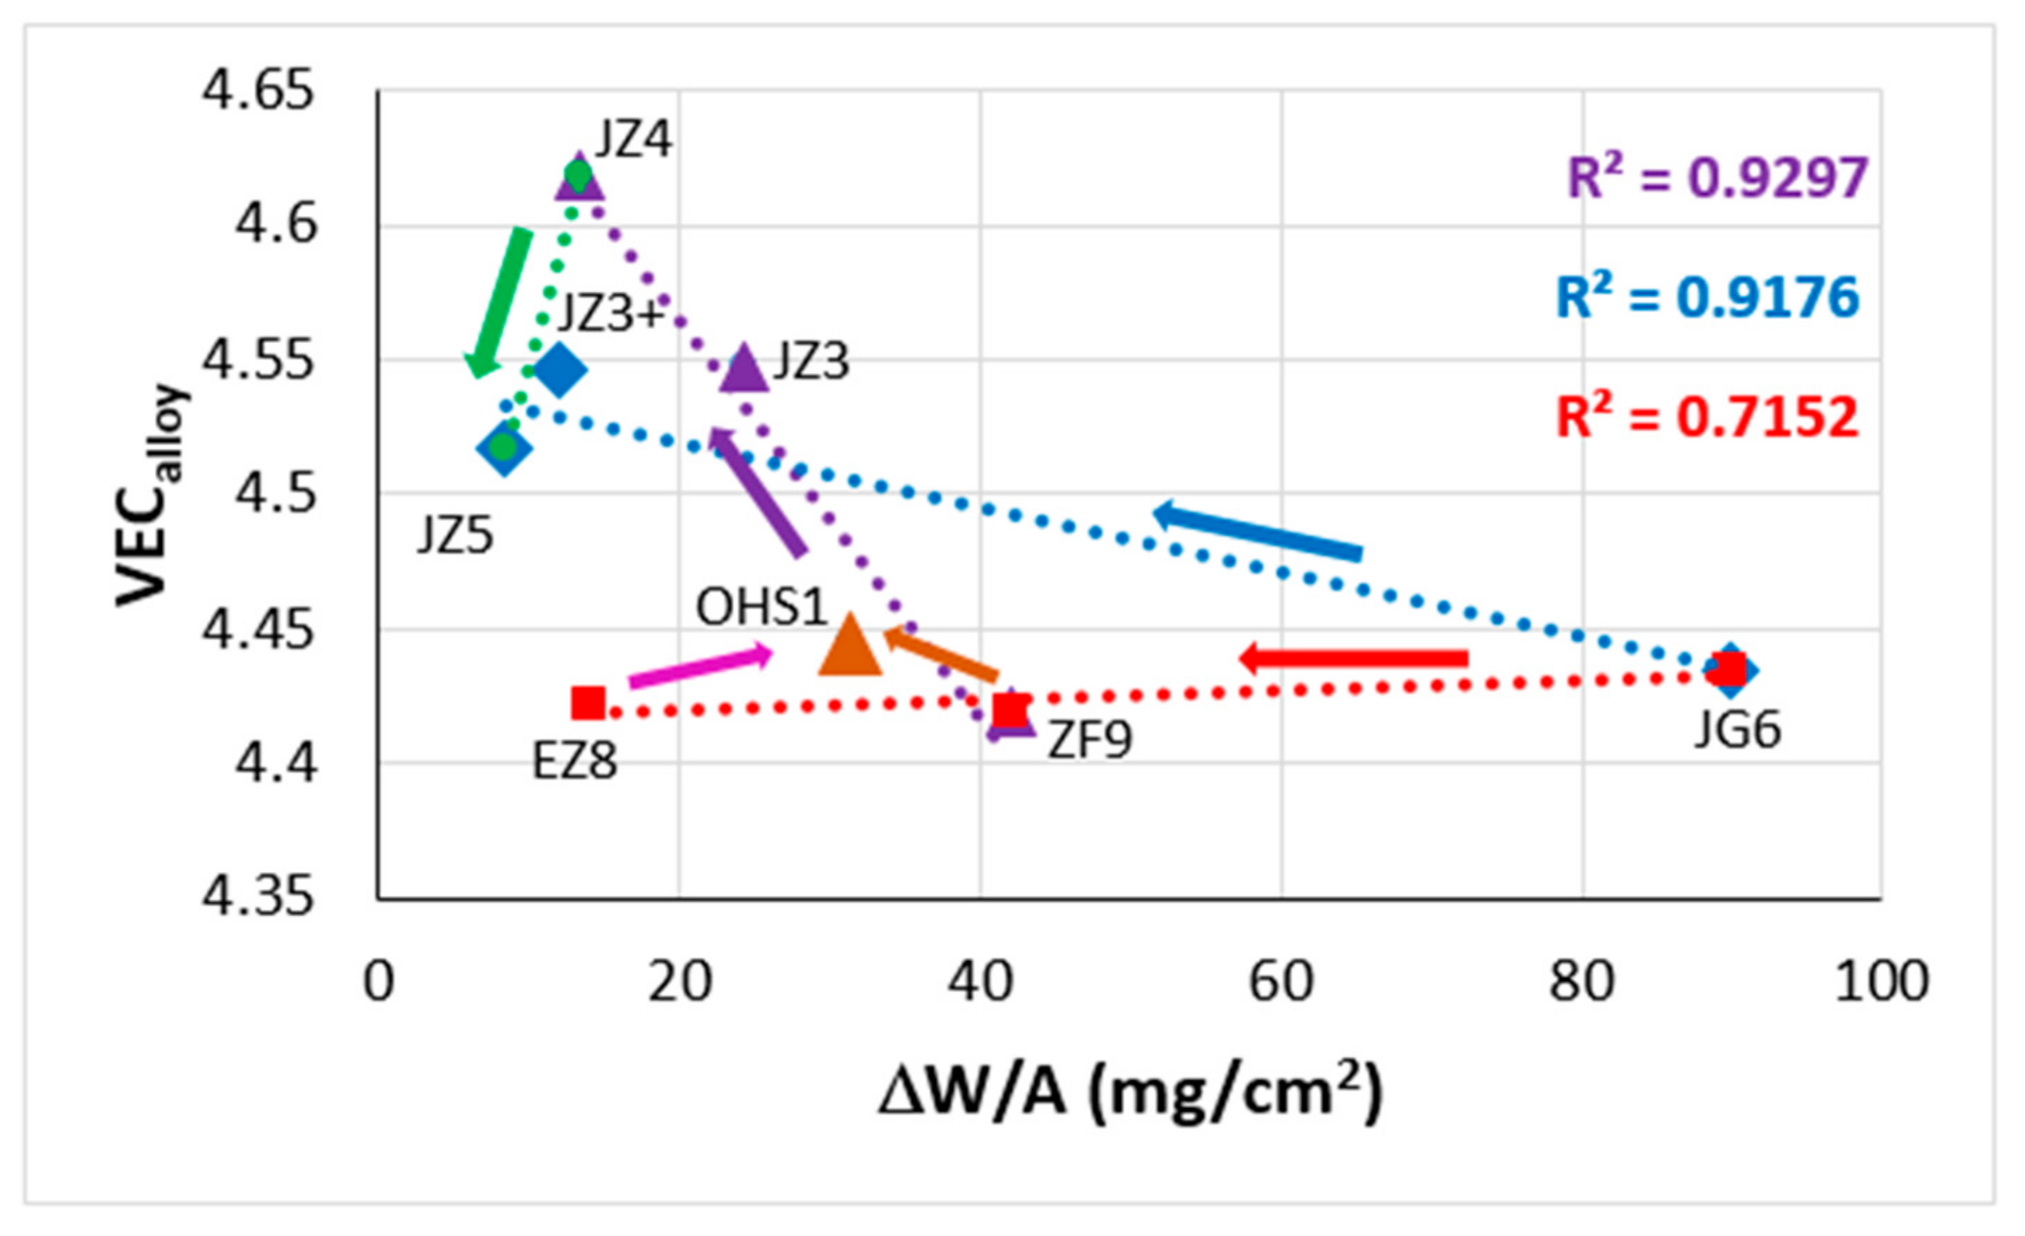
Weight changes of alloys in isothermal oxidation are also linked with changes of the aforementioned parameters [1,19,26,27,38]. Figure 16 shows the weight change in isothermal oxidation at 1200 °C in the air of RM(Nb)ICs that are also RCCAs (data from Table 4 in [19]). Note (a) that the scale formed on the RM(Nb)ICs-RCCAs EZ8, JG6, ZF9 spalled off [19] (for the nominal composition of alloys see Table A1) and (b) that B-containing RM(Nb)ICs and RM(Nb)ICs-RCCAs do not experience pest oxidation at 800 °C and scale spallation at 1200 °C [3]. The arrows in Figure 16 indicate “direction of change” with alloying. The red arrow shows the effect on ΔW/A of removing Mo from its synergy with Al, Cr, Hf and Sn in the alloy JG6 [39] and having Ge in synergy with Al, Cr and Hf in ZF9 [34] or Sn in synergy with Al, Cr and Hf in EZ8. The brown and pink arrows show the shift towards the Hf-free alloy OHS1 [26], where Ge and Sn were in synergy with Al and Cr. The blue arrow shows the change owing to having Ge and Sn in synergy with Al, Cr, Hf and Ta (JZ3+ [25]) or Mo (JZ5 [19]). The purple arrow shows the effect of adding to OHS1 the elements Hf and Ta (JZ3 [25]) or Hf and Mo (JZ4 [19]), and the green arrow shows the effect of increasing the Ti concentration (JZ5). Note that the alloys JZ5 and JZ4 belong in the Nb-Mo-W-Ti-Cr-Hf-Al-Ge-Si-Sn system (see the second paragraph of Section 2 and Section 5).
The densities of RM(Nb)ICs, RM(Nb)ICs with B addition and RM(Nb)ICs-RCCAs with B addition, respectively are in the ranges 6.27 < ρ < 8.67 g/cm3, 6.41 < ρ < 6.87 g/cm3 and 6.46 < ρ < 6.87 g/cm3 [3] whereas the densities of RM(Nb)ICs-RCCAs with Ge or Sn or Ge + Sn and with/without Hf addition are in the range 6.78 < ρ < 7.94 g/cm3 [19]. The densities of the RCCAs reviewed in [13] were in the range 5.6 < ρ < 13.8 g/cm3 with those with Al, or Cr with/without Si, Ti, V or Zr addition having ρ < 9.08 g/cm3 whereas the RCCAs with high strength at T ≥ 1200 °C have ρ > 10 g/cm3. The room temperature specific strength of RM(Nb)ICs with B addition and RM(Nb)ICs-RCCAs with B addition calculated from hardness, respectively, is in the ranges 315.8 < σHV/ρ < 376.5 MPa cm3 g–1 and 340.2 < σHV/ρ < 383.6 MPa cm3 g–1 [3], while that of the alloys JZ4 and JZ5 with Ge + Sn addition, respectively was 387 and 396 MPa cm3 g–1 [19], higher than the specific strength of multiphase RHEAs and RCCAs that is less than about 308 MPa cm3 g–1 [13]. In other words, RM(Nb)ICs-RCCAs with the addition of Be, Ge, or Sn have superior room temperature strength and specific strength and do not experience pest oxidation and scale spallation compared with RHEAs and RCCAs without these solutes.

4. Alloying Behavior of RM(Nb)ICs, RHEAs and RCCAs, Relationships Between Alloys and Their Phases

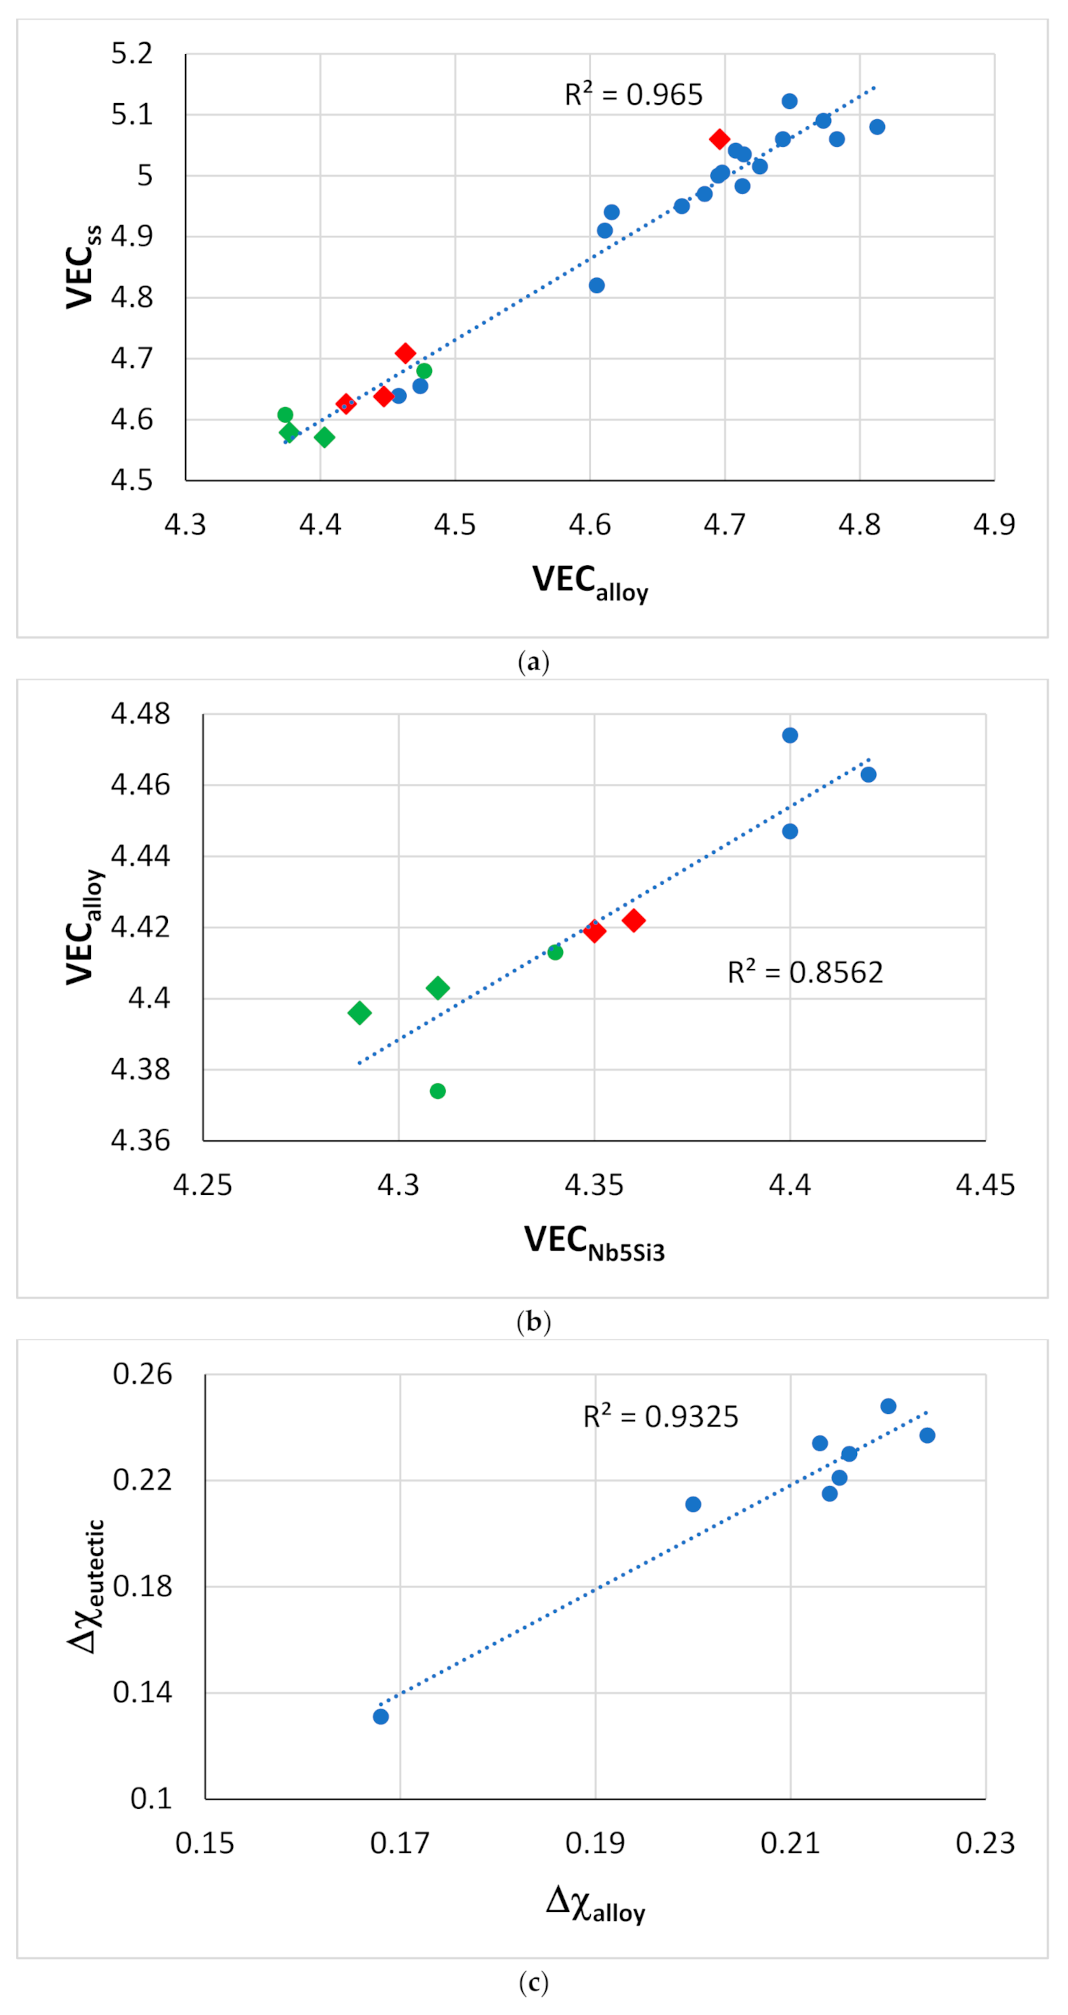
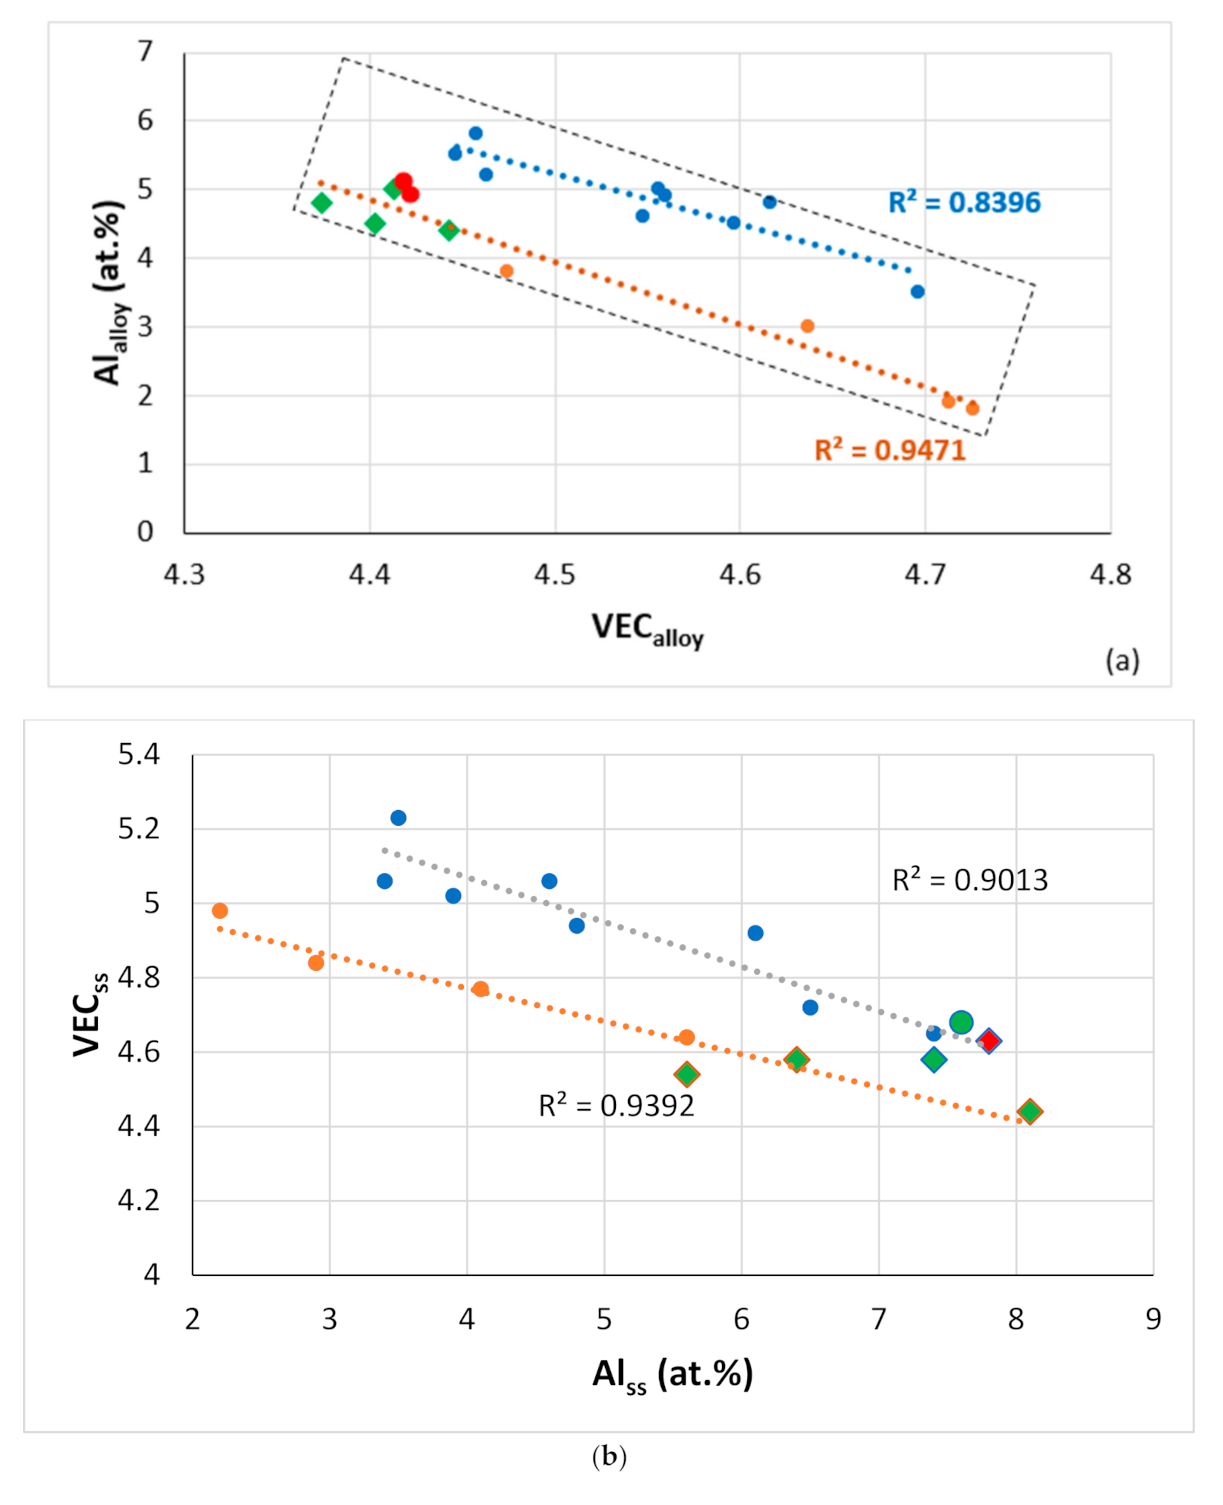
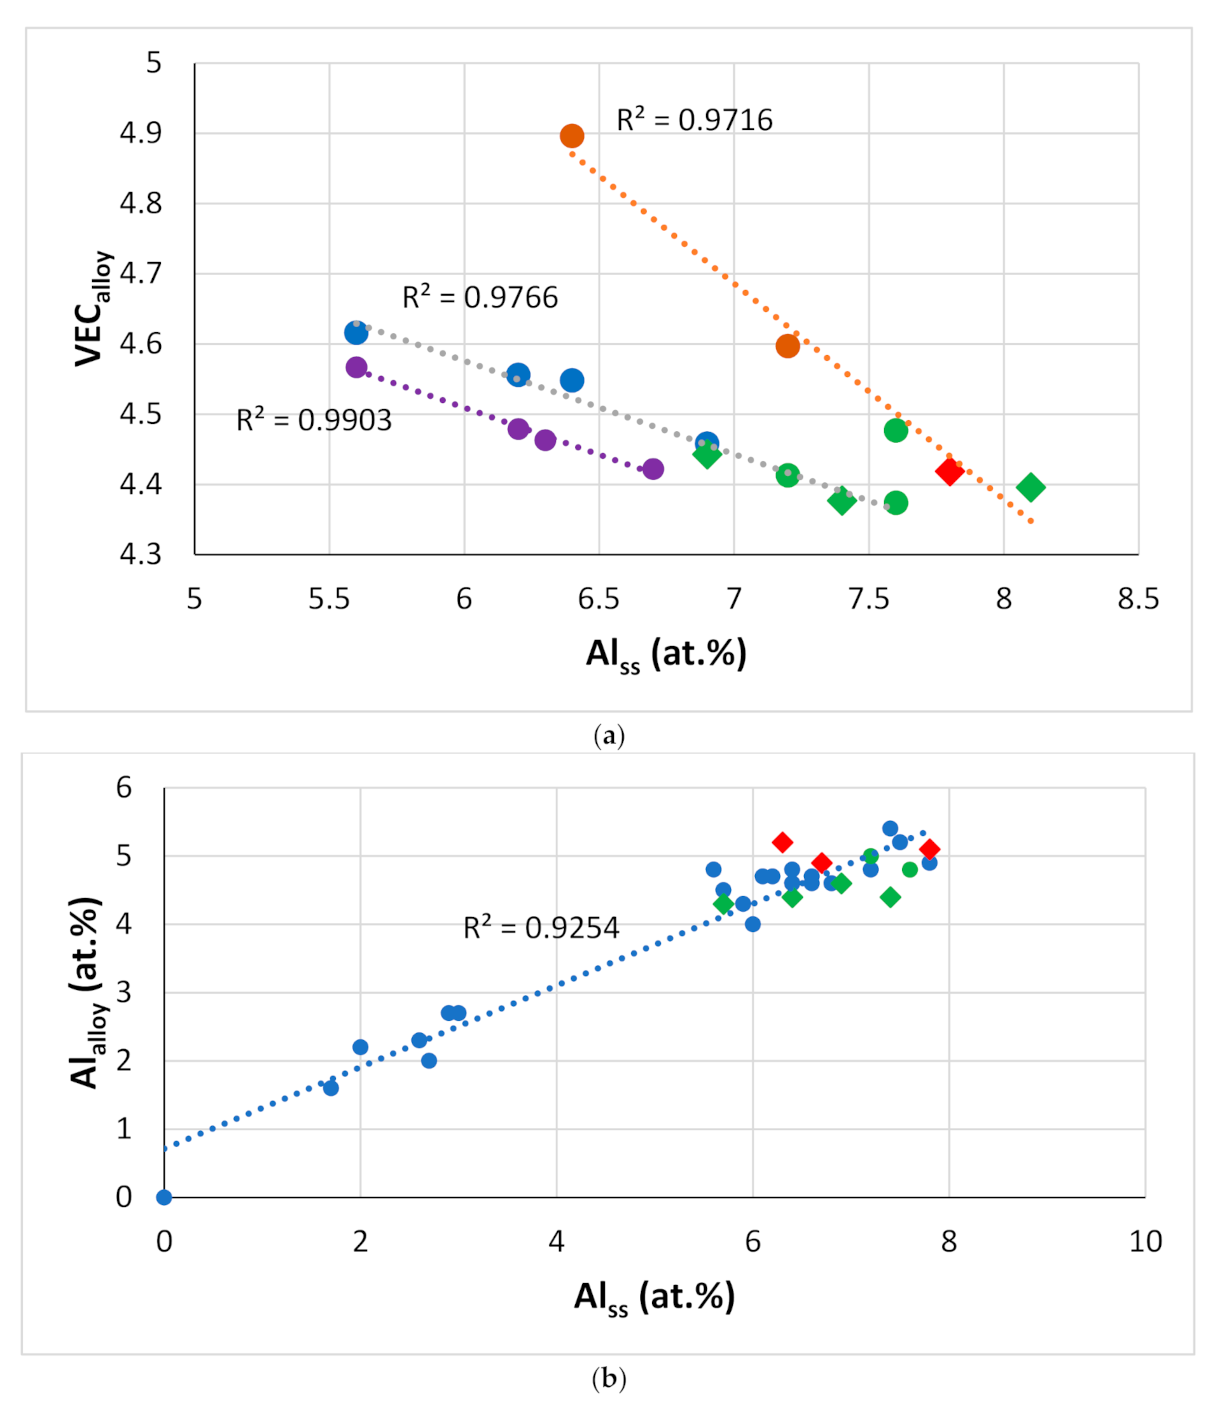
In view of the relationships between properties of the alloys and the aforementioned parameters (Figure 11, Figure 12, Figure 13, Figure 14, Figure 15 and Figure 16), one would expect that the latter can also link alloys and their phases. Indeed, this is the case. Figure 17 shows (i) that the parameter VEC can link alloys and their Nbss and Nb5Si3 and (ii) that the parameter Δχ links alloys and their eutectics with Nbss and Nb5Si3 (relationships also exist with the parameter δ, not shown in this paper). As the Al content in the alloy increases, the VECalloy decreases (Figure 18a), and the VECss decreases (Figure 17a) as the Al of the Nbss increases (Figure 18b). Note that in Figure 18a, the rectangle defines the area for alloys with different Ti/Si ratios [3] and alloying element additions. In this area, the B-containing RM(Nb)ICs and RM(Nb)ICs-RCCAs are close to the lower bound, whereas RM(Nb)ICs are closer to the upper bound.
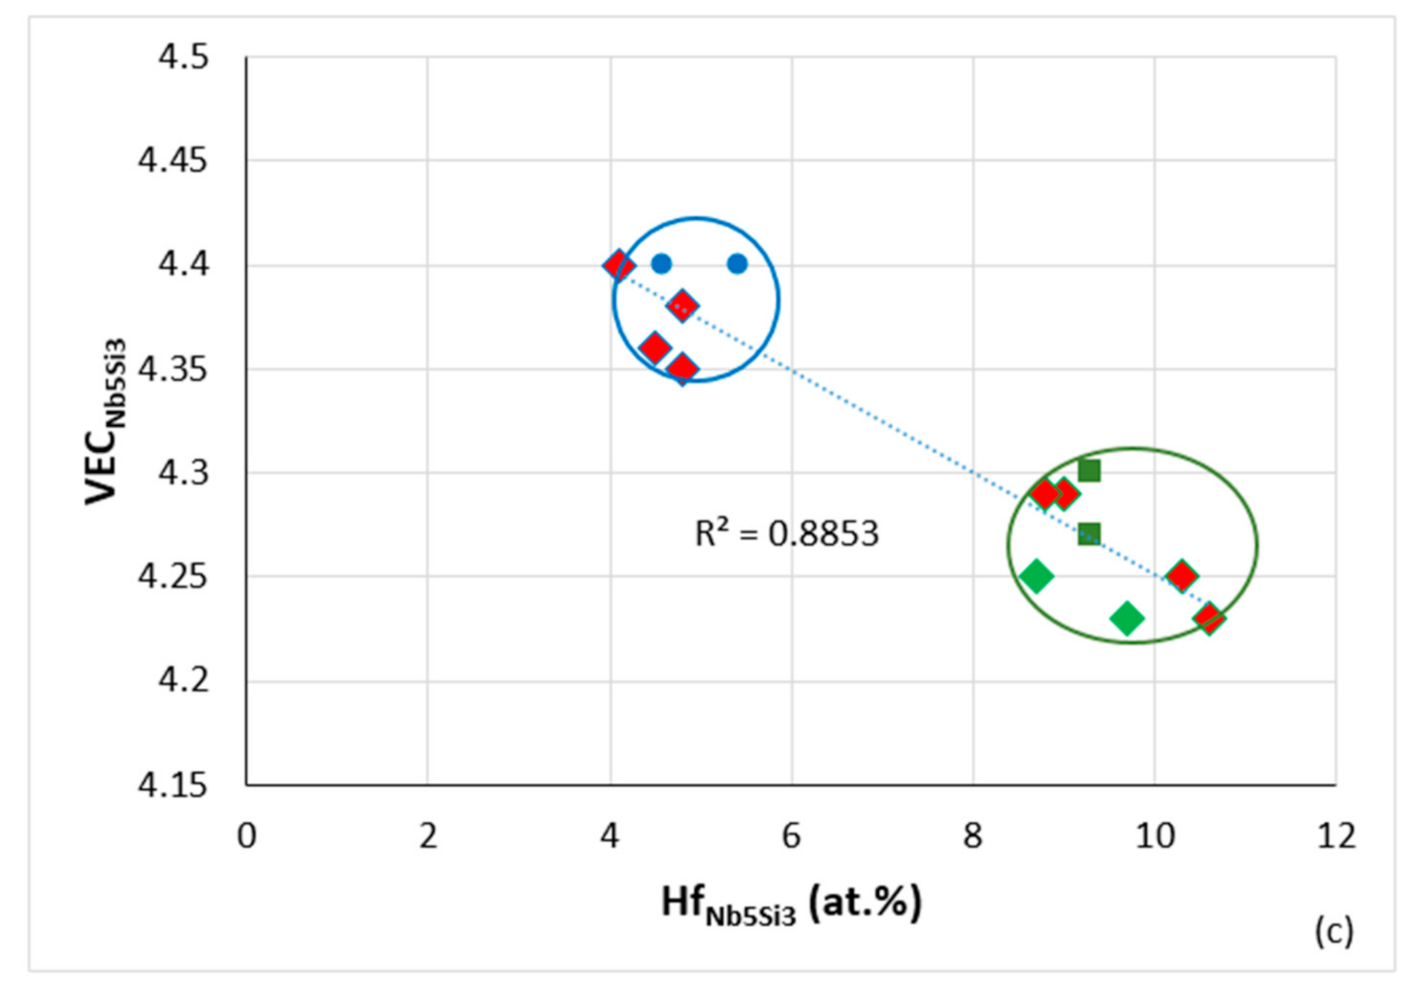
Both Hf and Ti partition to the Nb5Si3, where they substitute Nb [9]. Ti-rich Nb5Si3 is also rich in Hf compared with the “normal” Nb5Si3 [9]. The partitioning of Hf with Ti in Ti-rich Nb5Si3 contributes to the decrease of VECalloy (Figure 17b) owing to the decrease of the VECNb5Si3 (Figure 18c). Ti (and Hf) rich Nb5Si3 can form in as-cast RM(Nb)ICs and, unlike Ti-rich Nbss, can be present after heat treatment. The partitioning of Ti and Hf (and other solute additions) in Nb5Si3 affects its hardness (Figure 14). Changes in VECNb5Si3 are also linked with changes in ΔχNb5Si3 (Figure 6), which together with changes in Δχss [1,3,7], can affect the properties of eutectics with Nbss and Nb5Si3. For the latter, the parameter Δχeutectic can increase or decrease with <Si> = Al + Ge + Si + Sn depending on the alloying additions [11]. For the alloying additions given in the caption of Figure 17c, the increase of Δχeutectic with Δχalloy is linked with a decrease of <Si> [11] and thus with an increase of VECeutectic and HVeutectic [11].
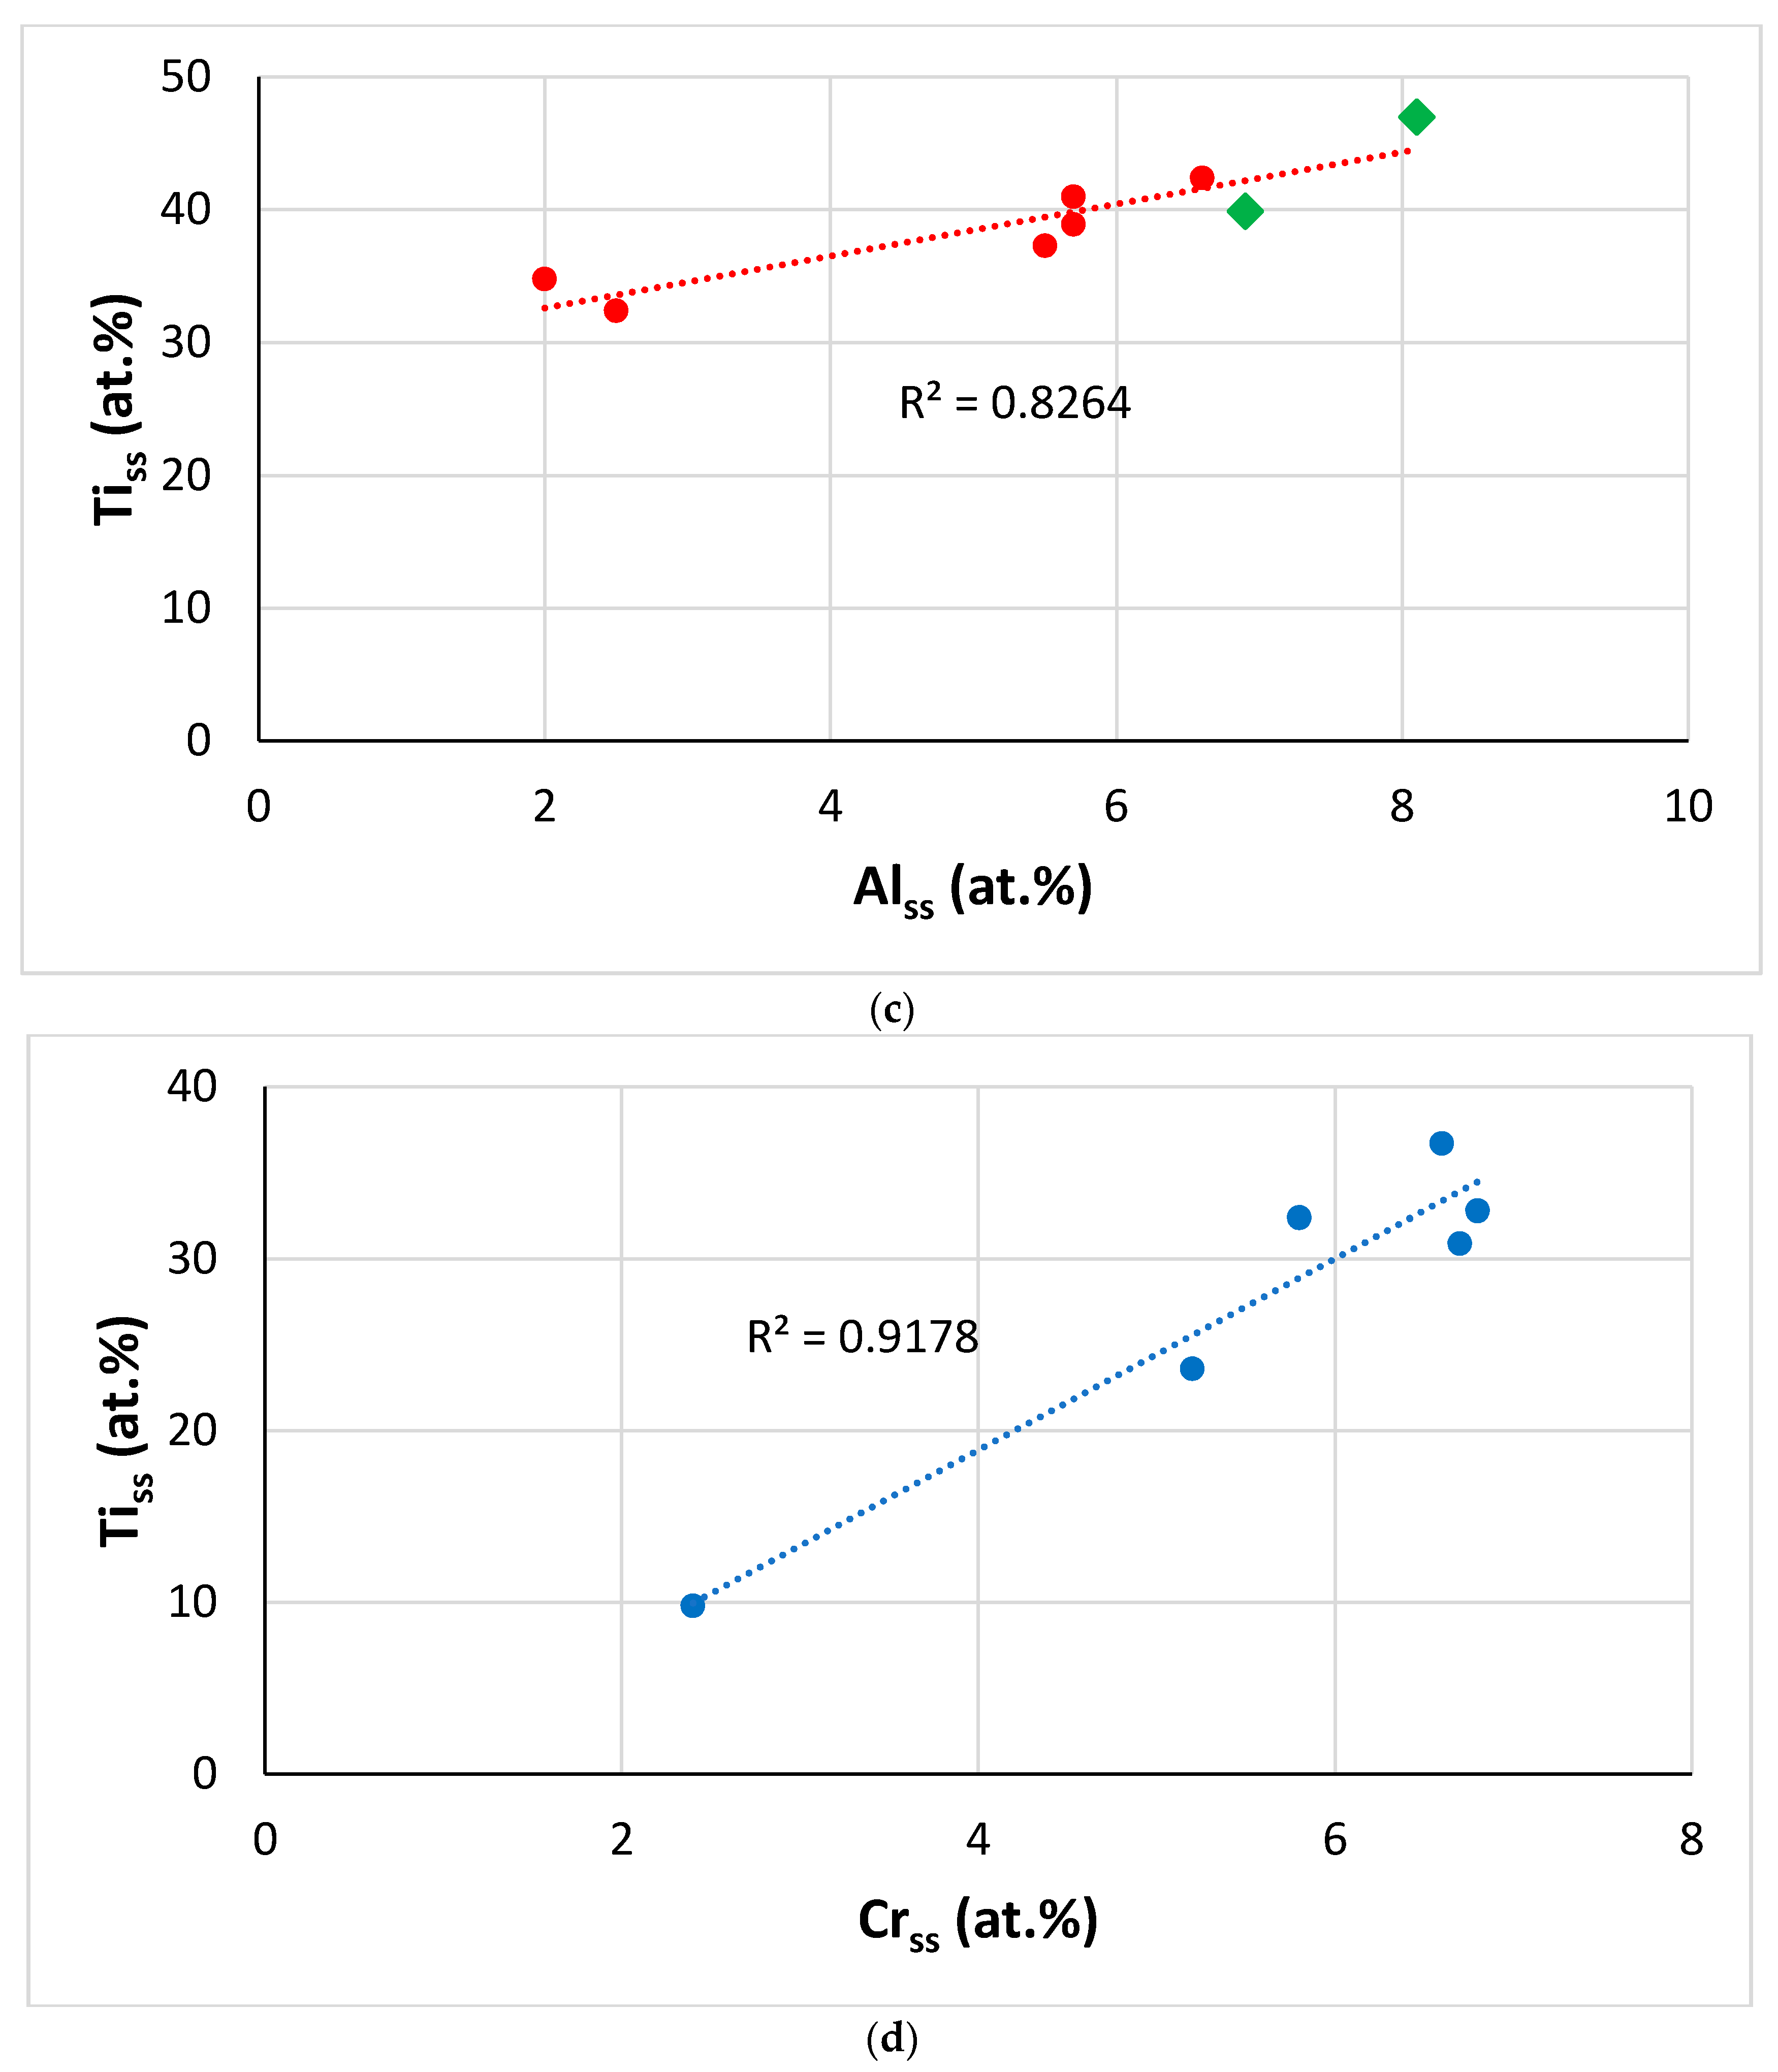
Given that the aforementioned parameters connect alloys and their phases (Figure 11, Figure 12, Figure 13, Figure 14, Figure 15, Figure 16, Figure 17 and Figure 18), one would expect relationships that link solute additions in alloys and their phases. In actual fact, this is the case. The concentrations of Ti, Al or W in the bcc solid solution(s) in RM(Nb)ICs increase with the Ti, Al or W concentrations in the alloy (e.g., Figure 19b and [1]). As Ti partitions to the solid solution, it “pulls” with it Al and Cr (Figure 19c,d and [40]) and “pushes away” W [19,25,41]. The changes of the solute concentrations in the alloy and its solid solution(s) are associated with changes in parameters (e.g., Figure 17a, Figure 18a,b and Figure 19a) and properties of the solid solution (e.g., Figure 12 and Figure 13).
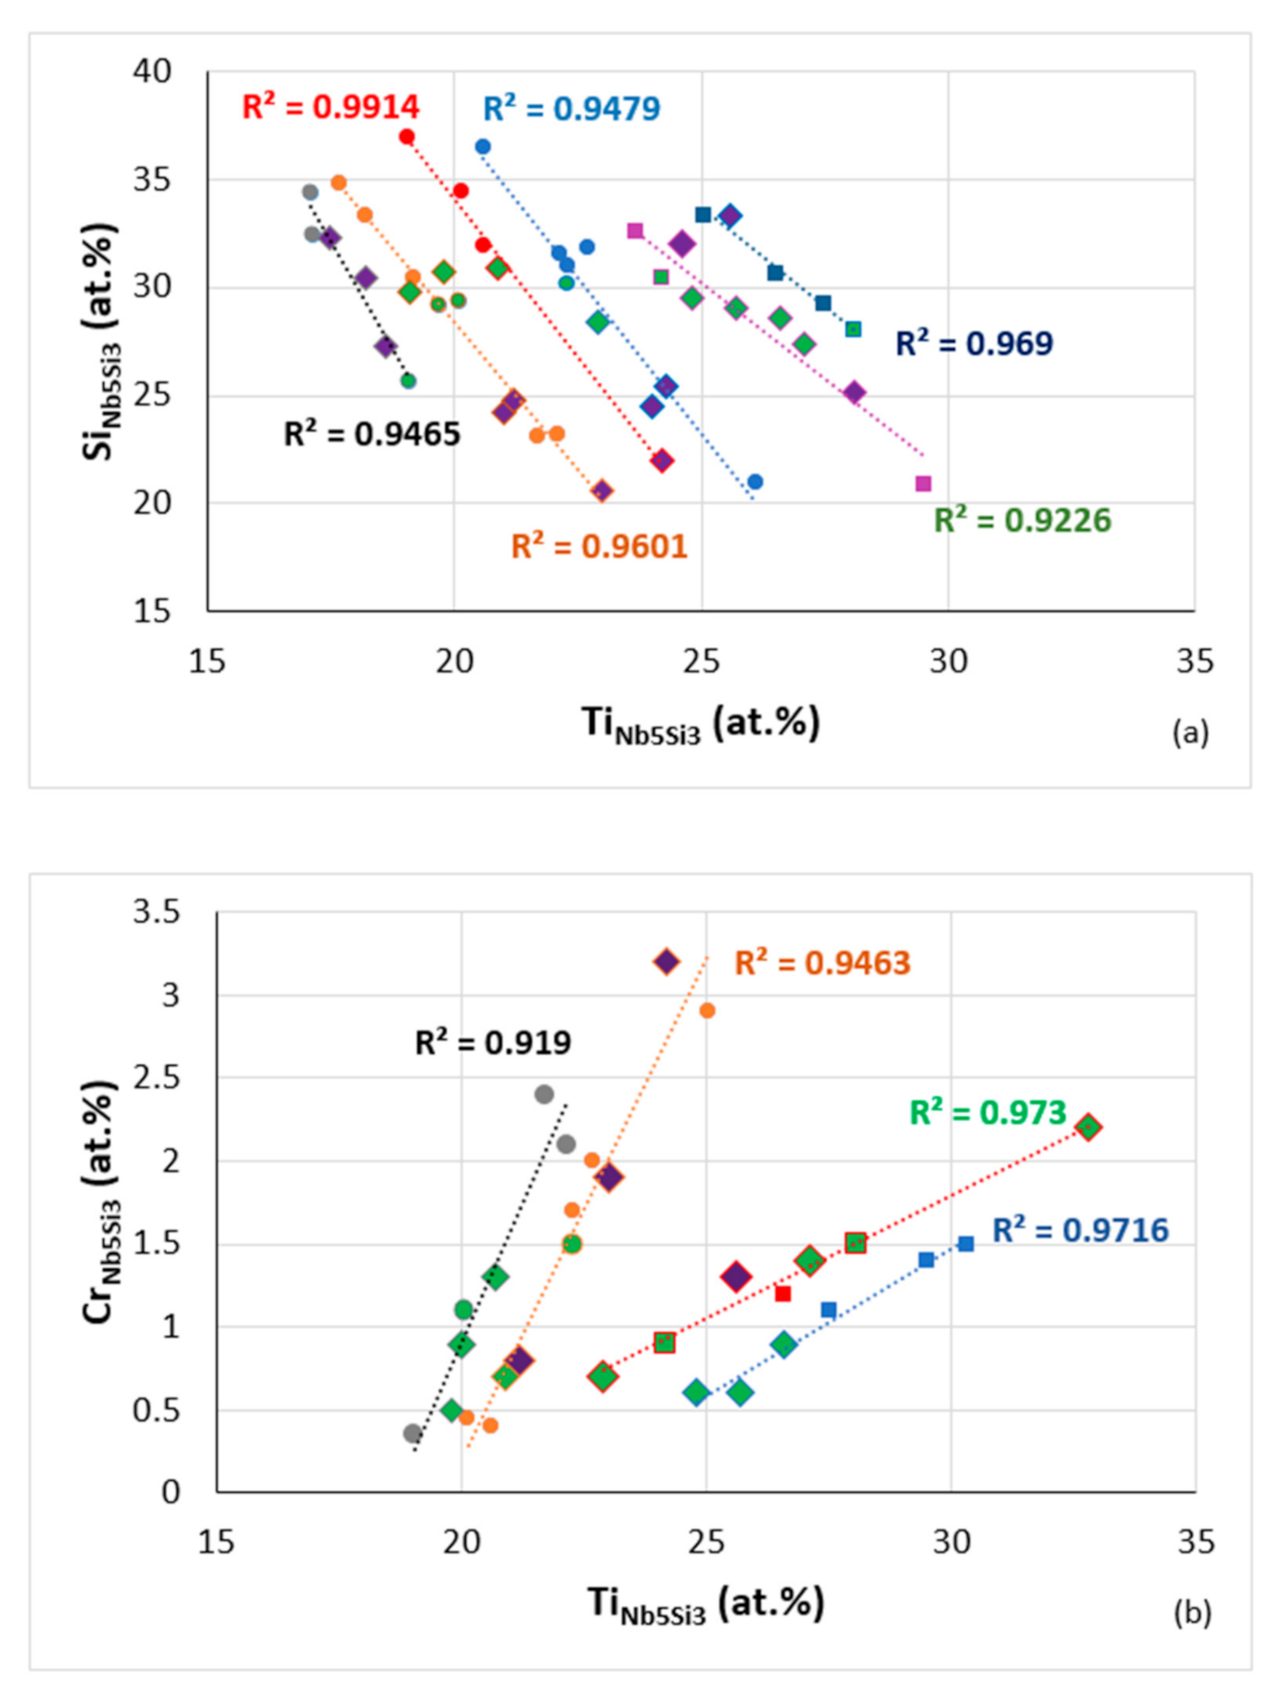
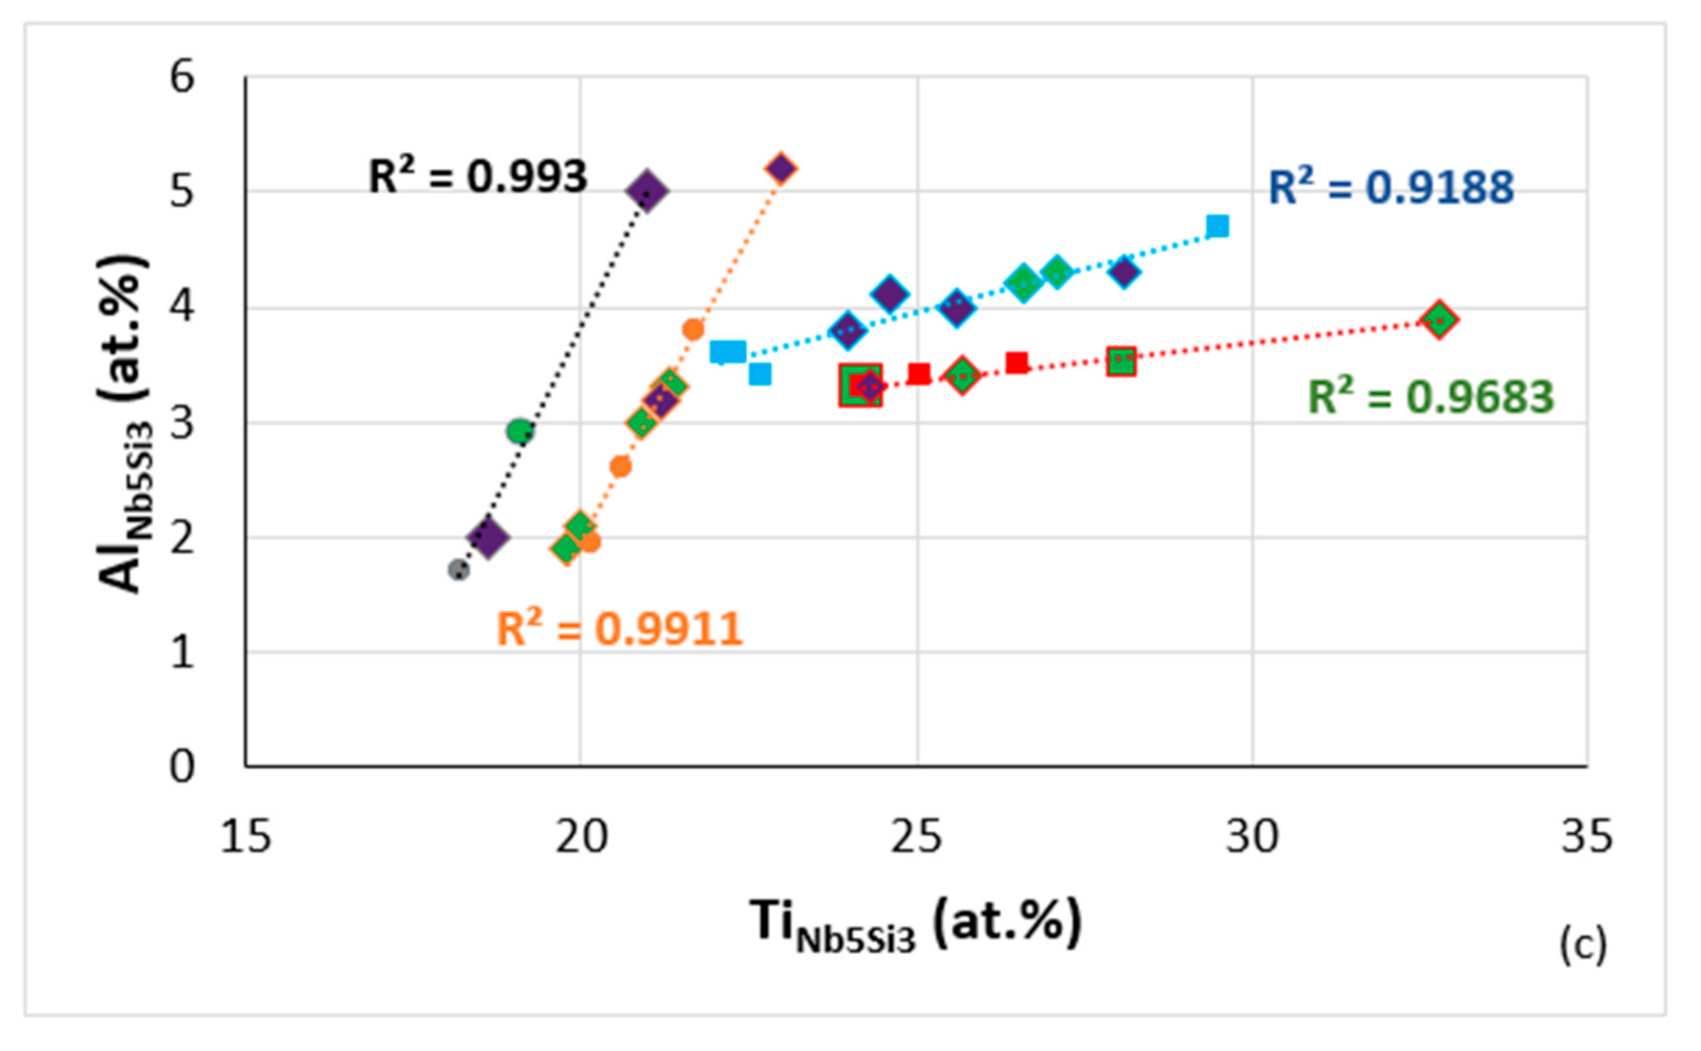
In the same way, as there are relationships between parameters and solutes in the bcc solid solution in RM(Nb)ICs and RCCAs (Figure 19a), and between solutes in the solid solution (Figure 19b,d), there are relationships between solutes in Nb5Si3 and ΔχNb5Si3 (Figure 2 in [9] for B, Ge and Sn), between TiNb5Si3 and B, Ge, Sn (Figure 1 in [9]), Al and Si in Nb5Si3 (Figure 8 in [42]), between Hf and Nb in Nb5Si3 (Figure 8 in [42]). Figure 20 shows data for Al, Cr and Si in Nb5Si3. Note that this figure includes data for RM(Nb)ICs that are also RCCAs. Furthermore, note that, as was the case for the bcc solid solution, the data for RCCAs follows the same trend as that for RM(Nb)ICs (remember that Ti “pulls” with it Hf in Nb5Si3). The changes of the solute concentrations in the alloy and its 5–3 silicide are associated with changes in parameters (e.g., Figure 17b and Figure 18c) and properties of the silicide (Figure 14).
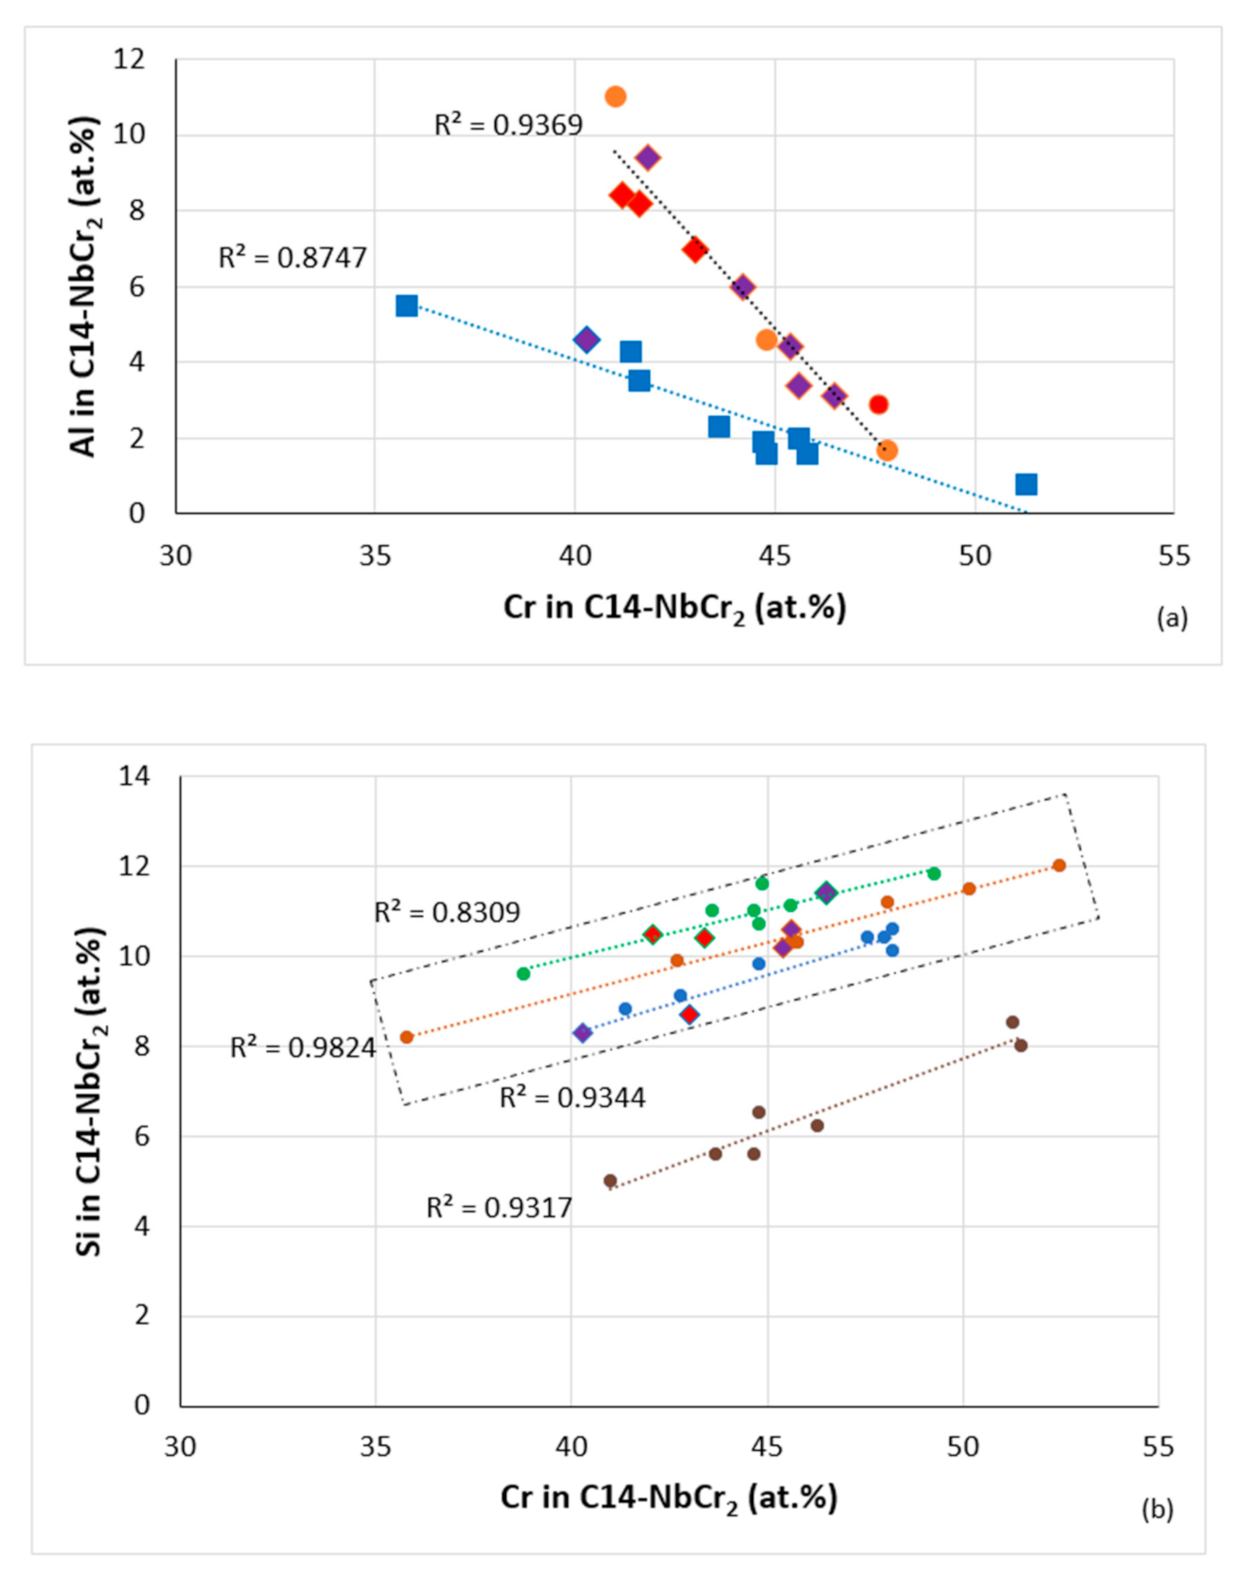
In addition, there exist relationships between solutes in the C14-NbCr2 Laves phase that can form in RM(Nb)ICs and RM(Nb)ICs-RCCAs. Figure 21 shows such relationships for Al and Si. Note that data for Laves phase in oxidized alloys are also included in this figure. As the Cr concentration in the Laves increases, the concentrations of Al and Si, respectively, decrease and increase. The rectangular area in Figure 21b indicates the range of Si and Cr concentrations in C14-NbCr2 Laves with upper (R2 = 0.8309) and lower (R2 = 0.9344) bands for RM(Nb)ICs and RM(Nb)ICs-RCCAs with RM = Mo,Nb,Ta,W, TM = Cr,Hf,Ti and SM-Met = Al,Ge,Si,Sn. The changes in solute concentrations in the Laves phase result in changes of its parameters VECC14-NbCr2 and ΔχC14-NbCr2 and its properties [10].

5. The Alloy Design/Selection Methodology NICE

The above-mentioned interrelationships of alloys and their phases regarding (i) alloying behavior, (ii) properties and (iii) solute concentrations are captured in the alloy design methodology NICE, the development of which was based on data for RM(Nb)ICs and was expanded to include data for RM(Nb)ICs that are also HEAs, RHEAs and RCCAs. The aforementioned parameters of alloys and their phases were calculated for those alloys for which reliable chemical analysis data (EPMA and EDS with standards) was available [1,3]. The database is updated as new data becomes available. The framework of NICE was discussed first in [1] and then in [3]. In the ref. [3] the RM(Nb)ICs that were included in [1] and the RCCAs reviewed in [13] were compared.
The choice of method and procedure in NICE was not content-neutral but closely bound with the identification of difficulties with experimental, modeling and ab-initio research [1,3,13]. The different components in the conception support and reinforce one another. Basically, NICE is a “goal-driven” alloy design approach that leads to the selection of metallic UHTMs worthy of development owing to promising oxidation or creep properties. NICE does not consider toughness. In NICE, the design of an alloy combines constraint(s), say desirable alloying elements and/or phases or RM/TM, or SM/Met ratios in the alloy (e.g., see [19,20,21,25]), with a property goal, say a creep rate (έ) target or an oxidation weight change (ΔW/A) target, e.g., [19,25,43]. The alloy design starts with the calculation of the alloy composition. This is done using the relationship between, say, έ and Δχalloy to calculate the latter and then relationships of Δχalloy with the concentration of each element i (Cialloy) are used to calculate Cialloy [1]. Clearly, elements with Cialloy < 0 cannot be present in the alloy composition. The calculated alloy composition can be consistent with an RM(Nb)IC or an RM(Nb)IC-RHEA/RCCA.
The next step is to calculate first the parameters δalloy, VECalloy, ΔHmixalloy, ΔSmixalloy and Ωalloy for the alloy composition [1] and then alloy properties, for example, room temperature strength [3] and hardness (e.g., Figure 11). From the alloy composition, one can also calculate the macrosegregation of Si (MACSi) if the alloy were to be produced using liquid route processing [19,24,25,26,34,38,42,43,44]. Then one proceeds to calculate the composition of the bcc solid solution. First, the ΔχNbss is calculated from the relationship between Δχalloy and ΔχNbss [1]. The chemical composition of the solid solution is calculated from relationships between CiNbss and ΔχNbss (there are also relationships between CiNbss and δNbss or VECNbss, e.g., Figure 18b). Properties of the solid solution, for example, hardness, are then calculated [3] (Figure 13). The solid solution is considered not to be stable in the alloy if 0.13 < ΔχNbss < 0.18 (Table 1, Figure 4). The type of solid solution, for example, Si-free Nbss, is predicted from the δNbss value. The latter is calculated from the δalloy versus δNbss relationship [1]. Si-free Nbss is predicted to be stable in the alloy if δNbss < 5 (Figure 3).
The chemical composition of intermetallic compounds is calculated following a similar approach. For example, for Nb5Si3, the ΔχNb5Si3 is calculated from the relationship between Δχalloy and ΔχNb5Si3 and then the concentration of each element i (CiNb5Si3) is calculated from relationships between CiNb5Si3 and ΔχNb5Si3 [1]. The formation or not of a eutectic with Nbss and Nb5Si3 and whether the eutectic would be Ti-rich or Ti-poor [11] can be predicted using relationships between Δχalloy and Δχeutectic [1]. Similar to the alloy and phases, properties of the eutectic, for example hardness, can be calculated (e.g., see Figure 15). The vol. % of solid solution [19,25] and other properties also can be calculated. For example, mass changes (ΔW/A) after isothermal oxidation for 100 h at 800 or 1200 °C and steady-state creep rates έ for different temperatures and stresses are calculated using relationships between the alloy parameters and ΔW/A or έ [1]. Regarding creep, for a given temperature and stress, for each of the parameters δ, Δχ or VEC, NICE calculates the steady-state creep rate έ [1] (attributed to intrinsic resistances to dislocation mobility [1,3]) and how the concentration of each alloying element affects the creep rate (e.g., Figure 22). Similarly, for oxidation resistance, NICE calculates the alloy weight change for each of the parameters δ, Δχ and VEC for isothermal oxidation at 800 °C or 1200 °C [1,3,19,25,26,27,43].
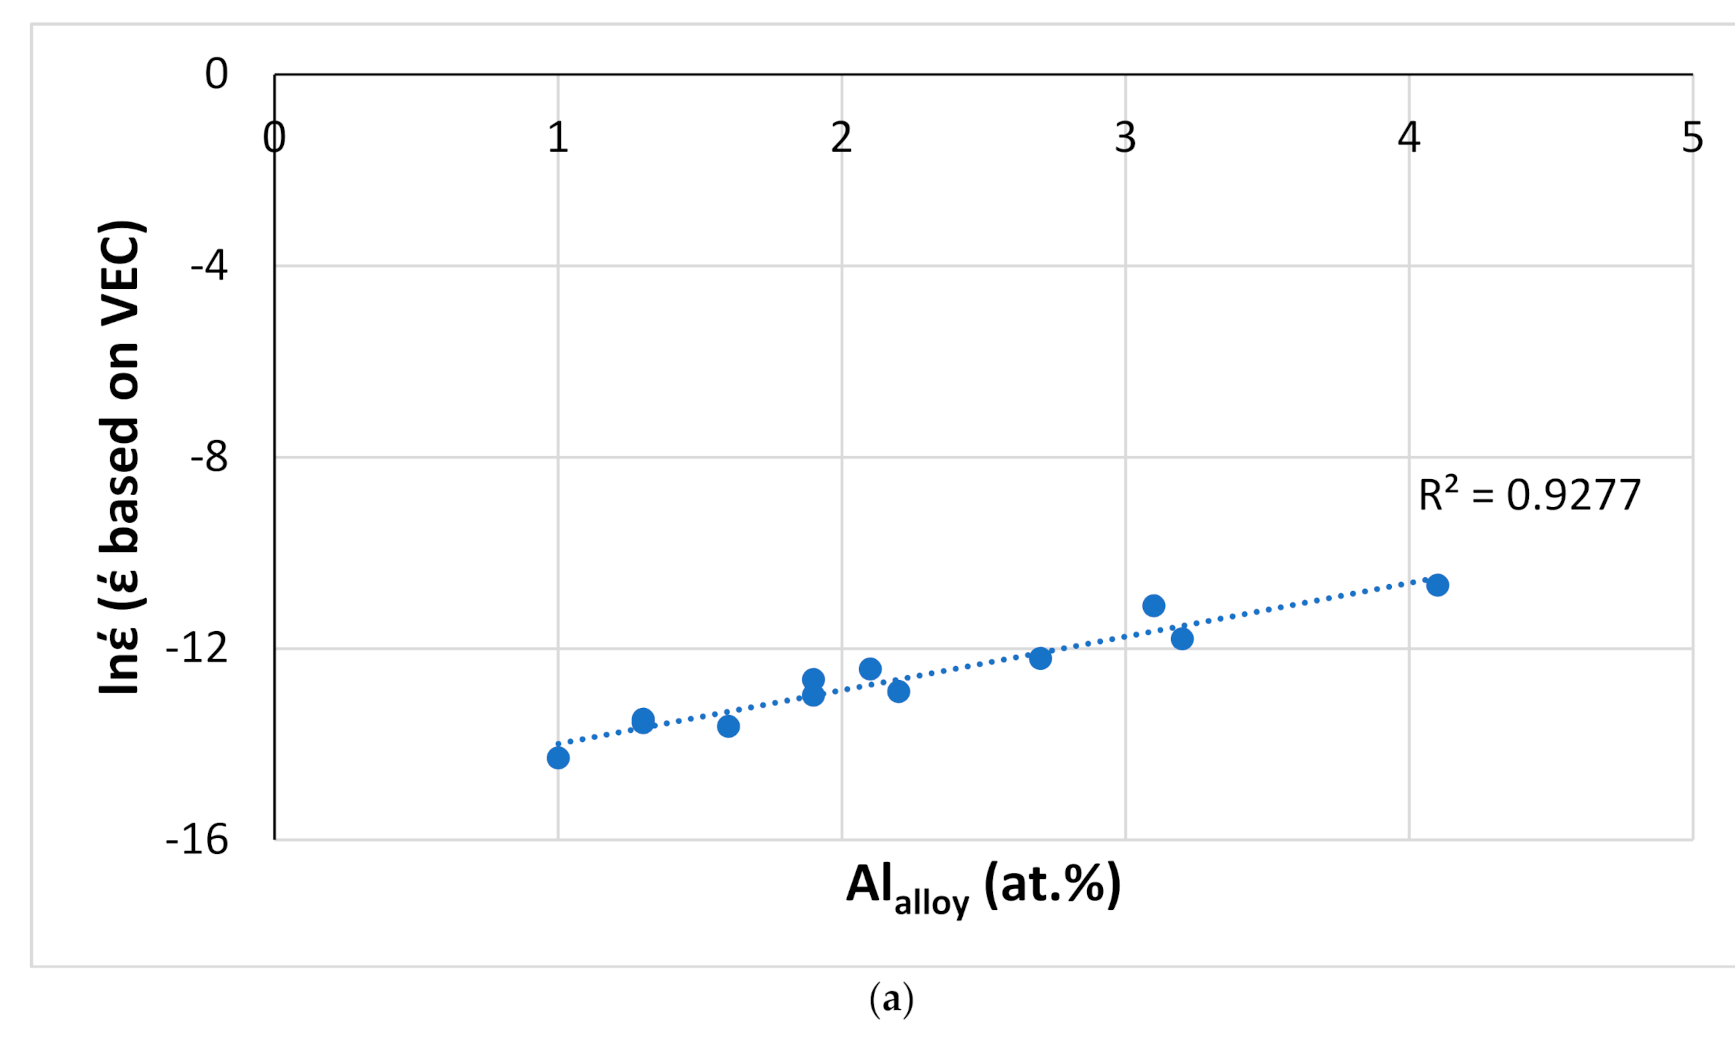
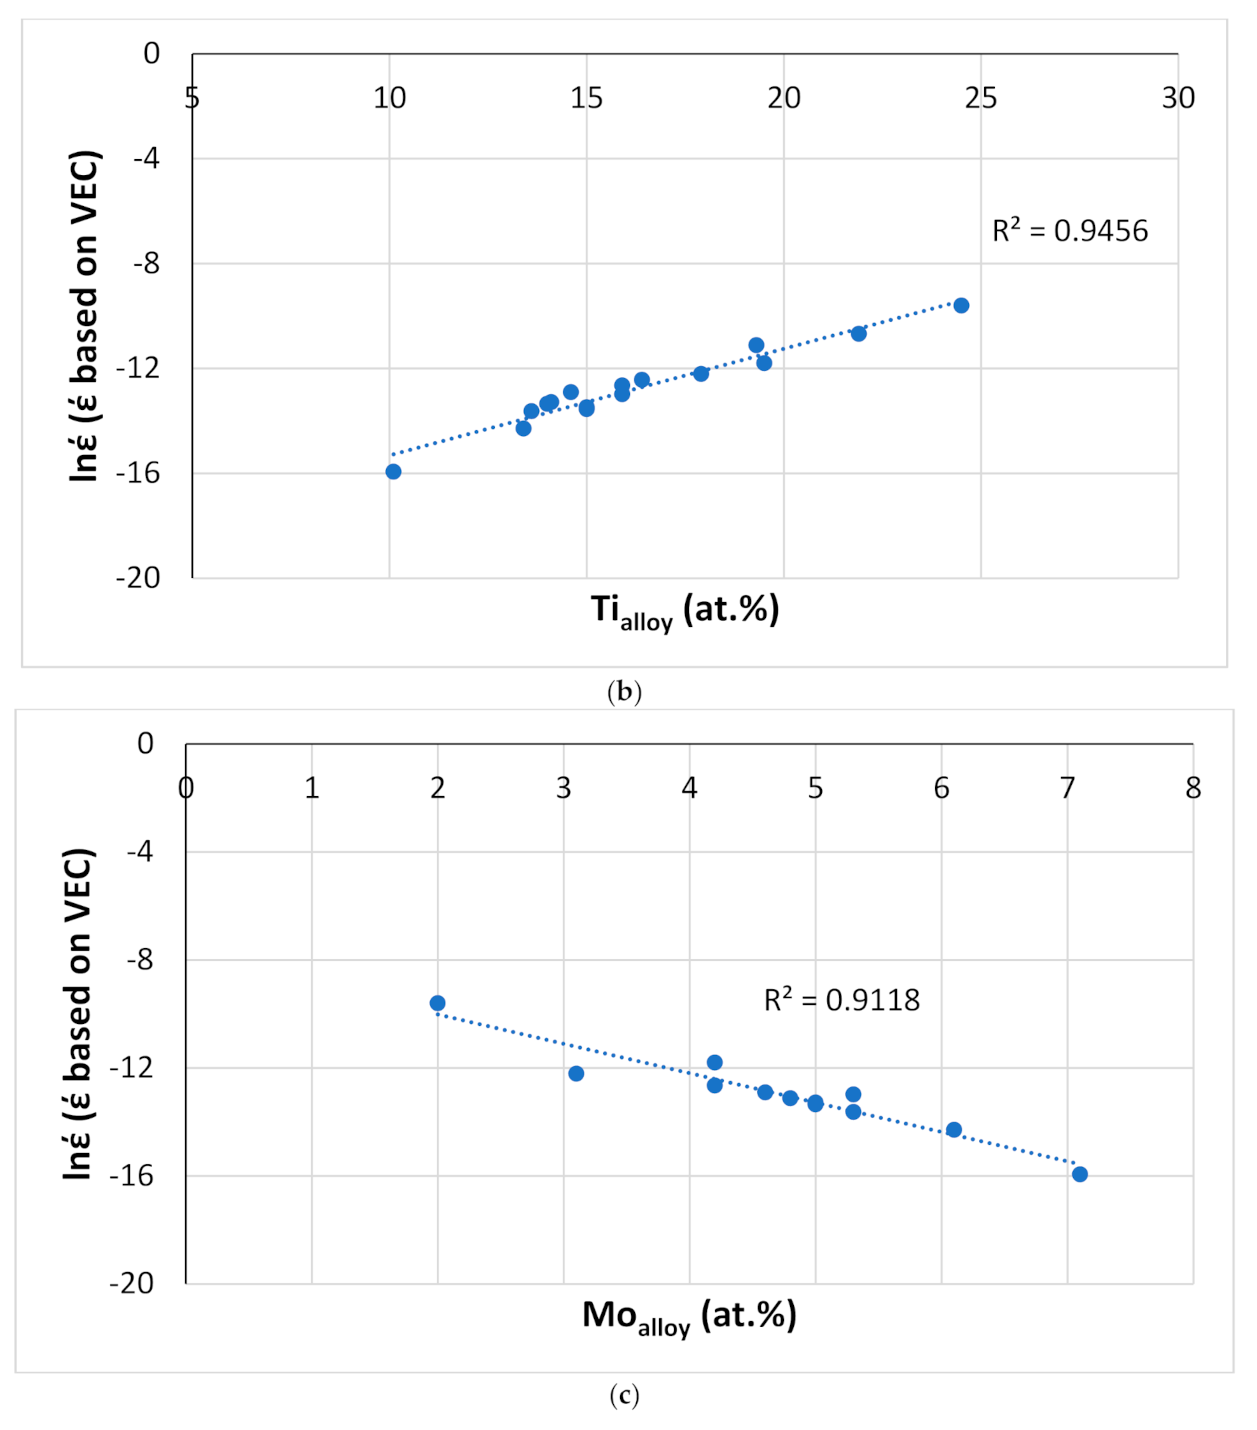
To summarize, NICE can calculate the composition of an alloy and the compositions of its solid solution(s) and intermetallic compound(s) (e.g., [19,25,43]), and can predict room temperature properties of an alloy and its phases (hardness, strength), Si macrosegregation, weight changes ΔW/A in isothermal oxidation and steady-state creep rate έ for a given temperature and stress (e.g., [3,19,21,25,27,28,34,43]). Owing to the relationships between έ or ΔW/A and Δχalloy, δalloy or VECalloy in NICE [1,3], the latter also helps the alloy designer to understand the role/importance/contribution of each of the above parameters towards achieving the property goals and the contributions alloying additions make towards oxidation or creep properties, e.g., Figure 22 and [1]. For example, increasing the concentration of Al or Ti in the alloy increases the creep rate (Figure 22a,b), whereas increasing the concentrations of Mo and Si has the opposite effect (Figure 22c,d). Al and Ti are key additions for improving oxidation, reducing alloy density [1,3] and “balancing” properties of solid solution and intermetallic compounds; Si is important for reducing density, balancing vol.% of phases and properties of solid solution(s) and intermetallic compound(s), for improving oxidation resistance and for “balancing” the mechanical properties of the alloy. Mo is a key addition for room and high-temperature strength [3], oxidation [45], creep and alloy density [3]. Obviously, the calculations/predictions of NICE about the composition of alloys and phases and properties can be verified or not experimentally [19,20,21,25,43].
The search for metallic UHTMs that meet all three property goals simultaneously may be Sisyphean [46], but the search for creep resistance or oxidation resistance or toughness does not have a Sisyphean structure i.e., it must not be endlessly laborious or futile. According to NICE, to meet the creep goal or the oxidation goal, the alloy should have, respectively, high and low VECalloy values, whereas the opposite is the case for the parameter δalloy [1,24,26,27,28,38]. (Valence electrons also play a role regarding the ductility of solid solution RCCAs [47] and the toughness of Nb-Ti-Cr solid solutions [48]). For increased creep resistance, alloy design should aim to increase the parameter Δχalloy [1]. To put this another way, NICE recommends low VECalloy to suppress pest oxidation and improve oxidation resistance at high temperatures and high VECalloy for high-temperature strength and resistance to creep. Thus, it is unlikely that RM(Nb)ICs and RM(Nb)ICs-RHEAS/RCCAs could meet both the oxidation and creep goals simultaneously. The same was concluded by Bewlay et al. for RM(Nb)ICs [49]. Consequently, it is essential for alloy developers also to consider the development of ECs to offer environmental protection to creep-resistant metallic UHTMs.
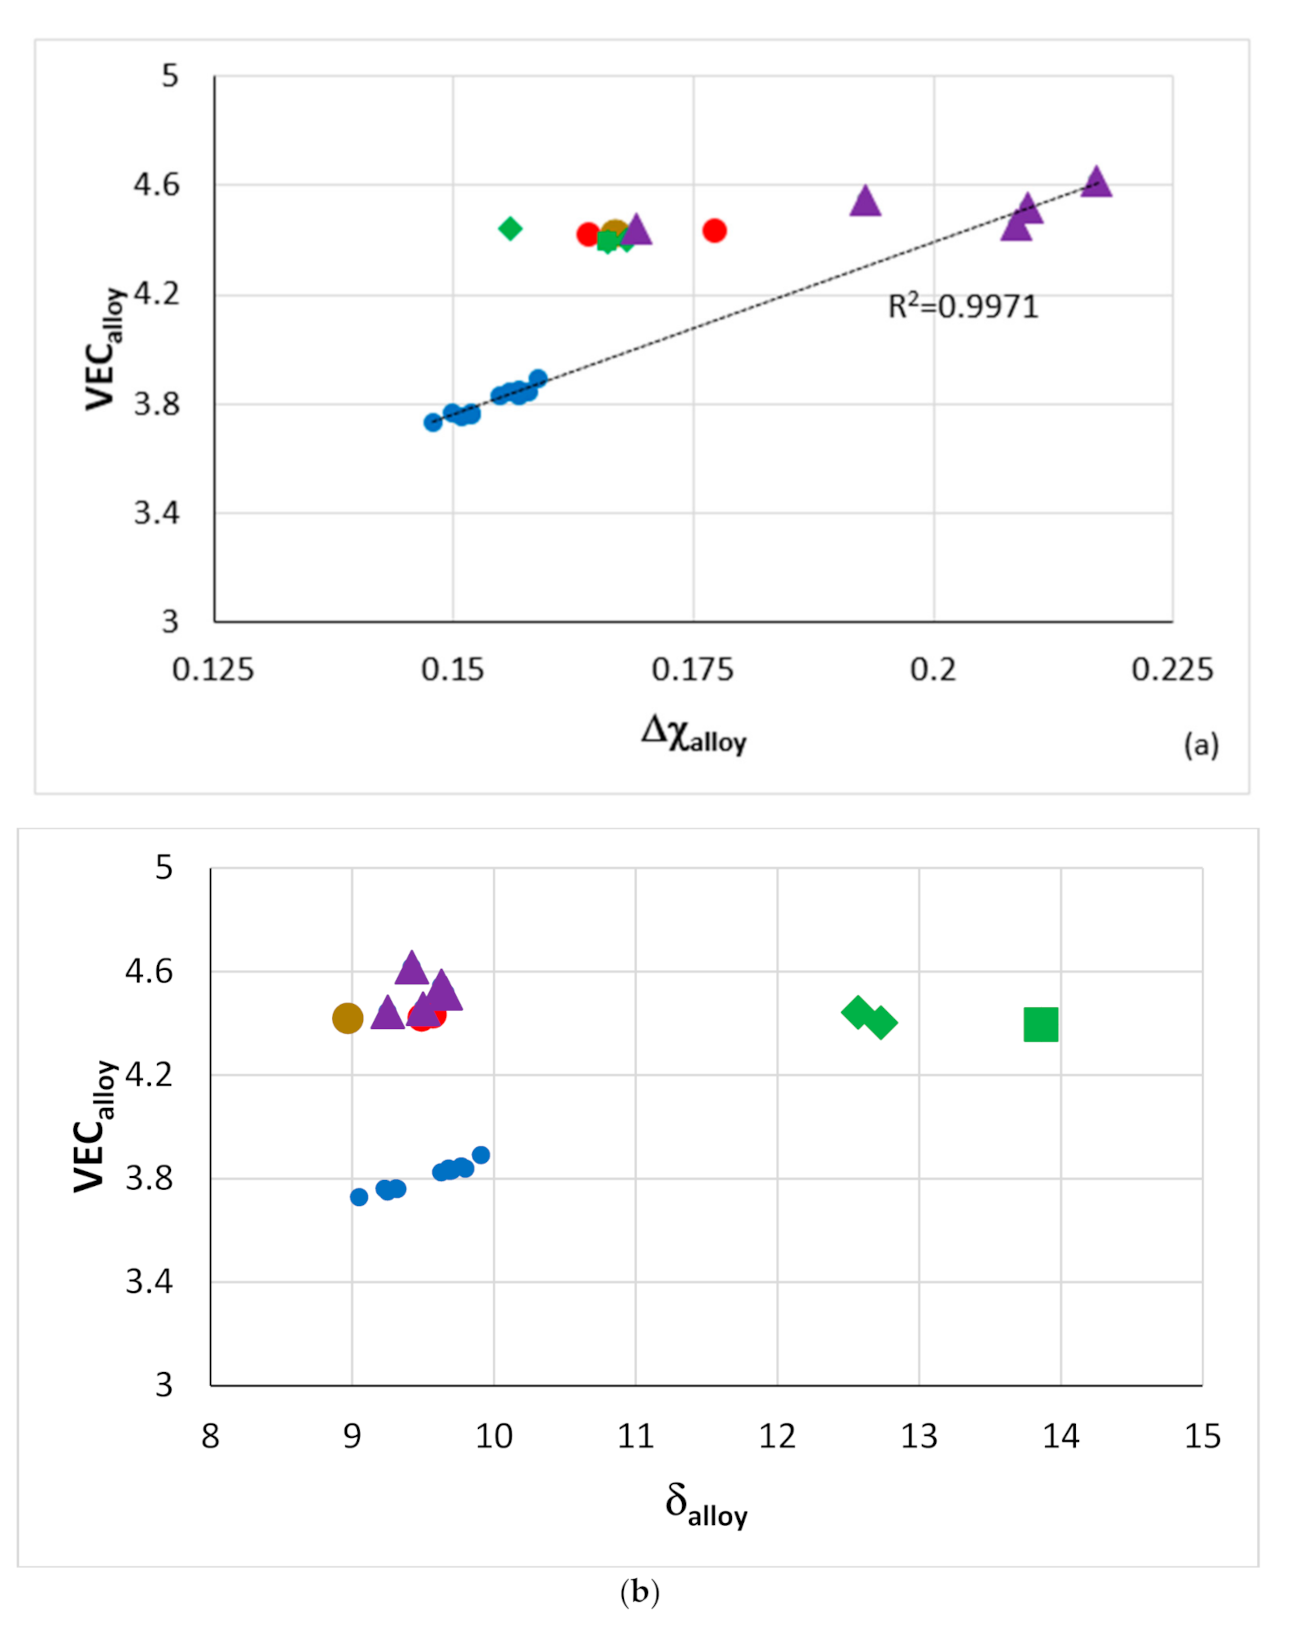
NICE can help the alloy developer to design BC alloy(s) of ECs. Indeed, NICE has been used to design alumina forming HEAs for BCs for RM(Nb)ICs, e.g., [20,21] and to construct maps for the selection of oxidation-resistant BC HEAs or intermetallic alloys, e.g., [20,21,26]. Figure 23 shows parameter maps for HEAs of the Nb-Ti-Si-Al-Hf system and RM(Nb)ICs-RHEAs/RCCAs with/without B, or Sn or Ge or Ge + Sn or B + Sn addition, some of which belong in the Nb-Mo-W-Ti-Cr-Hf-Al-Ge-Si-Sn system (see Section 2). The B-containing alloys do not suffer from pest oxidation and scale spallation at 800 and 1200 °C [3]. Data for the weight change ΔW/A of the B-free RM(Nb)ICs-RHEAs/RCCAs and HEAs included in Figure 23 is given in Figure 16. In Figure 23, note (i) that the B-containing RM(Nb)ICs-RHEAs/RCCAs are found in distinct different areas in the VECalloy versus δalloy and Δχalloy versus δalloy maps (Figure 23b,c), (ii) that the HEAs also are in separate areas in the three maps, (iii) that the RM(Nb)ICs-RHEAs/RCCAs with Ge + Sn addition are in distinct areas in the VECalloy versus Δχalloy and Δχalloy versus δalloy maps and (iv) the linear fit of the data (R2 = 0.9971) for the HEAs and RM(Nb)ICs-RHEAs/RCCAs, respectively of the Nb-Ti-Si-Al-Hf and Nb-Mo-W-Ti-Cr-Hf-Al-Ge-Si-Sn systems in the VECalloy versus Δχalloy map.
The above brief discussion and [1,3] show that NICE fashions comprehensive conceptions by linking the aforementioned parameters. Each one is to some extent independent, but they are also “in line with” one another’s requirements to form a coherent whole. NICE shapes and is shaped by the idea of alloy design, and its rational procedures are ratified by the satisfactory results they deliver. We need to distinguish two main ideas (“theses”) about the relationships between data and NICE, (i) the relevant data about the alloying behavior of alloys and their phases is necessary for NICE and (ii) reliable data are a necessary “constituent element” of NICE.
NICE is (a) internally consistent, (b) responsive (to a particular property or set of properties, and to the complexities of metallic UHTMs), (c) value-relative through and through (responds to needs of the designer of metallic UHTMs and is assessed in accordance with its success in doing this), (d) self-enhancing (reminds the alloy designer that its predictions are conditional and that further work remains to be done) and (e) practical (can address specific needs of the alloy designer, makes useful and helpful contributions), and (f) gives emphasis to attention to particularity (i.e., to be exact and detailed). Users of NICE become more discriminating, more confident and more reliable in their choice of alloys that are selected for further study.
I use the “metaphor of the rope” [50] to account for the capabilities (“strength”) of NICE. A rope is made of many filaments, but not a single filament goes through the rope’s entire length. It is the way the filaments overlap and their properties that give the rope its strength. Now think of NICE as a rope and the aforementioned parameters its filaments. The capability of NICE to predict room temperature strength, hardness, isothermal oxidation behavior in the pest oxidation regime and at high temperatures, and steady-state creep rates for different temperatures and stresses, and its capacity to calculate compositions of alloys and their phases are found in (results from) the overlap of the aforementioned parameters.

6. Summary and Comments About Future Research

This paper considered metallic UHTMs (excluding RM(Mo)ICs) that are under development as potential replacements of Ni-based superalloys for critical applications in aeroengines and must comply with specific property goals. The approach to creating the alloy design methodology NICE [7,8,9,10,11] was revisited.
The same phases can be present in the microstructures of RM(Nb)ICs, and RHEAs and RCCAs with Nb addition, namely solid solution(s) and intermetallics(s) such as M5Si3 silicides and Laves phases. Together with Nb, the other alloying elements essentially can be the same in these metallic UHTMs and include B, Ge or Sn.
The alloying behavior of RM(Nb)ICs, RHEAs and RCCAs can be described by the same parameters, namely Δχ, δ, VEC, ΔHmix, ΔSmix, Ω. The practicality of parameter maps inspired by NICE for describing/understanding the alloying behavior and properties of alloys and their phases was demonstrated.
The relevance of NICE for the design of RM(Nb)ICs, some of which are also RHEAs and RCCAs, was highlighted. Particular emphasis was given to the alloying additions B, Ge or Sn that are suitable for RM(Nb)ICs as well as for RHEAs and RCCAs to achieve a balance of properties. To date, RHEAs and RCCAs with B, Ge or Sn additions and with A15 compounds have not been studied outside the author’s research group.
A recommendation for the development of bond coat HEAs of the Nb-Ti-Si-Al-Hf system and RM(Nb)ICs-RHEAs/RCCAs substrates of the Nb-Mo-W-Ti-Cr-Hf-Al-Ge-Si-Sn system that was made in [19,20,21] was highlighted in this paper. It was proposed that future research could investigate the effects of B, Ge or Sn additions on the properties of metallic UHTMs.
In my opinion, the present state of understanding of metallic UHTMs may reflect either the scarcity of key data, for example, how contamination by interstitial elements affects phase equilibria or mechanical properties [3,13] or information overload that may actually inhibit the conversion of information into knowledge and the reflection required to acquire understanding [3].
The creative practices of the international materials science and engineering community have stimulated technological innovation in metallic UHTMs, namely RMICs and RHEAs/RCCAs. Our thinking is formed not purely in the laboratory but also through discussions with an extensive circle of research colleagues and many hours of reading each other’s work. Collaboration between the research groups that strive for the same thing in different ways within the technological context of their time can be powerful. Efforts to match capabilities to challenges and collaboration between laboratories infused with innovative thinking should be encouraged. Researchers should take inspiration from each other’s practice. They observe, record, and act from different perspectives with the same goals and through different means—complementary perspectives perhaps, but sometimes divergent, answering to competing pulls of subjectivity and objectivity [3]. They must point to new research questions to seek a comprehensive understanding of the new materials and motivate new research for the provision of answers. The big picture emerges from the small details, from what we say to each other and what has come from this dialog.
I hope that in this paper and in the refs [1,3], I have shown by my account of NICE as much as by what it does succeed in doing, how hard and yet how exciting it is to study refractory metal alloys.

Funding

This work was supported by the University of Sheffield, Rolls-Royce Plc and EPSRC (EP/H500405/1, EP/L026678/1).

Institutional Review Board Statement

Not applicable.

Informed Consent Statement

Not applicable.

Data Availability Statement

No new data were created or analyzed in this study.

Acknowledgments

The support of this work by the University of Sheffield, Rolls-Royce Plc and EPSRC (EP/H500405/1, EP/L026678/1) and discussions with all the members (current and past) of the research group and with partners in the EU-F5 ULTMAT project are gratefully acknowledged.

Conflicts of Interest

No conflict of interest.

Appendix A

δ = 100 n = 1 n c i ( 1 r i r ¯ ) 2
Δ χ = n = 1 n c i ( χ i χ ¯ ) 2
VEC = n = 1 n c i ( VEC )
r ¯ = n = 1 n c i r i
χ ¯ = n = 1 n c i χ i
Δ H mix = i = 1 , j 1 n Π ij c i c j
Π ij = 4 Δ mix AB
Δ S mix = R i = 1 n c i ln c i
T m = i = 1 n c i T m i
where ci, ri, χi, (VEC)i and Tmi, respectively, are atomic percentage, atomic radius, Pauling electronegativity, VEC and melting point of the ith element, Δ mix AB is the mixing enthalpy of binary liquid AB alloy and R is the gas constant.
Table A1. Alloys and their nominal compositions (at.%).
AlloyElementRef.
NbTiSiAlCrHfGeSnMoTaW
EZ8bal.2418555-5---
JG3bal.241855---2--[51]
JG6bal.2418555-52--[39]
JN1bal.2418555-----[42]
JN4bal.2020-22-56--
JZ3bal.121855155-62.5[25]
JZ3+bal.121855157.5-62.5[25]
JZ4bal.11.5184.74.514.64.95-2[19]
JZ5bal.21183.740.84.24.46.7-1.2[19]
KZ5bal.241855------[31]
KZ6bal.241855----6-[33]
OHS1bal.241855-55---[26]
YG10bal.1018--5--5-3
YG11bal.10185-5--5-3
ZF6bal.241855-5----[34]
ZF9bal.24185555----[34]

References

  1. Tsakiropoulos, P. On Nb Silicide Based Alloys: Alloy Design and Selection. Materials 2018, 11, 844. [Google Scholar] [CrossRef] [PubMed] [Green Version]
  2. Bewlay, B.P.; Jackson, M.R.; Zhao, J.-C.; Subramanian, P.R.; Mendiratta, M.G.; Lewandowski, J.J. Ultrahigh-Temperature Nb-Silicide-Based Composites. MRS Bull. 2003, 28, 646–653. [Google Scholar] [CrossRef]
  3. Tsakiropoulos, P. Alloys for application at ultra-high temperatures: Nb-silicide in situ composites. Prog. Mater. Sci. 2020, 100714. [Google Scholar] [CrossRef]
  4. Bewlay, B.P.; Jackson, M.R.; Gigliotti, M.F.X. Niobium Silicide High Temperature In Situ Composites. In Intermetallic Compounds—Principles and Practice; Wiley: New York, NY, USA, 2002; Volume 3, pp. 541–560. [Google Scholar]
  5. Jackson, M.R.; Bewlay, B.P.; Zhao, J.-C. Niobium silicide based composites resistant to low temperature pesting. U.S. patent 6,419,765 B1, 16 July 2002. [Google Scholar]
  6. Jackson, M.R.; Bewlay, B.P.; Briant, C.L. Creep resistant Nb-silicide based two phase composites. U.S. patent 6,447,623 B1, 10 September 2002. [Google Scholar]
  7. Tsakiropoulos, P. On the Nb silicide based alloys: Part I—The bcc Nb solid solution. J. Alloy. Compd. 2017, 708, 961–971. [Google Scholar] [CrossRef] [Green Version]
  8. Tsakiropoulos, P. On Nb silicide based alloys: Part II. J. Alloy. Compd. 2018, 748, 569–576. [Google Scholar] [CrossRef] [Green Version]
  9. Tsakiropoulos, P. On the Alloying and Properties of Tetragonal Nb5Si3 in Nb-Silicide Based Alloys. Materials 2018, 11, 69. [Google Scholar] [CrossRef] [Green Version]
  10. Tsakiropoulos, P. Alloying and properties of C14-NbCr2 and A15-Nb3X (X = Al, Ge, Si, Sn) in Nb-silicide based alloys. Materials 2018, 11, 395. [Google Scholar] [CrossRef] [PubMed] [Green Version]
  11. Tsakiropoulos, P. Alloying and Hardness of Eutectics with Nbss and Nb5Si3 in Nb-silicide Based Alloys. Materials 2018, 11, 592. [Google Scholar] [CrossRef] [Green Version]
  12. Tsakiropoulos, P. Alloys. U.S. patent 10,227,680 B2, 12 March 2019. [Google Scholar]
  13. Senkov, O.N.; Miracle, D.B.; Chaput, K.J.; Couzinie, J.-P. Development and exploration of refractory high entropy alloys—A review. J. Mater. Res. 2018, 33, 3092–3128. [Google Scholar] [CrossRef] [Green Version]
  14. Berczik, D.M. Method for enhancing the oxidation resistance of a molybdenum alloy, and a method of making a molybdenum alloy. US Patent No. 5,595,616 A, 21 January 1997. [Google Scholar]
  15. Berczik, D.M. Oxidation resistant molybdenum alloy. US Patent No. 5,693,156 A, 2 December 1997. [Google Scholar]
  16. Schneibel, J.H. High temperature strength of Mo-Mo3Si-Mo5SiB2 molybdenum silicides. Intermetallics 2013, 11, 625–632. [Google Scholar] [CrossRef]
  17. Heilmaier, M.; Krüge, M.; Saage, H.; Rösler, J.; Mukherji, D.; Glatzel, U.; Völkl, R.; Hüttner, R.; Eggler, G.; Somsen, C.; et al. Metallic materials for structural applications beyond nickel-based superalloys. JOM 2009, 61, 61–67. [Google Scholar] [CrossRef]
  18. Pan, K.; Yang, Y.; Wei, S.; Wu, H.; Dong, Z.; Wu, Y.; Wang, S.; Zhang, L.; Lin, J.; Mao, X. Oxidation behaviour of Mo-Si-B alloys at medium-to-high temperatures. J. Mater. Sci. Technol. 2021, 60, 113–127. [Google Scholar] [CrossRef]
  19. Zhao, J.; Utton, C.; Tsakiropoulos, P. On the Microstructure and Properties of Nb-18Si-6Mo-5Al-5Cr-2.5W-1Hf Nb-Silicide Based Alloys with Ge, Sn and Ti Additions (at.%). Materials 2020, 13, 4548. [Google Scholar] [CrossRef]
  20. Ghadyani, M.; Utton, C.; Tsakiropoulos, P. Microstructure and isothermal oxidation of the alumina scale forming Nb1.7Si2.4Ti2.4Al3Hf0.5 and Nb1.3Si2.4Ti2.4Al3.5Hf0.4 alloys. Materials 2019, 12, 222. [Google Scholar] [CrossRef] [PubMed] [Green Version]
  21. Ghadyani, M.; Utton, C.; Tsakiropoulos, P. Microstructure and isothermal oxidation of the alumina scale forming Nb1.45Si2.7Ti2.25Al3.25Hf0.35 and Nb1.35Si2.3Ti2.3Al3.7Hf0.35 alloys. Materials 2019, 12, 759. [Google Scholar] [CrossRef] [Green Version]
  22. Einstein, A. Cosmic Religion: With Other Opinions and Aphorisms; Covici-Friede: New York, NY, USA, 1931. [Google Scholar]
  23. Zhang, Y.; Zhou, Y.J.; Lin, J.P.; Chen, G.L.; Liaw, P.K. Solid-Solution Phase Formation Rules for Multi-component Alloys. Adv. Eng. Mater. 2008, 10, 534–538. [Google Scholar] [CrossRef]
  24. Hernández-Negrete, O.; Tsakiropoulos, P. On the Microstructure and Isothermal Oxidation at 800, 1200, and 1300 °C of the Al-25.5Nb-6Cr-0.5Hf (at %) Alloy. Materials 2019, 12, 2531. [Google Scholar] [CrossRef] [Green Version]
  25. Zhao, J.; Utton, C.; Tsakiropoulos, P. On the Microstructure and Properties of Nb-12Ti-18Si-6Ta-5Al-5Cr-2.5W-1Hf (at.%) Silicide-Based Alloys with Ge and Sn Additions. Materials 2020, 13, 3719. [Google Scholar] [CrossRef] [PubMed]
  26. Hernández-Negrete, O.; Tsakiropoulos, P. On the Microstructure and Isothermal Oxidation at 800 and 1200 °C of the Nb-24Ti-18Si-5Al-5Cr-5Ge-5Sn (at.%) Silicide-Based Alloy. Materials 2020, 13, 722. [Google Scholar] [CrossRef] [Green Version]
  27. Li, Z.; Tsakiropoulos, P. The Effect of Ge Addition on the Oxidation of Nb-24Ti-18Si Silicide Based Alloys. Materials 2019, 12, 3120. [Google Scholar] [CrossRef] [PubMed] [Green Version]
  28. Hernández-Negrete, O.; Tsakiropoulos, P. On the Microstructure and Isothermal Oxidation of Silica and Alumina Scale Forming Si-23Fe-15Cr-15Ti-1Nb and Si-25Nb-5Al-5Cr-5Ti (at.%) Silicide Alloys. Materials 2019, 12, 1091. [Google Scholar] [CrossRef] [PubMed] [Green Version]
  29. Hernández-Negrete, O.; Tsakiropoulos, P. On the Microstructure and Isothermal Oxidation of the Si-22Fe-12Cr-12Al-10Ti-5Nb (at.%) Alloy. Materials 2019, 12, 1806. [Google Scholar] [CrossRef] [Green Version]
  30. Guo, S.; Liu, C.T. Phase stability in high entropy alloys: Formation of solid-solution phase or amorphous phase. Prog. Nat. Sci. Mater. Int. 2011, 21, 433–446. [Google Scholar] [CrossRef] [Green Version]
  31. Zelenitsas, K.; Tsakiropoulos, P. Study of the role of Cr and Al additions in the microstructure of Nb-Ti-Si in situ composites. Intermetallics 2005, 13, 1079–1095. [Google Scholar] [CrossRef]
  32. Grammenos, I.; Tsakiropoulos, P. Study of the role of Hf, Mo and W additions in the microstructure of Nb–20Si silicide based alloys. Intermetallics 2011, 19, 1612–1621. [Google Scholar] [CrossRef]
  33. Zelenitsas, K.; Tsakiropoulos, P. Study of the role of Ta and Cr additions in the microstructure of Nb-Ti-Si-Al in situ composites. Intermetallics 2006, 14, 639–659. [Google Scholar] [CrossRef]
  34. Li, Z.; Tsakiropoulos, P. On The Microstructures and Hardness of The Nb-24Ti-18Si-5Al-5Cr-5Ge and Nb-24Ti-18Si-5Al-5Cr-5Ge-5Hf (at.%) Silicide Based Alloys. Materials 2019, 12, 2655. [Google Scholar] [CrossRef] [Green Version]
  35. Pugh, S. XCII. Relations between the elastic moduli and the plastic properties of polycrystalline pure metals. Lond. Edinburgh Dublin Philos. Mag. J. Sci. 1954, 45, 823–843. [Google Scholar] [CrossRef]
  36. Li, Z.; Tsakiropoulos, P. Study of the effect of Ti and Ge in the microstructure of Nb-24Ti-18Si-5Ge in situ composite. Intermetallics 2011, 19, 1291–1297. [Google Scholar] [CrossRef]
  37. Li, Z.; Tsakiropoulos, P. Study of the effect of Cr and Ti additions in the microstructure of Nb–18Si–5Ge based in-situ composites. Intermetallics 2012, 26, 18–25. [Google Scholar] [CrossRef]
  38. Xu, Z.; Utton, C.; Tsakiropoulos, P. A Study of the Effect of 5 at.% Sn on the Micro-Structure and Isothermal Oxidation at 800 and 1200 °C of Nb-24Ti-18Si Based Alloys with Al and/or Cr Additions. Materials 2020, 13, 245. [Google Scholar] [CrossRef] [Green Version]
  39. Geng, J.; Tsakiropoulos, P.; Shao, G. A study of the effects of Hf and Sn additions on the microstructure of Nbss/Nb5Si3 based in situ composites. Intermetallics 2007, 15, 69–76. [Google Scholar] [CrossRef]
  40. Tsakiropoulos, P.; Zelenitsas, K.; Vellios, N. Study of the effect of Al, Cr and Sn additions on the microstructure and properties of Nb silicide based alloys. MRS Proc. 2011, 1295. [Google Scholar] [CrossRef]
  41. McCaughey, C.; Tsakiropoulos, P. Type of Primary Nb5Si3 and Precipitation of Nbss in αNb5Si3 in a Nb-8.3Ti-21.1Si-5.4Mo-4W-0.7Hf (at.%) Near Eutectic Nb-Silicide-Based Alloy. Materials 2018, 11, 967. [Google Scholar] [CrossRef] [Green Version]
  42. Nelson, J.; Ghadyani, M.; Utton, C.; Tsakiropoulos, P. A Study of the Effects of Al, Cr, Hf, and Ti Additions on the Microstructure and Oxidation of Nb-24Ti-18Si Silicide Based Alloys. Materials 2018, 11, 1579. [Google Scholar] [CrossRef] [PubMed] [Green Version]
  43. Zhao, J.; Utton, C.; Tsakiropoulos, P. On the microstructure and properties of Nb-12Ti 18Si-6Ta-2.5W-1Hf (at.%) silicide based alloys with Ge and Sn additions. Materials 2020, 13, 1778. [Google Scholar] [CrossRef] [Green Version]
  44. Tsakiropoulos, P. On the macrosegregation of silicon in niobium silicide based alloys. Intermetallics 2014, 55, 95–101. [Google Scholar] [CrossRef]
  45. Geng, J.; Tsakiropoulos, P.; Shao, G. Oxidation of Nb–Si–Cr–Al in situ composites with Mo, Ti and Hf additions. Mater. Sci. Eng. A 2006, 441, 26–38. [Google Scholar] [CrossRef]
  46. Sisyphus. Available online: https://www.britannica.com/topic/Sisyphus (accessed on 18 February 2021).
  47. Sheikh, S.; Shafeie, S.; Hu, Q.; Ahlström, J.; Persson, C.; Veselý, J.; Zýka, J.; Klement, U.; Guo, S. Alloy design for intrinsically ductile refractory high-entropy alloys. J. Appl. Phys. 2016, 120, 164902. [Google Scholar] [CrossRef] [Green Version]
  48. Davidson, D.L.; Chan, K.S.; Anton, D.L. The effects on fracture toughness of ductile-phase composition and morphology in Nb-Cr-Ti and Nb-Siin situ composites. Met. Mater. Trans. A 1996, 27, 3007–3018. [Google Scholar] [CrossRef]
  49. Bewlay, B.P.; Whiting, P.W.; Davis, A.W.; Briant, C.L. Creep Mechanisms in Niobium-Silicide Based In-Situ Composites. MRS Proc. 1998, 552, 1–5. [Google Scholar] [CrossRef]
  50. Wittgenstein, L. Philosophical Investigations; Blackwell: Oxford, UK, 1953. [Google Scholar]
  51. Geng, J.; Tsakiropoulos, P.; Shao, G. The effects of Ti and Mo additions on the microstructure of Nb-silicide based in situ composites. Intermetallics 2006, 14, 227–235. [Google Scholar] [CrossRef]
Figure 1. (ac) data for cubic symmetry elements in RM(Nb)ICs, (a) plot of [C11-C12]/[2B] versus Pauling electronegativity χi for Al, Fe, Ge, Mo, Nb, Si, Ta and W, (b) plot of (C11-C12)/2 versus VEC for Al, Cr, Ge, Mo, Nb, Si, Ta and W and (c) plot of C44/B for Al, Cr, Ge, Mo, Nb, Si, Ta, V and W. (d) Plot of G/B versus Pauling electronegativity for cubic and hexagonal symmetry elements, circles for Hf, Ti, Y, Zr, triangles for Al, Cr, Ge, Si and diamonds for Mo, Nb, Ta, W. (e) is the same as (d) and shows one group containing Y, Hf, Zr, Ti, Al, Cr, Si, Ge (R2 = 0.8019) and another containing Y, Hf, Zr, Ti, Ta, Nb, Mo, W (R2 = 0.7842). Note that with the exception of Fe in (a), all other elements in (ad) are used in RHEAs and RCCAs (for Ge see text) and that Al, Cr, Ge, Hf, Si, Ti improve the oxidation of RM(Nb)ICs [1]. In (a) R2 = 0.9726 if Fe were to be excluded.
Materials 14 00989 g001aMaterials 14 00989 g001b
Figure 2. Plots of ΔHmix versus VEC (a) and VEC versus δ (b). The alloys KZ5 and YG8 are in areas A and B. Alloys with Boron are only in area C. Group A alloys based on KZ5 with Nbss and Nb5Si3 with/out Laves phase, Group B alloys based on YG8 with Nbss and Nb5Si3, Group C alloys based on KZ series alloys [31,33] with B addition. There are no boron-containing alloys in areas A and B. Alloys with RMs, Al, Cr, Sn and Ge are in all three areas. The alloys KZ5 and YG8 are indicated by asterisks. For the alloys of series 2 to 8, see Table 1 in [8], where also the values of the parameters Δχ, δ, VEC, ΔHmix, ΔSmix, Ω are given.
Materials 14 00989 g002aMaterials 14 00989 g002b
Figure 3. Valence electron concentration (VEC) versus δ maps for the bcc Nbss in Nb-silicide-based alloys, (a) all data and (b) data for Si-free Nbss and for Nbss rich in Ti. In (a) the series 2 data are for Nbss with RMs and Sn and no Al, the series 3 is for Nbss with RMs, Ge and Sn and with/out Al and Cr, the series 4 is for Nbss with Al, Cr, with/out Hf, no RMs and no B, Ge, Sn, the series 5 is for Nbss with Al, B, Cr with/out Hf, the series 6 is for Nbss with Al, Cr, with/out Ge or Sn or B, the series 7 is for Nbss with RMs, with/out Al and with no B, Cr, Ge, Sn and the series 8 is for Nbss with TMs, Al with/out RMs, B or Sn and no Ge. In (b) the series 2 is for Nbss rich in Ti, and series 3 is for Si-free Nbss. RM = Mo,Ta,W, TM = Cr,Hf,Ti. For the chemical composition of the solid solutions, see Table 1 in [7]. For dashed line in (b), see text. Note that the solid solutions included in this figure belong to the alloys for which data are given in Figure 2.
Materials 14 00989 g003
Figure 4. Δχ versus delta (δ) maps for Nbss in Nb-silicide-based alloys, (a) all data and (b) data only for Si-free Nbss and Nbss rich in Ti. In (a) the series 2 data are for Nbss with RMs and Sn and no Al, the series 3 is for Nbss with RMs, Ge and Sn and with/out Al and Cr, the series 4 is for Nbss with Al, Cr, with/out Hf, no RMs and no B, Ge, Sn, the series 5 is for Nbss with Al, B, Cr with/out Hf, the series 6 is for Nbss with Al, Cr, with/out Ge or Sn or B, the series 7 is for Nbss with RMs, with/out Al and with no B, Cr, Ge, Sn and the series 8 is for Nbss with TMs, Al with/out RMs, B or Sn and no Ge. In (b) the series 2 is for Nbss rich in Ti, and series 3 is for Si-free Nbss. RM = Mo,Ta,W, TM = Cr,Hf,Ti. For the chemical composition of the solid solutions, see Table 1 in [7]. For dashed lines and ellipses, see text. Note that the solid solutions included in this figure belong to the alloys for which data are given in Figure 2.
Materials 14 00989 g004
Figure 5. Plot of VEC versus ΔHmix (a) and Δχ versus δ (b) for Nb-silicide-based alloys and their Nbss solid solutions. The dashed ellipses are for the alloys and the full ones for the Nbss solid solutions. The red ellipses are for series 2, 2a, 3, 3a, 7, 7a, where the alloying elements are refractory metals (RMs), Al, Cr, Ge, Sn, but no boron. The green ellipses are for series 4, 4a, 5, 5a, 6, 6a, 8, 8a, where the alloying elements are RMs, Ge, Hf, Sn and boron. The series 2 to 8 data are for the three types of bcc Nbss solid solutions in Table 1 in [7], and the series 2a to 8a data are for Nb silicide-based alloys in Table 1 in [8]. The series 2 and 2a data are for alloys with RMs, TMs, and Sn, but no Al, the series 3 and 3a data are for alloys with RMs, TMs, Ge and Sn and with/without Al and Cr, the series 4 and 4a data are for alloys with TMs, Al, with/without Hf, no RMs and no B, Ge, Sn, the series 5 and 5a data are for alloys with TMs, Al and B, with/without Hf, the series 6 and 6a data are for alloys with TMs, Al and with/without B, Ge, Hf and Sn, the series 7 and 7a data are for alloys with RMs, TMs with/without Al and with no B, Ge, Sn and the series 8 and 8a data are for alloys with TMs, Al with/without RMs, B or Sn and no Ge.
Materials 14 00989 g005
Figure 6. Δχ versus VEC map of Nb5Si3. Data for unalloyed Nb5Si3 (diamond), silicide where Si is substituted by Sn (brown circles) or Ge (pink circles) or B (triangle), silicide where Nb is substituted by Ti (squares) and silicide where Nb is substituted by Ti and Si by B (green circles), Sn (purple circles), Ge (red circles). Data for Nb5Si3, where Nb is substituted by TM and RM additions and Si by simple metal and metalloid elements (Al, B, Ge, Sn), can be found in [9].
Materials 14 00989 g006
Figure 7. VEC versus Δχ map for RM(Nb)ICs based on the alloy KZ5 with additions of B, Ge, Hf, Sn. RM(Nb)ICs that are also RCCAs are shown with red color. For the linear fit of all data, R2 = 0.9383. Green and red-green data: Diamonds for KZ5 + Hf + B (RM(Nb)IC-RCCA), triangle for KZ5 + B + Sn (RM(Nb)IC-RCCA), green circle for KZ5 + B, red triangle for KZ5 + Hf + Sn (JG6-RM(Nb)IC-RCCA), red circle for KZ5 + Ge + Hf (ZF9-RM(Nb)IC/RCCA). Blue data: circle for KZ5 + Ge (ZF6) and triangle for KZ5 + Hf (JN1). Data about the densities and room temperature strength of these alloys is given in [3]. Nominal compositions (at.%) of B-containing RM(Nb)ICs-RCCAs 37Nb-24Ti-18Si-6B-5Al-5Cr-5Hf, 39Nb-24Ti-18Si-6B-5Al-4Cr-4Sn. For nominal compositions of other alloys, see Appendix A Table A1.
Materials 14 00989 g007
Figure 8. Δχ versus <X> = Al + Ge + Si + Sn in A15-Nb3X where Nb is substituted by Cr, Fe, Hf, Mo, Ti or W and X = Al, Ge, Si or Sn. Squares, red Nb3Sn (Sn = 15.5 and 33.2 at.%), dark green Nb3Al (Al = 18.6 and 25 at.%) and light green Nb3Ge (Ge = 18 and 23 at.%). Diamonds for Nb substituted by Cr, Hf, Mo, Ti or W and X = Al, Ge, Si or Sn, filled circles for Nb substituted by Cr, Fe, Hf, or Ti and X = Al, Si or Sn. Linear fit of all data gives R2 = 0.7484.
Materials 14 00989 g008
Figure 9. VEC versus <X> = Al + Ge + Si + Sn in A15-Nb3X, where Nb is substituted by Cr, Fe, Hf, Mo, Ti or W and X = Al, Ge, Si or Sn. Squares, red Nb3Sn (Sn = 15.5 and 33.2 at.%), dark green Nb3Al (Al = 18.6 and 25 at.%) and light green Nb3Ge (Ge = 18 and 23 at.%), pink for Nb substituted by Cr, Hf, Mo, Ti or W and X = Al, Ge, Si or Sn. Diamonds for Nb substituted by Cr, Hf or Ti and X = Al, Si or Sn, Filled circles, purple for Nb substituted by Cr or Hf and X = Al, Si or Sn, orange for Nb substituted by Cr, Fe, Hf or Ti, and X = Al, Si or Sn. Note the gap of VEC values (from 4.628 to 4.721) for alloyed Nb3X, and that data point for Sn rich Nb3Sn falls in this gap.
Materials 14 00989 g009
Figure 10. (a,b) show maps of Δχ versus VEC. In (a), the data are for the Nbss (blue triangles), Nb5Si3 (green diamonds), C14-NbCr2 Laves (purple diamonds) and A15-Nb3X (red diamonds) phases, and the boron-containing Nbss and Nb5Si3 are shown in light blue and light green. In (b), the data are for the Nbss (blue triangles), Nb5Si3 (green diamonds), eutectics with Nbss and Nb5Si3 (orange circles), C14-NbCr2 Laves (purple diamonds) and A15-Nb3X (red diamonds) phases. The data for the bcc solid solution RCCAs studied by Senkov et al. [13], and HEA Nbss and HEA Nbss and Nb5Si3 eutectics in RM(Nb)ICs that satisfy the “standard definition” of HEAs fall in the area of the solid solution and eutectics data in (b), as shown in Figure 16 in [3]. Note that both parts of this figure are the same as those in Figure 5 in [1], in which by mistake, the labels for the A15-Nb3X and C14-NbCr2 phases were swapped.
Materials 14 00989 g010
Figure 11. Vickers hardness of RM(Nb)ICs based on the alloy KZ5, some of which are also RCCAs (red data). Diamonds for alloys with B addition, square for RCCA with Sn addition and triangle for RCCA with Ge addition. (a) HValloy versus (ΔHmix)alloy, the linear fit of all data gives R2 = 0.9554, and only of the RCCAs gives R2 = 0.9711. Alloying elements Al, B, Cr, Ge, Hf, Mo, Nb, Si, Sn, Ti, alloys JN1, JN4, ZF6, ZF9, EZ8, KZ5 + B, KZ5 + Hf + B, (b) HValloy versus (ΔSmix)alloy, alloying elements Al, B, Cr, Ge, Hf, Mo, Nb, Si, Ti, W, alloys KZ5, ZF9, KZ5 + B, KZ5 + Hf + B, YG10, YG11, (c) HValloy versus Δχalloy, alloying elements Al, B, Cr, Hf, Mo, Nb, Si, Sn, Ti, Ta, alloys KZ6, JG3, JN4, KZ5 + Mo + B, KZ5 + B, KZ6 + B, KZ5 + Hf + B, (d) HValloy versus VECalloy, alloying elements Al, B, Cr, Ge, Hf, Mo, Nb, Si, Sn, Ti, Ta, alloys KZ5 + B, KZ5 + Hf + B, EZ8, ZF9, KZ5, JN1, ZF6, KZ6. Note that all the data in (d) can be fitted to a parabolic function with R2 = 0.9101 and maximum near the HV and VEC values of the alloy ZF6 (Nb-24Ti-18Si-5Al-5Cr-5Ge [34]). For nominal alloy compositions, see Appendix A Table A1.
Materials 14 00989 g011aMaterials 14 00989 g011b
Figure 12. Pugh’s ratio G/B of Nbss in boron-free RM(Nb)ICs with/without Ti addition versus (a) δss and (b) Δχss. Data for Si-free Nbss and Ti-rich Nbss is shown in red and green, respectively. All data R2 = 0.9257 and R2 = 0.7046, in (a,b), respectively. The G/B ratio was calculated using the rule of mixtures, data for G and B for the elements and the actual composition of solid solutions. Alloying elements Al, Cr, Ge, Hf, Mo, Nb, Si, Ta, Ti, W.
Materials 14 00989 g012aMaterials 14 00989 g012b
Figure 13. Vickers hardness of solid solutions in RM(Nb)ICs versus the parameters (a) Ωss, (b) (ΔHmix)ss and (c) Δχss. The red data in (ac) is for alloying elements Al, Cr, Ge, Hf, Mo, Nb, Si, Sn, Ti or W. In (c), the data for which liner fit gives R2 = 0.6905 (blue line) is for alloying elements Al, B, Cr, Hf, Mo, Nb, Si, Sn, Ta, Ti or W. In (c) the data for the Nbss that belongs in RM(Nb)ICs that are also RCCAs is shown by green diamonds and is for alloys with B addition.
Materials 14 00989 g013aMaterials 14 00989 g013b
Figure 14. Vickers hardness of alloyed Nb5Si3 versus VEC. (a) Boron-free RM(Nb)ICs, triangles and squares with Ge or Sn addition, respectively, (b) boron-containing RM(Nb)ICs (diamonds), of which those that also are RHEAS and RCCAs are shown in red.
Materials 14 00989 g014
Figure 15. Vickers hardness of eutectics with Nbss and Nb5Si3 in Ti-free RM(Nb)ICs with alloying elements (a) Al, Cr, Ge, Hf, Nb, Si, Sn and (b) Cr, Ge, Hf, Nb, Si, Sn.
Materials 14 00989 g015
Figure 16. Data for the weight change in isothermal oxidation in air at 1200 °C of RM(Nb)ICs that are also RCCAs (data from Table 4 in [19]). Red squares for alloys where scale spalls off. Note that only the alloys EZ8, OHS1, JG6 and ZF9 are based on the alloy KZ5. For the nominal compositions of the alloys, see Appendix A Table A1.
Materials 14 00989 g016
Figure 17. Relationships between parameters of alloys and phases. (a) VECss versus VECalloy [1], diamonds for RM(Nb)ICs that are also RCCAs, green data for alloys with B, alloying elements Al, B, Cr, Ge, Hf, Mo, Nb, Si, Sn, Ti or W, (b) VECalloy versus VECNb5Si3, circles RM(Nb)ICs, green data alloys with B, diamonds for RM(Nb)ICs that are also RCCAs, alloying elements Al, B, Cr, Ge, Hf, Nb, Si, Sn or Ti, (c) Δχeutectic versus Δχalloy for eutectics with Nbss and Nb5Si3, alloying elements Al, Cr, Ge, Hf, Mo, Nb, Si, Sn, Ti or W.
Materials 14 00989 g017
Figure 18. Relationships between alloy or phase parameters and solute concentrations in RM(Nb)IC and RCCAs alloys with Ti/Si < 1 and Ti/Si > 1 [3] and their phases. (a) Alalloy versus VECalloy, orange line (R2 = 0.9471) with green diamonds for alloys with B, green and red data points for RM(Nb)ICs that are also RCCAs, alloying elements Al, B, Cr, Ge, Hf, Mo, Nb, Si, Sn, Ta, Ti or W, blue line (R2 = 0.8396) for alloying elements Al, Cr, Ge, Hf, Mo, Nb, Si, Sn, Ta, Ti or W, (b) VECss versus Alss, orange line (R2 = 0.9392) for alloying elements Al, B, Cr, Ge, Hf, Mo, Nb, Si, Sn, Ti, V or W, diamonds for B-containing RM(Nb)ICs that are also RCCAs, blue line (R2 = 0.9013) for alloying elements Al, B, Cr, Ge, Hf, Mo, Nb, Si, Sn, Ta, Ti, or W, circles for RM(Nb)ICs, diamonds for RM(Nb)ICs that are also RCCAs, green color for B-containing alloys, (c) VECNb5Si3 versus the concentration of Hf in Nb5Si3, green circle for Ti rich Nb5Si3, blue circle for normal Nb5Si3, for all data R2 = 0.8853, diamonds for RM(Nb)ICs that are also RCCAs, green diamonds for B-containing alloys, alloying elements Al, B, Cr, Ge, Hf, Nb, Si, Sn, Ti, linear fit for data for RM(NB)ICs that are also RCCAS has R2 = 0.9209. For the rectangular area in (a), see text.
Materials 14 00989 g018aMaterials 14 00989 g018b
Figure 19. Data for alloys and bcc solid solutions for RM(Nb)ICs, some of which are also RCCAs (a) VECalloy versus Alss, orange line (R2 = 0.9716) with alloying elements Al, B, Cr, Hf, Mo, Nb, Si, Sn, Ta, Ti, or W, blue line (R2 = 0.9766) with alloying elements Al, B, Cr, Ge, Hf, Mo, Nb, Si, Ta, Ti or W, purple line (R2 = 0.9903) with alloying elements Al, Cr, Ge, Hf, Nb, Si, Sn, Ti or V, (b) Alalloy versus Alss, alloying elements Al, B, Cr, Ge, Hf, Mo, Nb, Si, Sn, Ta, Ti or W, (c) Tiss versus Alss with alloying elements B, Cr, Fe, Hf, Sn or Ta, (d) Tiss versus Crss with alloying elements Al, Fe, Hf, Sn, W or V. In (ac) diamonds for RM(Nb)ICs that are also RCCAs, and green colour for alloys with B.
Materials 14 00989 g019aMaterials 14 00989 g019b
Figure 20. Data for solute elements in Nb5Si3 in RM(Nb)ICs some of which are also refractory complex concentrated alloys (RCCAs) (diamonds), silicides with B addition shown in green colour, purple diamonds RCCAs with Ge or Sn or Ge + Sn, (a) Si versus Ti, R2 = 0.9465 alloying elements Al, B, Cr, Ge, Hf, Mo, Nb, Si, Sn or Ti, R2 = 0.9601 alloying elements Al, B, Cr, Ge, Hf, Mo, Nb, Si, Sn, Ta or Ti, R2 = 0.9914 alloying elements Al, B, Cr, Ge, Nb, Si, Sn, Ta or Ti, R2 = 0.9479 alloying elements Al, B, Cr, Ge, Hf, Mo, Nb, Si, Sn, Ta or Ti, R2 = 0.9226 for Ti rich Nb5Si3 alloying elements Al, B, Cr, Ge, Hf, Mo, Nb, Si, Sn, Ta or Ti, R2 = 0.969 for Ti rich Nb5Si3 alloying elements Al, B, Cr, Hf, Mo, Nb, Si, Sn, Ta or Ti, (b) Cr versus Ti, R2 = 0.919, alloying elements Al, B, Cr, Ge, Hf, Mo, Nb, Si, Sn, Ta or Ti, R2 = 0.9463, alloying elements Al, B, Cr, Ge, Hf, Mo, Nb, Si, Sn, Ta or Ti, R2 = 0.973, Ti rich Nb5Si3, alloying elements Al, B, Cr, Hf, Mo, Nb, Si, Sn, Ta or Ti, R2 = 0.9716, Ti rich Nb5Si3, alloying elements Al, B, Cr, Ge, Hf, Mo, Nb, Si, Sn, Ta or Ti, (c) Al versus Ti, R2 = 0.993, alloying elements Al, B, Cr, Ge, Hf, Mo, Nb, Si, Sn or Ti, R2 = 0.9911, alloying elements Al, B, Cr, Ge, Hf, Nb, Si, Sn, Ta or Ti, R2 = 0.9188, Ti rich Nb5Si3, alloying elements Al, B, Cr, Ge, Hf, Mo, Nb, Si, Sn, Ta or Ti, R2 = 0.9683, Ti rich Nb5Si3 alloying elements Al, B, Cr, Ge, Hf, Mo, Nb, Si, Ta or Ti.
Materials 14 00989 g020aMaterials 14 00989 g020b
Figure 21. Data for Al or Cr in C14-NbCr2 Laves phase. For all data points, the Cr in Laves phase is substituted by Al, Ge, Si or Sn. Red data points for C14-NbCr2 Laves phase in oxidized alloys. (a) Al versus Cr in C14-NbCr2. Diamonds for RM(Nb)ICs that are also RCCAs. R2 = 0.9369, alloying elements Al, Cr, Ge, Hf, Mo, Nb, Si, Sn, Ta, Ti or W, R2 = 0.8747 alloying elements Al, Cr, Ge, Hf, Mo, Nb, Si, Sn, Ti or W. Red data points (R2 = 0.9991), (b) Si versus Cr in C14-NbCr2. The data with R2 = 0.9317 is for Ta-free alloys. R2 = 0.9317, alloying elements Al, Cr, Ge, Hf, Mo, Nb, Si, Sn, Ti or W, R2 = 0.9344, alloying elements Al, Cr, Ge, Hf, Mo, Nb, Si, Sn, Ta, Ti or W, R2 = 0.9824, alloying elements Al, Cr, Ge, Hf, Mo, Nb, Si, Sn, Ta, Ti or W, R2 = 0.8309, alloying elements Al, Cr, Ge, Hf, Mo, Nb, Si, Sn, Ta, Ti or W. For the rectangular area in (b), see text.
Materials 14 00989 g021
Figure 22. Calculated secondary creep rates-based on VEC for the creep goal conditions (T = 1200 °C, σ = 170 MPa) versus (a)Al, (b), Ti (c) Mo and (d) Si content in RM(Nb)ICs.
Materials 14 00989 g022aMaterials 14 00989 g022bMaterials 14 00989 g022c
Figure 23. (a) VECalloy versus Δχalloy, (b) VECalloy versus δalloy and (c) Δχalloy versus δalloy maps of RM(Nb)ICs that are also HEAs or RHEAs/RCCAs. Blue circles for HEAs of the Nb-Ti-Si-Al-Hf system, RM(Nb)ICs-RHEAs/RCCAs as follows: green with B, red with Sn, orange with Ge, purple with Ge + Sn addition. Green square for an RM(Nb)IC-RCCA with B + Sn addition.
Materials 14 00989 g023aMaterials 14 00989 g023b
Table 1. Values of the parameters ΔHmix, ΔSmix, VEC, δ, Δχ and Ω for all Nb-silicide-based alloys and their solid solutions, and for the eutectics with Nbss and Nb5Si3.
MaterialParameter
ΔHmix
(kJ/mol)
ΔSmix (J/mol K)VEC **δΔχΩ +
RM(Nb)ICs [8] and RM(Nb)ICs-RHEAs/RCCAs−32.7 to −44.88.3–14.74.4–4.98.1–14.30.12–0.2370.57–0.95
Solid solution in RM(Nb)ICs [7] and RM(Nb)ICs-RHEAs/RCCAs−2 to −15.95.8–14.54.4–5.42.4–9.70.039–0.369 *
gap 0.13 to 0.18
1.55–8.9
Eutectics with Nbss and Nb5Si3 [11]−25.5 to −41.94.7–154.3–4.96.2–9.40.118–0.248
gap 0.16 to 0.18
0.38–1.35
HEAs with bcc solid solution + intermetallic(s) [7]2.5–3511.5–14.55.7–84.6–110.125–0.2251–10
Amorphous alloys [7]0–506–17.54–9.54.6–18.50.1–0.35-
+ In [7], the letter Q was used instead of Ω for the ratio TmΔSmix/∣ΔHmix∣. * In [7], the range was given as 0.039–0.331, new data in [19] changed the upper value to 0.369. ** For Nb-Ti-Si-Al-Hf HEAs (see text) 3.73 < VEC < 3.935.
Publisher’s Note: MDPI stays neutral with regard to jurisdictional claims in published maps and institutional affiliations.