
Composites of Open-Cell Viscoelastic Foams with Blackcurrant Pomace


 , and
, and
Abstract
1. Introduction
2. Materials and Methods
2.1. Materials and Manufacturing
2.2. Characterization Techniques
3. Results and Discussion
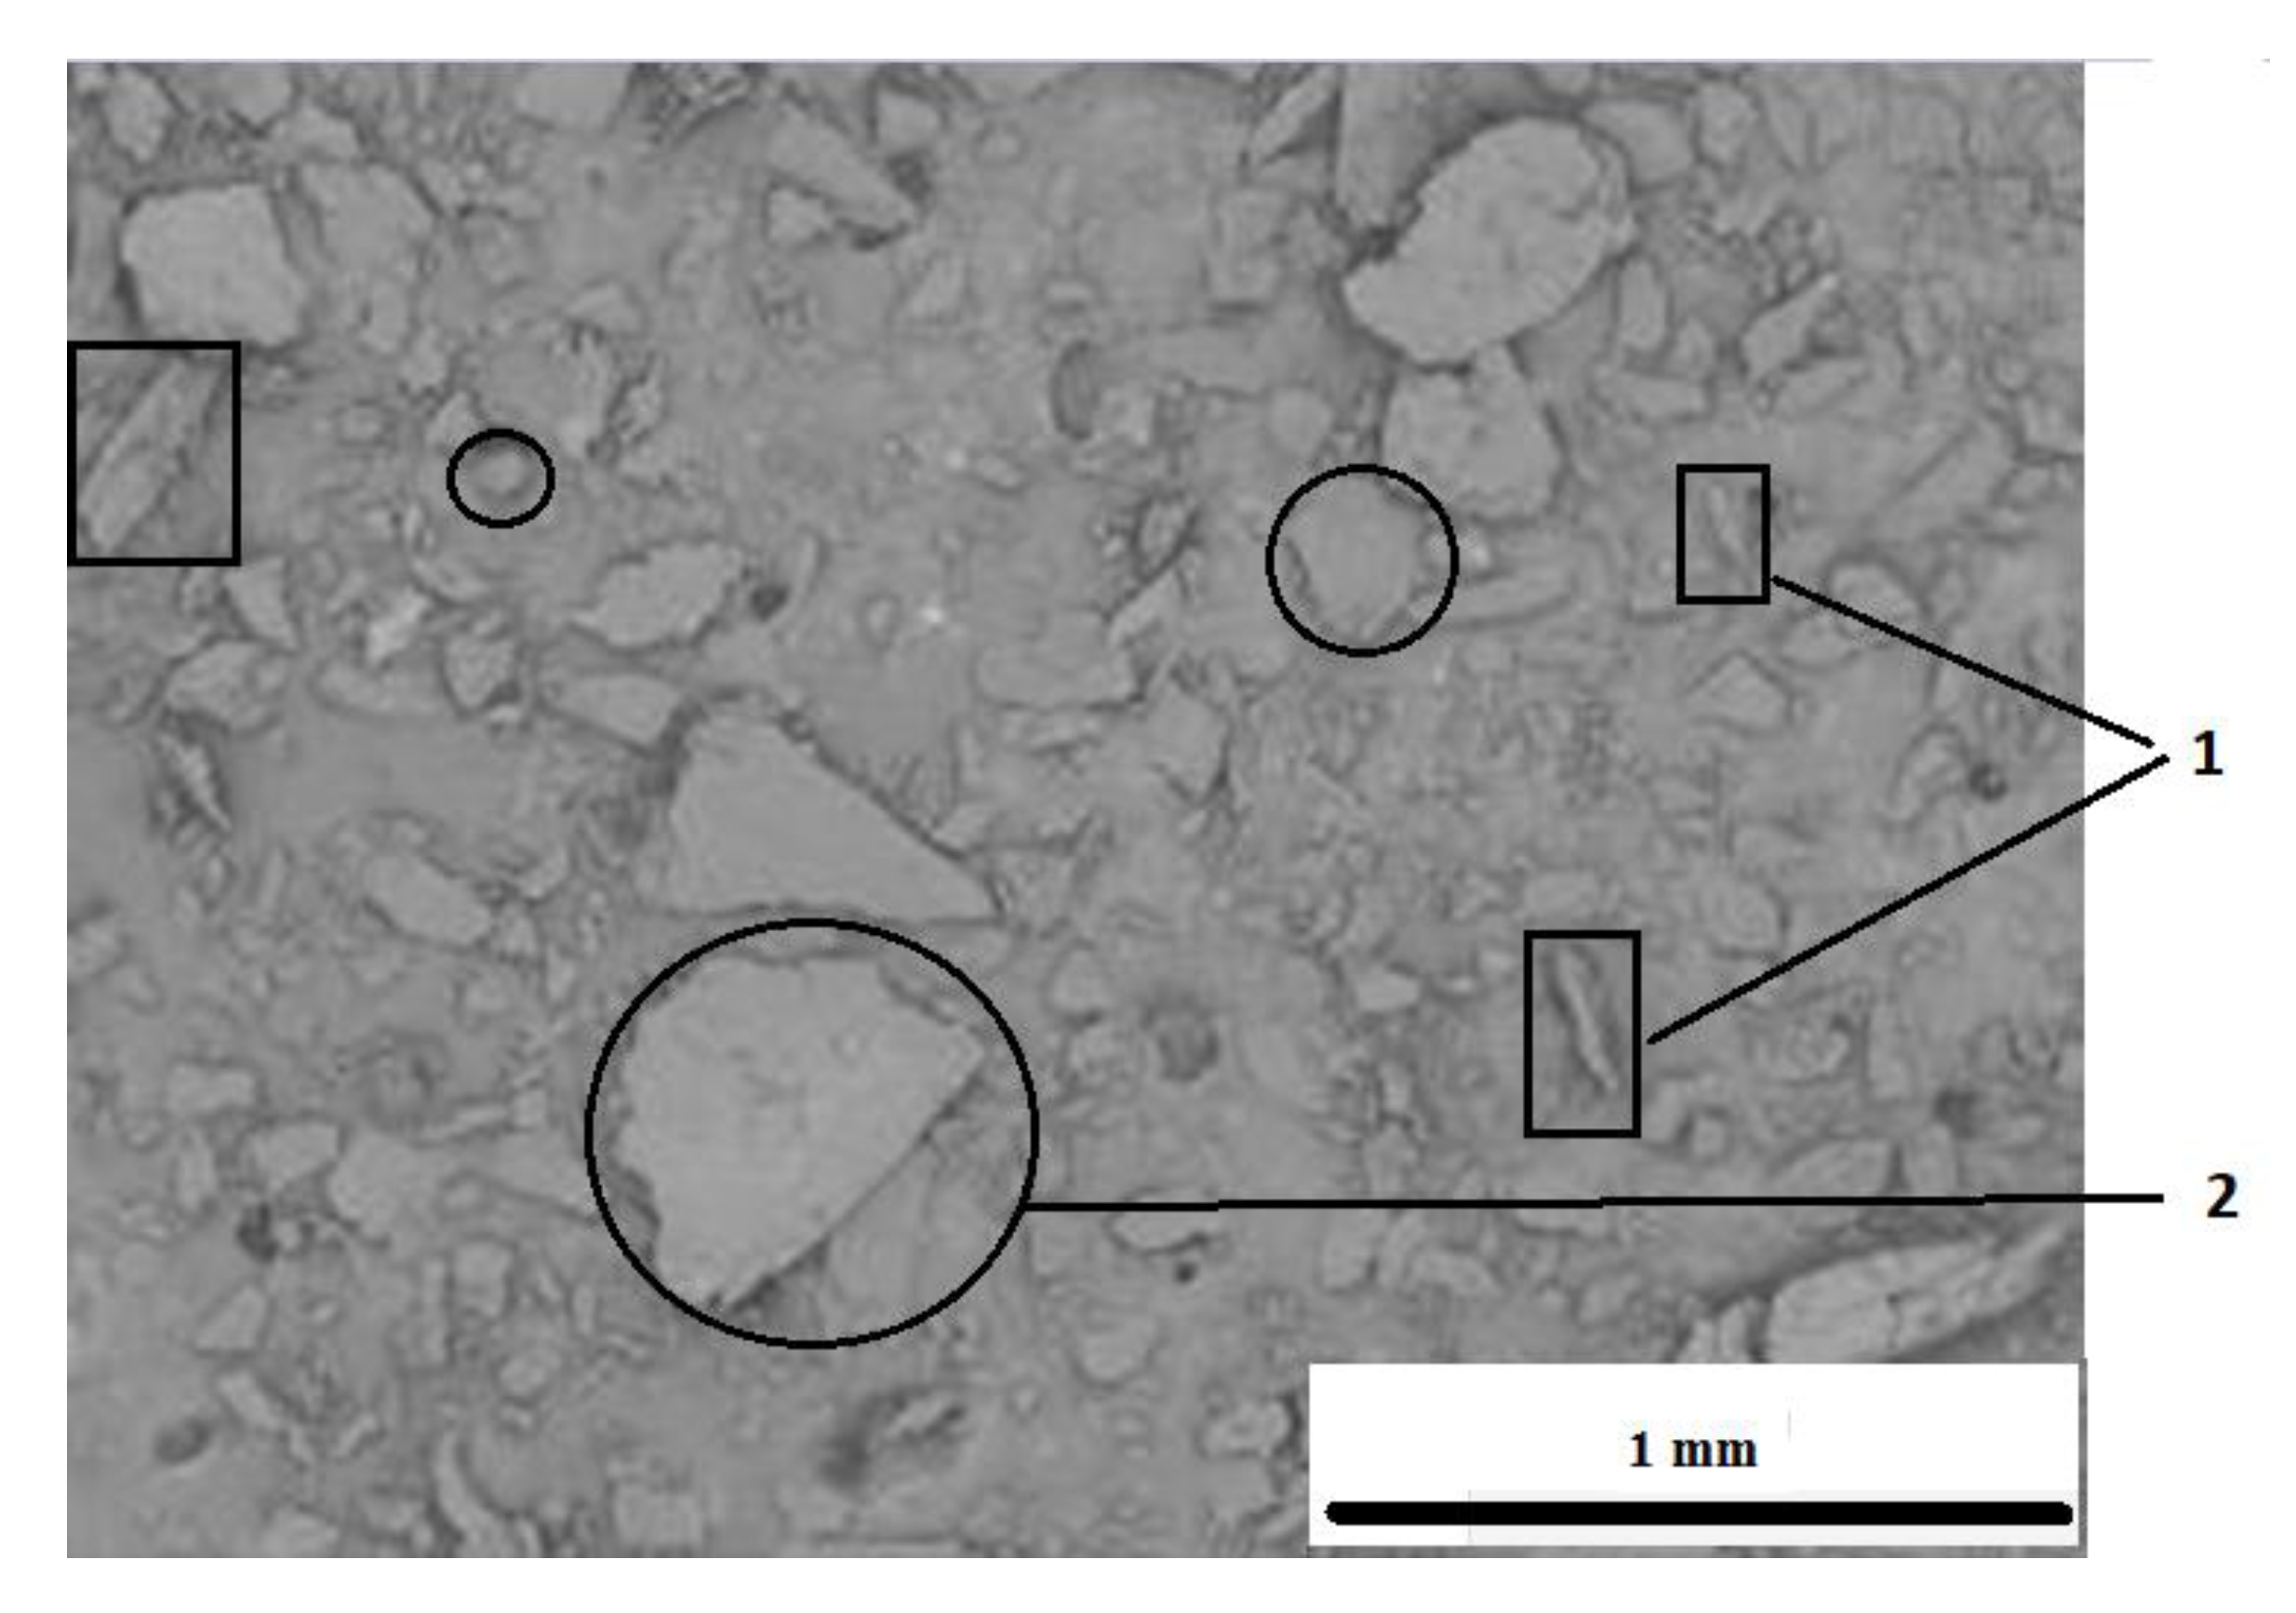
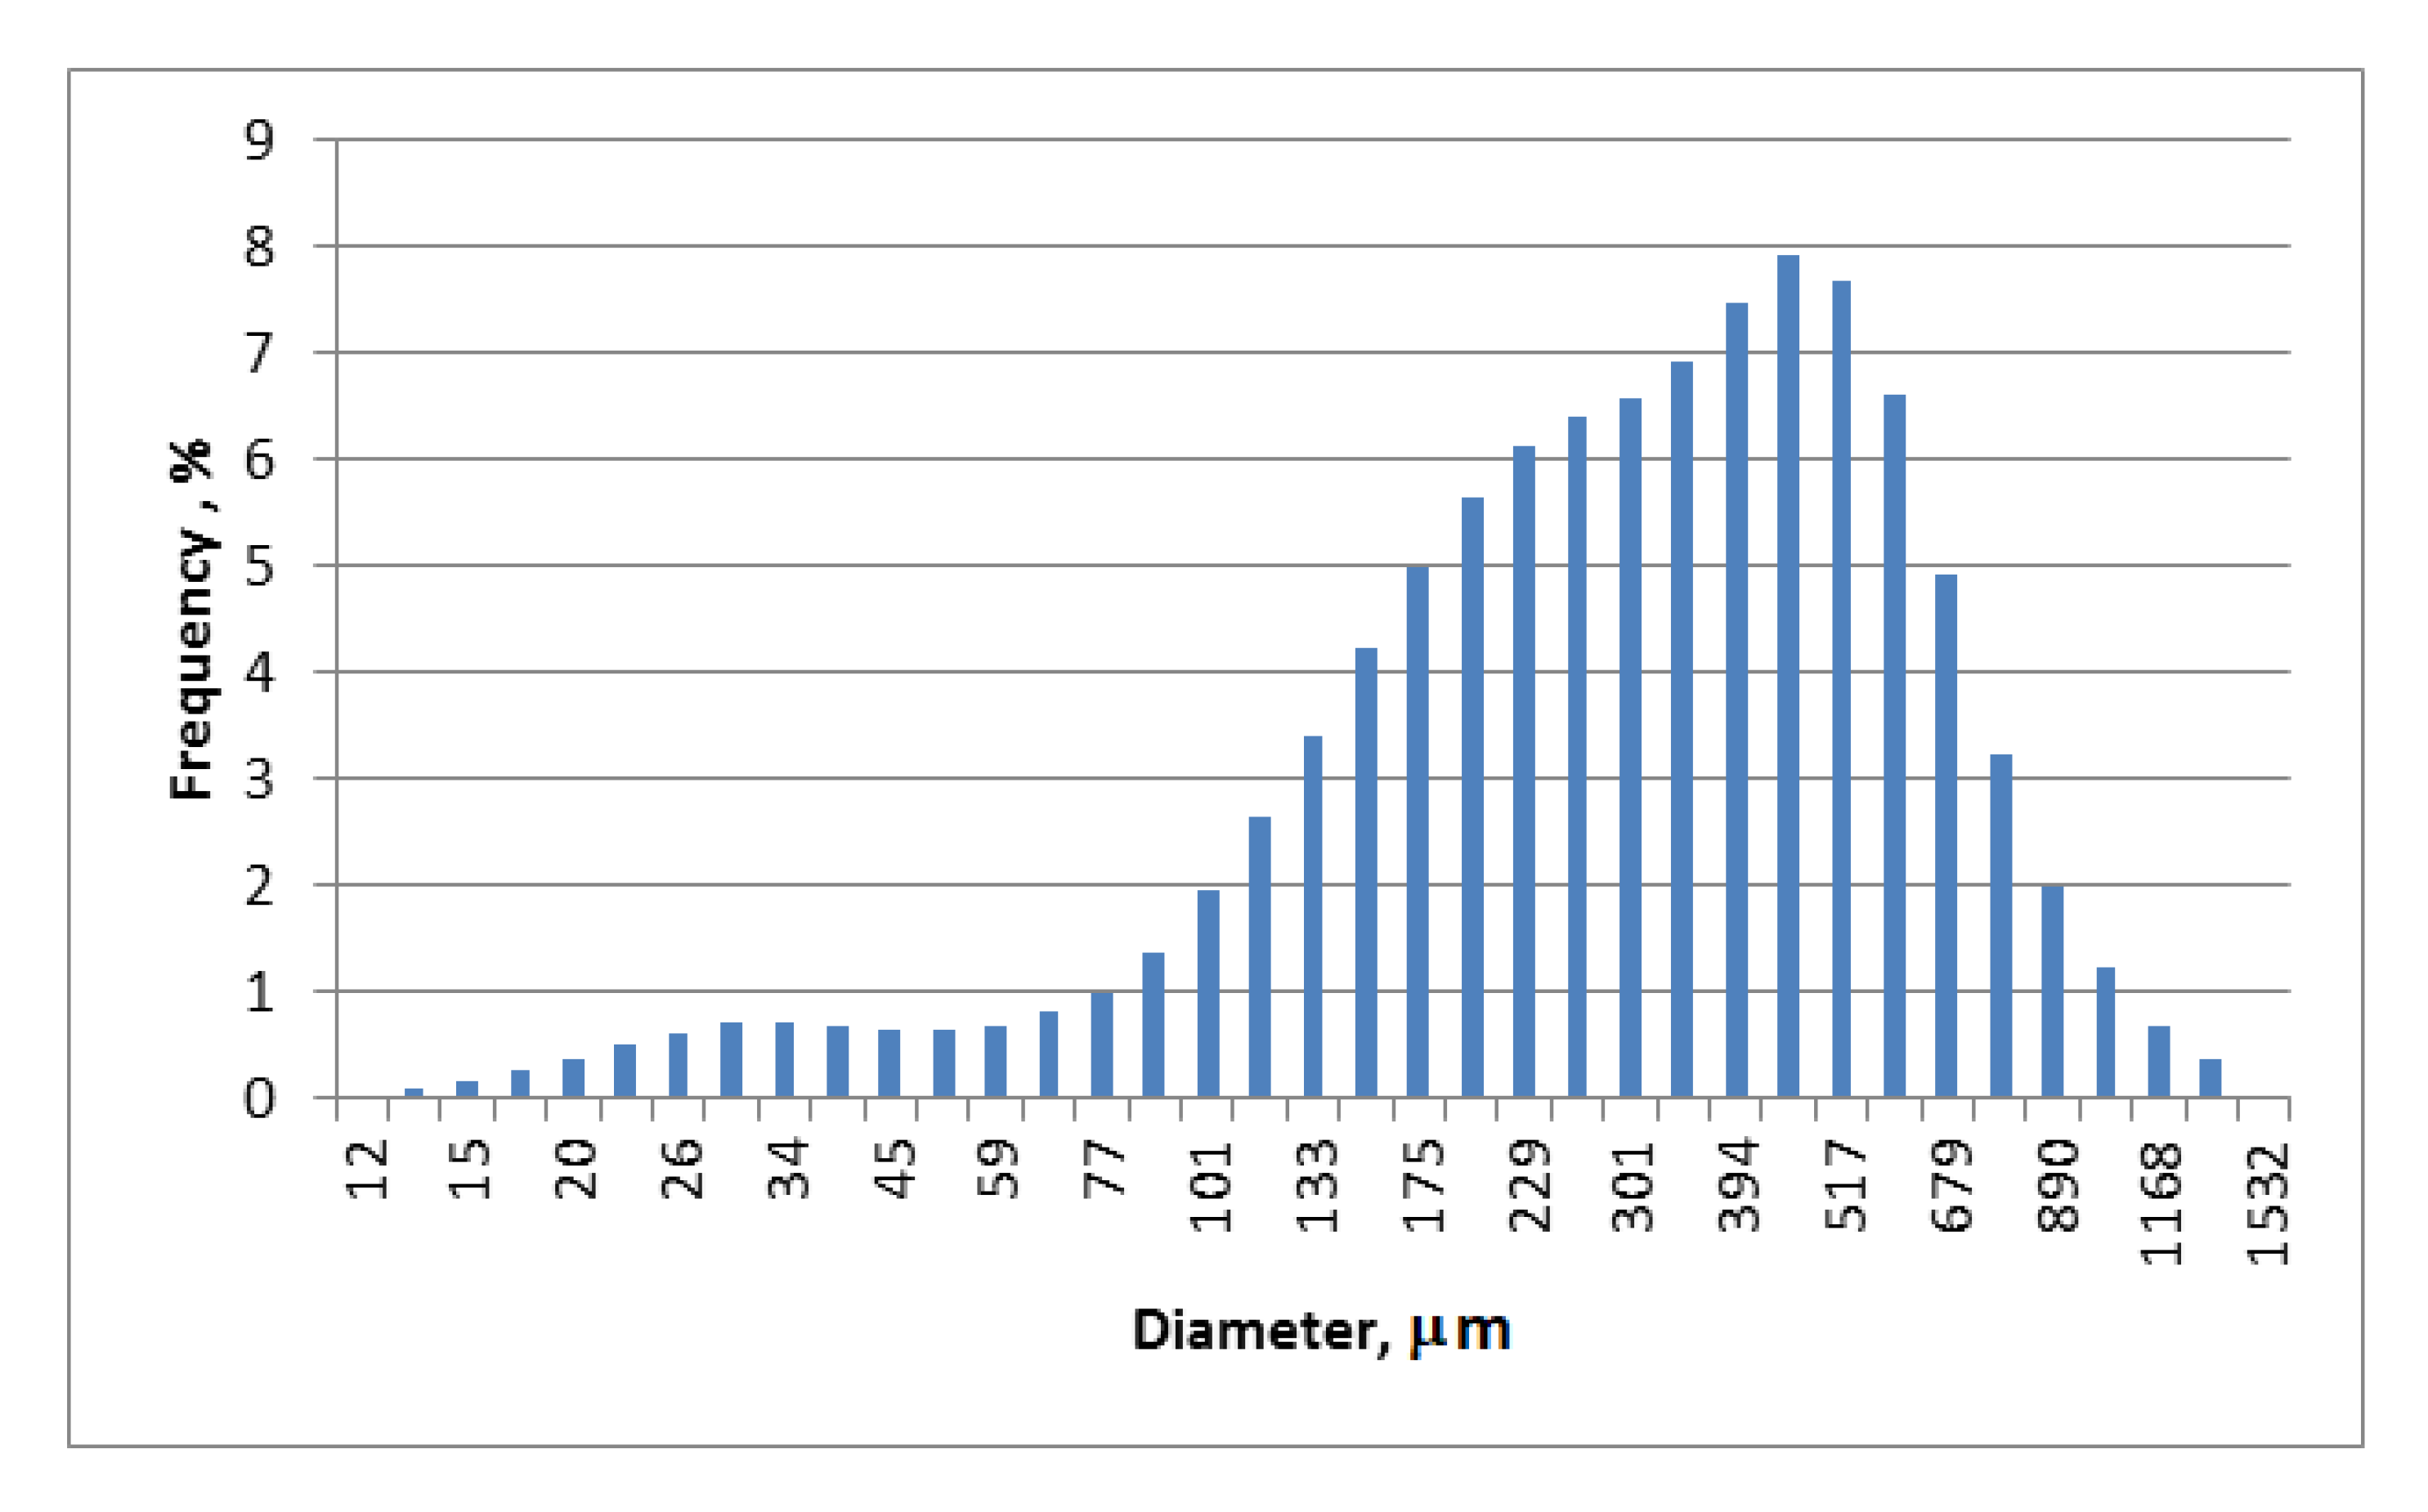
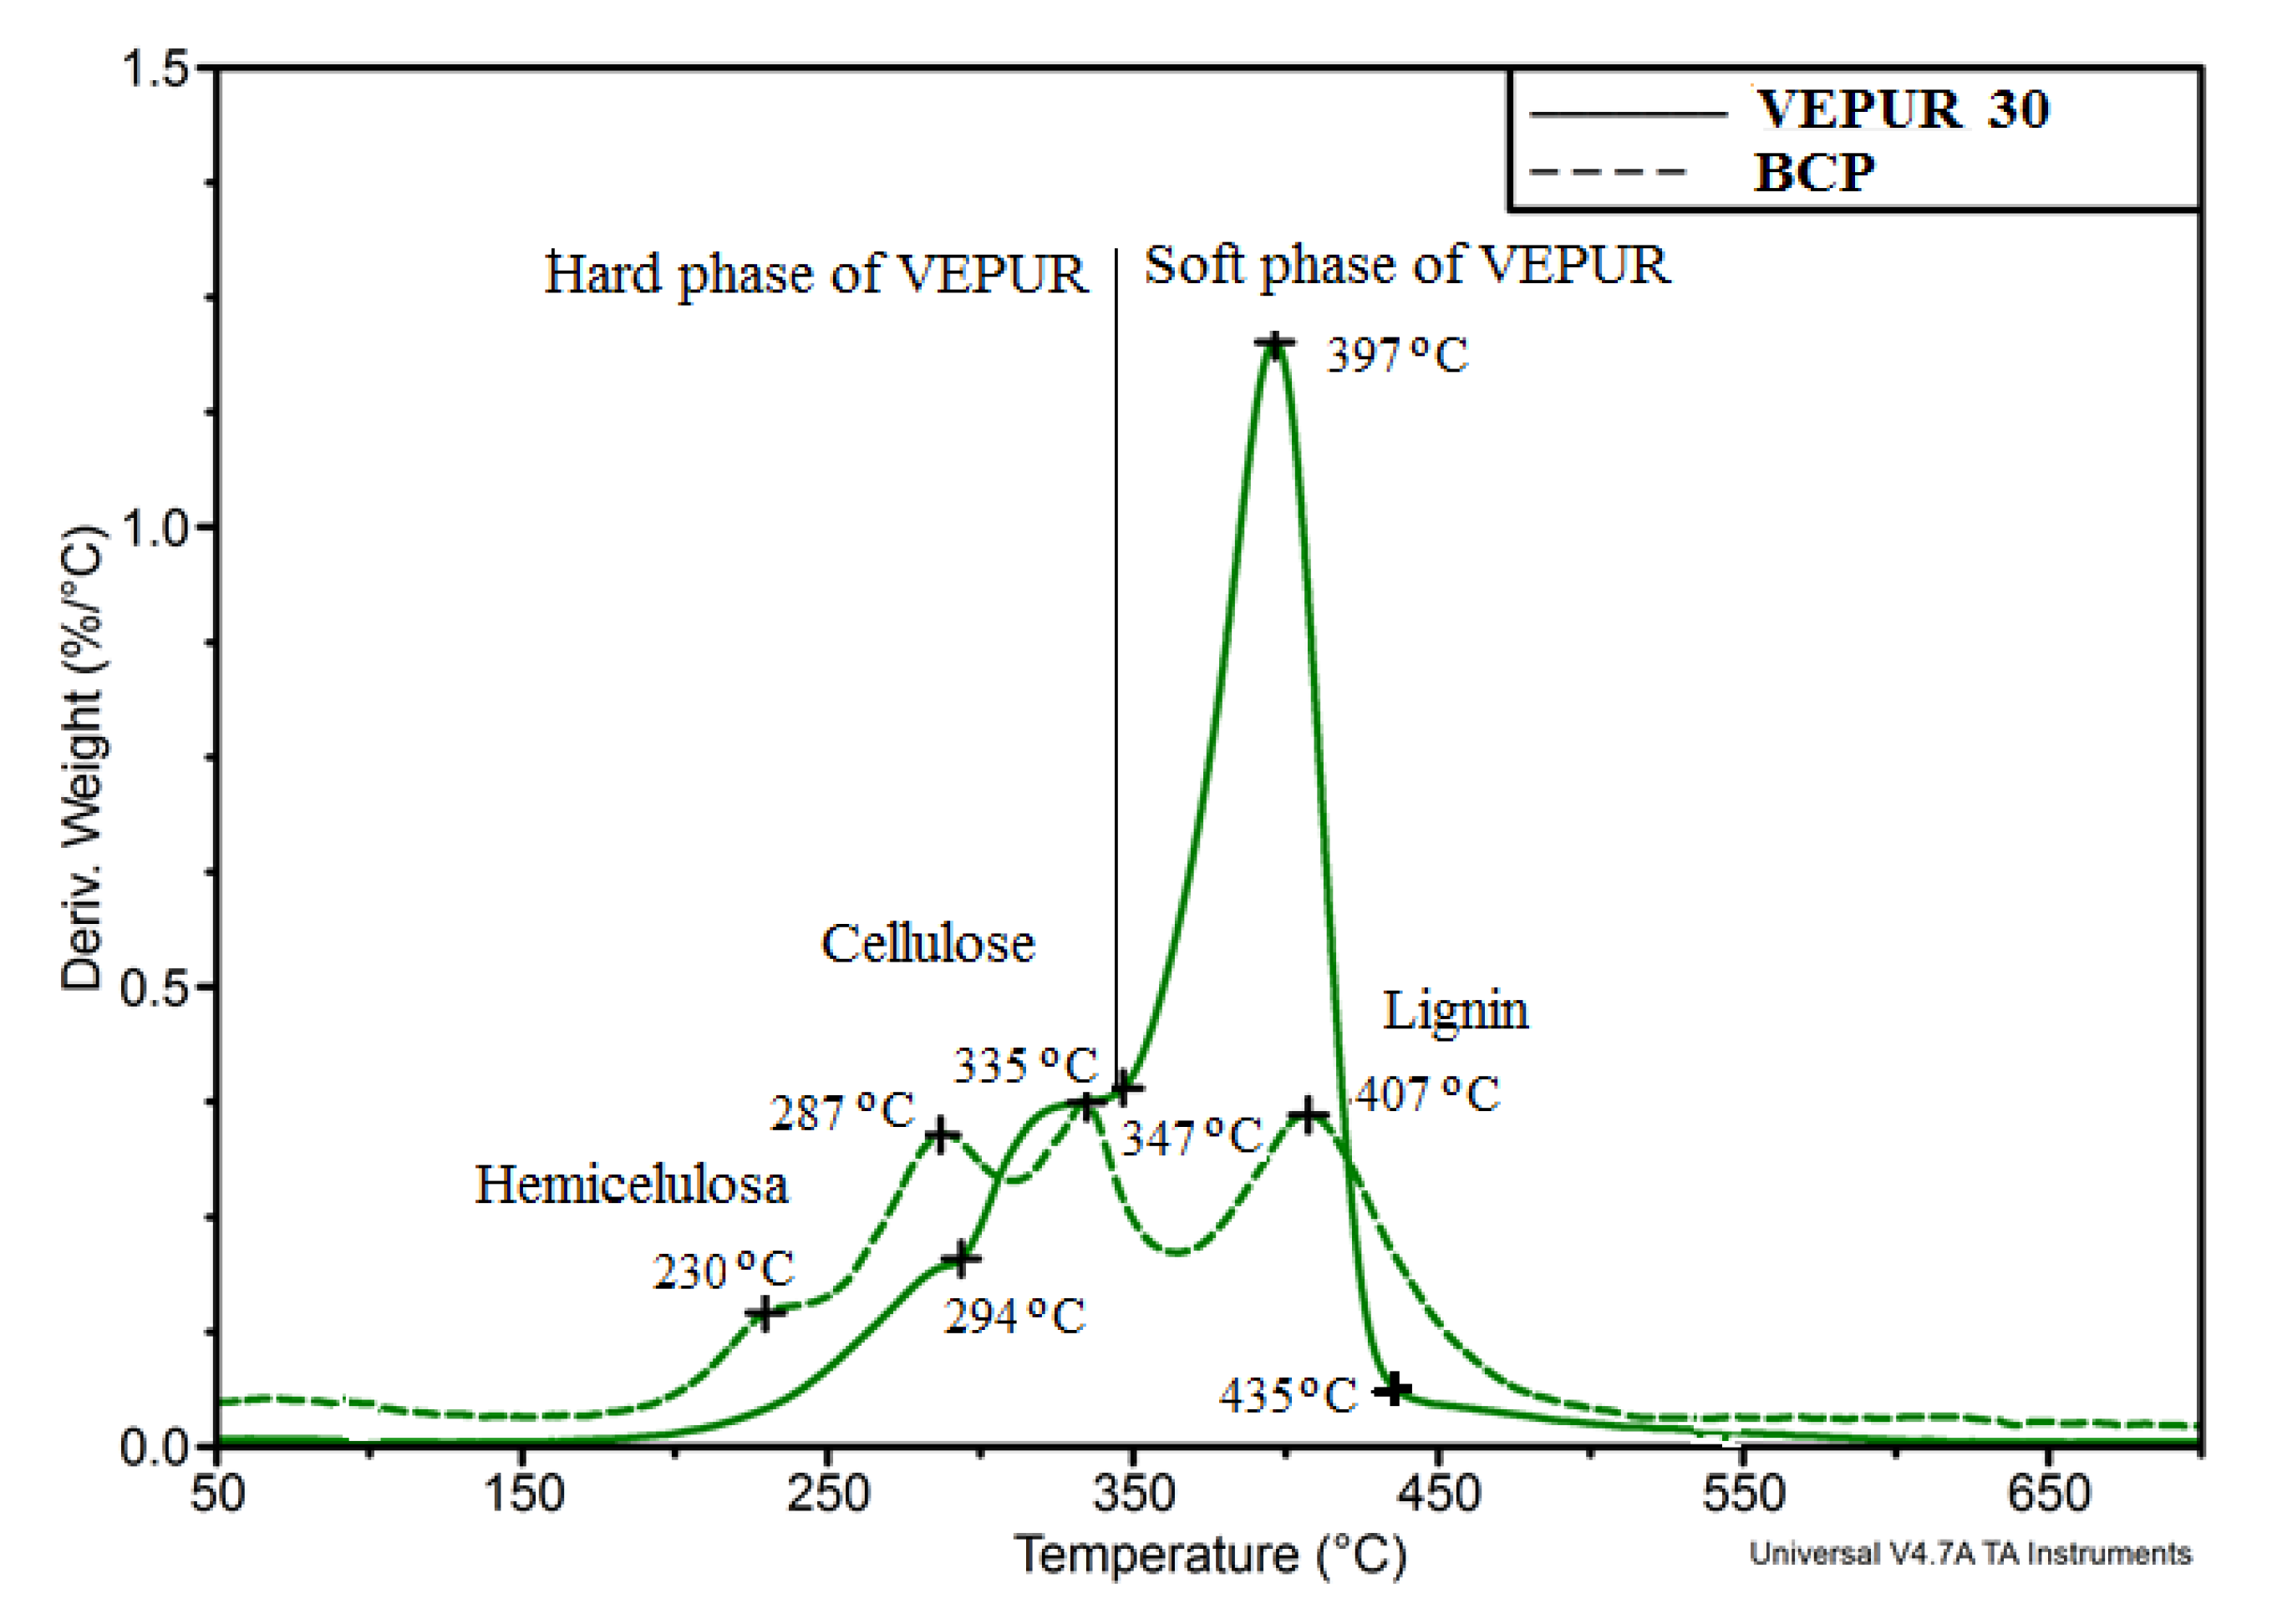
3.1. The Results of the Analysis of the Structure and Chemical Structure of the Filler
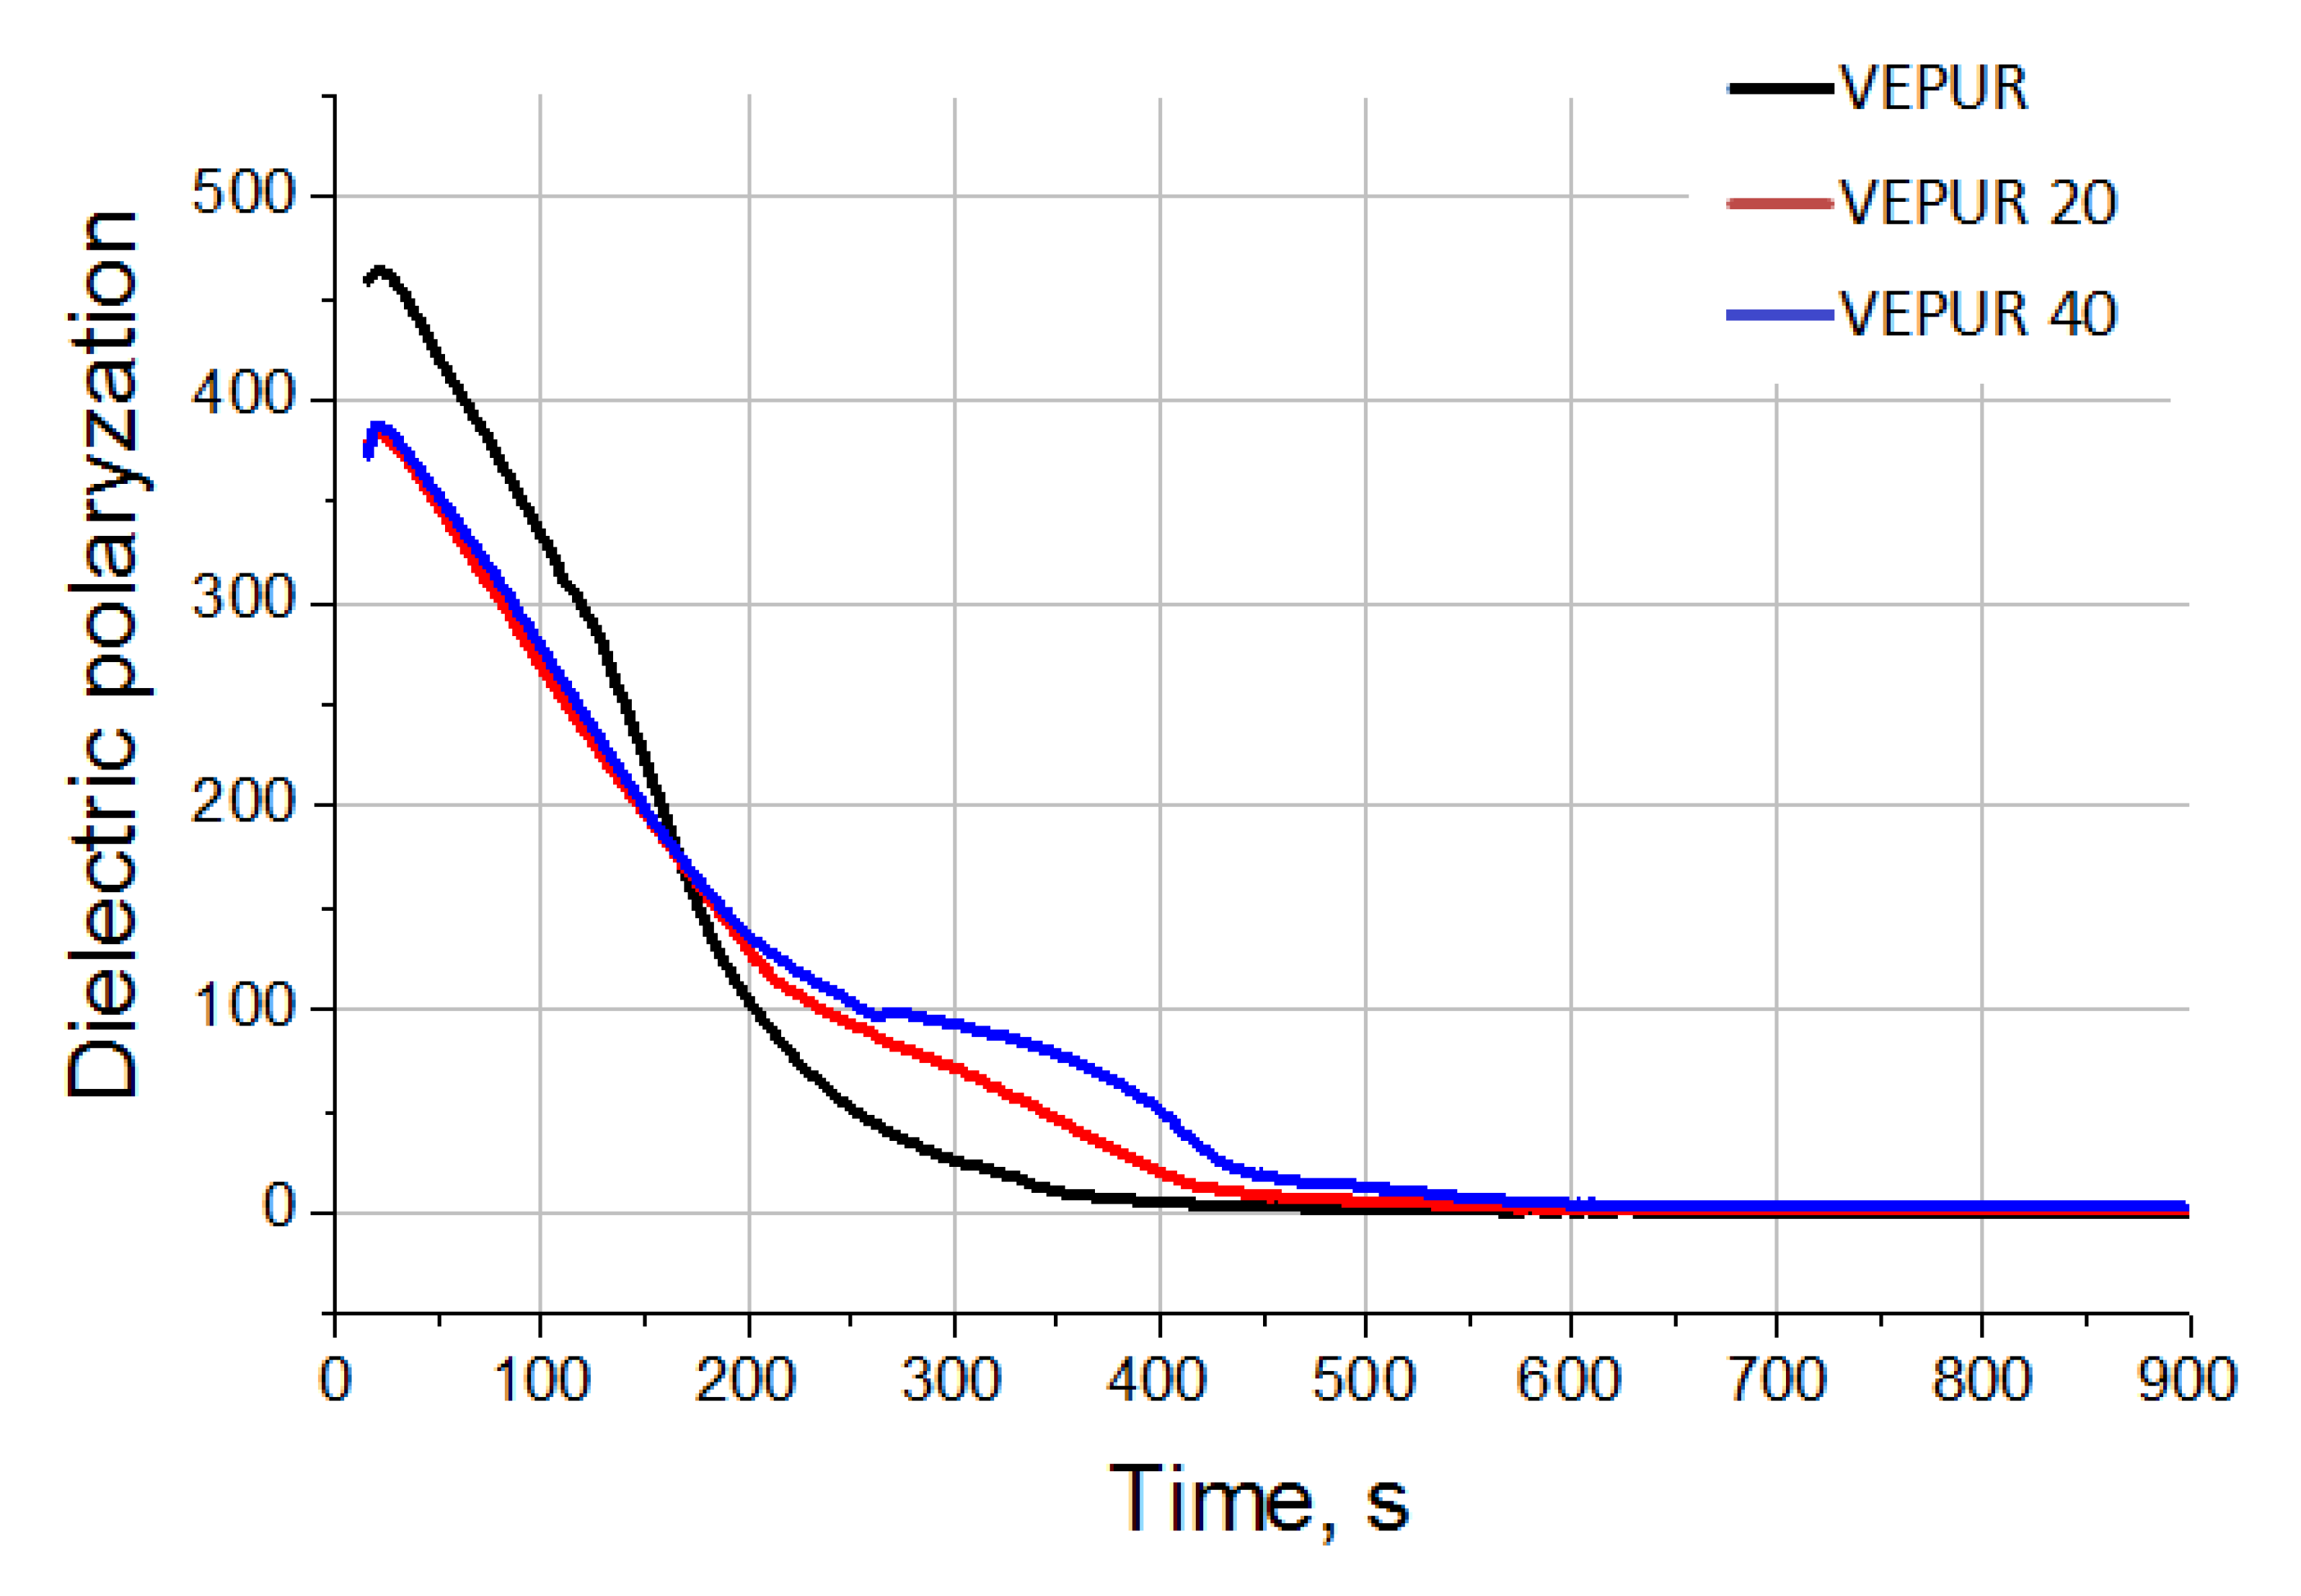
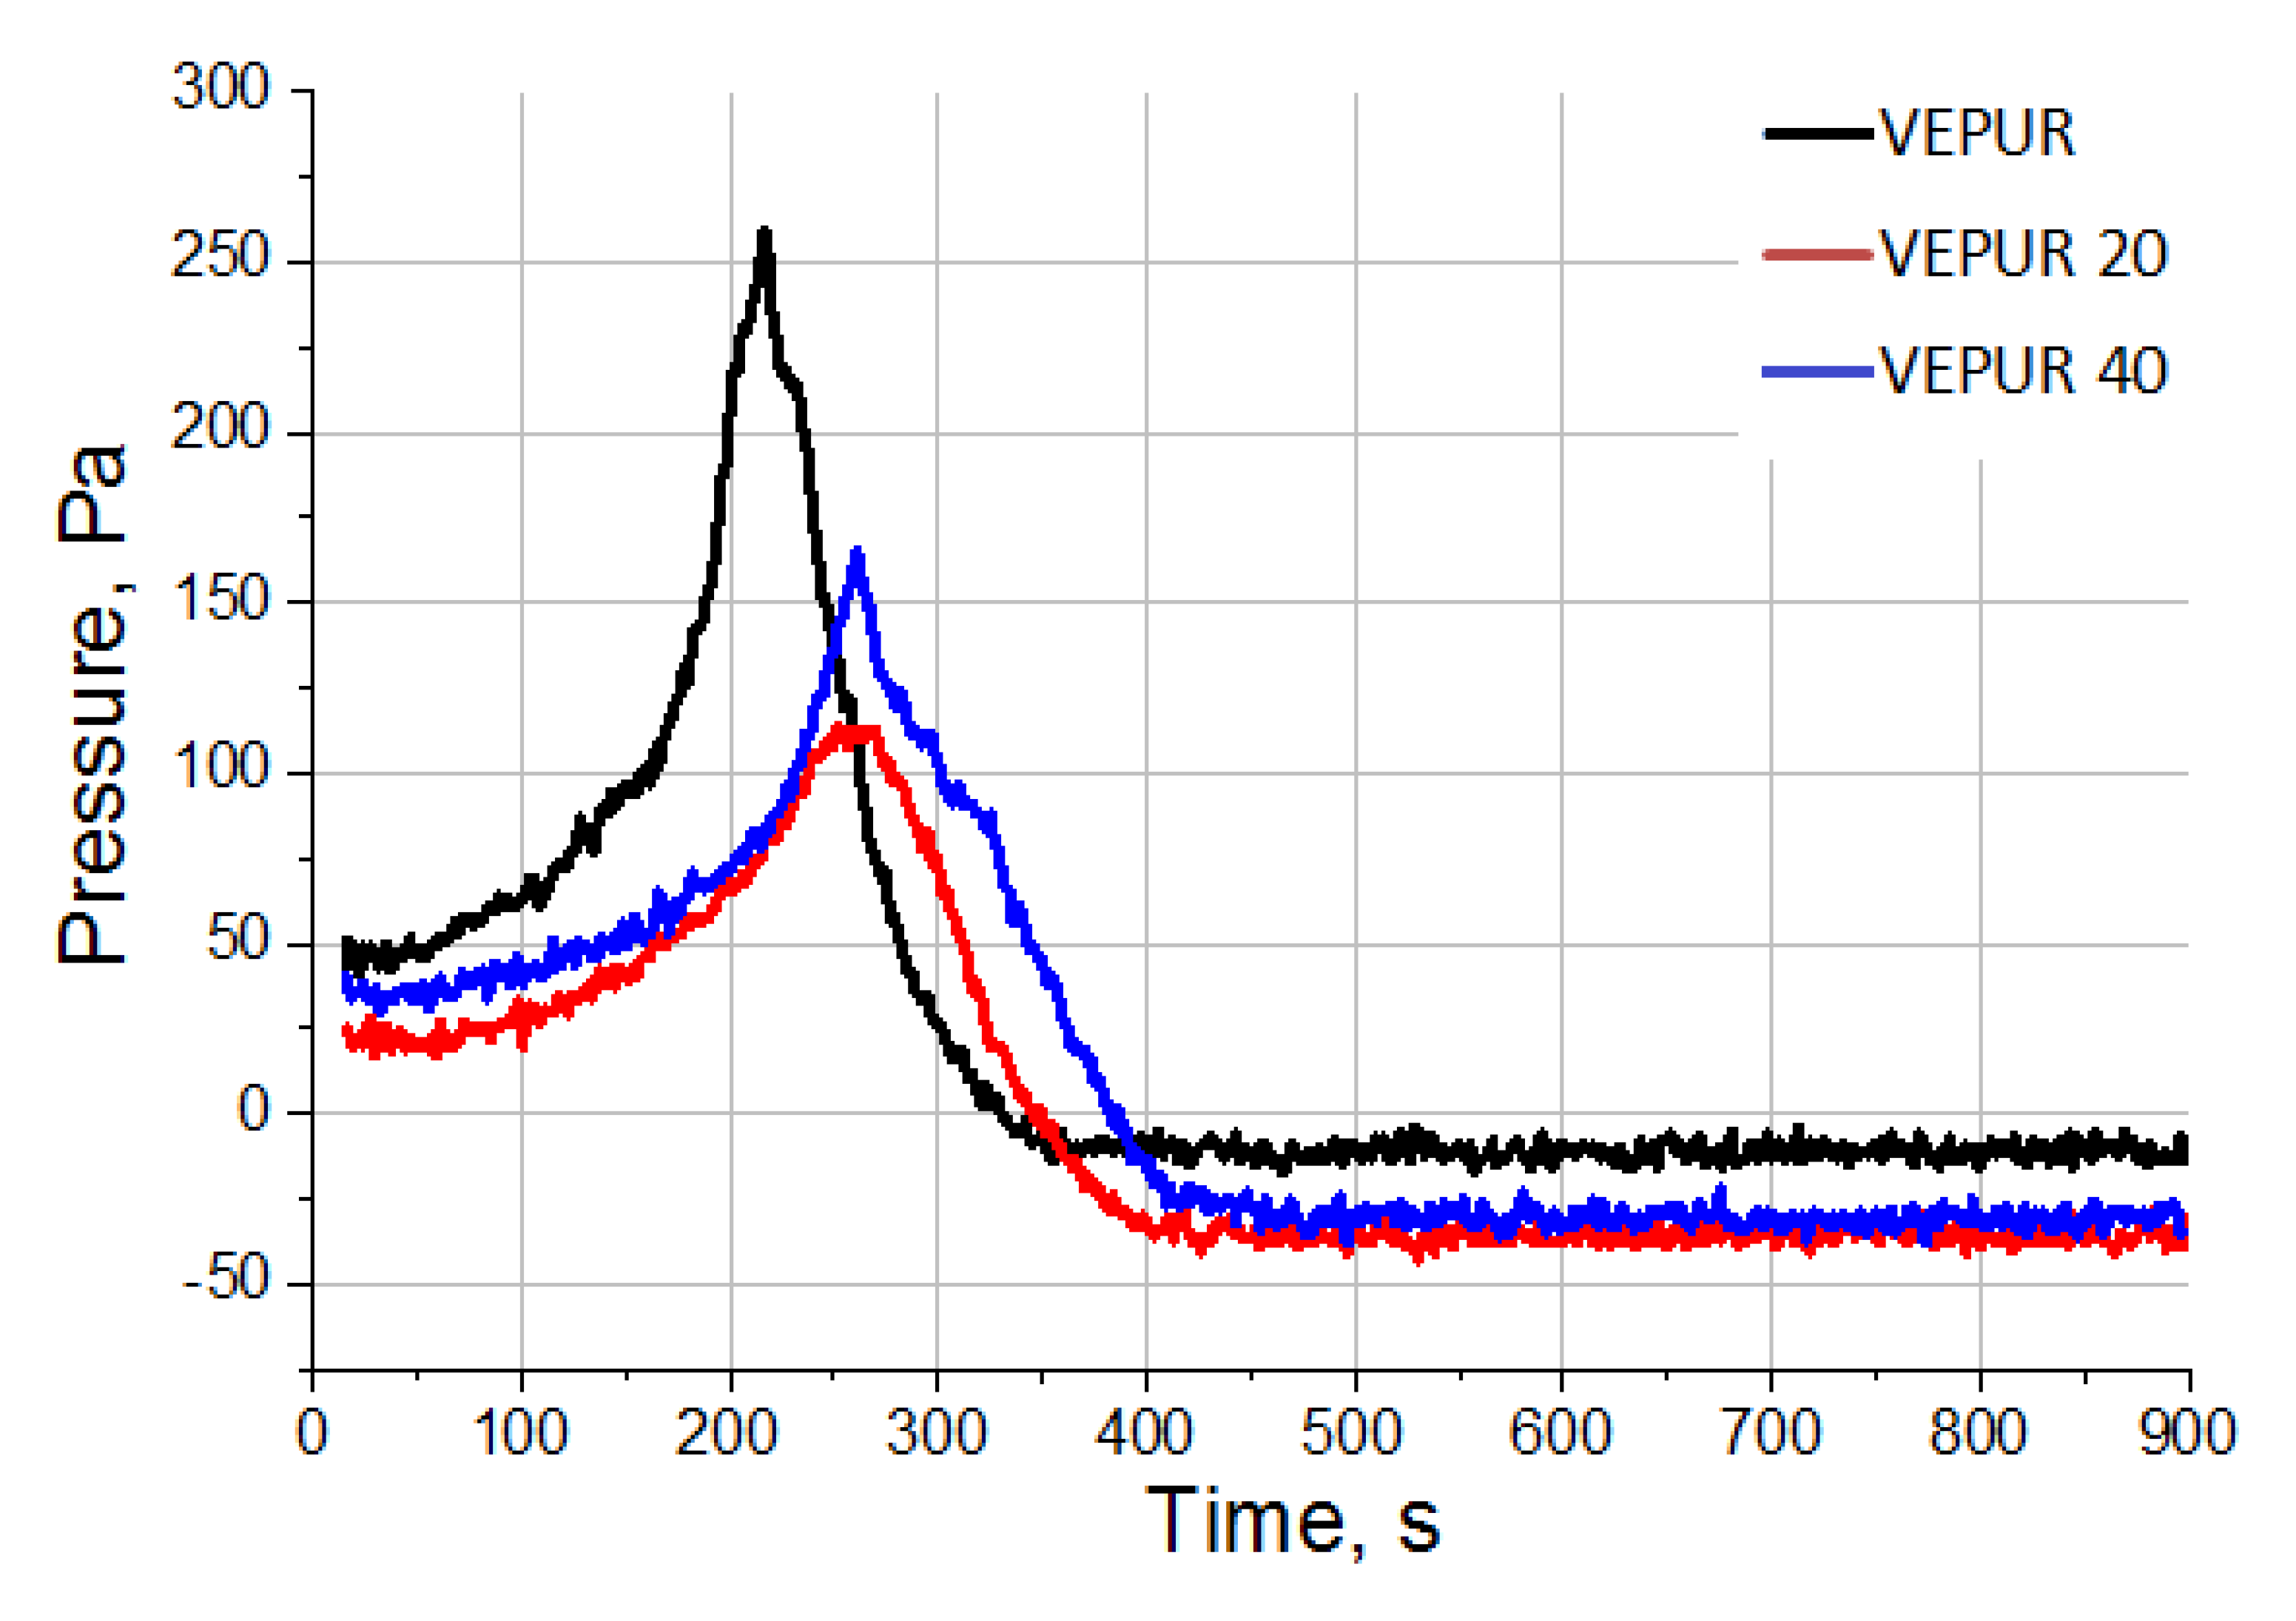
3.2. Foaming Behavior of PU Mixtures Containing Blackcurrant Pomace
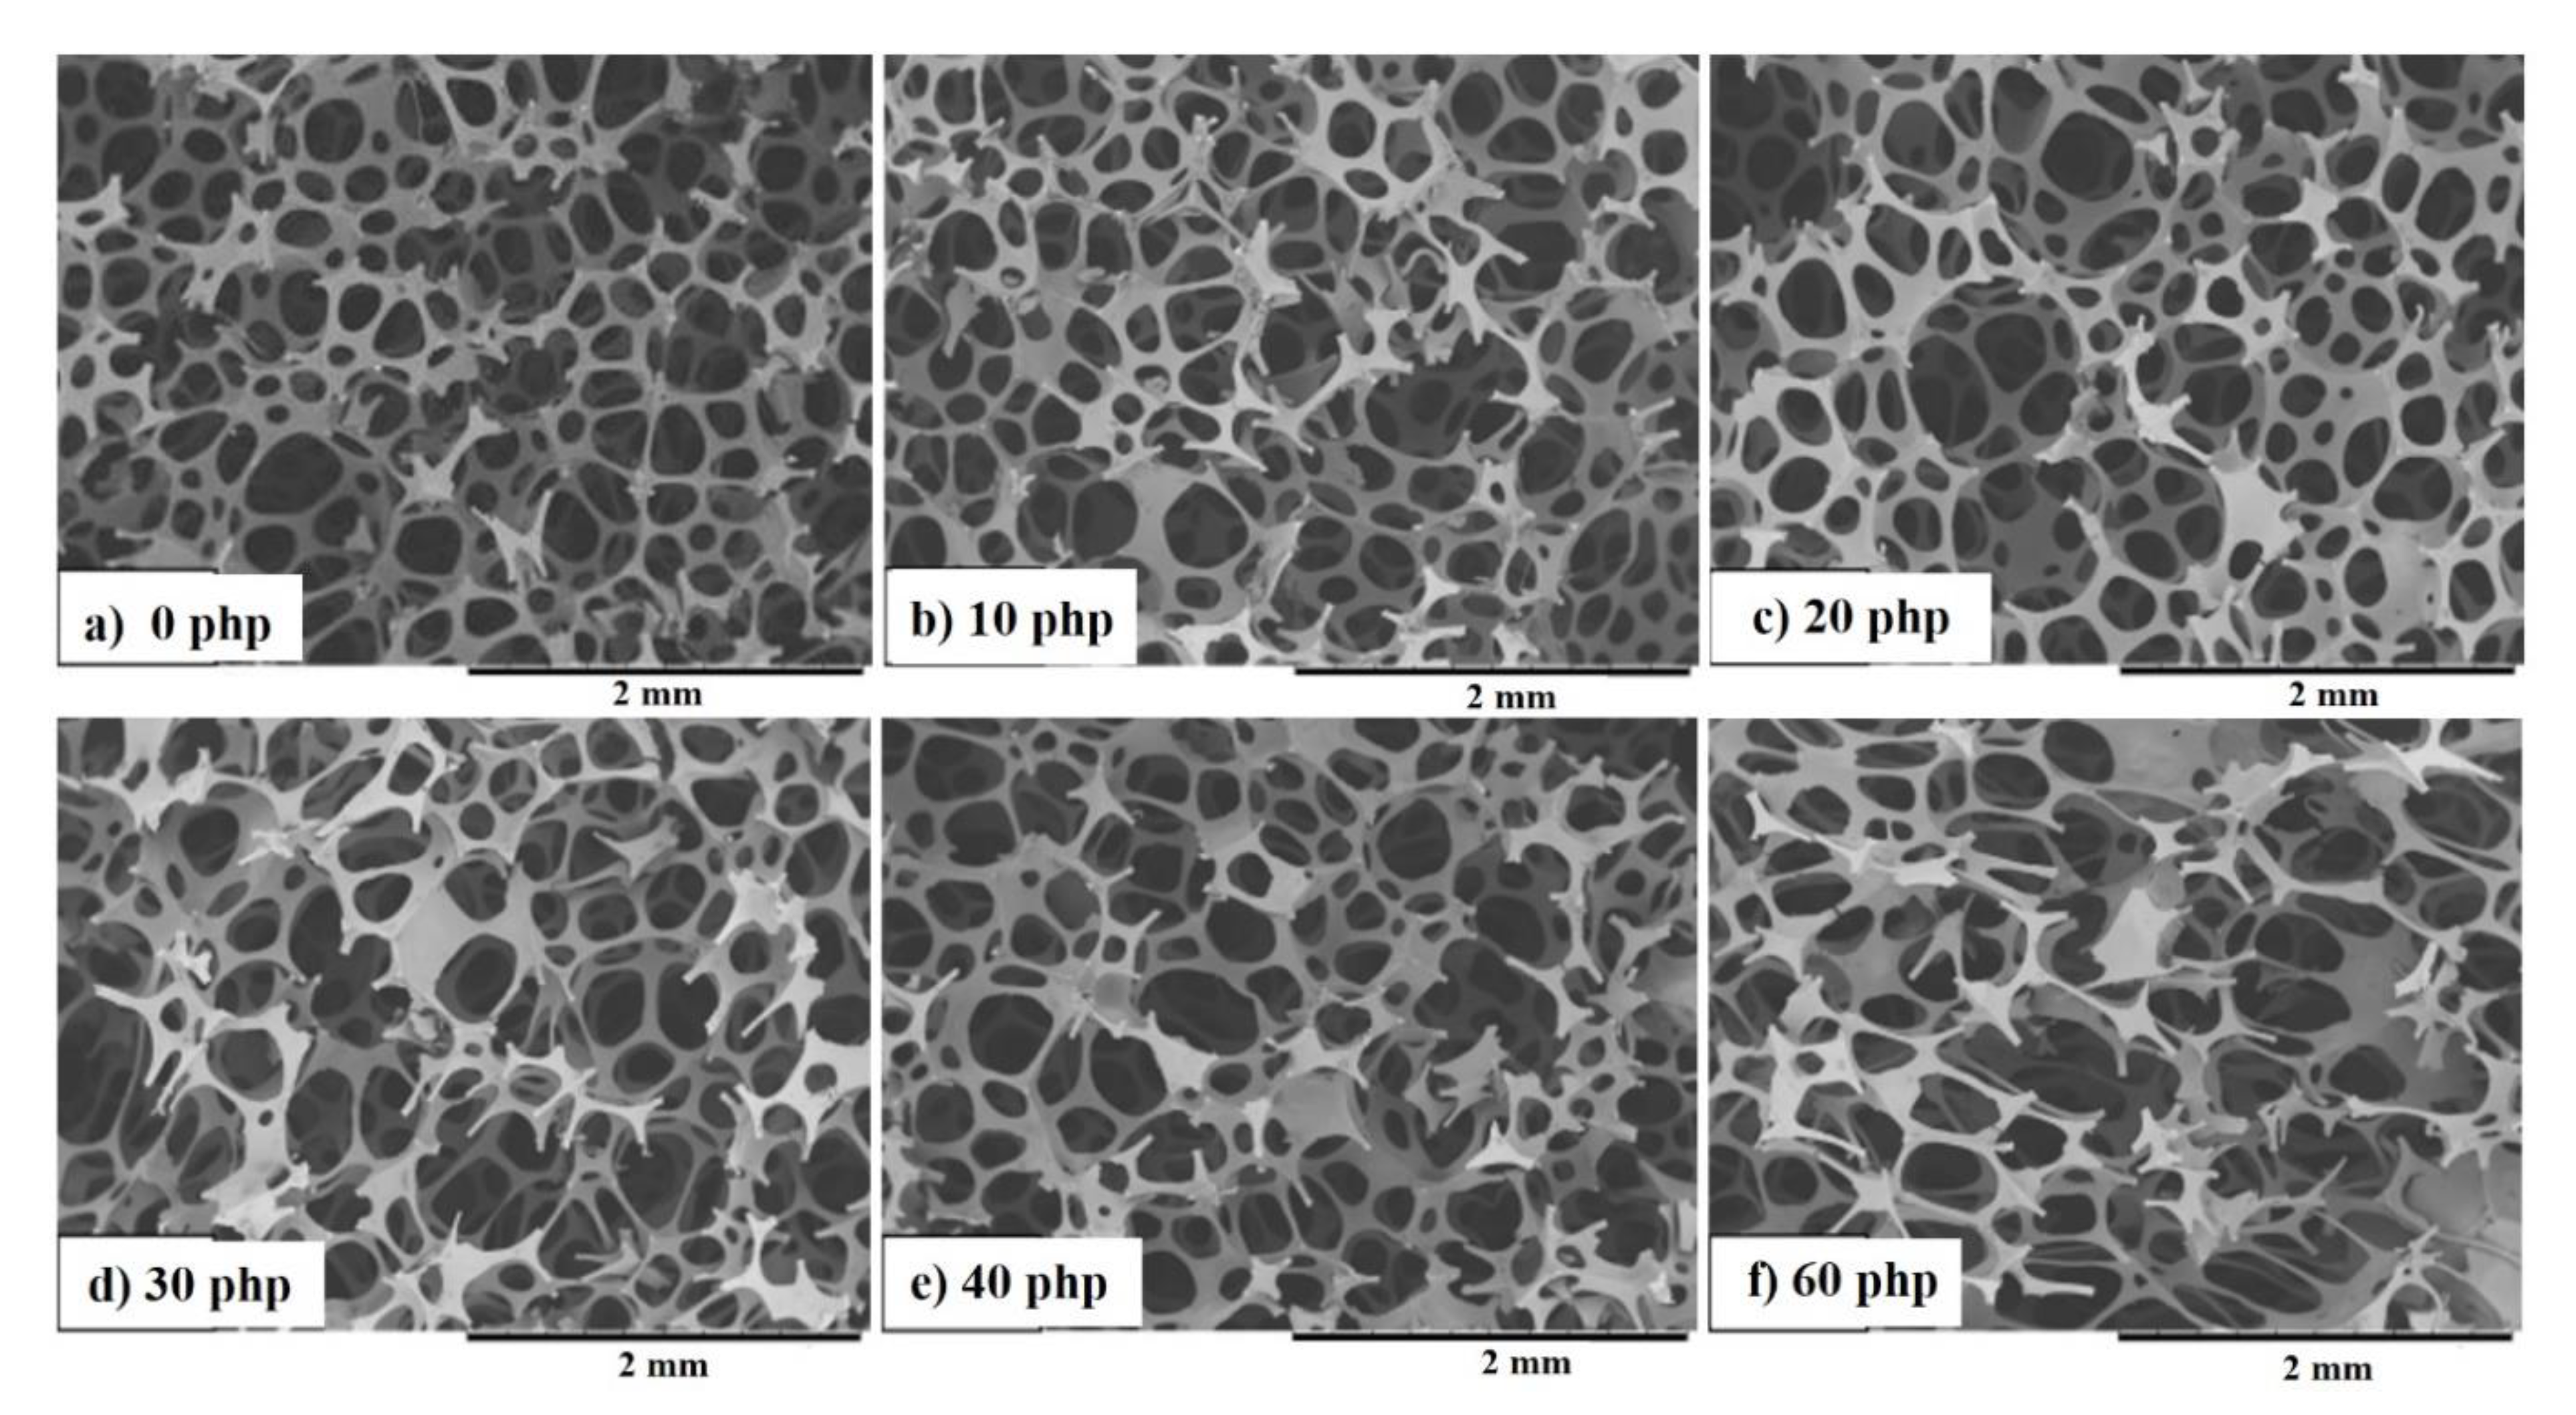
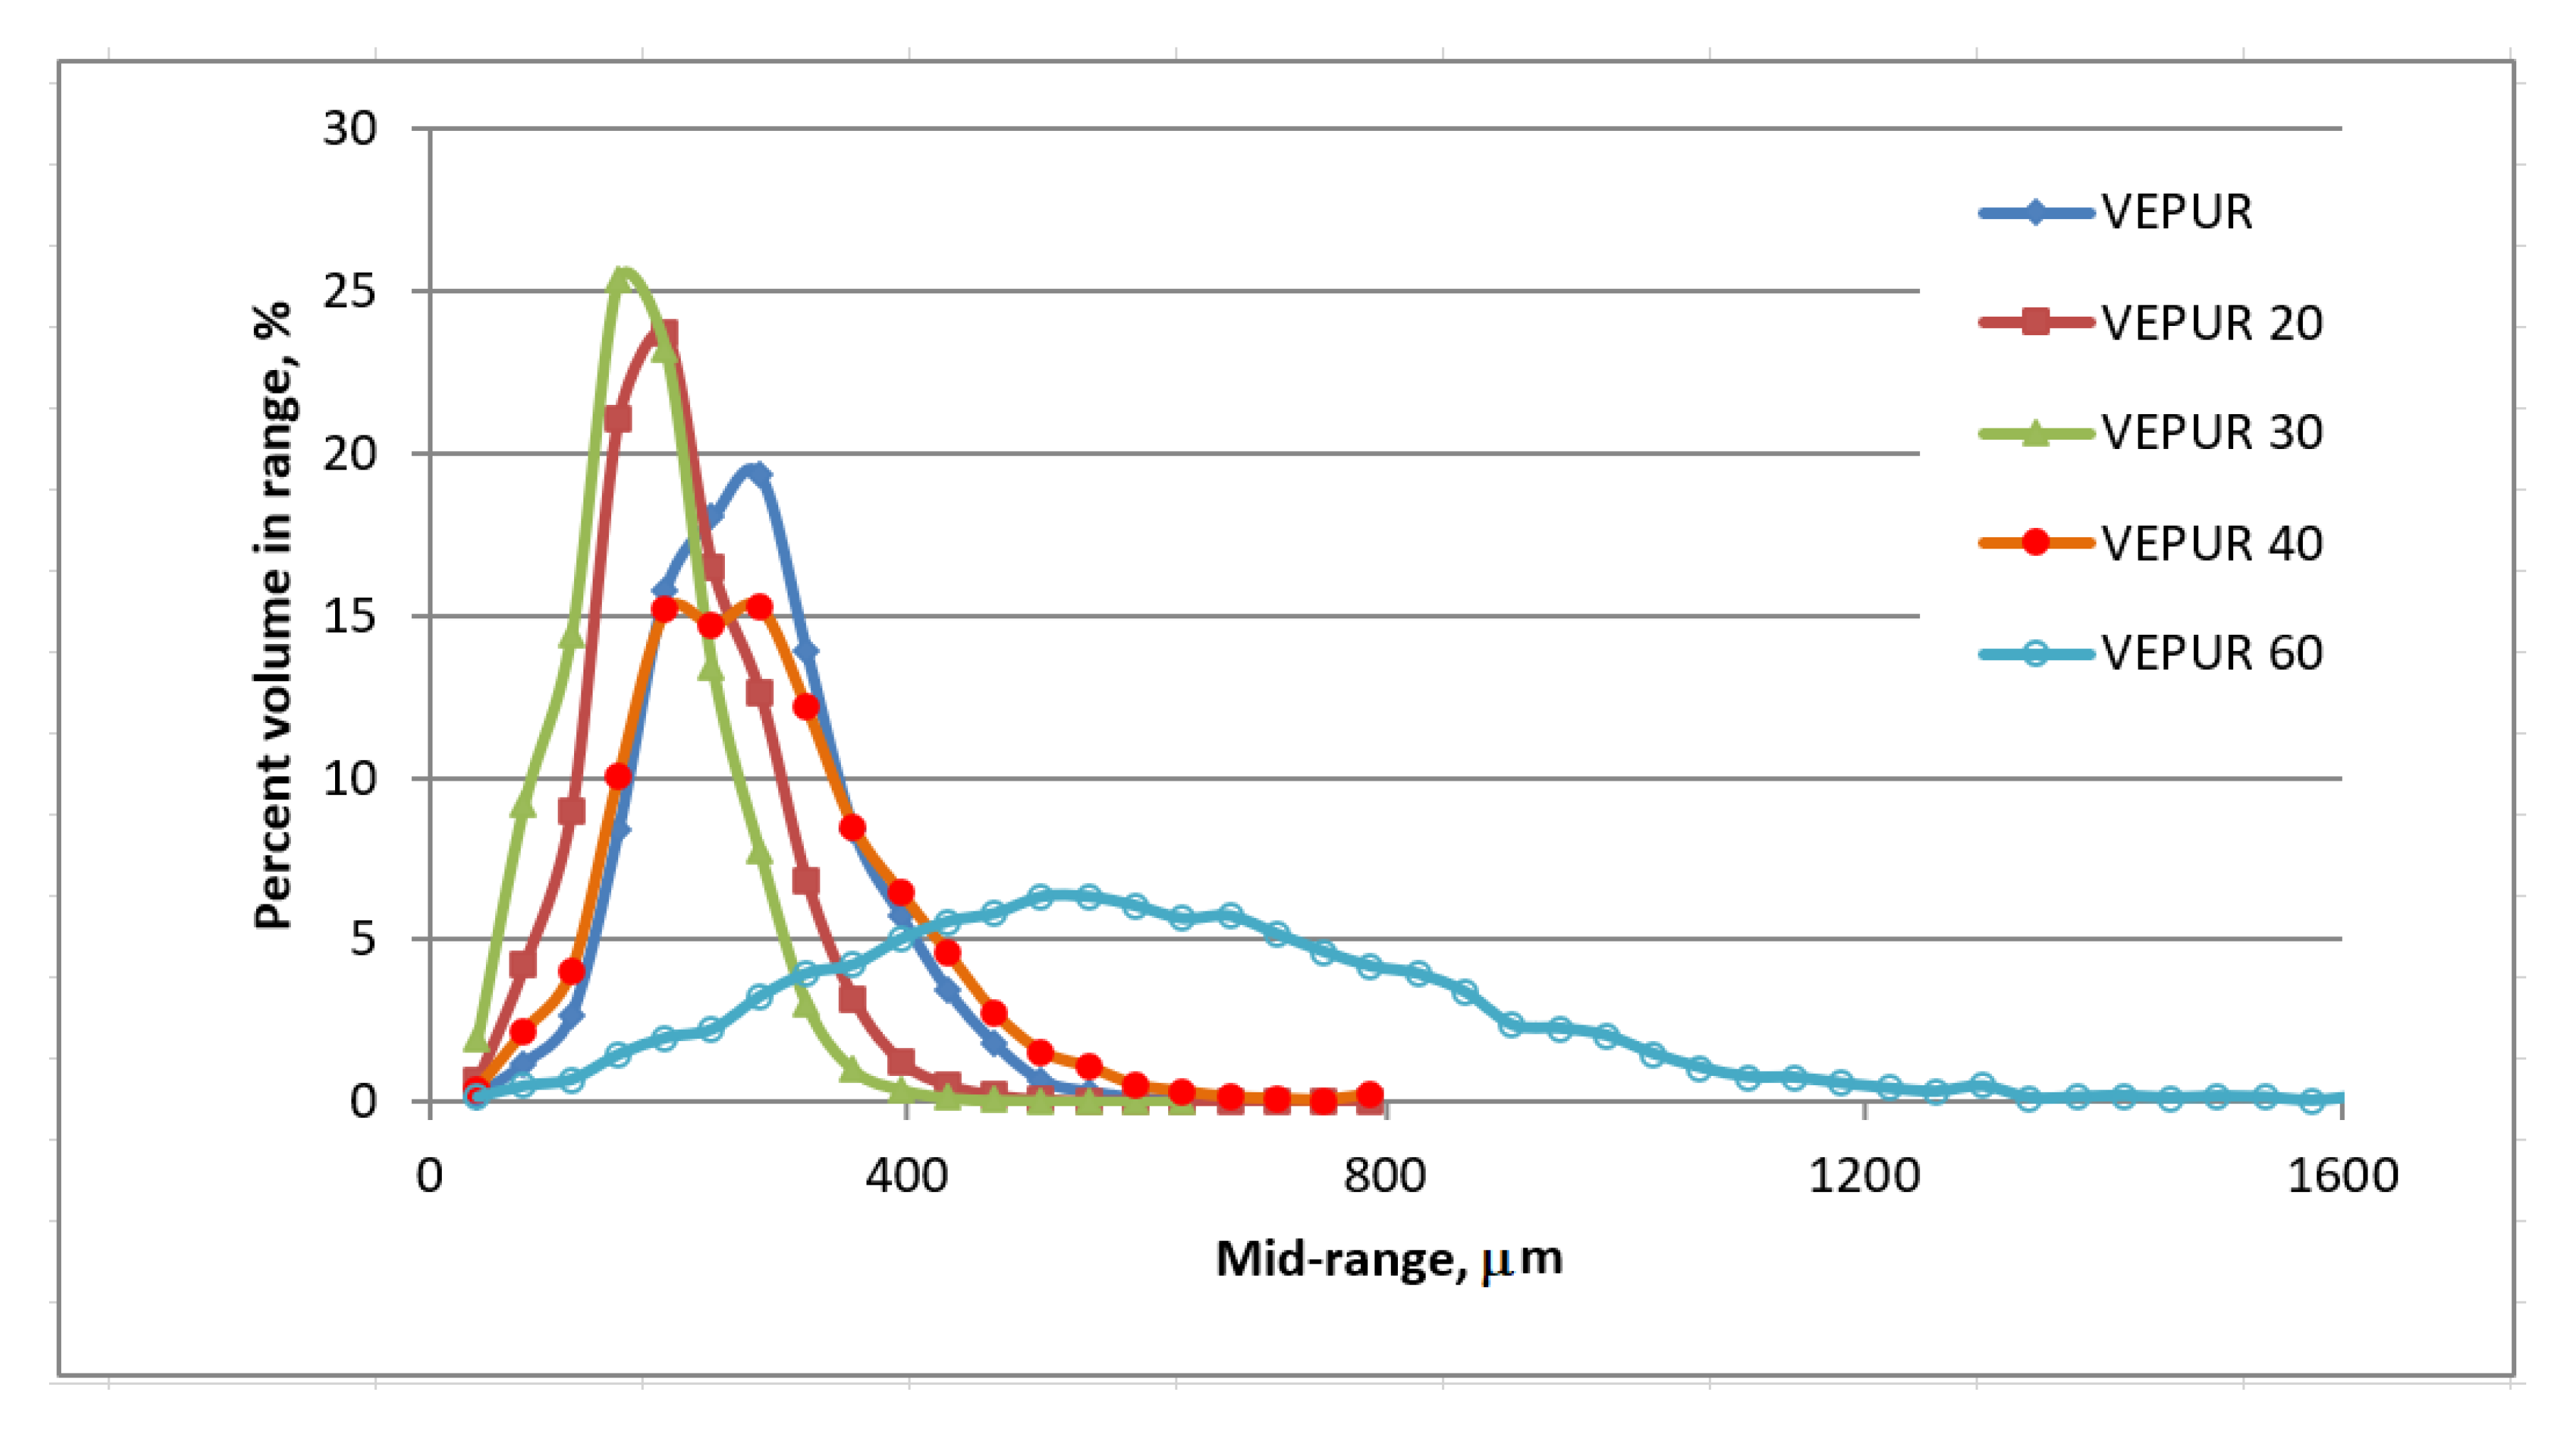
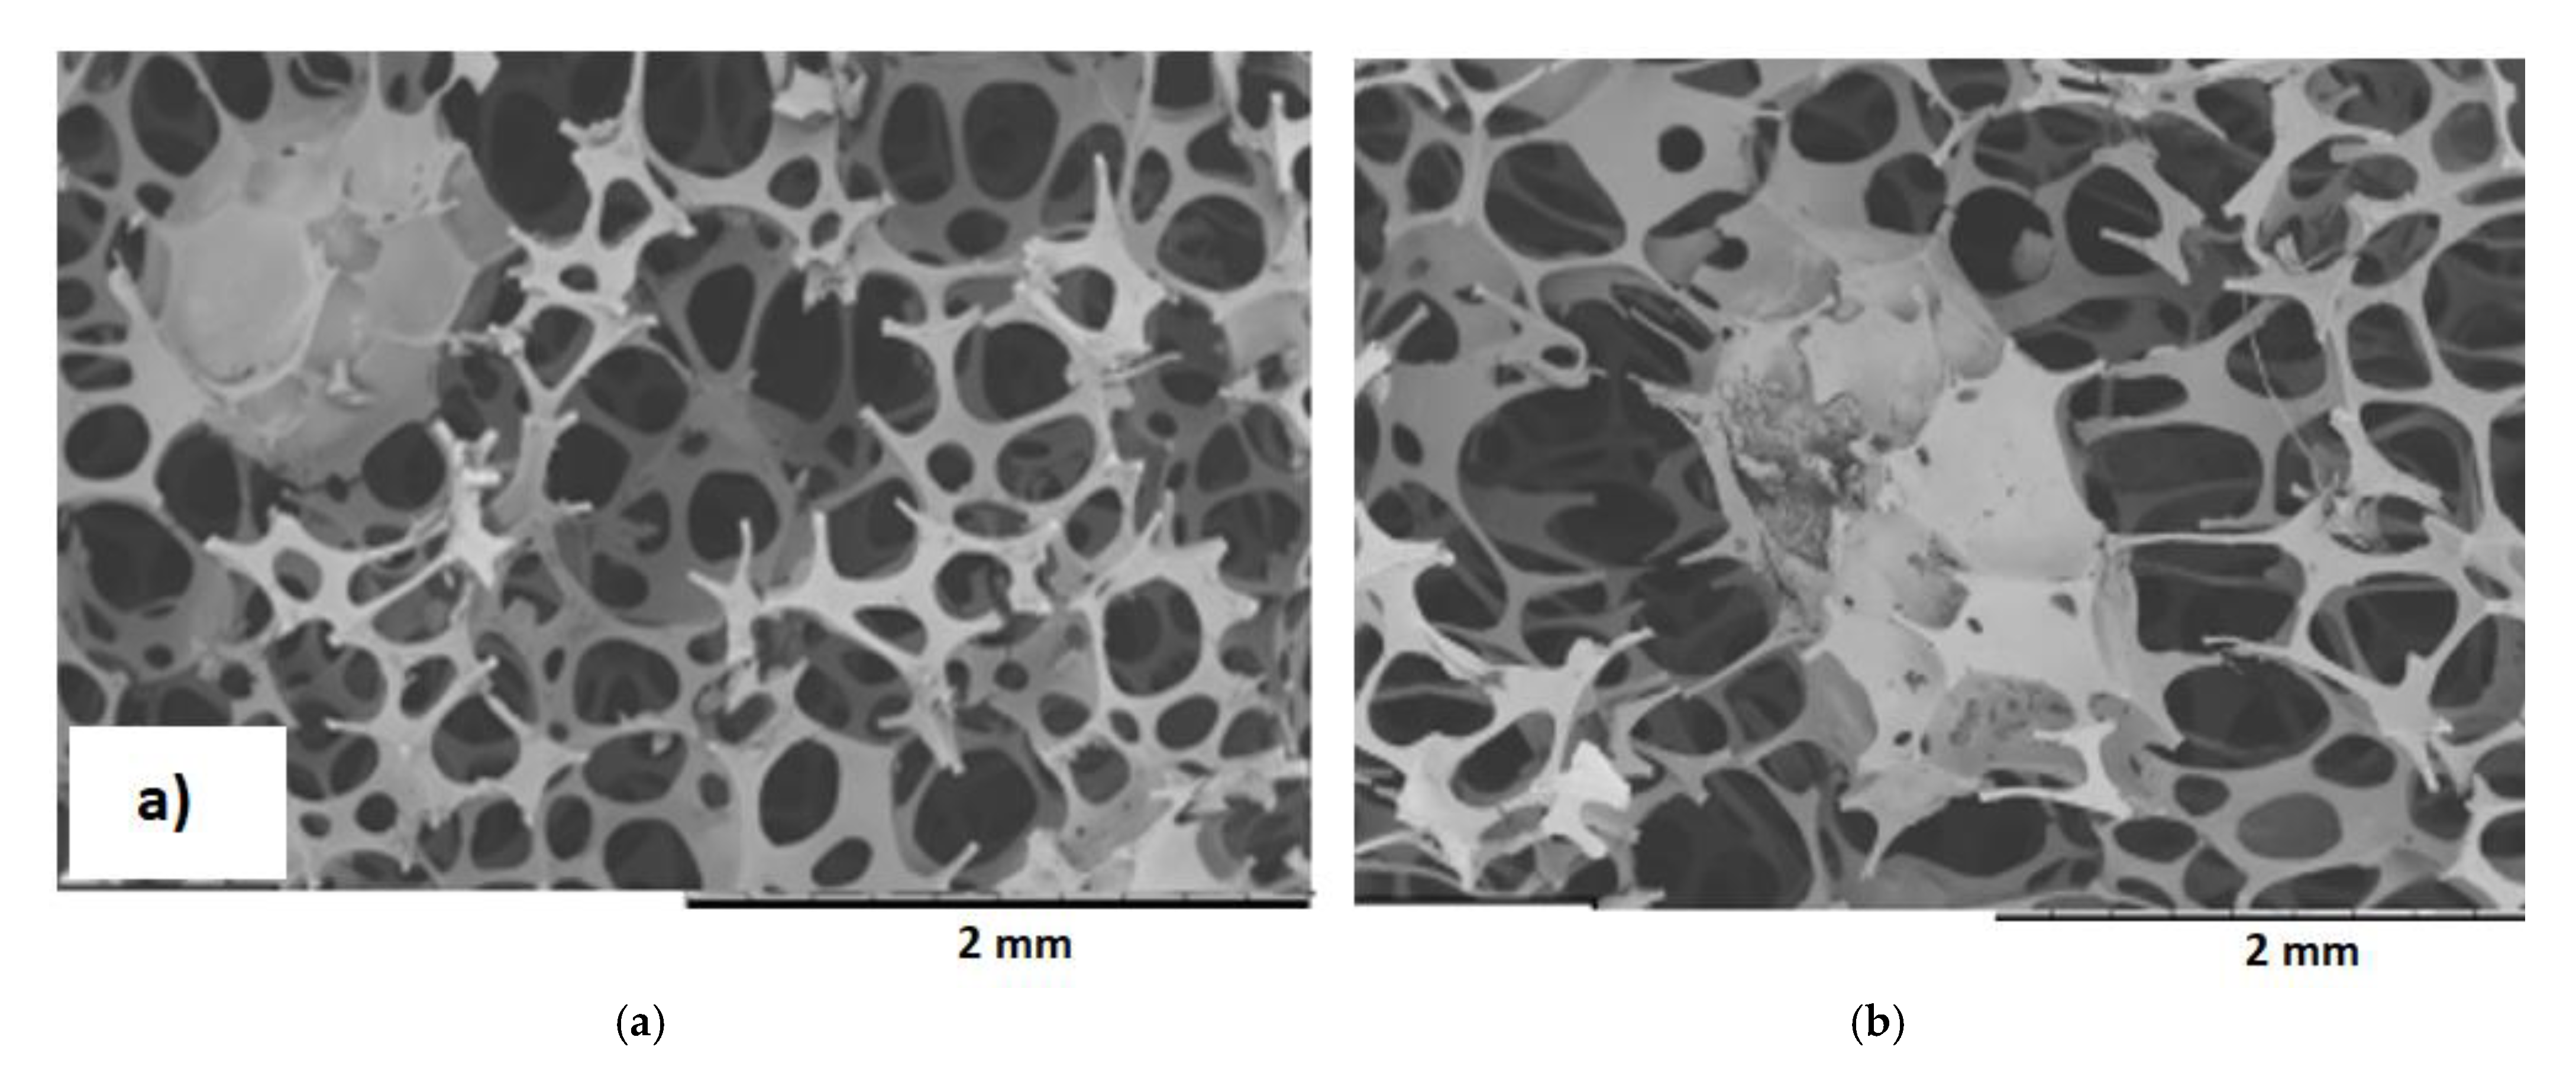
3.3. Cellular Structure of PU Composite Foams
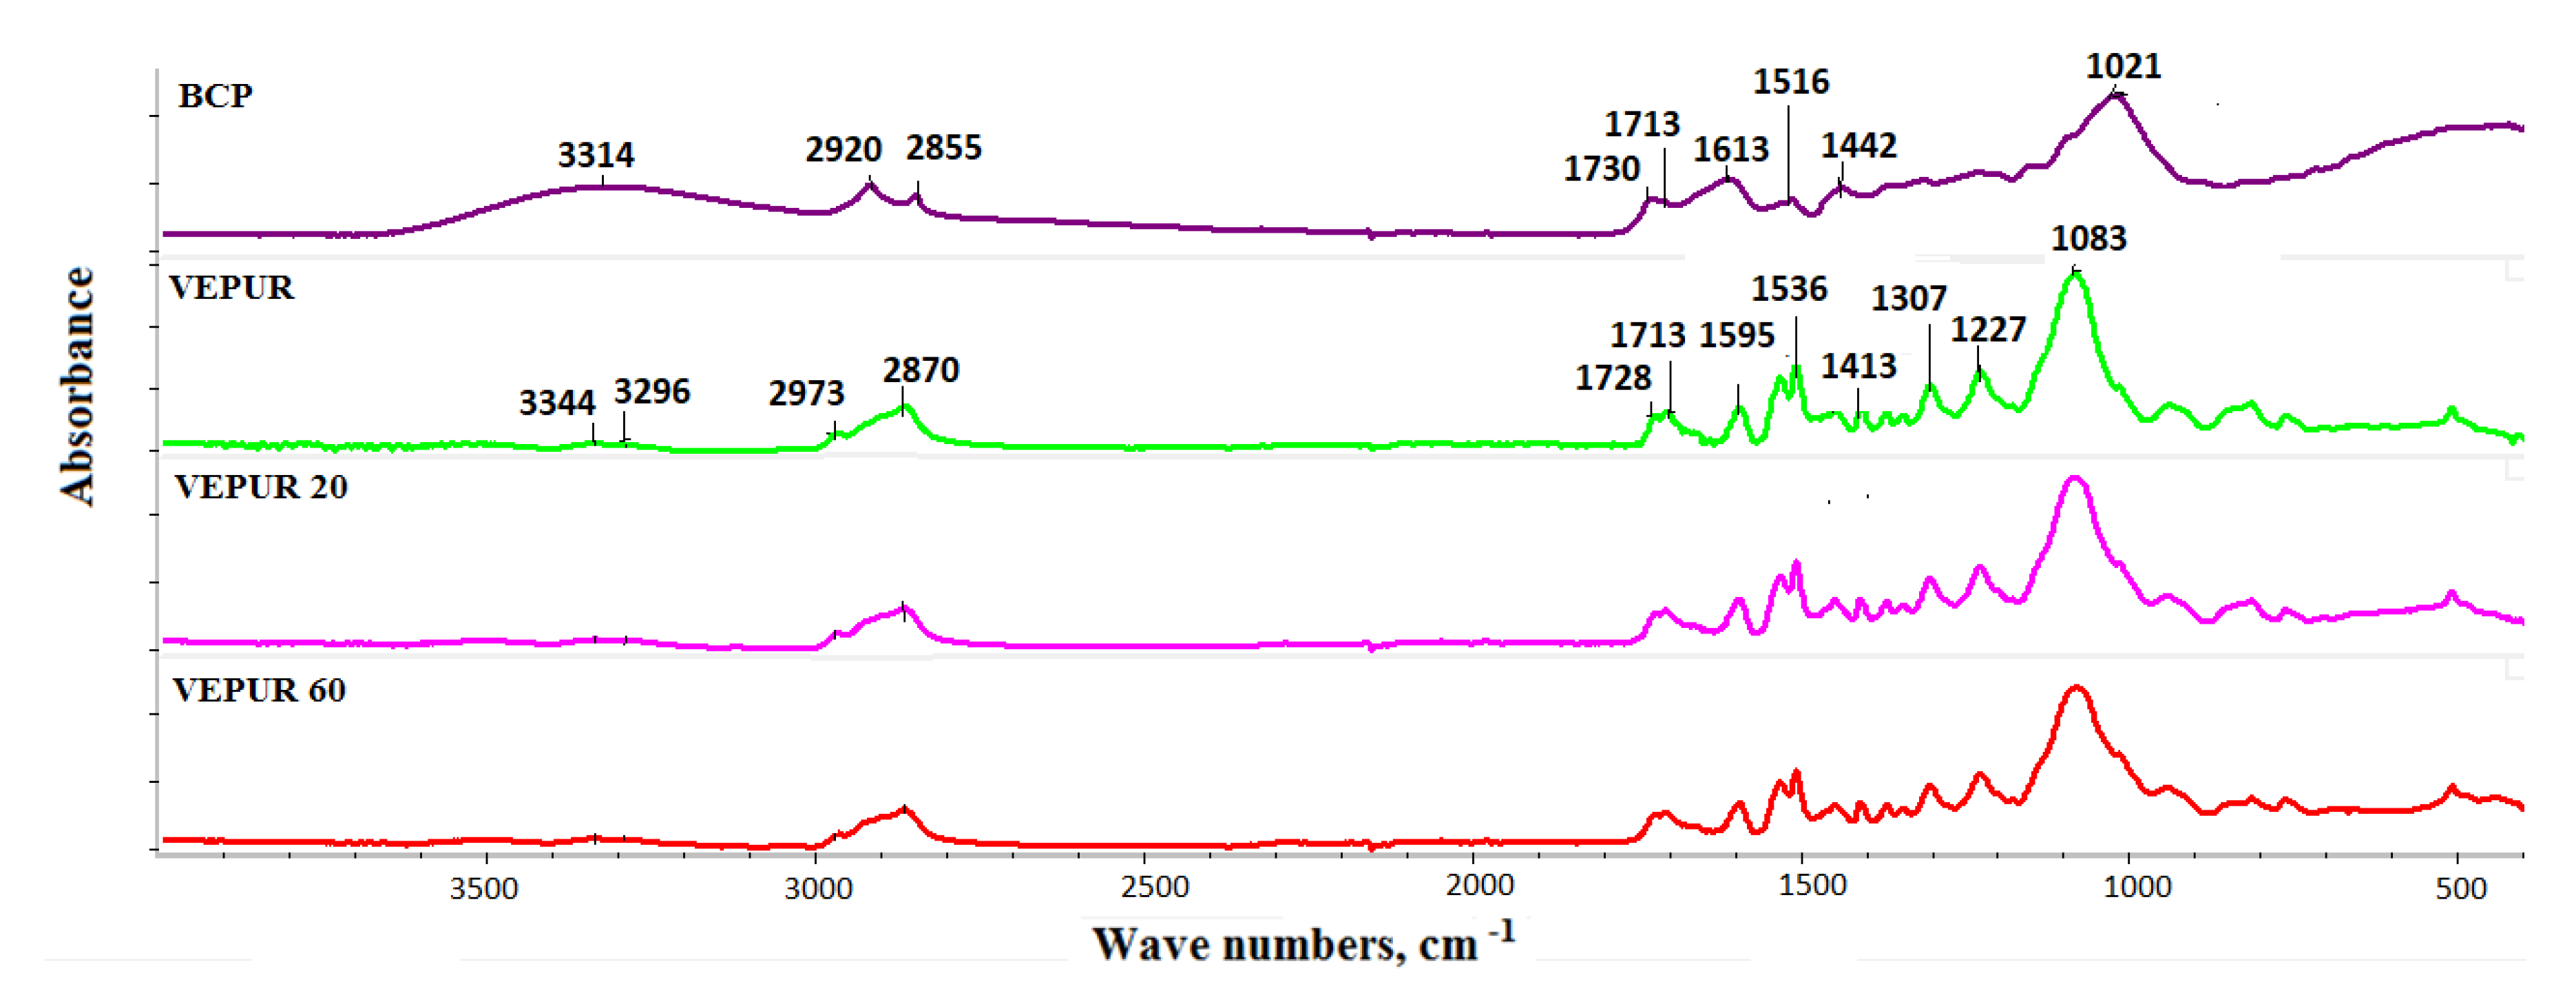
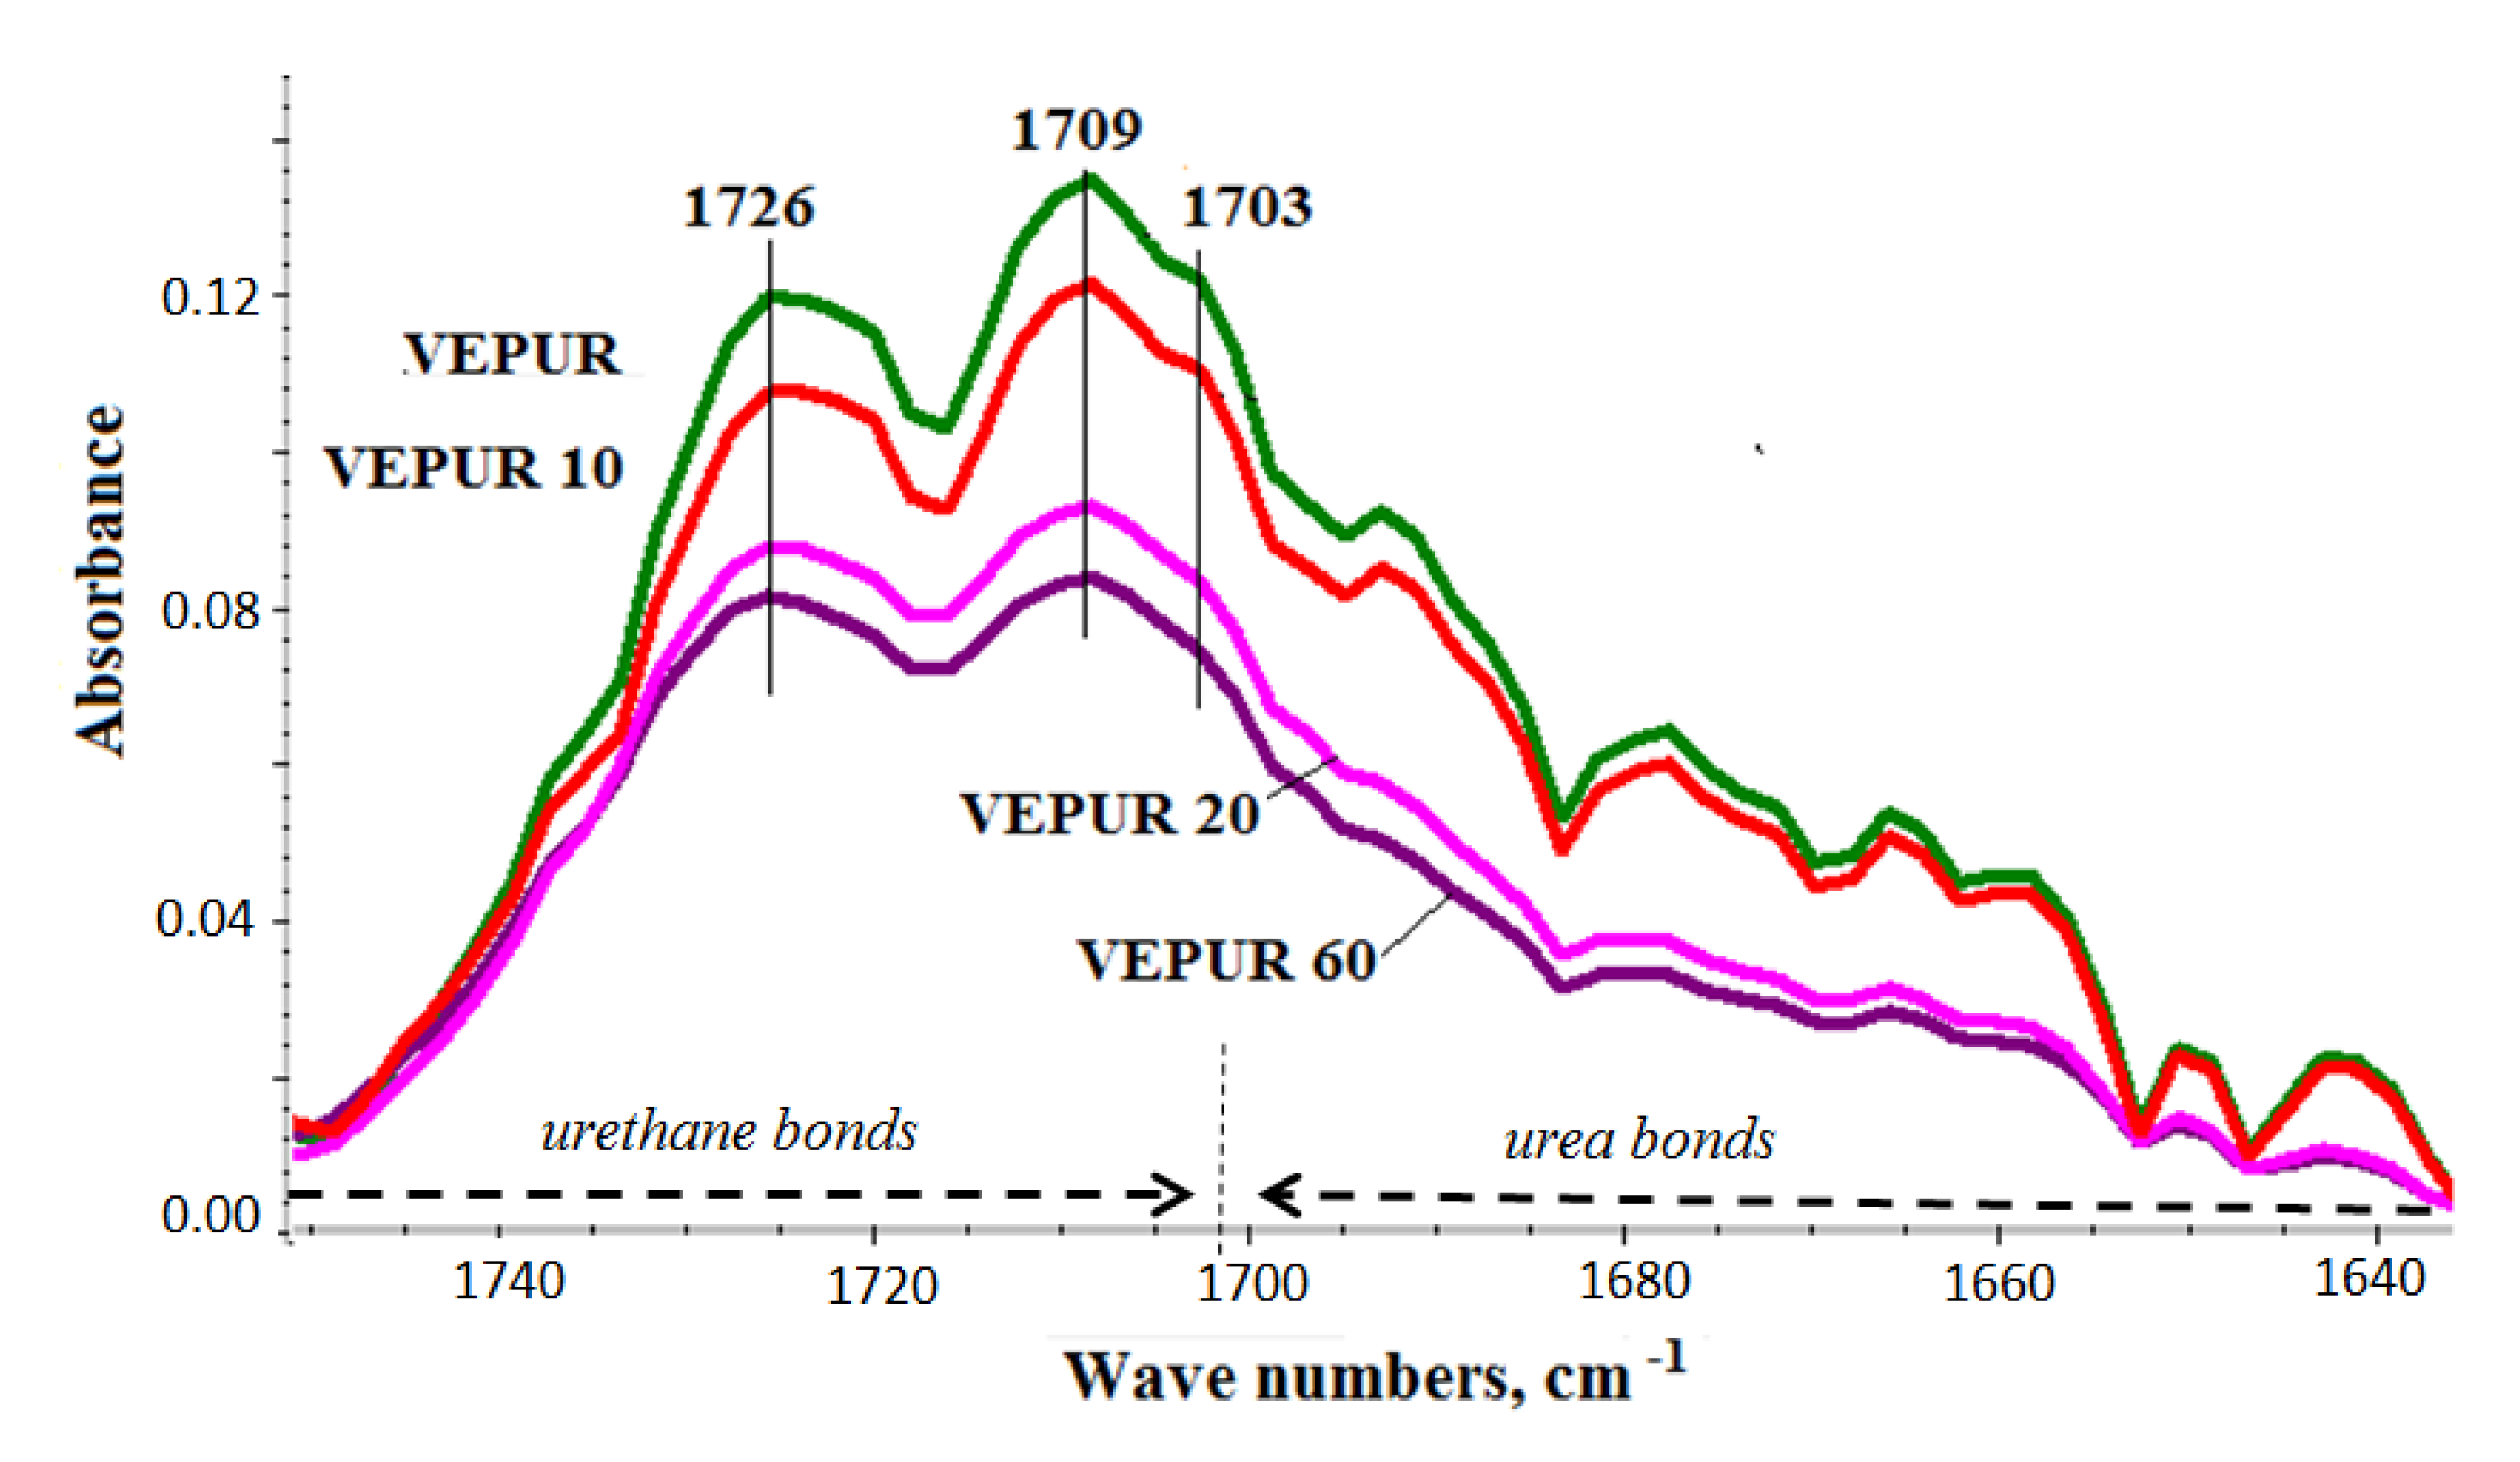
3.4. Chemical Structure of PU Composite Foams
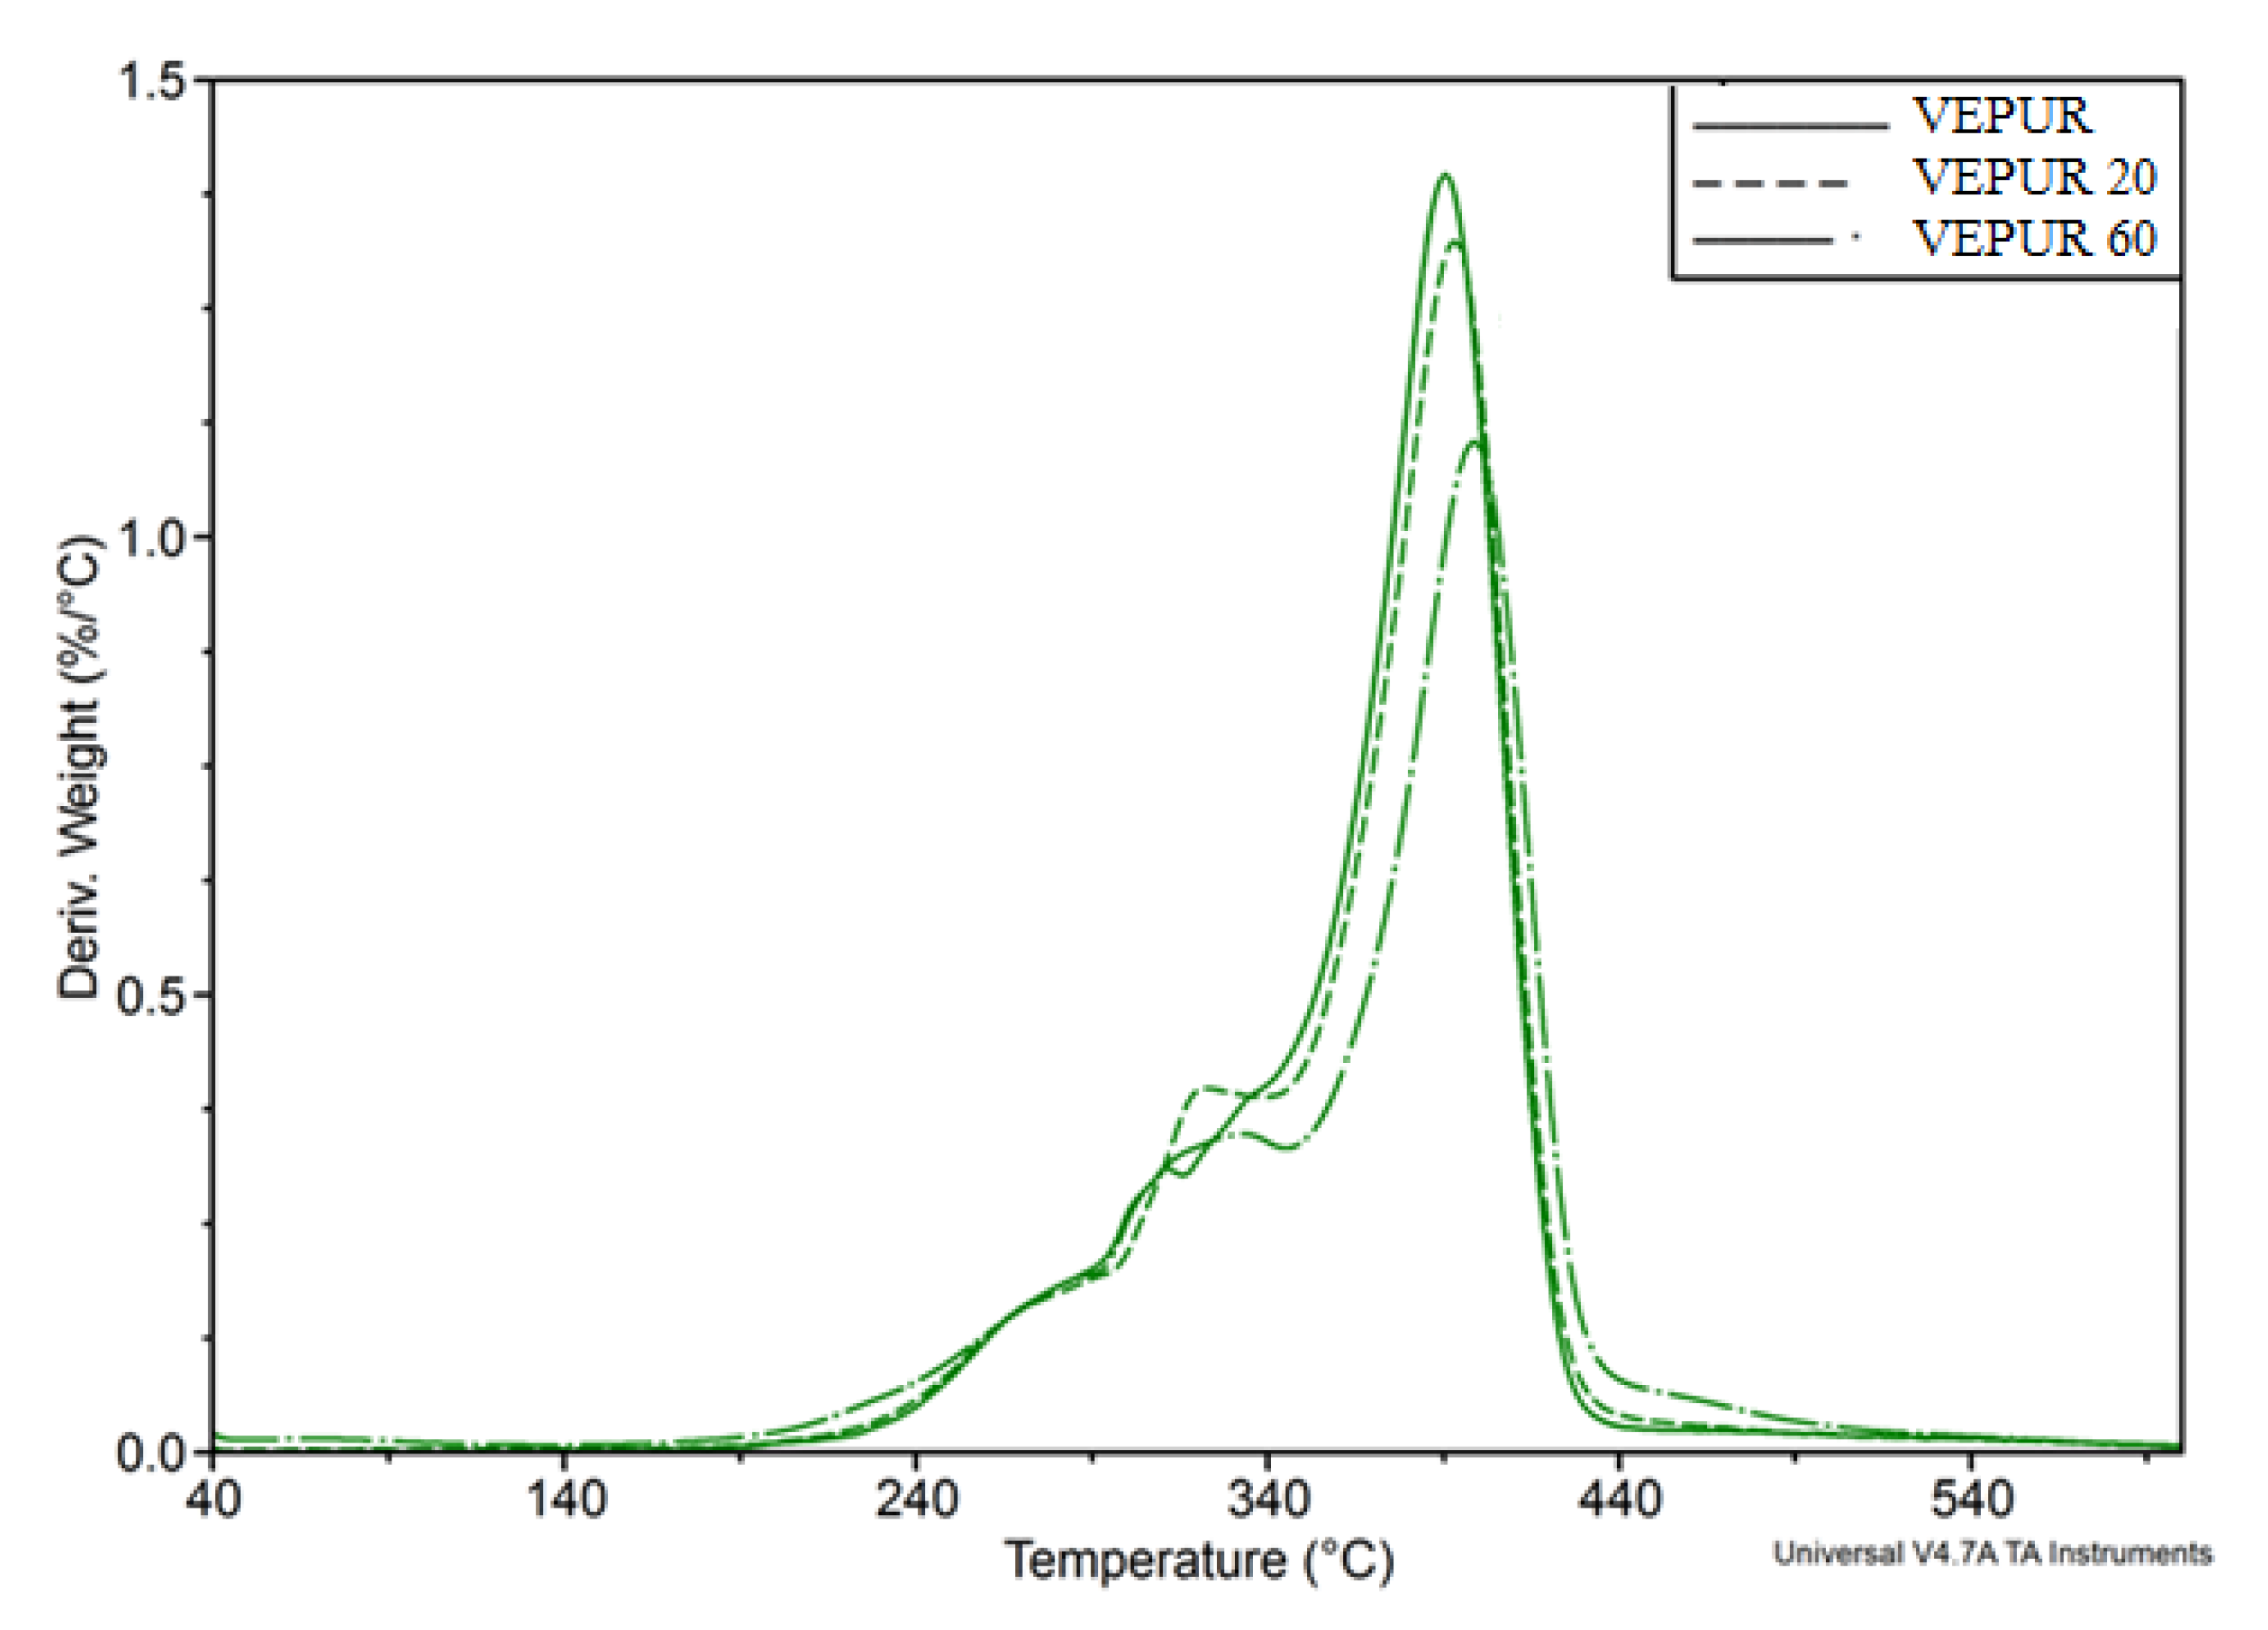
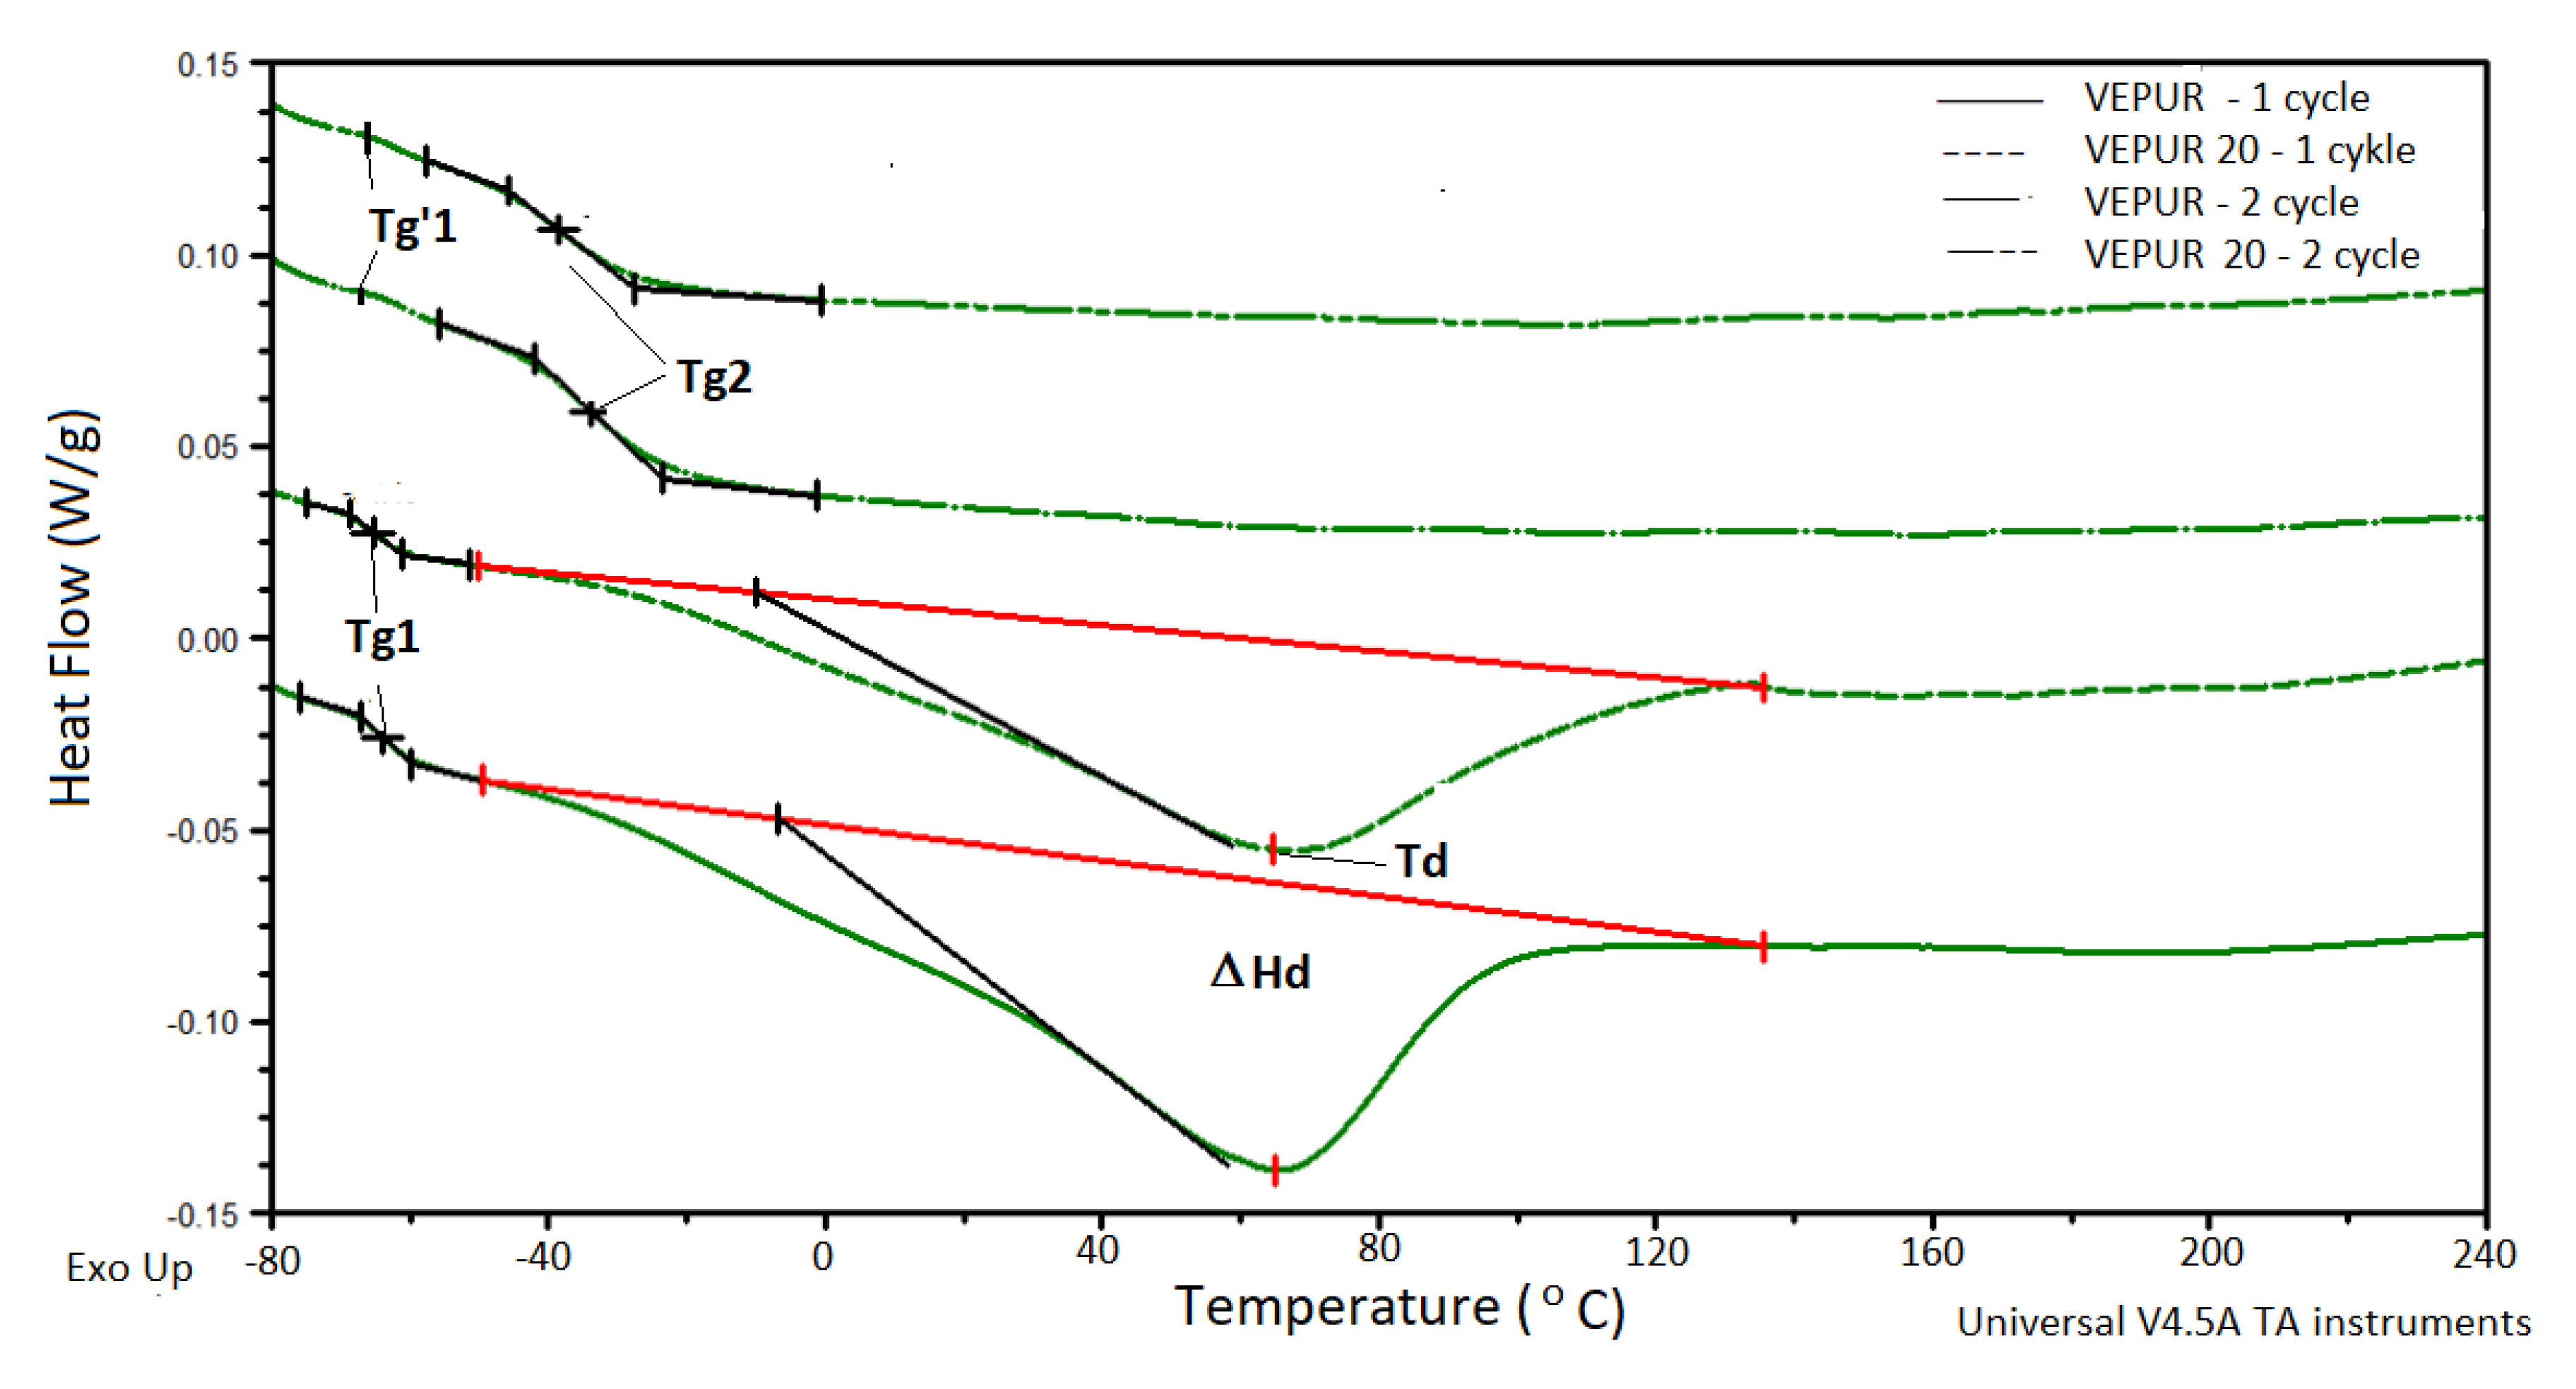
3.5. Thermal Analysis
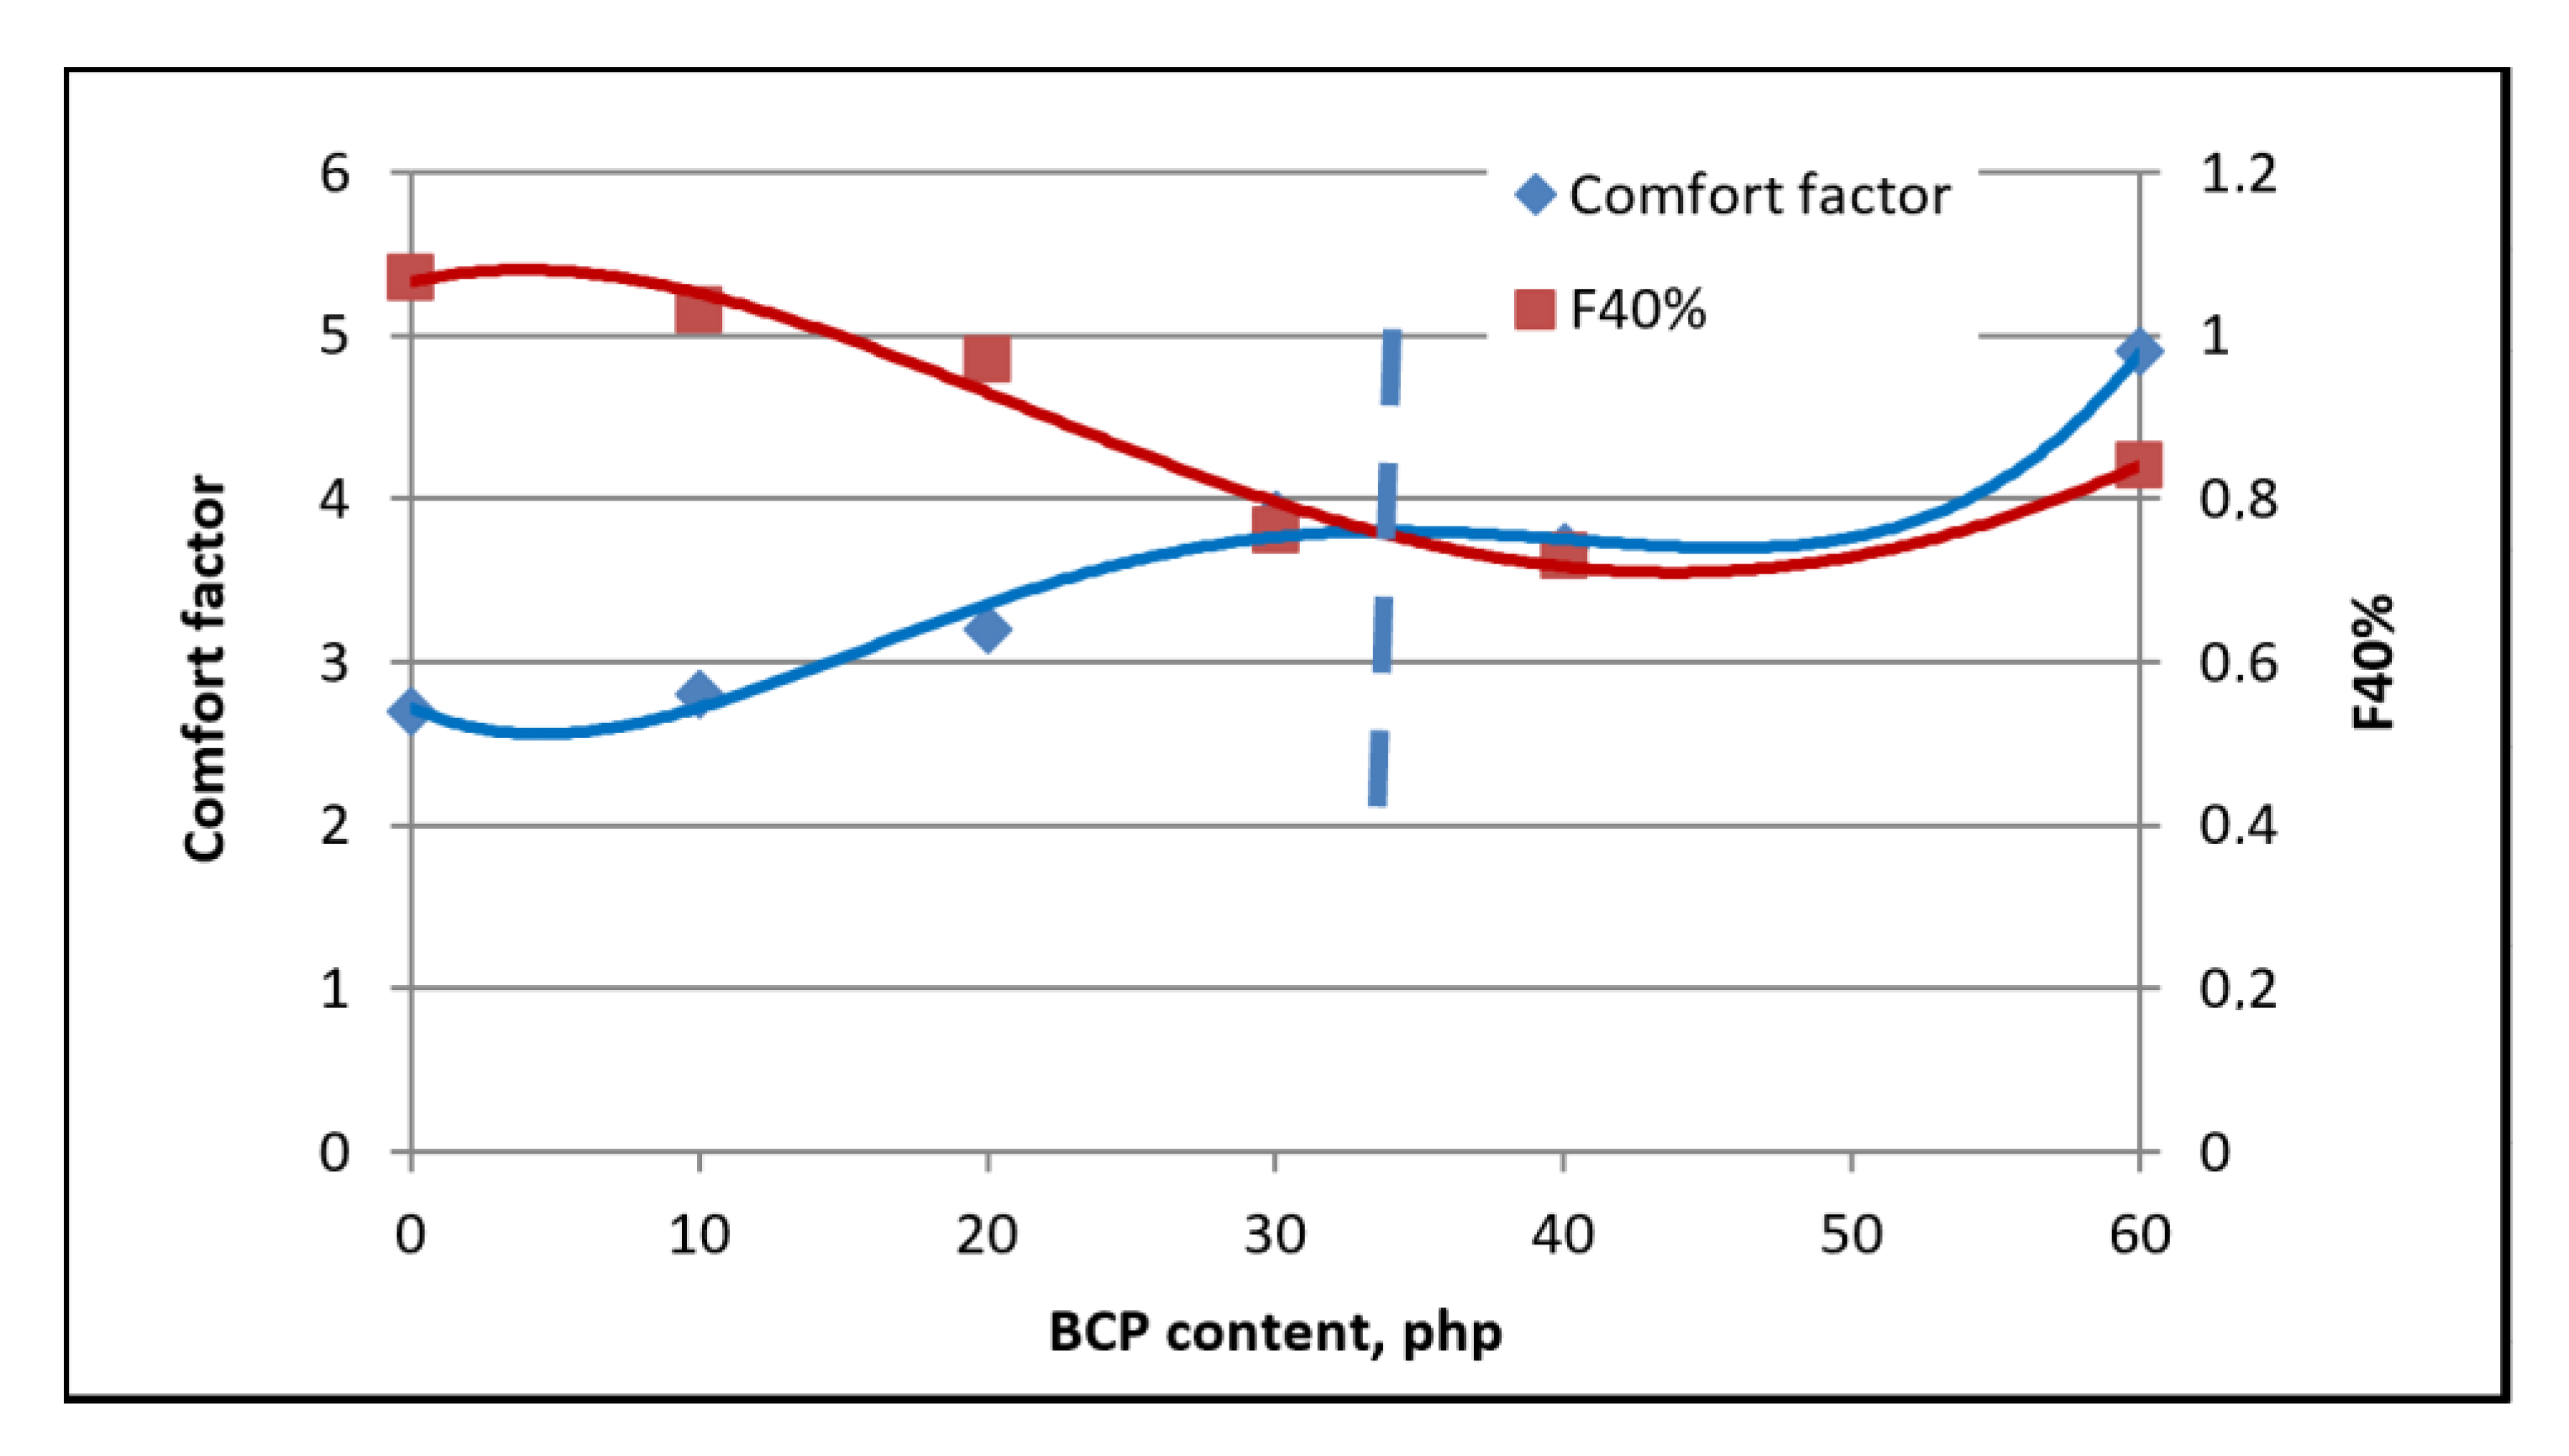
3.6. Mechanical Properties
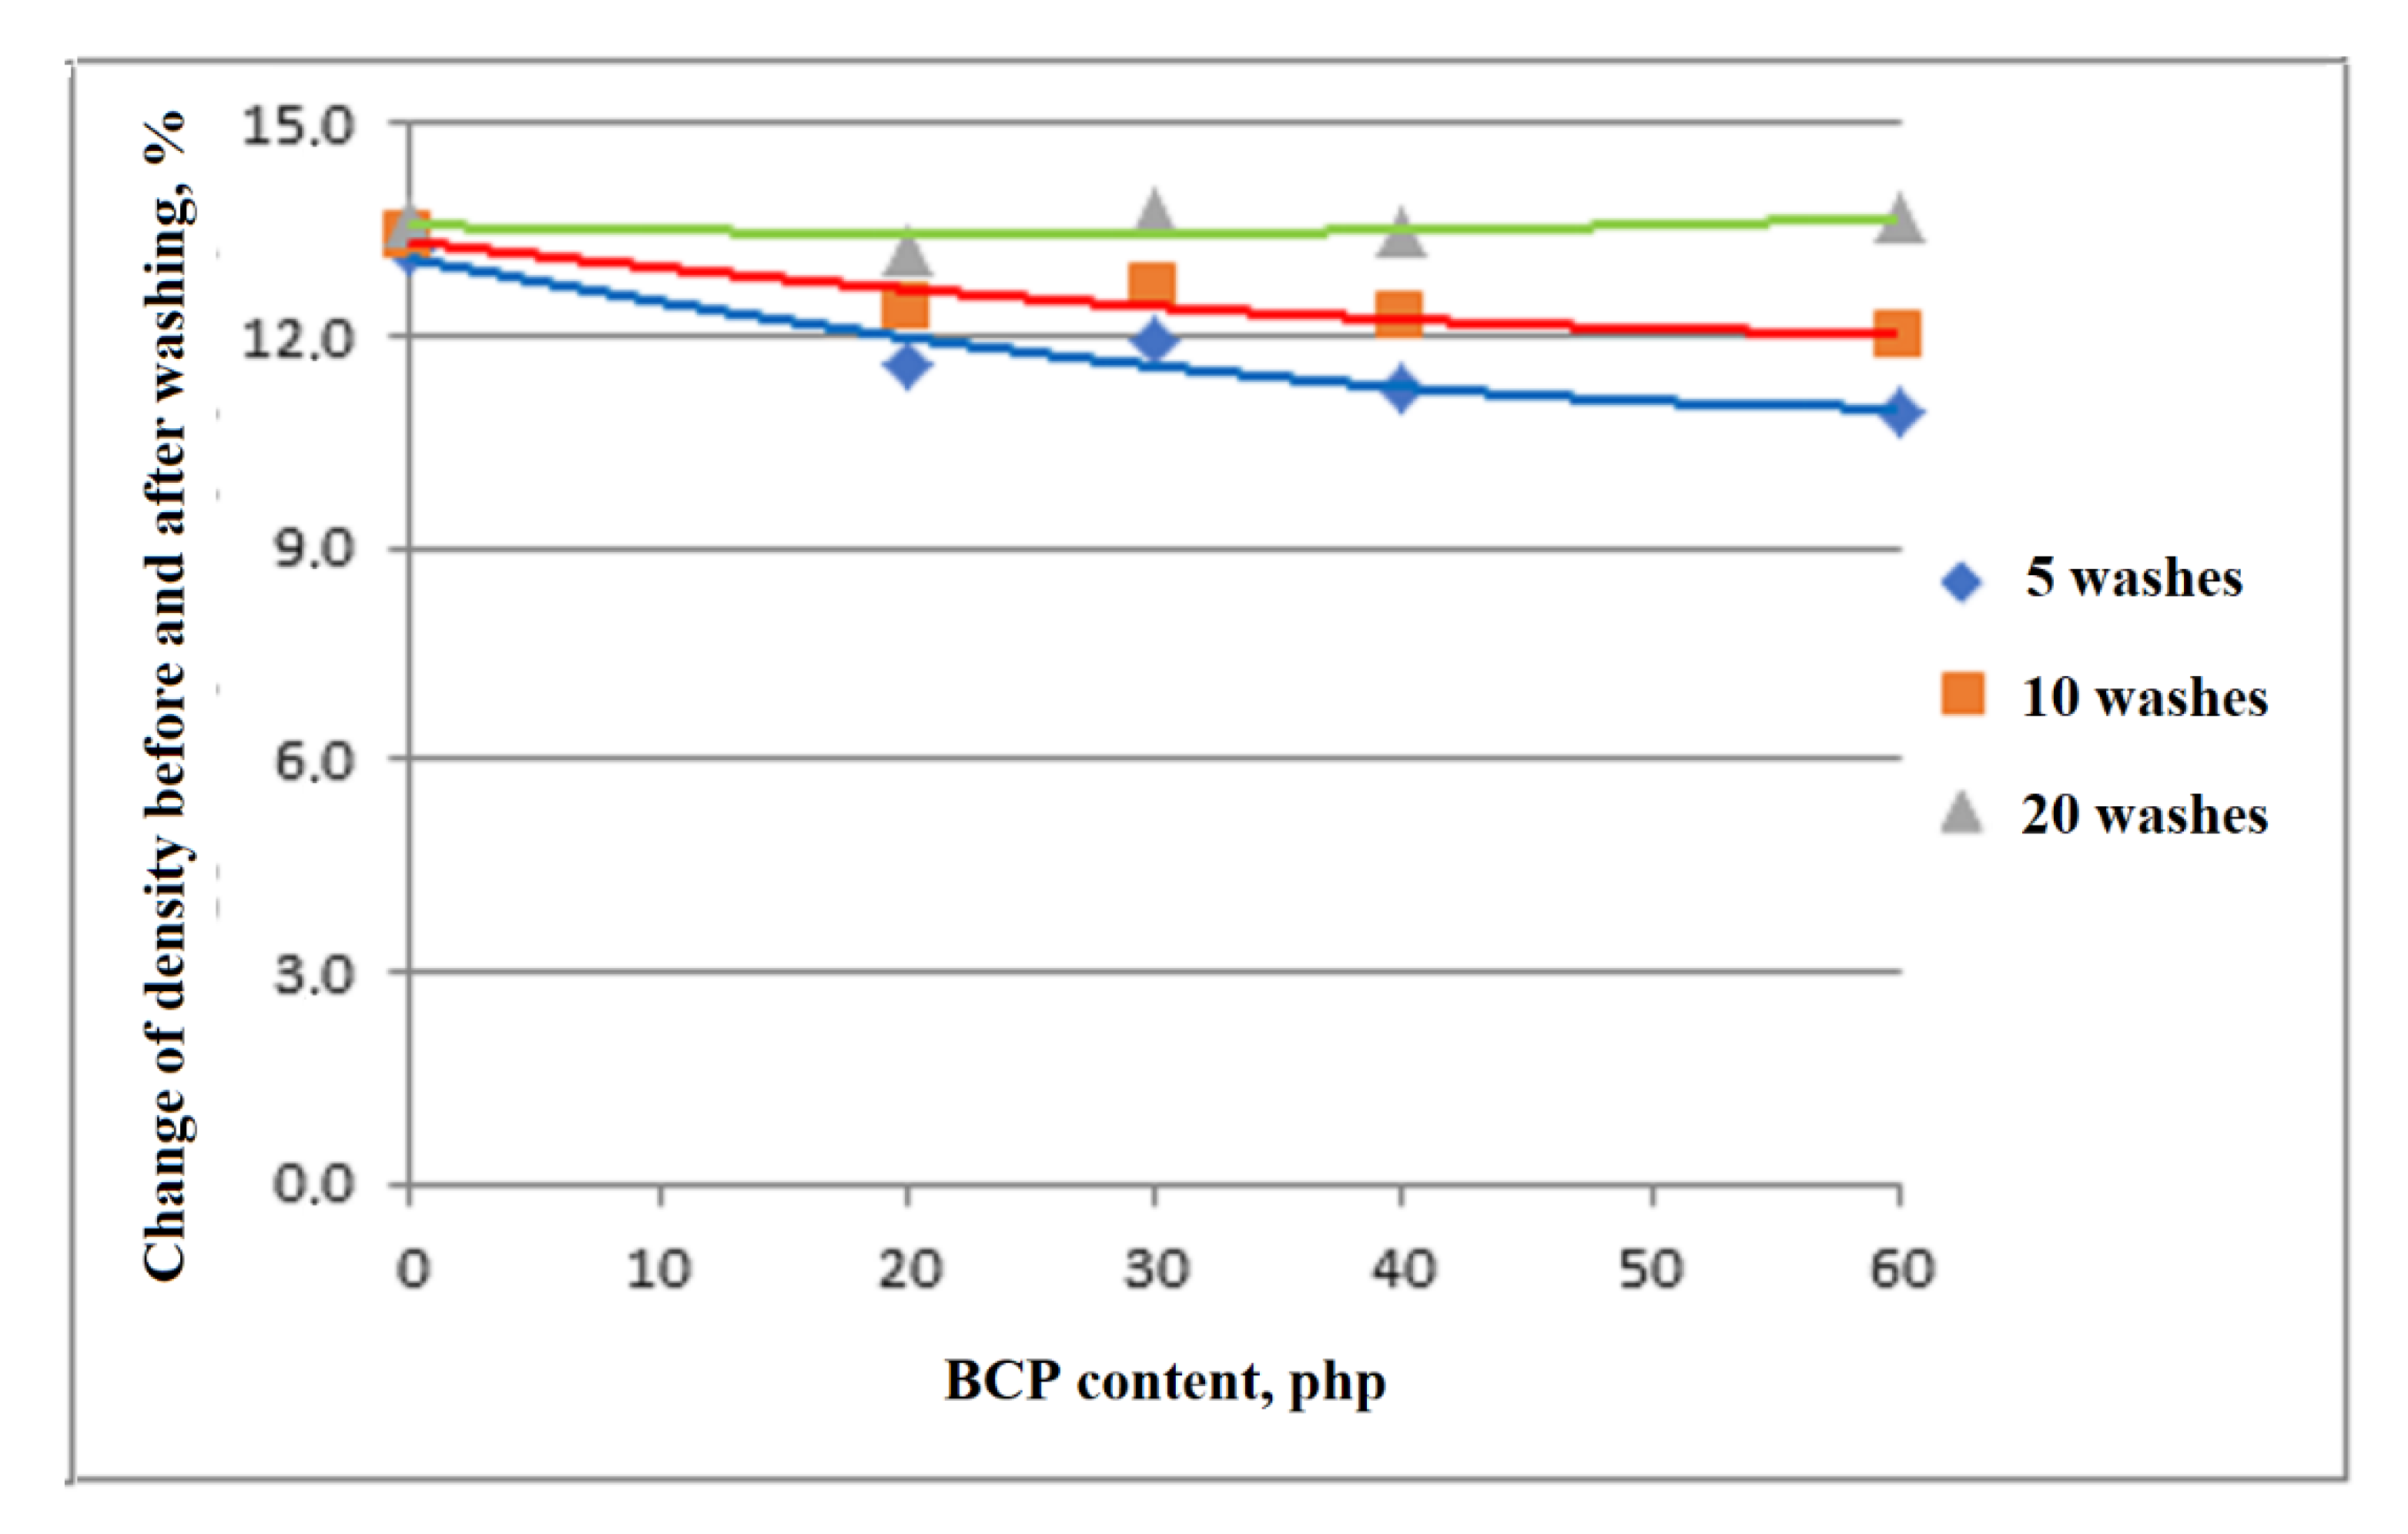
3.7. Analysis of Apparent Density of Foams Washing
4. Summary and Conclusions
Author Contributions
Funding
Institutional Review Board Statement
Informed Consent Statement
Data Availability Statement
Conflicts of Interest
References
- Ostrowska, M.; Winners, C.O.S. Use of Waste for Food Production. Available online: https://bridge.gov.pl/aktualnosc/pokaz/wykorzystanieodpadow-do-produkcji-zywnosci (accessed on 13 September 2018).
- Global Production of Fresh Fruit From 1990 to 2019. Available online: https://www.statista.com/statistics/262266/global-production-of-fresh-fruit (accessed on 5 June 2020).
- Resulting Estimate of the Main Agricultural and Horticultural Crops in 2019. Available online: https://stat.gov.pl/obszary-tematyczne/rolnictwo-lesnictwo/uprawy-rolne-i-ogrodnicze/wynikowy-szacunek-glownych-ziemioplodow-rolnych-i-ogrodniczych-w-2019-roku,5,18.html (accessed on 5 June 2020).
- Data of Polish Fruit and Vegetable Production. Available online: http://ksow.gov.pl/rynki-rolne/news/entry/8426-ostateczne-dane-polskiej-produkcji-owocow-i-war.html (accessed on 5 June 2020).
- Predicting a World Record for the Production of Berries. Available online: http://ksow.gov.pl/rynki-rolne/news/entry/8494-nadal-przewidywania-rekordu-swiatowej-produkcji.html (accessed on 5 June 2020).
- IERiGŻ Report: Fruit and Vegetable Market and Fruit and Vegetable Preserves. Available online: https://www.portalspozywczy.pl/owoce-warzywa/wiadomosci/raport-ierigz-rynek-owocow-i-warzyw-oraz-przetworow-owocowo-warzywnych,173692.html (accessed on 5 June 2020).
- KOWR: Poland is the largest producer of currants in the European Union. Available online: https://www.sadyogrody.pl/owoce/101/kowr_polska_najwiekszym_producentem_porzeczek_w_unii_europejskiej,18662.html (accessed on 5 June 2020).
- Polish Power in the Production of Black Currants in the World-Dr hab. Stanisław Pluta. Available online: https://apetytnapolskie.com/polska-potega-w-produkcji-porzeczek-czarnych-w-swiecie-dr-hab-stanislaw-pluta-prof-io/#_ftn1 (accessed on 5 June 2020).
- Global Polyurethane Market Analysis & Trends-Industry Forecast to 2025. Available online: http://www.prnewswire.com/news-releases/global-polyurethane-market-analysis--trends---industry-forecast-to-2025-300431333.html (accessed on 5 June 2020).
- Prociak, A.; Rokicki, G.; Ryszkowska, J. Materiały poliuretanowe. In Wydawnictwo Naukowe; PWN: Warsaw, Poland, 2014; ISBN 9788301187842. [Google Scholar]
- Vaughan, B.R.; Wilkes, G.L.; Dounis, D.V.; McLaughlin, C. Effect of vegetable-based polyols in unimodal glass-transition polyurethane slabstock viscoelastic foams and some guidance for the control of their structure–property behavior. Int. J. Appl. Polym. Sci. 2011, 119, 2683–2697. [Google Scholar] [CrossRef]
- Petrovic, Z. Polyurethanes from Vegetable Oils. Polym. Rev. 2008, 48, 109–155. [Google Scholar] [CrossRef]
- Kuranska, M.; Prociak, A. Porous polyurethane composites with natural fibres. Compos. Sci. Technol. 2012, 72, 299–304. [Google Scholar] [CrossRef]
- Pelletier, H.; Belgacem, N.; Gandini, A. Acrylated vegetable oils as photocrosslinkable materials. J. Appl. Polym. Sci. 2006, 99, 3218–3221. [Google Scholar] [CrossRef]
- Soykeabkaew, N.; Supaphol, P.; Rujiravanit, R. Preparation and characterization of jute- and flax-reinforced starch-based composite foams. Carbohydr. Polym. 2004, 58, 53–63. [Google Scholar] [CrossRef]
- Zmarlicki, K.; Brzozowski, P. Conditions for the Production of Gooseberries, Blackcurrants and Highbush Blueberries. Available online: http://www.inhort.pl/files/program_wieloletni/PW_2015_2020_IO/spr_2016/5.1_2016_Raport_owoce.pdf (accessed on 5 June 2020).
- Zawirska, A. Zagospodarowanie odpadów z przemysłu owocowo-warzywnego. Przemysł Fermenstacyjny i Owocowo-Warzywny 2007, 10, 44–46. [Google Scholar]
- Król, S.; Nawirska, A. Co-removal of metal ions with pomace in a dynamic system. Technol. Aliment. 2003, 2, 21–29. [Google Scholar]
- Sluiter, A.; Hames, B.; Ruiz, R.; Scarlata, C.; Sluiter, J.; Templeton, D.; Crocker, D. Determination of Structural Carbohydrates and Lignin in Biomass. Available online: https://www.nrel.gov/docs/gen/fy13/42618.pdf (accessed on 5 June 2020).
- Layth, M.; Ansari, M.N.M.; Pua, G.; Mohammad, J.; Islam, S.M. A Review on Natural Fiber Reinforced Polymer Composite and Its Applications. Int. J. Polym. Sci. 2015, 2015. [Google Scholar] [CrossRef]
- Dvaranauskaite, A.; Venskutonis, P.R.; Raynaud, C.; Talou, T.; Vi’kelis, P.; Sasnauskas, A. Variation in essential oil composition in buds of six black currant (Ribes Nigrum L.) cultivars at various development phases. Food Chem. 2009, 114, 671–679. [Google Scholar] [CrossRef]
- Helbig, D.; Bohm, V.; Wagner, A.; Schubert, R.; Jahreis, G. Berry seed press residues and their valuable ingredients with special regard to black currant seed press residues. Food Chem. 2008, 111, 1043–1049. [Google Scholar] [CrossRef]
- Del Castillo, R.M.L.; Dobson, G.; Brennan, R.; Gordon, S. Genotypic variation in fatty acid content of blackcurrant seeds. J. Agric. Food Chem. 2002, 50, 332–335. [Google Scholar] [CrossRef] [PubMed]
- Nawirska, A.; Kwaśniewska, M. Dietary fibre fractions from fruit and vegetable processing waste. Food Chem 2005, 91, 221–225. [Google Scholar] [CrossRef]
- Shen, D.; Xiao, R.; Gu, S.; Zhang, H. The Overview of Thermal Decomposition of Cellulose in Lignocellulosic Biomass. In Cellulose-Biomass Conversion; van de Ven, T., Kadla, J., Eds.; IntechOpen: London, UK, 2013. [Google Scholar] [CrossRef]
- Fengel, D. The ultrastructure of cellulose from wood. Wood Sci. Technol. 1969, 3, 203–217. [Google Scholar] [CrossRef]
- Anioła, J.; Górecka, D.; Gawęcki, J. Composition and selected physicochemical properties of micronizated high-fiber preparations. Żyw. Człow. Metab 2005, 32, 1337–1341. [Google Scholar]
- Malińska, K. Laboratory determination of air-filled porosity for composting materials. Inż. Ochr. Środ. 2012, 15, 155–167. [Google Scholar]
- Saunders, J.H.; Frisch, K.C. Polyurethanes; Izdatielstwo Akadiemii Nauk SSSR: Moskwa, Russia, 1968. [Google Scholar]
- Heiss, H.L.; Combs, F.P.; Gemeinhardt, P.G.; Saunders, J.H.; Hardy, E.E. Influence of Acids and Bases on Preparation of Urethane Polymers. Ing. Eng Chem. 1959, 51, 929–934. [Google Scholar] [CrossRef]
- Olczyk, W. Poliuretany; W.N.T.: Warsaw, Poland, 1968. [Google Scholar]
- Lipatowa, T.E. Kataliticzeskaja Polimeryzacja Oligomerow i Formirowanie Polimernych Setok; Naukowa Dumka: Kijew, Russia, 1974. [Google Scholar]
- Mueller, S.; Llewellin, E.W.; Mader, H.M. The rheology of suspensions of solid particles. Proc. R. Soc. A Math. Phys. Eng. Sci. 2010, 466, 1201–1228. [Google Scholar] [CrossRef]
- Kurańska, M.; Barczewski, M.; Uram, K.; Lewandowski, K.; Prociak, A.; Michałowski, S. Basalt waste management in the production of highly effective porous polyurethane composites for thermal insulating applications. Polym. Test. 2019, 76, 90–100. [Google Scholar] [CrossRef]
- Kurańska, M.; Prociak, A.; Cabulis, U.; Kirpiuks, M. Water-blown polyurethane polyisocyanurate foams based on bio-polyols with wood fibers. Polimery 2015, 60, 75–712. [Google Scholar] [CrossRef]
- Kurańska, M.; Prociak, A.; Cabulis, U.; Kirpluks, M.; Ryszkowska, J.; Auguścik, M. Innovative porous polyurethane-polyisocyanurate foams based on rapeseed oil and modified with expandable graphite. Ind. Crops Prod. 2017, 95, 316–323. [Google Scholar] [CrossRef]
- Prociak, A.; Malewska, E.; Bąk, S. Influence of Isocyanate Index on Selected Properties of Flexible Polyurethane Foams Modified with Various Bio-Components. J. Renew. Mater. 2016, 4, 78–85. [Google Scholar] [CrossRef]
- Landers, R.; Knott, W.; Boinowitz, T. New Cell Opening Strategies for TDI 80 Viscoelastic Foams by Additive Means. In Proceedings of the Conference Polyurethanes, Houston, TX, USA, 17–19 October 2005; pp. 77–83. [Google Scholar]
- The Adjustment of Physical Properties of Viscoelastic Foam–the Role of Different Raw Materials. Available online: https://www.pu-additives.com/product/pu-additives/downloads/adjustments-of-physical-properties.pdf (accessed on 5 June 2020).
- The Importance of Cell Structure for Viscoelastic Foams. Available online: https://www.pu-additives.com/product/pu-additives/downloads/importance-of-cell-structure-for-viscoelastic-foams.pdf (accessed on 7 January 2021).
- Kurańska, M.; Prociak, A.; Michałowski, S.; Cabulis, U.; Kirpluks, M. Microcellulose as a natural filler in polyurethane foams based on the biopolyol from rapeseed oil. Polimery 2016, 61, 625–632. [Google Scholar] [CrossRef]
- Soto, G.D.; Marcovich, N.E.; Mosiewicki, M.A. Flexible polyurethane foams modified with biobased polyols: Synthesis and physical-chemical characterization. J. Appl. Polym. Sci. 2016, 133, 3833. [Google Scholar] [CrossRef]
- Dillon, J.G. Infrared Spectroscopic Atlas of Polyurethanes; Technomic Publishing Co.: Lancaster, PA, USA; Basel, Switzerland, 1989; ISBN 87762-615-4.
- Tu, Y.C.; Suppes, G.J.; Hsieh, F.H. Thermal and mechanical behavior of flexible polyurethane-molded plastic films and water-blown foams with epoxidized soybean oil. J. Appl. Polym. Sci. 2009, 111, 1311–1317. [Google Scholar] [CrossRef]
- Hatchett, D.; Kinyanju, J.M.; Sapochak, L. FTIR Analysis of Chemical Gradients in Thermally Processed Molded Polyurethane Foam. J. Cell. Plast. 2007, 43, 183–196. [Google Scholar] [CrossRef]
- Zieleniewska, M.; Szczepkowski, L.; Krzyżowska, M.; Leszczyński, M.K.; Ryszkowska, J. Rigid polyurethane foam composites with vegetable filler for application in the cosmetics industry. Polimery 2016, 61, 807–814. [Google Scholar] [CrossRef]
- Mazurek, M.M.; Tomczyk, K.; Auguścik, M.; Ryszkowska, J.; Rokicki, G. Influence of the soft segment length on the properties of water-cured poly(carbonateurethane-urea)s. Polym. Adv. Technol. 2015, 26, 57–67. [Google Scholar] [CrossRef]
- Bernardini, J.; Angullesi, I.; Coltelli, M.B.; Cinelli, P.; Lazzeri, A. Optimizing the lignin based synthesis of flexible polyurethane foams employing reactive liquefying agents. Polym. Int. 2015, 64, 1235–1244. [Google Scholar] [CrossRef]
- Demirci, F.; Yildirim, K.; Kocer, H.B. Antimicrobial open-cell polyurethane foams with quaternary ammonium salts. J. Appl. Polym. Sci. 2018, 135, 5914. [Google Scholar] [CrossRef]
- Zhang, L.; Jeon, H.K.; Malsam, J.; Herrington, R.; Macosko, C.W. Substituting soybean oil-based polyol into polyurethane flexible foams. Polymery 2007, 48, 6656–6667. [Google Scholar] [CrossRef]
- Sonnenschein, M.F.; Prange, R.; Schrock, A.K. Mechanism for compression set of TDI polyurethane foams. Polymer 2007, 48, 616–623. [Google Scholar] [CrossRef]
- Cassel, R.B.; Wadud, B.S. Thermal and Mechanical Analysis of Polyurethane Memory Foam. Am. Lab. 2005, 37, 16–19. [Google Scholar]


| Component | Content, Mass % |
|---|---|
| Water and other components of the second row | 6.0 ± 0.0 |
| Oils | 27.5 ± 0.5 |
| Cellulose | 10.4 ± 0.4 |
| Hemicellulose | 12.7 ± 0.3 |
| Lignin | 43.4 ± 0.5 |
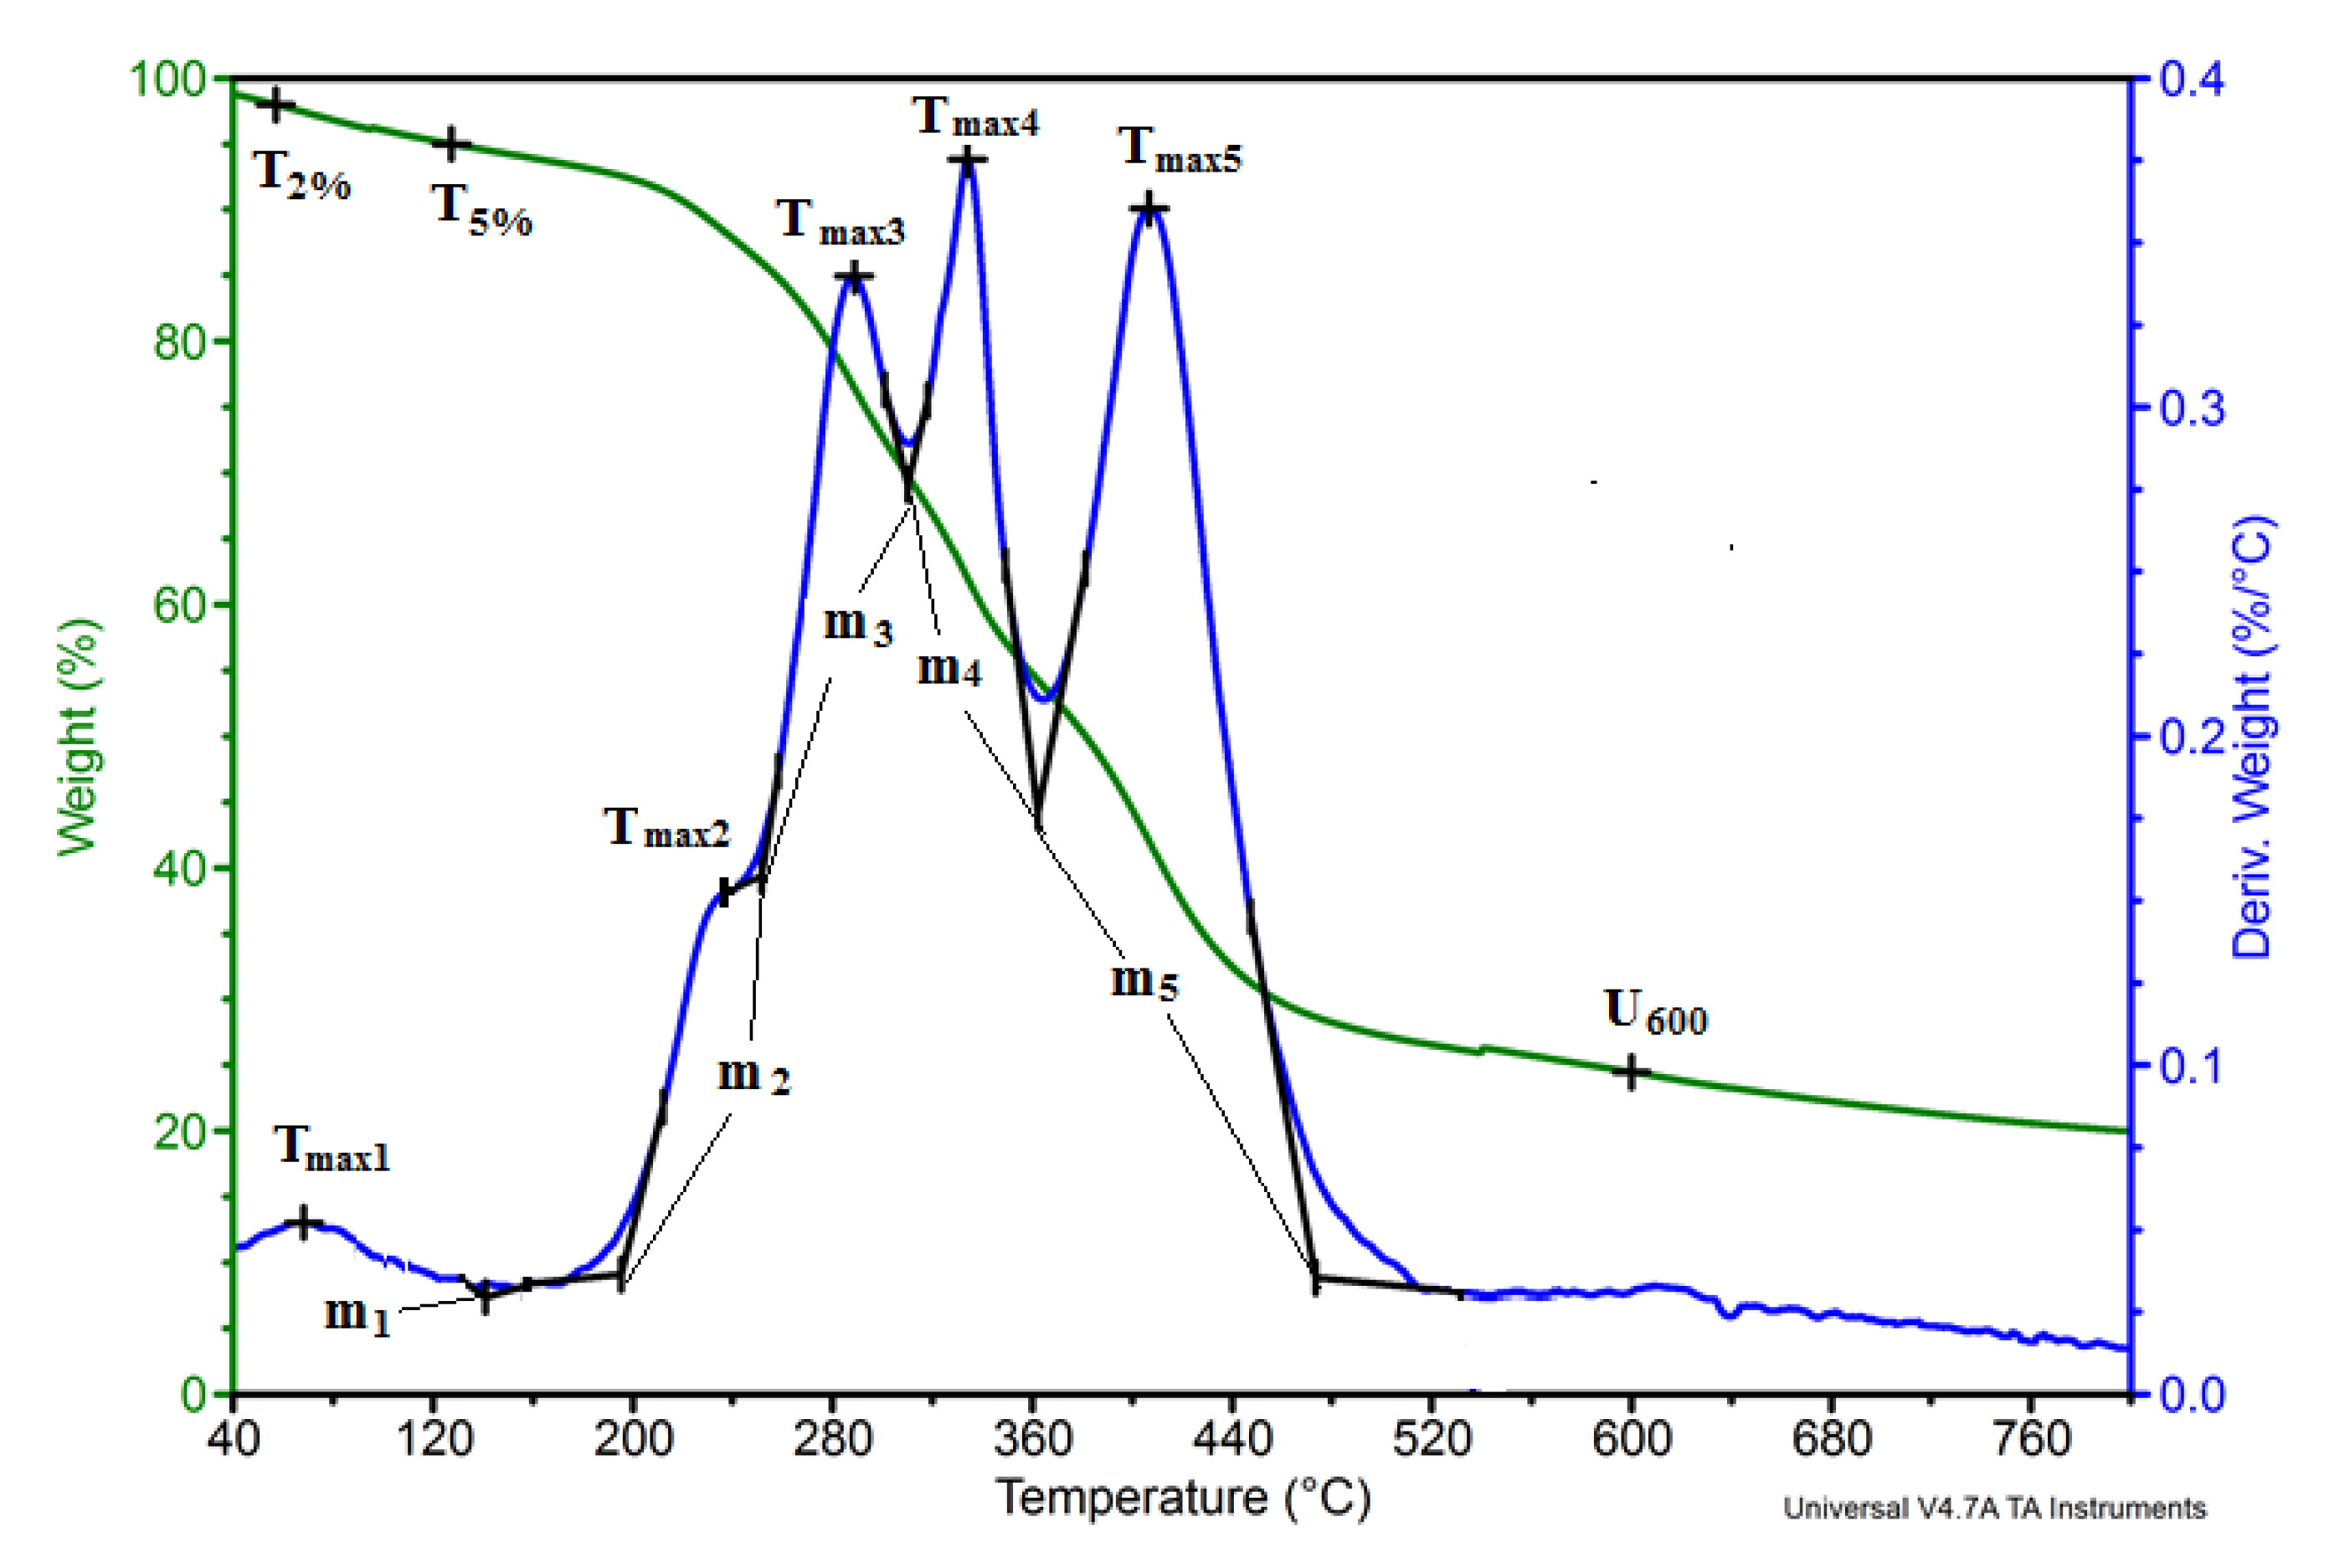
| Stage Number/Parameter | Tsi, °C | Tei, °C | Tmaxi, °C | Vi, %/°C | Δmi, % | Description |
|---|---|---|---|---|---|---|
| Stage 1 | 40 | 152 | 68 | 0.05 | 5.9 | Water |
| Stage 2 | 152 | 194 | 158 | 0.03 | 1.5 | Oils or ingredients II-rows |
| Stage 3 | 194 | 252 | 234 | 0.15 | 6.6 | Hemicellulose |
| Stage 4 | 252 | 310 | 288 | 0.34 | 16.3 | Hemicellulose |
| Stage 5 | 310 | 363 | 334 | 0.38 | 15.7 | Cellulose |
| Stage 6 | 363 | 474 | 407 | 0.36 | 25.3 | Lignin |
| Stage 7 | 474 | 700 | 6.9 | Decomposition of aromatic compounds | ||
| Stage 8 | 700 | 21.8 | Residue after degradation |
| Sample Symbol | Filler Content, php | Foam Growth Time, s | D, kg/m3 |
|---|---|---|---|
| VEPUR | 0 | 170 | 45.0 ± 3.2 |
| VEPUR 10 | 10 | 181 | 45.5 ± 3.7 |
| VEPUR 20 | 20 | 199 | 48.9 ± 2.9 |
| VEPUR 30 | 30 | 202 | 52.0 ± 3.9 |
| VEPUR 40 | 40 | 205 | 55.2 ± 2.4 |
| VEPUR 60 | 60 | 211 | 65.2 ± 2.6 |
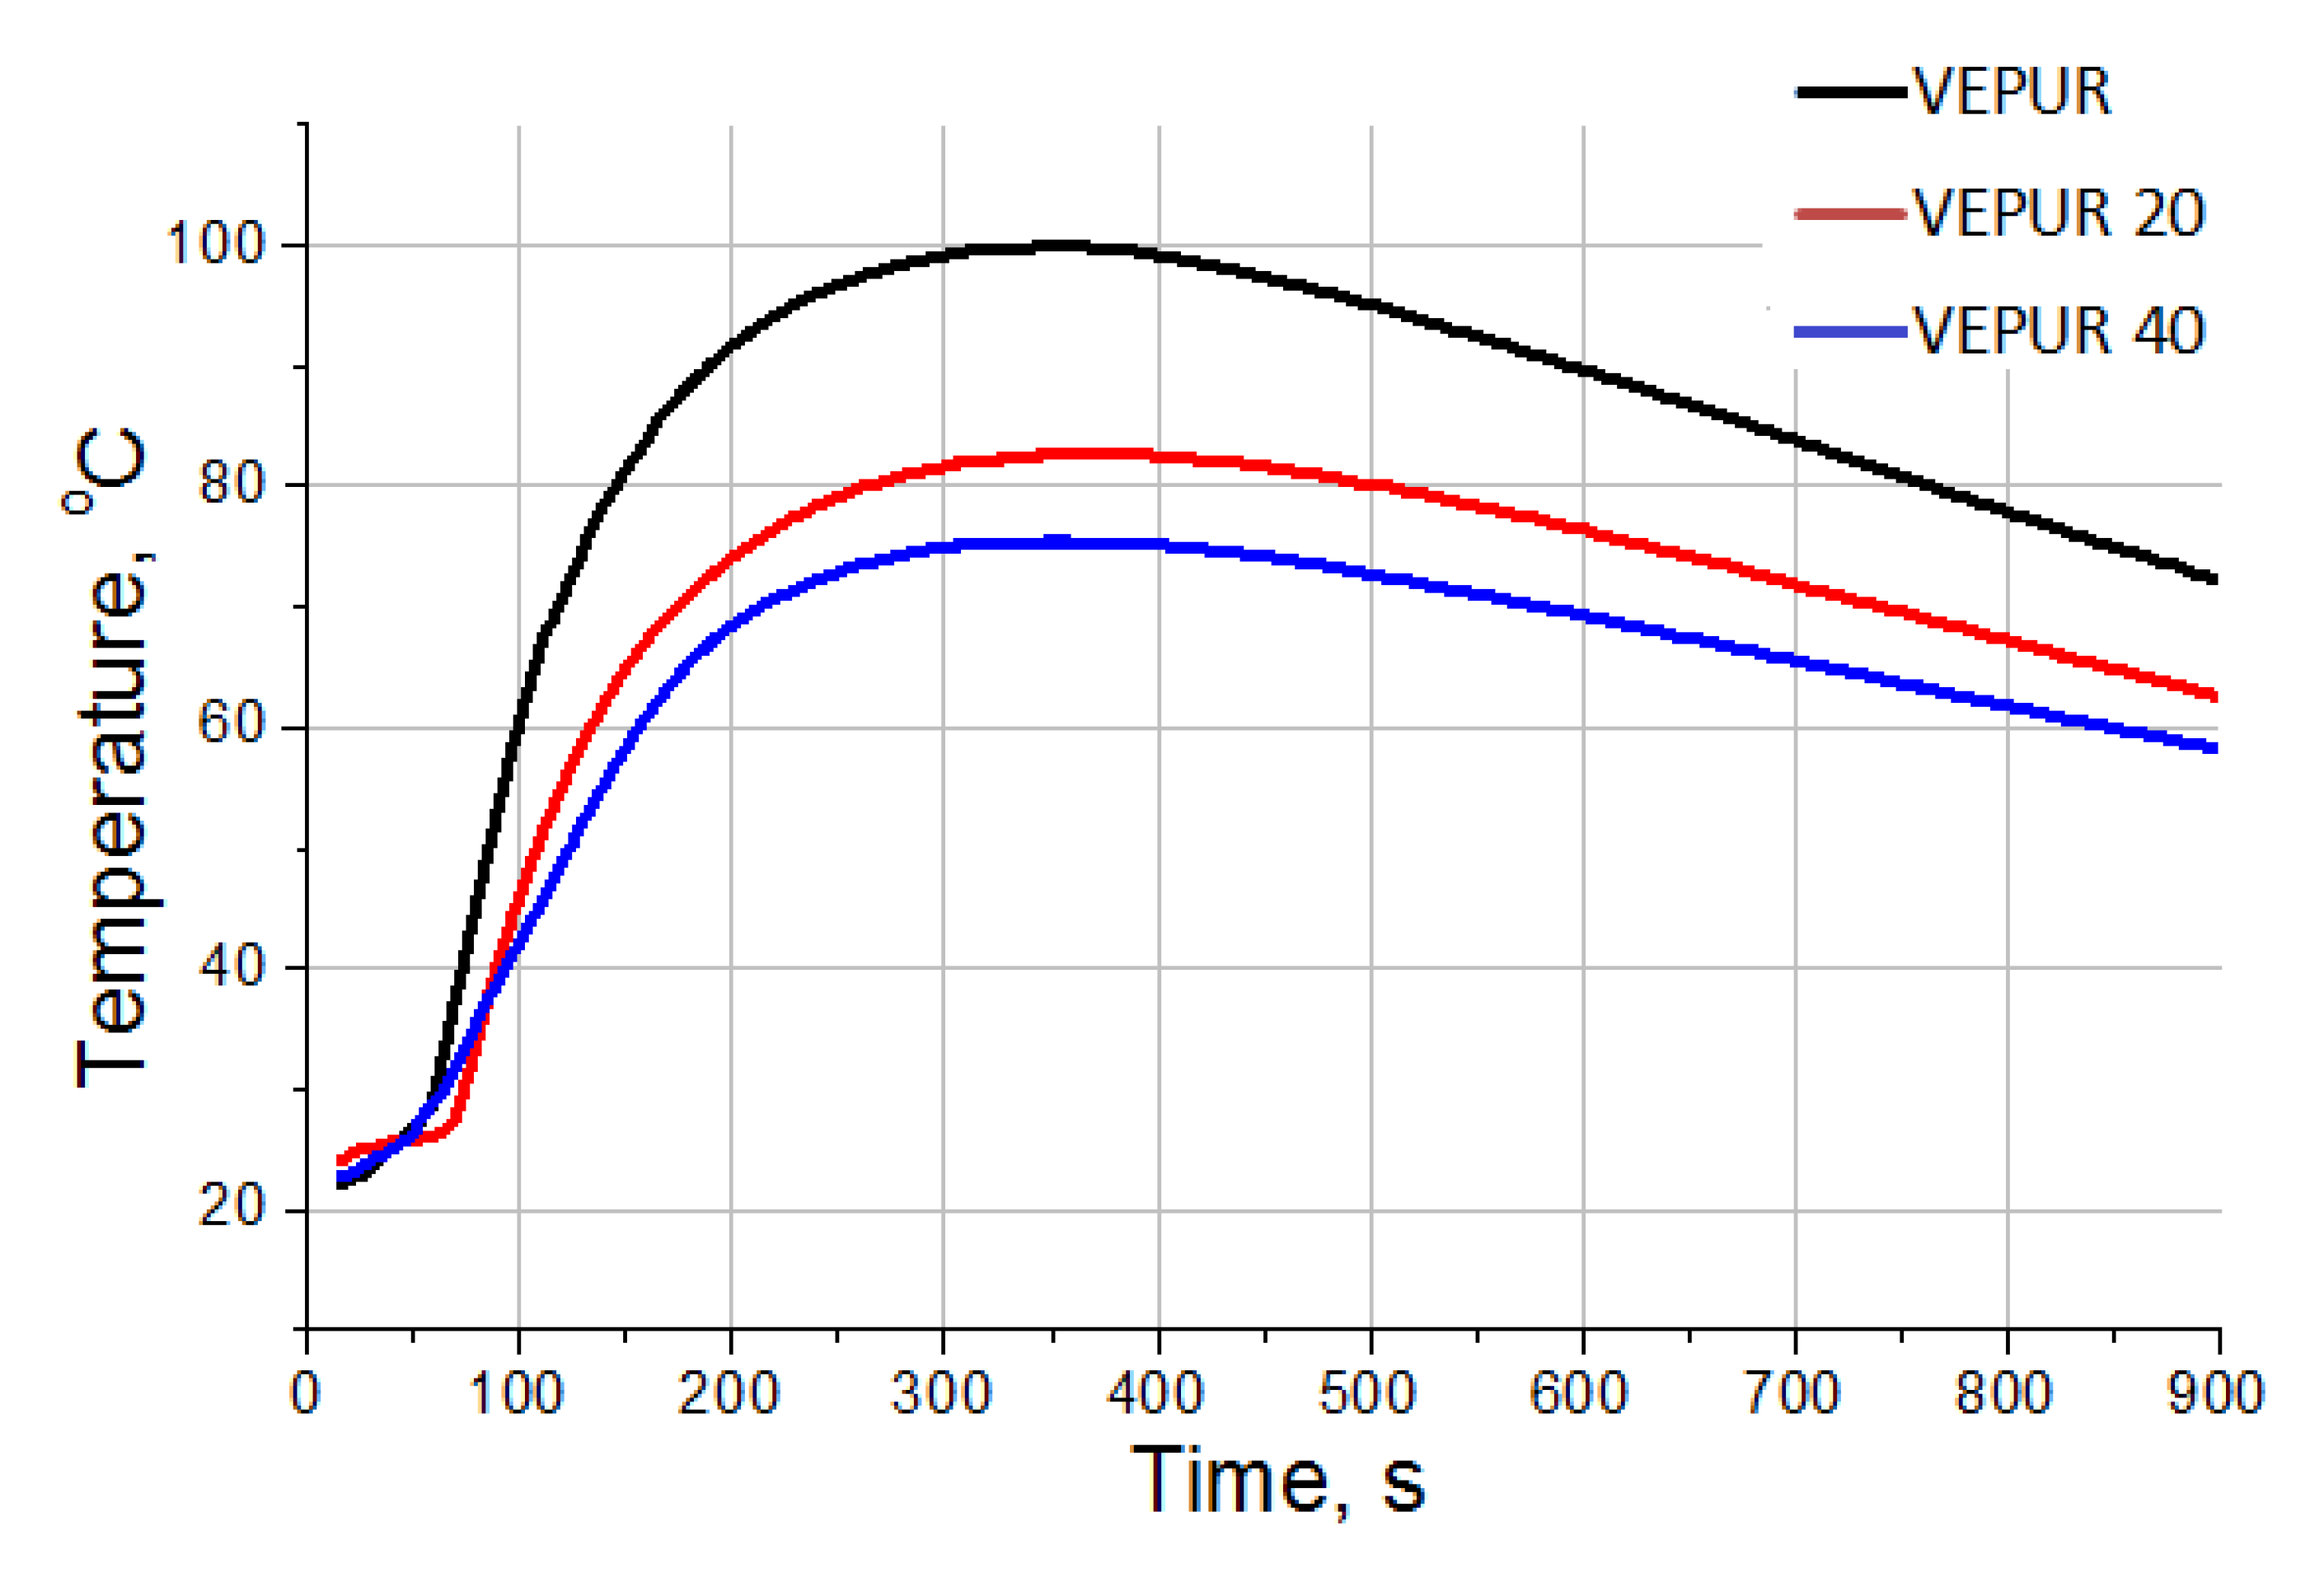
| Parameter/Sample Symbol | VEPUR | VEPUR 20 | VEPUR 40 |
|---|---|---|---|
| Rise time, s | 178 | 205 | 243 |
| Max temperature, °C | 100 | 83 | 76 |
| Time occurring of max temperature, s | 351 | 354 | 358 |
| Max pressure, Pa | 258 | 112 | 164 |
| Time occurring of max pressure, s | 218 | 264 | 266 |
| Sample Symbol | The Range of Pore Diameter, μm | The Share of Porosity, [%] |
|---|---|---|
| VEPUR | 263–295 | 90.2 |
| VEPUR20 | 177–215 | 87.9 |
| VEPUR30 | 138–177 | 81.0 |
| VEPUR40 | 177–295 | 88.0 |
| VEPUR60 | 492–571 | 91.9 |
| Wave Number (cm−1) | Possible Interpretation | Possible Interpretation |
|---|---|---|
| 3500 | ν (O–H) [36] | water or unbound polyols |
| 3338 | ν (N–H) H-bonded [41,42,43] | N–H bond |
| 2973 | ν (C–H) in CH3 (2970) [41,43,44,45] νa (C–H) in CH3 (2970) [41] | the soft segments formed from polyols |
| 2923 | νa (C–H) in CH2 (2925) [41,43] | |
| 2870 | νS (C–H) in CH2 [41,43,44,46] | |
| 1728 | ν (C=O) urethane Amide I, nonbonded [42] | urea and urethane carbonyl (C=O) |
| 1710 | ν (C=O) urethane Amide I, H-bonded [42] | |
| 1660 | ν (C=O) urea Amide I, H-nonbonded | |
| 1600 | ν (C=C) aromatic ring [41,43,44] | |
| 1536 | ν (C–N) + δ (N–H) Amide II [36] | |
| 1510 | ν (C–C) aromatic ring [41] | Urethane linkages |
| 1455 | δ (C–H) in CH2 [41] | |
| 1411 | ν (C=C) aromatic ring (1410) [41], ν (C–C) aromatic ring (1412–1414) [41] | |
| 1373 | ω (C–H) in CH2 [41,42] | |
| 1310 | δ (N–H) [41] | |
| 1223 | ν (C–O–C) | |
| 1086 | ν (C–O–C) aliphatic ether [41] | |
| 815 | δ (C–H) in aromatic ring [42] |
| Sample Symbol/Parameter | R | DPS | Urea, % | Urethane, % |
|---|---|---|---|---|
| VEPUR | 4.86 | 0.83 | 31 | 69 |
| VEPUR10 | 3.56 | 0.78 | 30 | 70 |
| VEPUR20 | 3.59 | 0.78 | 29 | 71 |
| VEPUR40 | 3.52 | 0.78 | 27 | 73 |
| VEPUR60 | 3.45 | 0.78 | 26 | 74 |
| Parameter/Sample Symbol | VEPUR | VEPUR 10 | VEPUR 20 | VEPUR 30 | VEPUR 40 | VEPUR 60 |
|---|---|---|---|---|---|---|
| T2%, °C | 248 | 239 | 237 | 224 | 212 | 181 |
| T5%, °C | 271 | 267 | 265 | 265 | 259 | 249 |
| T1, °C | 227 | 227 | 227 | 223 | 209 | 203 |
| Tmax1, °C | 276 | 264 | 281 | 281 | 278 | 281 |
| Vmax1, %/°C | 0.17 | 0.16 | 0.14 | 0.18 | 0.17 | 0.18 |
| T2, °C | 295 | 299 | 299 | 296 | 295 | 295 |
| Δm1, % | 8.0 | 7.8 | 7.9 | 8.2 | 8.0 | 9.1 |
| Tmax2, °C | 309 | 320 | 324 | 322 | 331 | 333 |
| Vmax2, %/°C | 0.30 | 0.40 | 0.41 | 0.36 | 0.37 | 0.35 |
| T3, °C | 348 | 346 | 346 | 347 | 350 | 351 |
| Δm2, % | 15.7 | 16.7 | 16.7 | 16.8 | 17.0 | 17.5 |
| Δm1 + Δm2 | 23.7 | 24.5 | 24.6 | 25.0 | 25.0 | 26.6 |
| Tmax3, °C | 391 | 393 | 395 | 396 | 399 | 398 |
| Vmax3, %/°C | 1.40 | 1.32 | 1.28 | 1.20 | 1.20 | 1.10 |
| T4, °C | 426 | 428 | 428 | 431 | 435 | 432 |
| Δm3, % | 65.4 | 62.9 | 62.3 | 59.7 | 57.7 | 53.8 |
| U600, % | 6.7 | 7.6 | 8.3 | 9.7 | 10.7 | 12.3 |
| Sample Symbol/Parameter | Tg1 [°C] | Td [°C] | ΔHd [J/g] | Tg’1 [°C] | Tg2 [°C] | Δ cp [J/g°C] |
|---|---|---|---|---|---|---|
| VEPUR | −63.8 | 65.1 | 64.7 | −60.9 | −33.7 | 0.318 |
| VEPUR 10 | −65.5 | 65.8 | 64.0 | −61.5 | −38.7 | 0.243 |
| VEPUR 20 | −65.4 | 70.3 | 52.3 | −61.7 | −38.5 | 0.239 |
| VEPUR 30 | −65.4 | 71.2 | 61.7 | −61.4 | −38.1 | 0.229 |
| VEPUR 40 | −65.8 | 75.4 | 67.3 | −61.8 | −38.2 | 0.208 |
| VEPUR 60 | −66.2 | 78.8 | 77.1 | −62.2 | −38.1 | 0.192 |
| Sample Symbol/Property | Deformation | ||
|---|---|---|---|
| 50% | 75% | 90% | |
| Compression Set, % | |||
| VEPUR | 2.8 | 1.1 | 1.4 |
| VEPUR 10 | 1.8 | 1.7 | 44.8 |
| VEPUR 20 | 2.4 | 2.8 | 82.2 |
| VEPUR 30 | 1.9 | 2.6 | 77.9 |
| VEPUR 40 | 3.5 | 5.4 | 82.7 |
| VEPUR 60 | 2.2 | 4.3 | 74.2 |
Publisher’s Note: MDPI stays neutral with regard to jurisdictional claims in published maps and institutional affiliations. |
© 2021 by the authors. Licensee MDPI, Basel, Switzerland. This article is an open access article distributed under the terms and conditions of the Creative Commons Attribution (CC BY) license (http://creativecommons.org/licenses/by/4.0/).
Share and Cite
Auguścik-Królikowska, M.; Ryszkowska, J.; Kurańska, M.; Wantulok, M.; Gloc, M.; Szczepkowski, L.; Dąbkowska-Susfał, K.; Prociak, A. Composites of Open-Cell Viscoelastic Foams with Blackcurrant Pomace. Materials 2021, 14, 934. https://doi.org/10.3390/ma14040934
Auguścik-Królikowska M, Ryszkowska J, Kurańska M, Wantulok M, Gloc M, Szczepkowski L, Dąbkowska-Susfał K, Prociak A. Composites of Open-Cell Viscoelastic Foams with Blackcurrant Pomace. Materials. 2021; 14(4):934. https://doi.org/10.3390/ma14040934
Chicago/Turabian StyleAuguścik-Królikowska, Monika, Joanna Ryszkowska, Maria Kurańska, Marta Wantulok, Michał Gloc, Leonard Szczepkowski, Katarzyna Dąbkowska-Susfał, and Aleksander Prociak. 2021. "Composites of Open-Cell Viscoelastic Foams with Blackcurrant Pomace" Materials 14, no. 4: 934. https://doi.org/10.3390/ma14040934
APA StyleAuguścik-Królikowska, M., Ryszkowska, J., Kurańska, M., Wantulok, M., Gloc, M., Szczepkowski, L., Dąbkowska-Susfał, K., & Prociak, A. (2021). Composites of Open-Cell Viscoelastic Foams with Blackcurrant Pomace. Materials, 14(4), 934. https://doi.org/10.3390/ma14040934