
Quantitative Analysis of the Recovery Process in Pure Iron Using X-ray Diffraction Line Profile Analysis


Abstract
1. Introduction
2. Materials and Methods
3. Modified Williamson-Hall and Warren-Averbach Methods
4. Results and Discussion
4.1. Quantitative Analysis of Dislocation Substructure
4.2. Recovery-Process Modeling
5. Conclusions
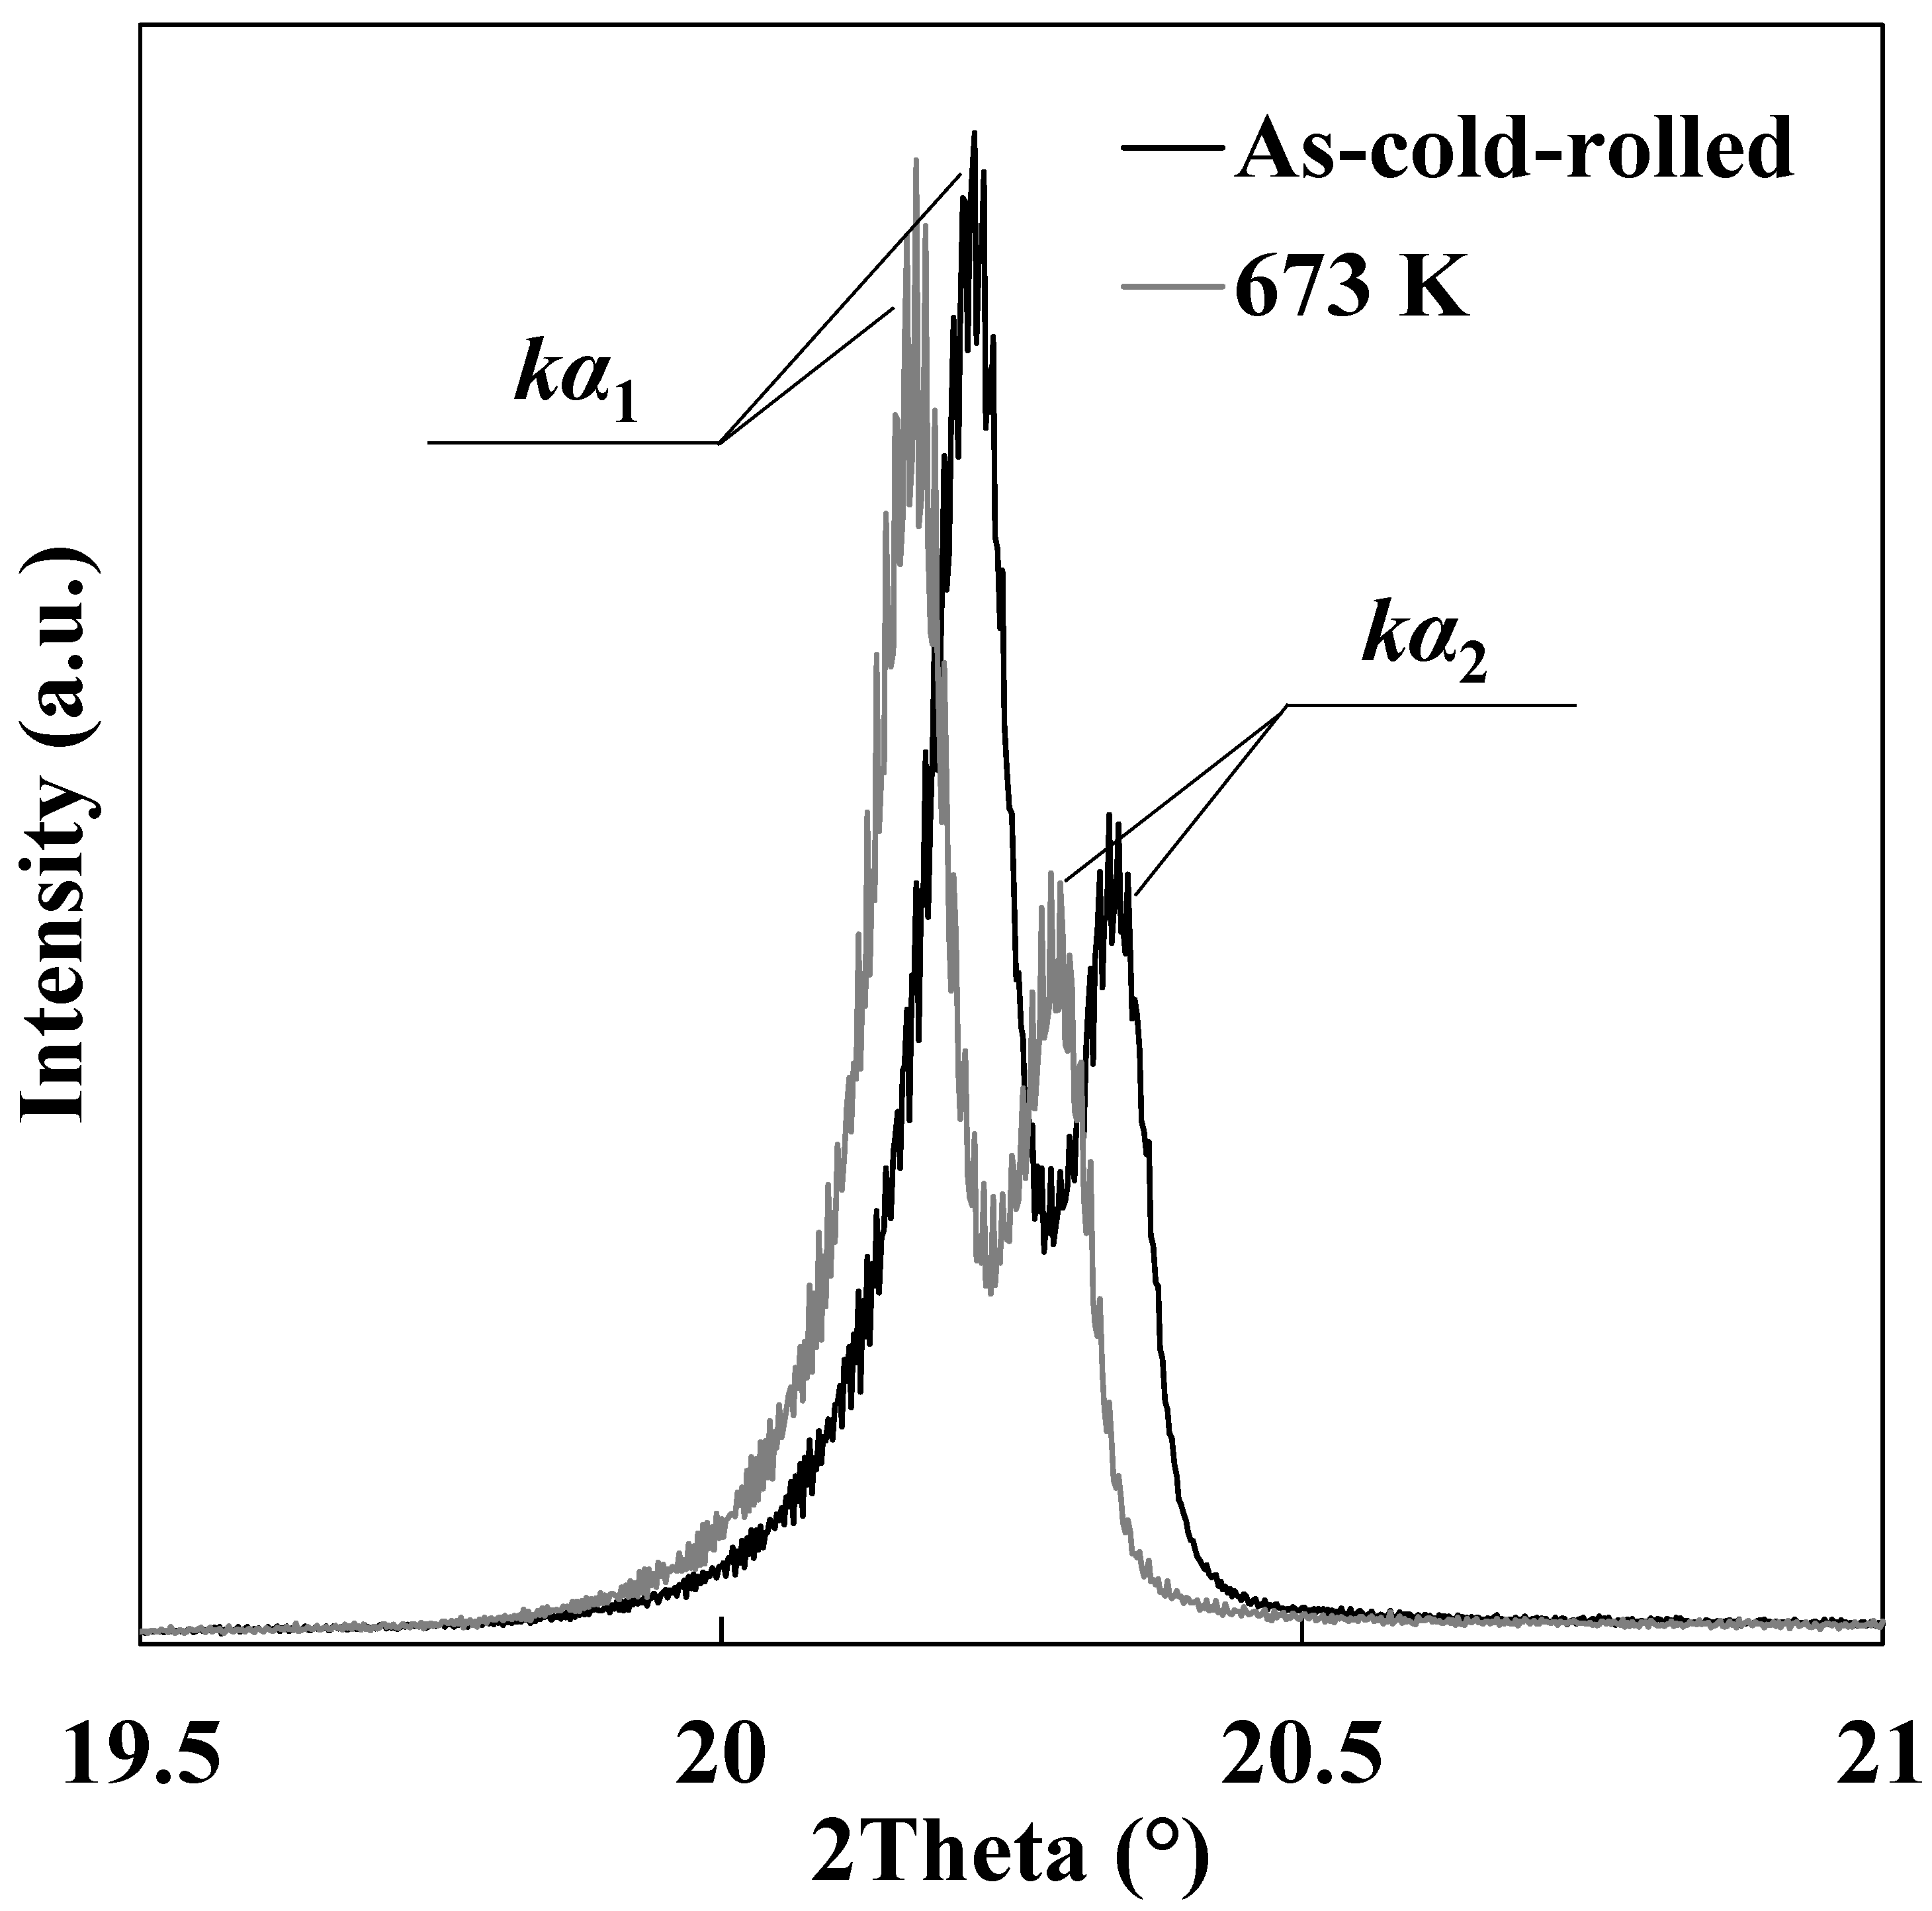
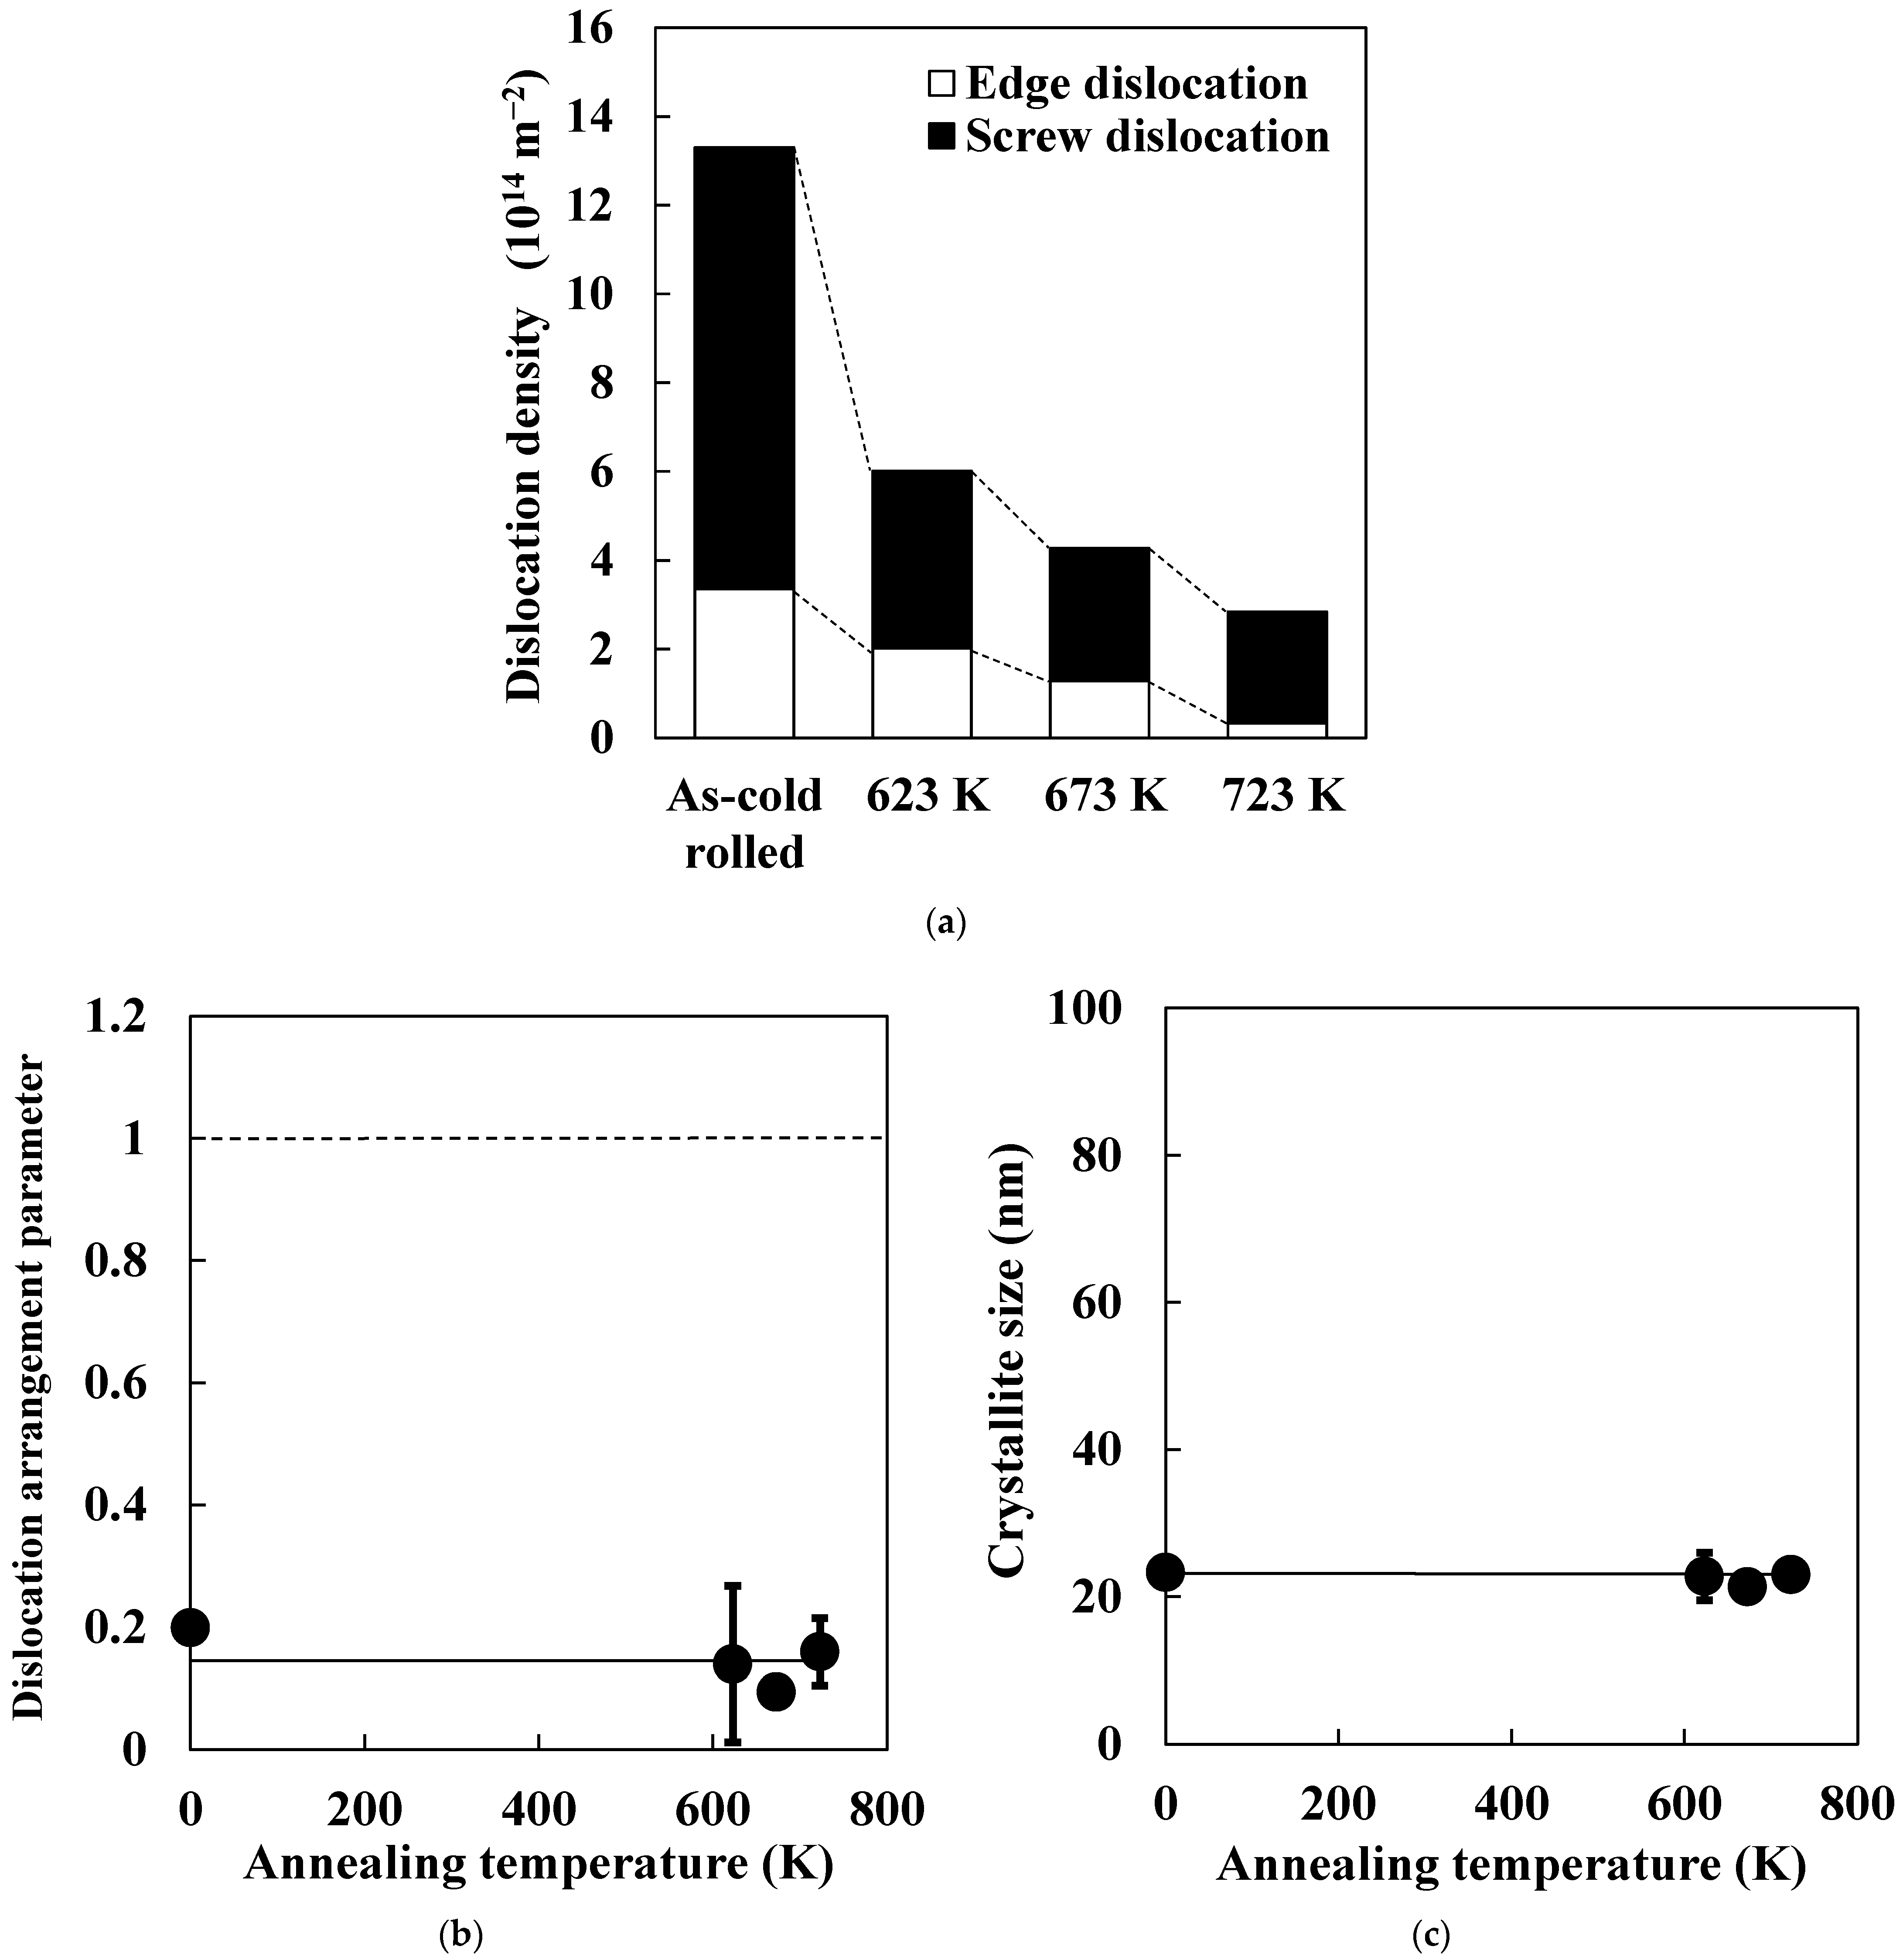
- Dislocation-density decrease was confirmed by increasing annealing temperature. In particular, screw-dislocation density remarkably decreased during heating from room temperature to 623 K, while edge-dislocation density gradually decreased as annealing temperature increased.
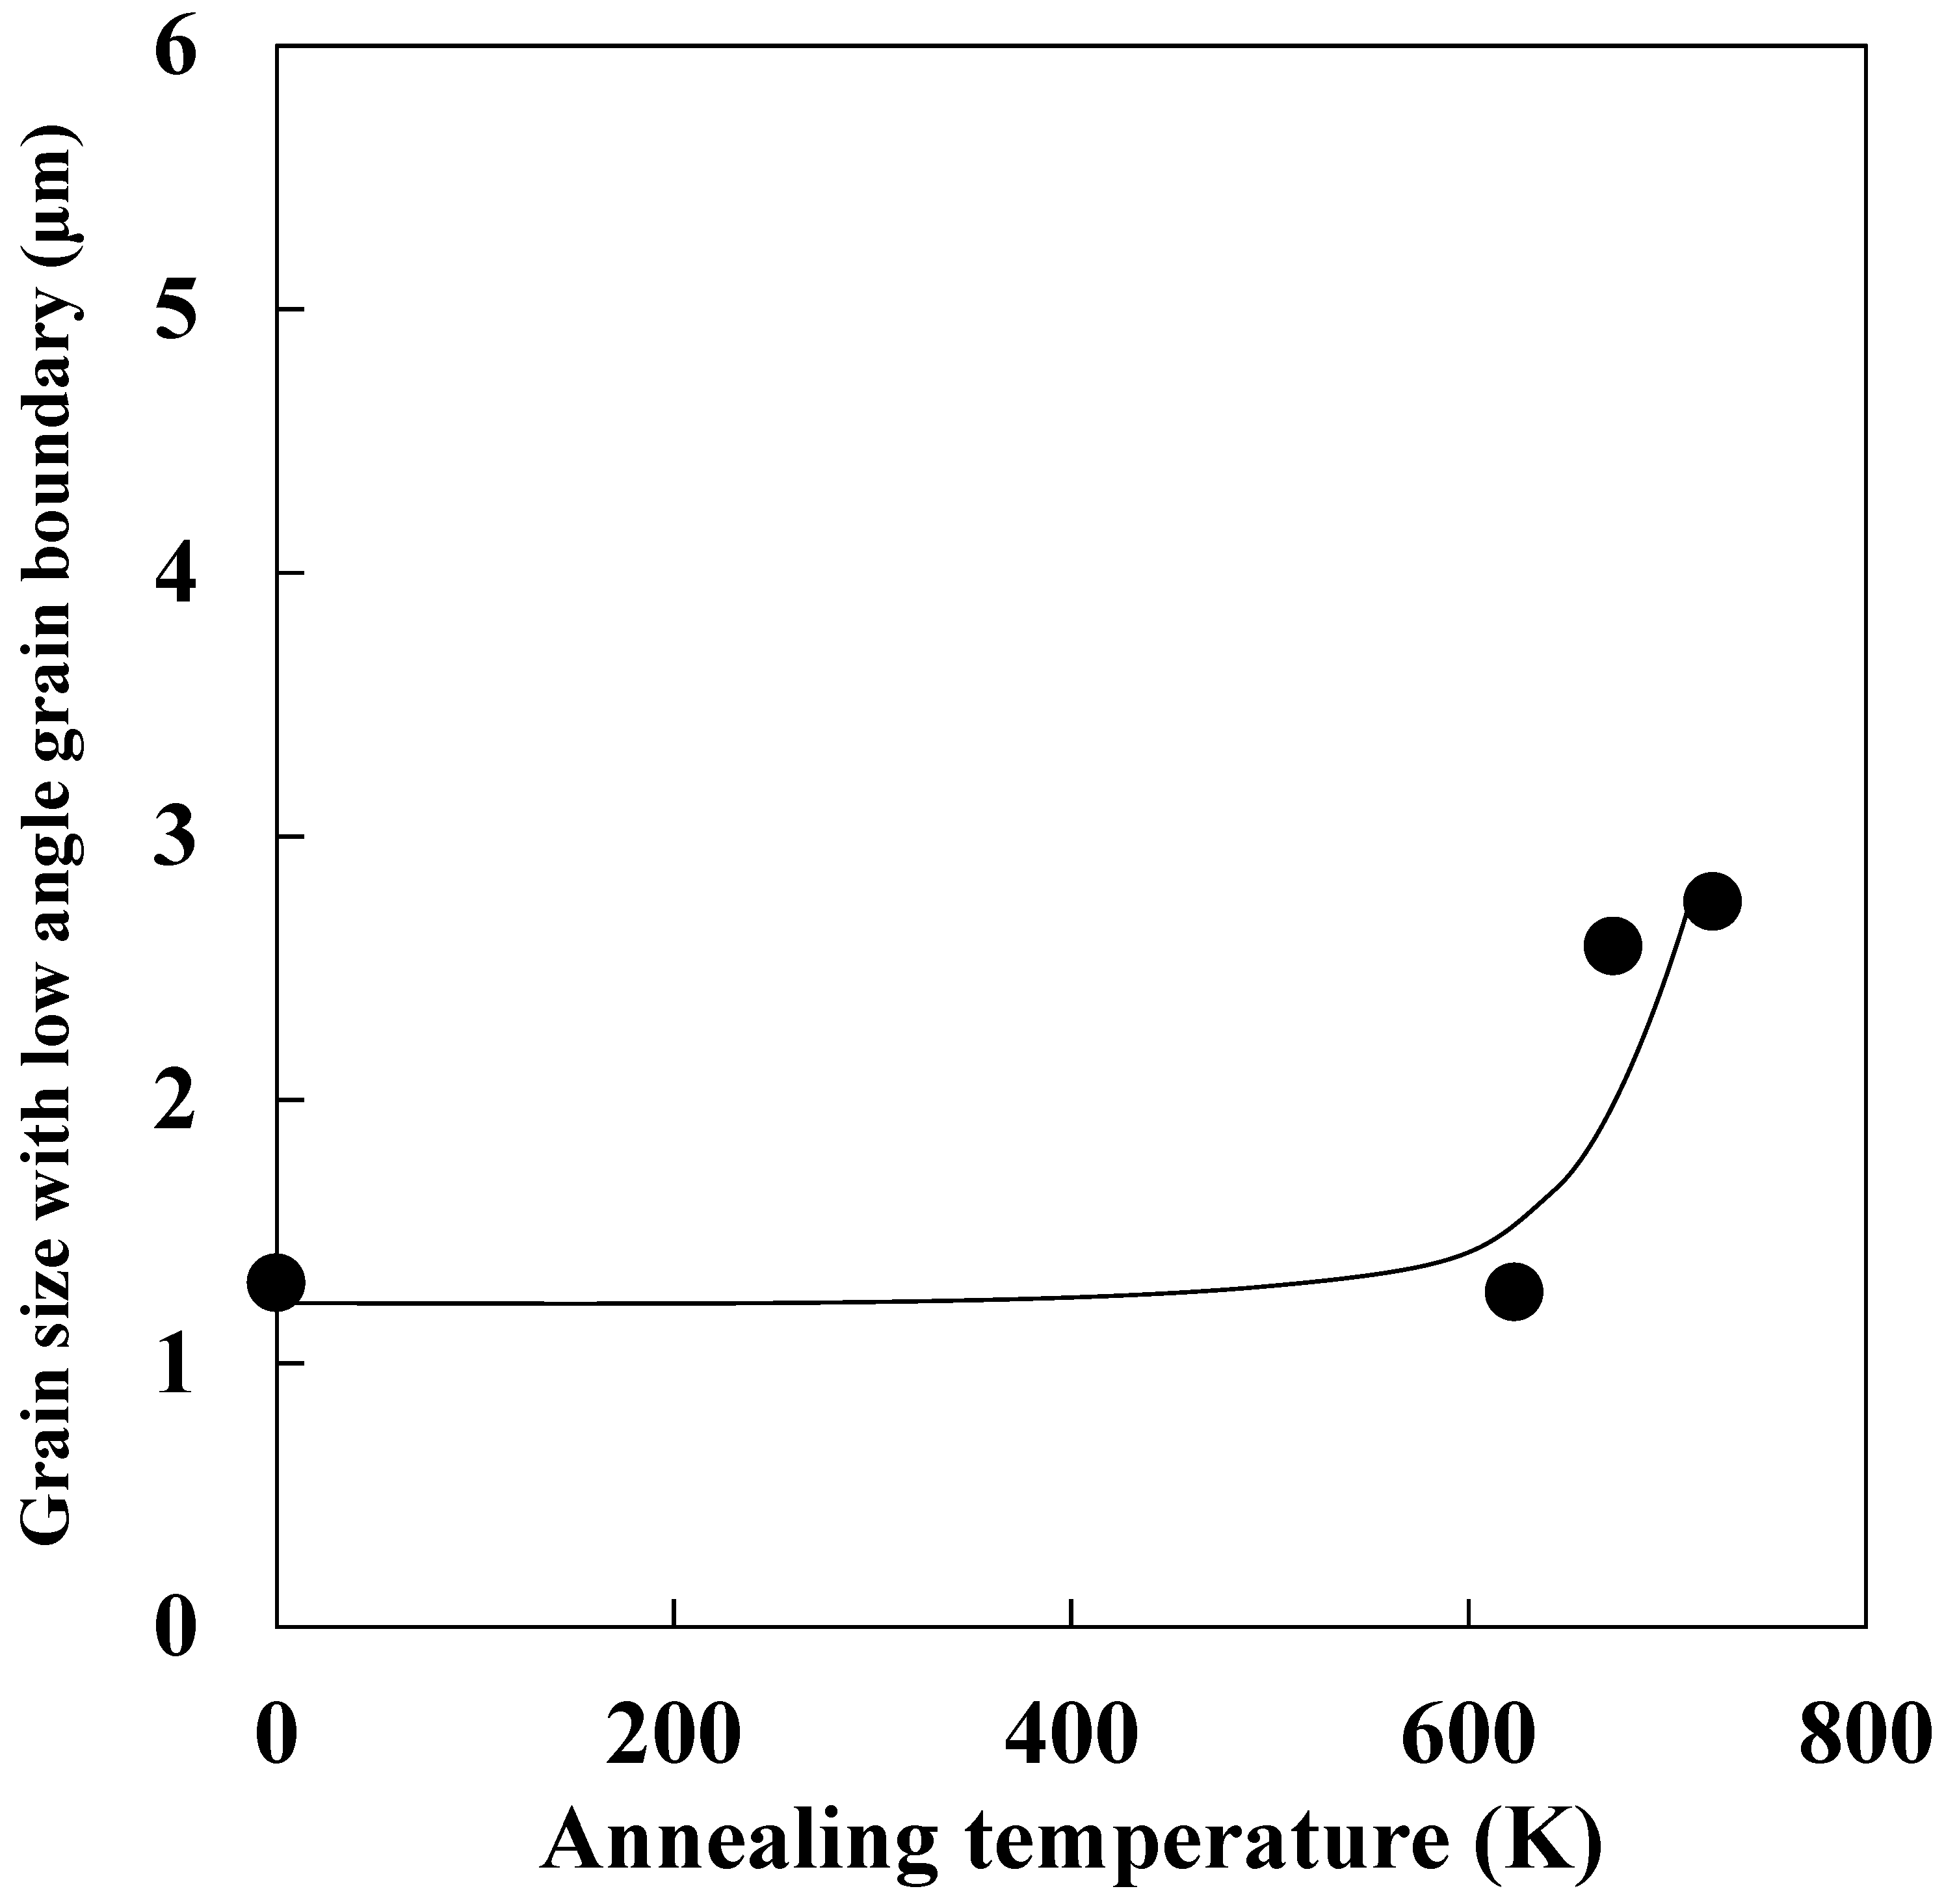
- Dislocation arrangement parameter and crystallite size hardly changed as annealing temperature increased.
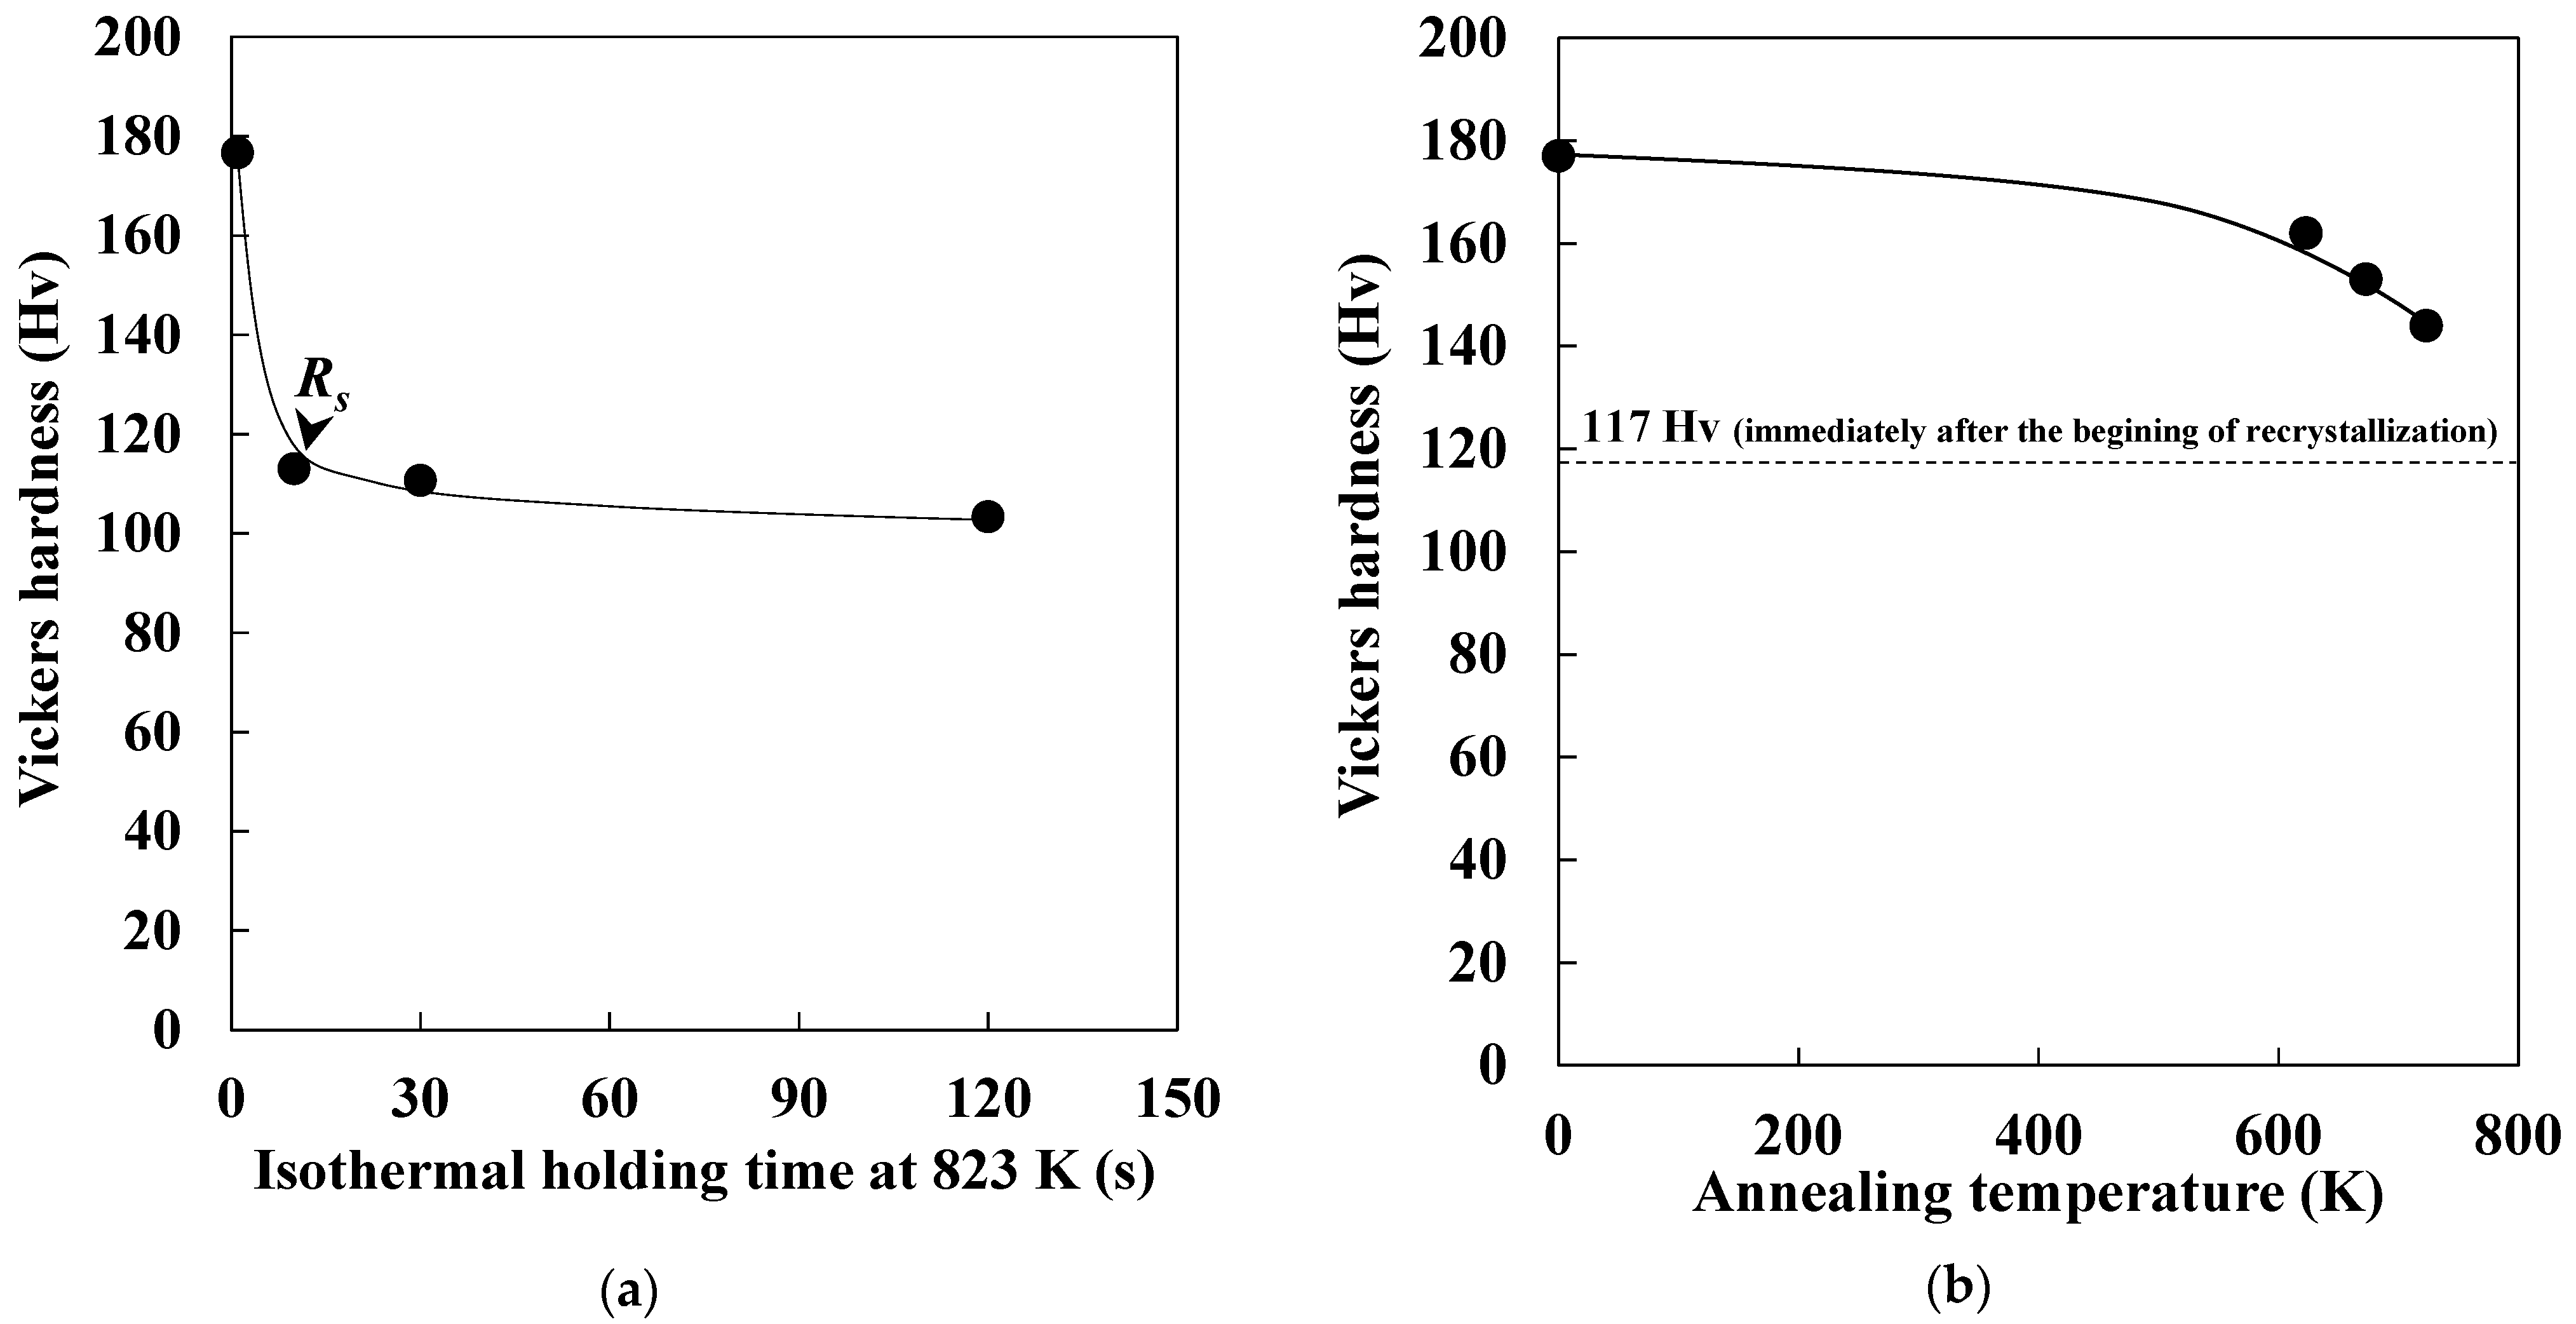
- Changes in hardness during the recovery process mainly depended on edge-dislocation density.
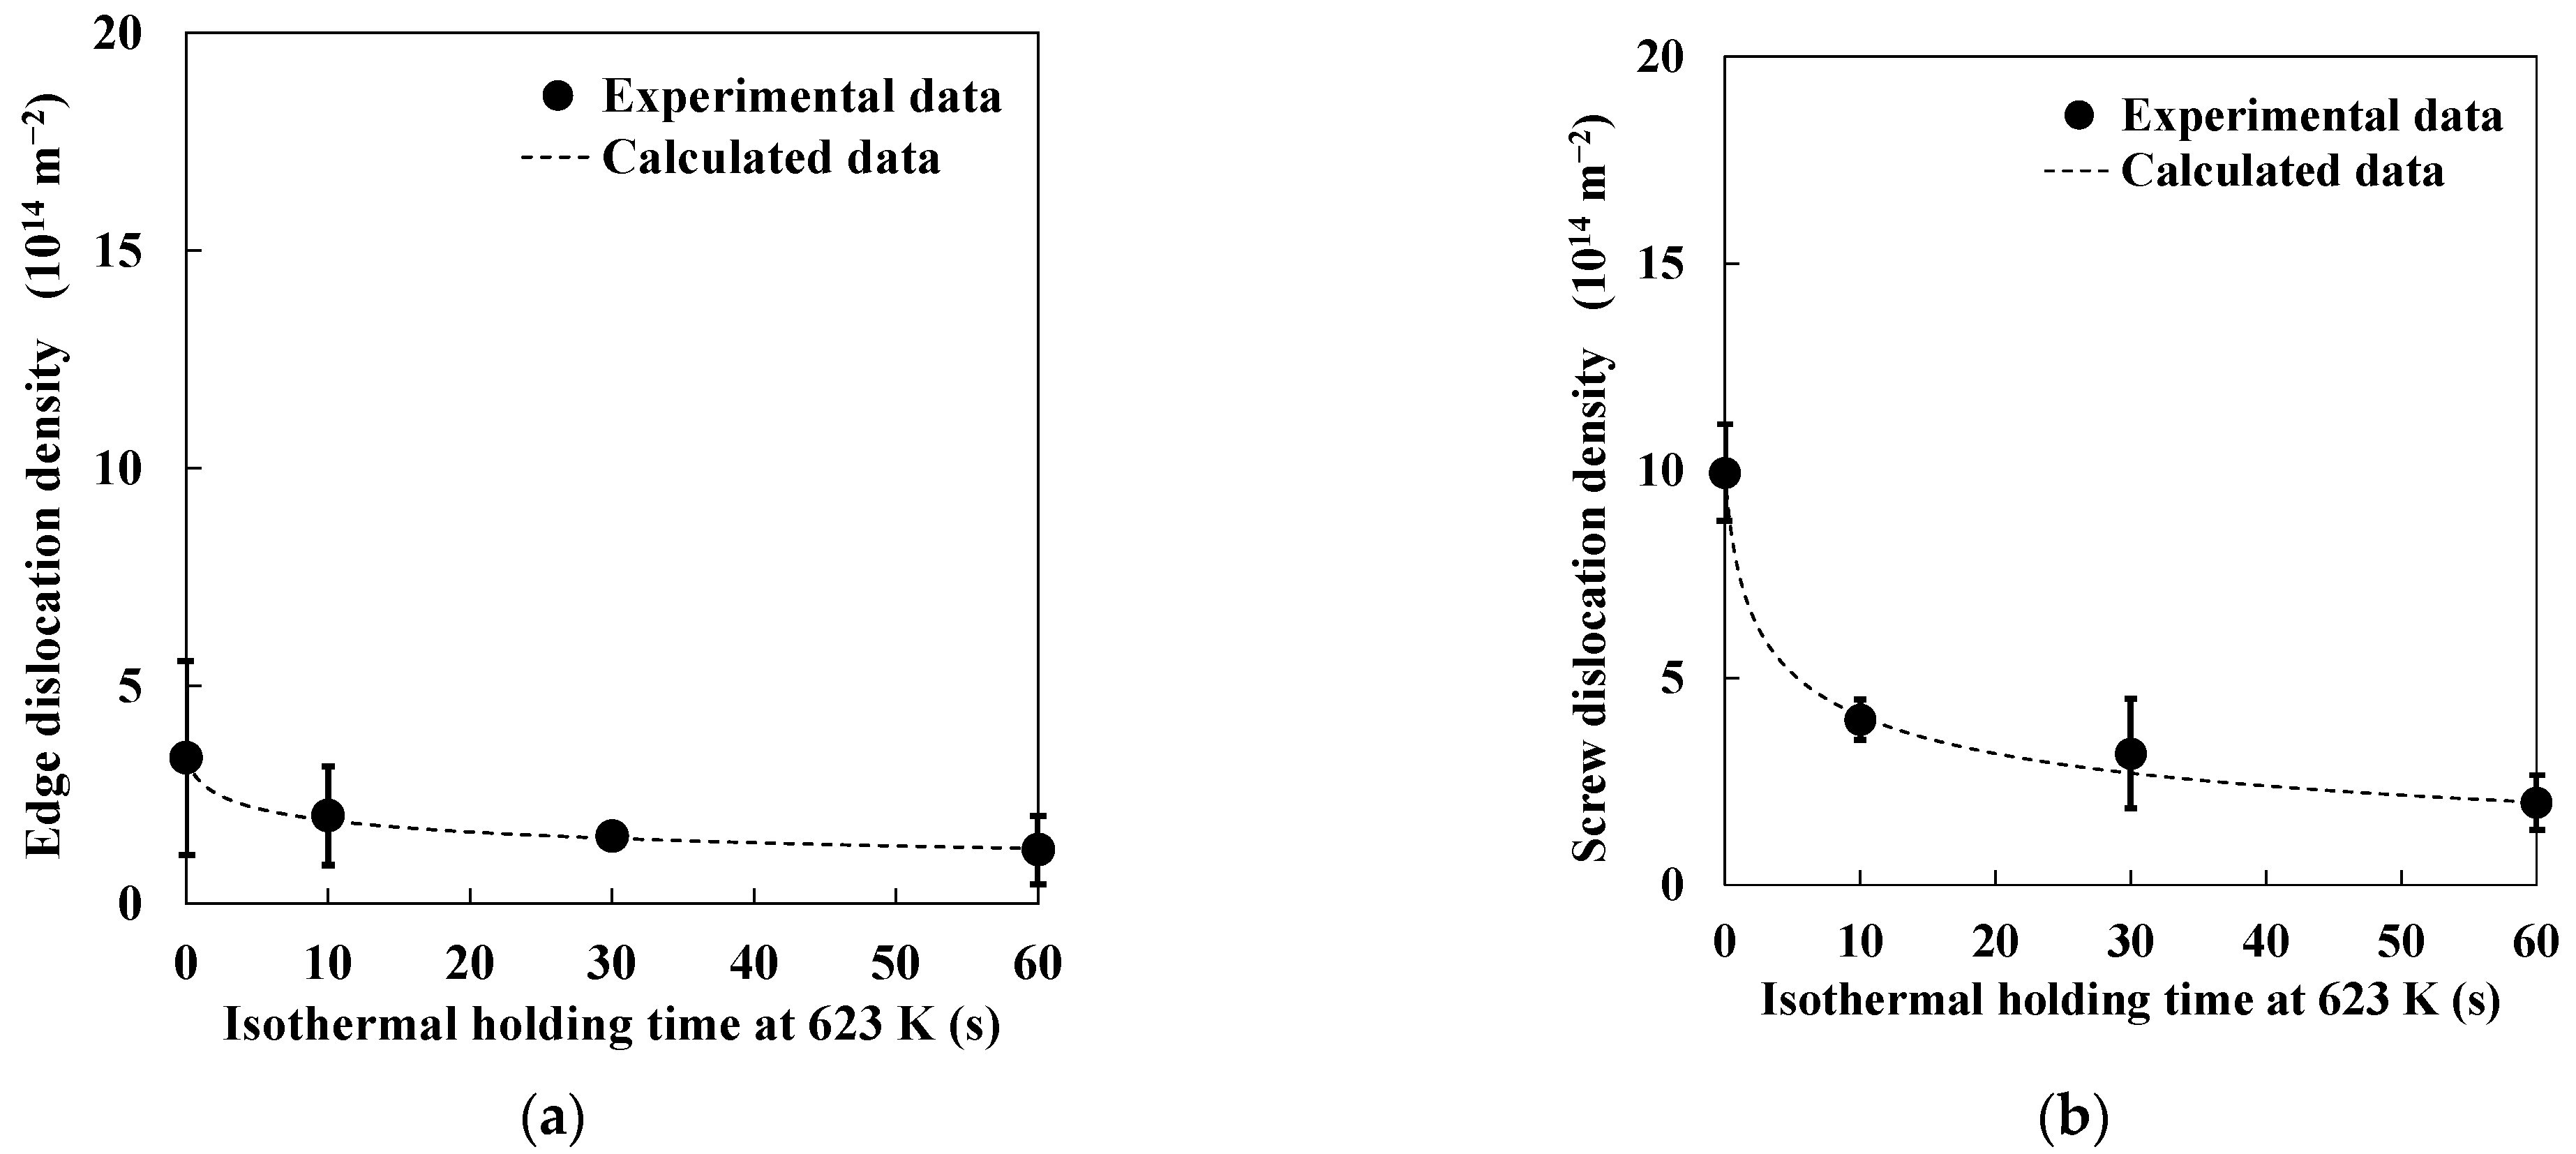
- A new model for the recovery process based on X-ray diffraction line profile analysis was developed. Using the new model, we demonstrated that the decrease in screw-dislocation density during the recovery process was mainly dominated by glide and/or cross-slip with dislocation core diffusion. In contrast, the decrease in edge-dislocation density during the recovery process was dominated by a climbing motion with both dislocation core diffusion and lattice self-diffusion.
Author Contributions
Funding
Institutional Review Board Statement
Informed Consent Statement
Data Availability Statement
Conflicts of Interest
References
- Osawa, K.; Suzuki, T.; Matsudo, K.; Kurihara, K. Effects of carbon and manganese on the deep-drawability of cold-rolled steel sheets. Tetsu Hagané 1986, 72, 1728–1735. [Google Scholar] [CrossRef][Green Version]
- Belyakov, A.; Wei, F.G.; Tsuzaki, K.; Kimura, Y.; Mishima, Y. Incomplete recrystallization in cold worked steel containing TiC. Mater. Sci. Eng. A 2007, 471, 50–56. [Google Scholar] [CrossRef]
- Sugiura, N.; Yoshinaga, N.; Kawasaki, K.; Yamaguchi, Y.; Takahashi, J.; Yamada, T. Influence of solute C on recrystallization behavior in Ti added low carbon cold rolled sheet steel. Tetsu Hagané 2008, 94, 179–187. [Google Scholar] [CrossRef][Green Version]
- Ogawa, T.; Sugiura, N.; Maruyama, N.; Yoshinaga, N. Influence of state of Nb on recrystallization temperature during annealing in cold-rolled low-carbon steels. Mater. Sci. Eng. A 2013, 564, 42–45. [Google Scholar] [CrossRef]
- Ogawa, T. Ferrite recrystallisation and characteristics of non-recrystallised ferrite grains in Ti added low carbon steels. Mater. Sci. Tech. 2015, 31, 123–128. [Google Scholar] [CrossRef]
- Matsui, T.; Ogawa, T.; Adachi, Y. Relationship between three-dimensional microstructure and Avrami exponent for recrystallization in pure iron. Results Mater. 2019, 1, 100002. [Google Scholar] [CrossRef]
- Burke, J.E.; Turnbull, D. Recrystallization and grain growth. Prog. Met. Phys. 1952, 3, 220–292. [Google Scholar] [CrossRef]
- Leslie, W.C. The Physical Metallurgy of Steels, 1st ed.; McGrow-Hill: New York, NY, USA, 1981; p. 97. [Google Scholar]
- Yuasa, K.; Koda, S. Transmission electron microscope study of the early stage of recrystallization in pure iron. J. Jpn. Inst. Met. Mater. 1967, 31, 646–652. [Google Scholar] [CrossRef]
- Ungár, T.; Borbély, A. The effect of dislocation contrast on x-ray line broadening: A new approach to line profile analysis. Appl. Phys. Lett. 1996, 69, 3173–3175. [Google Scholar] [CrossRef]
- Ungár, T.; Ott, S.; Sanders, P.G.; Borbély, A.; Weertman, J.R. Dislocations, grain size and planar faults in nanostructured copper determined by high resolution X-ray diffraction and a new procedure of peak profile analysis. Acta Mater. 1998, 46, 3693–3699. [Google Scholar] [CrossRef]
- Umezaki, S.; Murata, Y.; Nomura, K.; Kubushiro, K. Quantitative analysis of dislocation density in an austenitic steel after plastic deformation. J. Jpn. Inst. Met. Mater. 2014, 78, 218–224. [Google Scholar] [CrossRef]
- Akama, D.; Tsuchiyama, S.; Takaki, S. Change in dislocation characteristics with cold working in ultralow-carbon martensitic steel. ISIJ Int. 2016, 56, 1675–1680. [Google Scholar] [CrossRef]
- Tomita, M.; Yonemura, M.; Inaguma, T.; Sakamoto, H.; Ushioda, K. Estimation of change in dislocation structure in severely cold-rolled pure iron, Fe-0.3 mass%Al alloy and Fe-0.3 mass%Si alloy by X-ray line profile analysis and transmission electron microscopy. Tetsu Hagané 2017, 103, 149–156. [Google Scholar] [CrossRef]
- Landauer, R. Conductivity of cold-worked metals. Phys. Rev. 1951, 82, 520–521. [Google Scholar] [CrossRef]
- Kumagai, M.; Imafuku, M.; Ohya, S. Microstructural features of cold-rolled carbon steel evaluated by X-ray diffraction line profile analysis and their correlation with mechanical properties. ISIJ Int. 2014, 54, 206–211. [Google Scholar] [CrossRef]
- Lan, Y.; Klaar, H.J.; Dahl, W. Evolution of dislocation structures and deformation behavior of iron at different temperatures: Part I. Strain hardening curves and cellular structure. Metall. Trans. A 1992, 23, 537–544. [Google Scholar] [CrossRef]
- Lan, Y.; Klaar, H.J.; Dahl, W. Evolution of dislocation structures and deformation behavior of iron at different temperatures: Part II. Dislocation density and theoretical analysis. Metall. Trans. A 1992, 23, 545–549. [Google Scholar] [CrossRef]
- Morito, S.; Nishikawa, J.; Maki, T. Dislocation density within lath martensite in Fe–C and Fe–Ni alloys. ISIJ Int. 2003, 43, 1475–1477. [Google Scholar] [CrossRef]
- Takaki, S.; Masumura, T.; Tsuchiyama, T. Dislocation characterization by the direct-fitting/modified Williamson–Hall (DF/mWH) method in cold worked ferritic steel. ISIJ Int. 2019, 59, 567–572. [Google Scholar] [CrossRef]
- Wilkens, M. The determination of density and distribution of dislocations in deformed single crystals from broadened X-ray diffraction profiles. Phys. Status Solidi A 1970, 2, 359–370. [Google Scholar] [CrossRef]
- Takaki, S.; Masumura, T.; Jiang, F.; Tsuchiyama, T. Evaluation of dislocation density in cold worked low carbon ferritic steel. Tetsu Hagané 2018, 104, 683–688. [Google Scholar] [CrossRef]
- Smith, A.; Luo, H.; Hanlon, D.N.; Sietsma, J.; Zwaag, S. Recovery processes in the ferrite phase in C-Mn steel. ISIJ Int. 2004, 44, 1188–1194. [Google Scholar] [CrossRef]
- Frost, J.; Ashby, M.F. Deformation-Mechanism Maps: The Plasticity and Creep of Metals and Ceramics, 1st ed.; Pergamon: Oxford, UK, 1982; p. 62. [Google Scholar]
- Nes, E. Recovery revisited. Acta Mater. 1995, 43, 2189–2207. [Google Scholar] [CrossRef]
- Evans, H.E.; Knowles, G. A model of creep in pure materials. Acta Metall. 1977, 25, 963–975. [Google Scholar] [CrossRef]
- Martínez-de-Guerenu, A.; Arizti, F.; Gutiérrez, I. Recovery during annealing in a cold rolled low carbon steel. Part II: Modelling the kinetics. Acta Mater. 2004, 52, 3665–3670. [Google Scholar] [CrossRef]
- Humphreys, J.; Rohrer, G.S.; Rollett, A. Recrystallization and Related Annealing Phenomena, 3rd ed.; Elsevier: Amsterdam, The Netherlands, 2017; p. 212. [Google Scholar]
- Costanza, G.; Montanari, R.; Paoloni, S.; Tata, M.E. Dislocation density effect on thermal diffusivity of AISI 316 steel. Key Eng. Mater. 2014, 605, 27–30. [Google Scholar] [CrossRef]


| M | α | E (Pa) | vD (s−1) | kB (J·K−1) | b (m) |
|---|---|---|---|---|---|
| 2 | 0.3 | 2.05 × 10¹¹ | 9.79 × 10¹² | 1.38 × 10⁻²³ | 2.5 × 10⁻¹⁰ |
| ρ | Edge Dislocation Density | Screw Dislocation Density |
|---|---|---|
| Activation energy (kJ·mol−1) | 186 | 167 |
| Activation volume (m3) | 5.60 × 1028 | 1.98 × 1028 |
Publisher’s Note: MDPI stays neutral with regard to jurisdictional claims in published maps and institutional affiliations. |
© 2021 by the authors. Licensee MDPI, Basel, Switzerland. This article is an open access article distributed under the terms and conditions of the Creative Commons Attribution (CC BY) license (http://creativecommons.org/licenses/by/4.0/).
Share and Cite
Sugiyama, S.; Ogawa, T.; He, L.; Wang, Z.; Adachi, Y. Quantitative Analysis of the Recovery Process in Pure Iron Using X-ray Diffraction Line Profile Analysis. Materials 2021, 14, 895. https://doi.org/10.3390/ma14040895
Sugiyama S, Ogawa T, He L, Wang Z, Adachi Y. Quantitative Analysis of the Recovery Process in Pure Iron Using X-ray Diffraction Line Profile Analysis. Materials. 2021; 14(4):895. https://doi.org/10.3390/ma14040895
Chicago/Turabian StyleSugiyama, Shota, Toshio Ogawa, Lei He, Zhilei Wang, and Yoshitaka Adachi. 2021. "Quantitative Analysis of the Recovery Process in Pure Iron Using X-ray Diffraction Line Profile Analysis" Materials 14, no. 4: 895. https://doi.org/10.3390/ma14040895
APA StyleSugiyama, S., Ogawa, T., He, L., Wang, Z., & Adachi, Y. (2021). Quantitative Analysis of the Recovery Process in Pure Iron Using X-ray Diffraction Line Profile Analysis. Materials, 14(4), 895. https://doi.org/10.3390/ma14040895