Nitrogen-Vacancy Color Centers Created by Proton Implantation in a Diamond

 , , , , and
Abstract
:1. Introduction
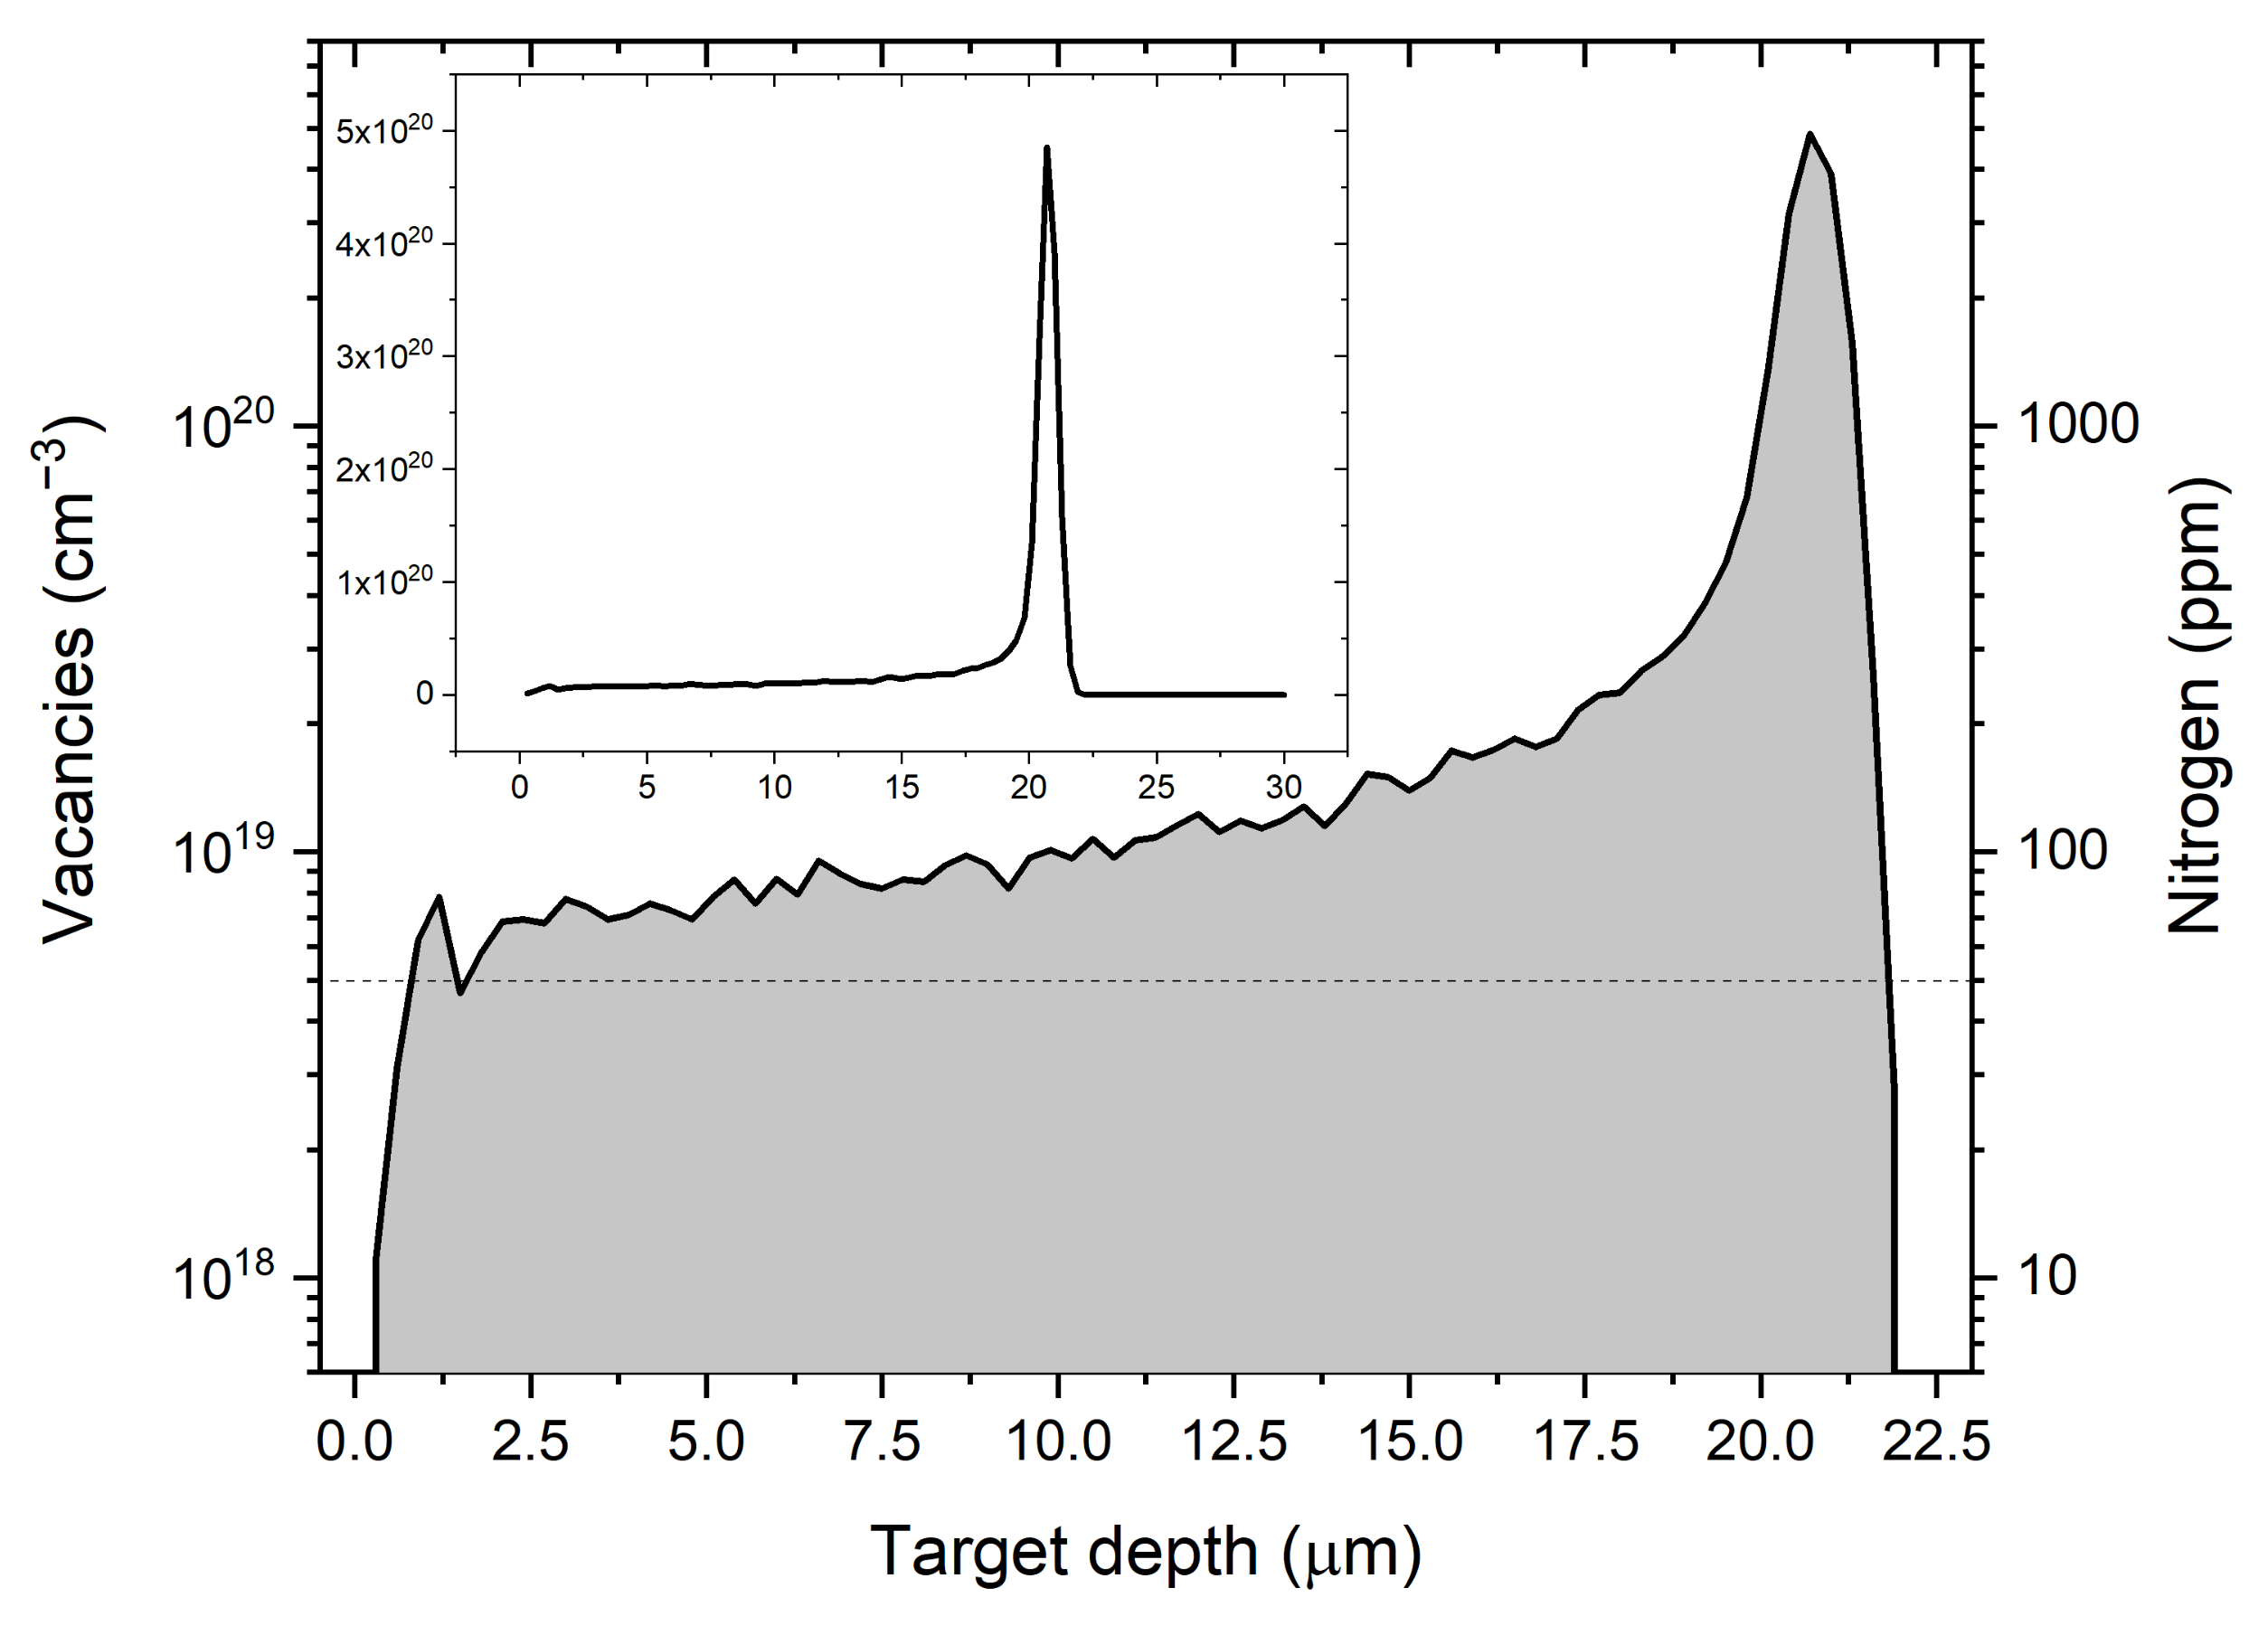
2. Sample Preparation
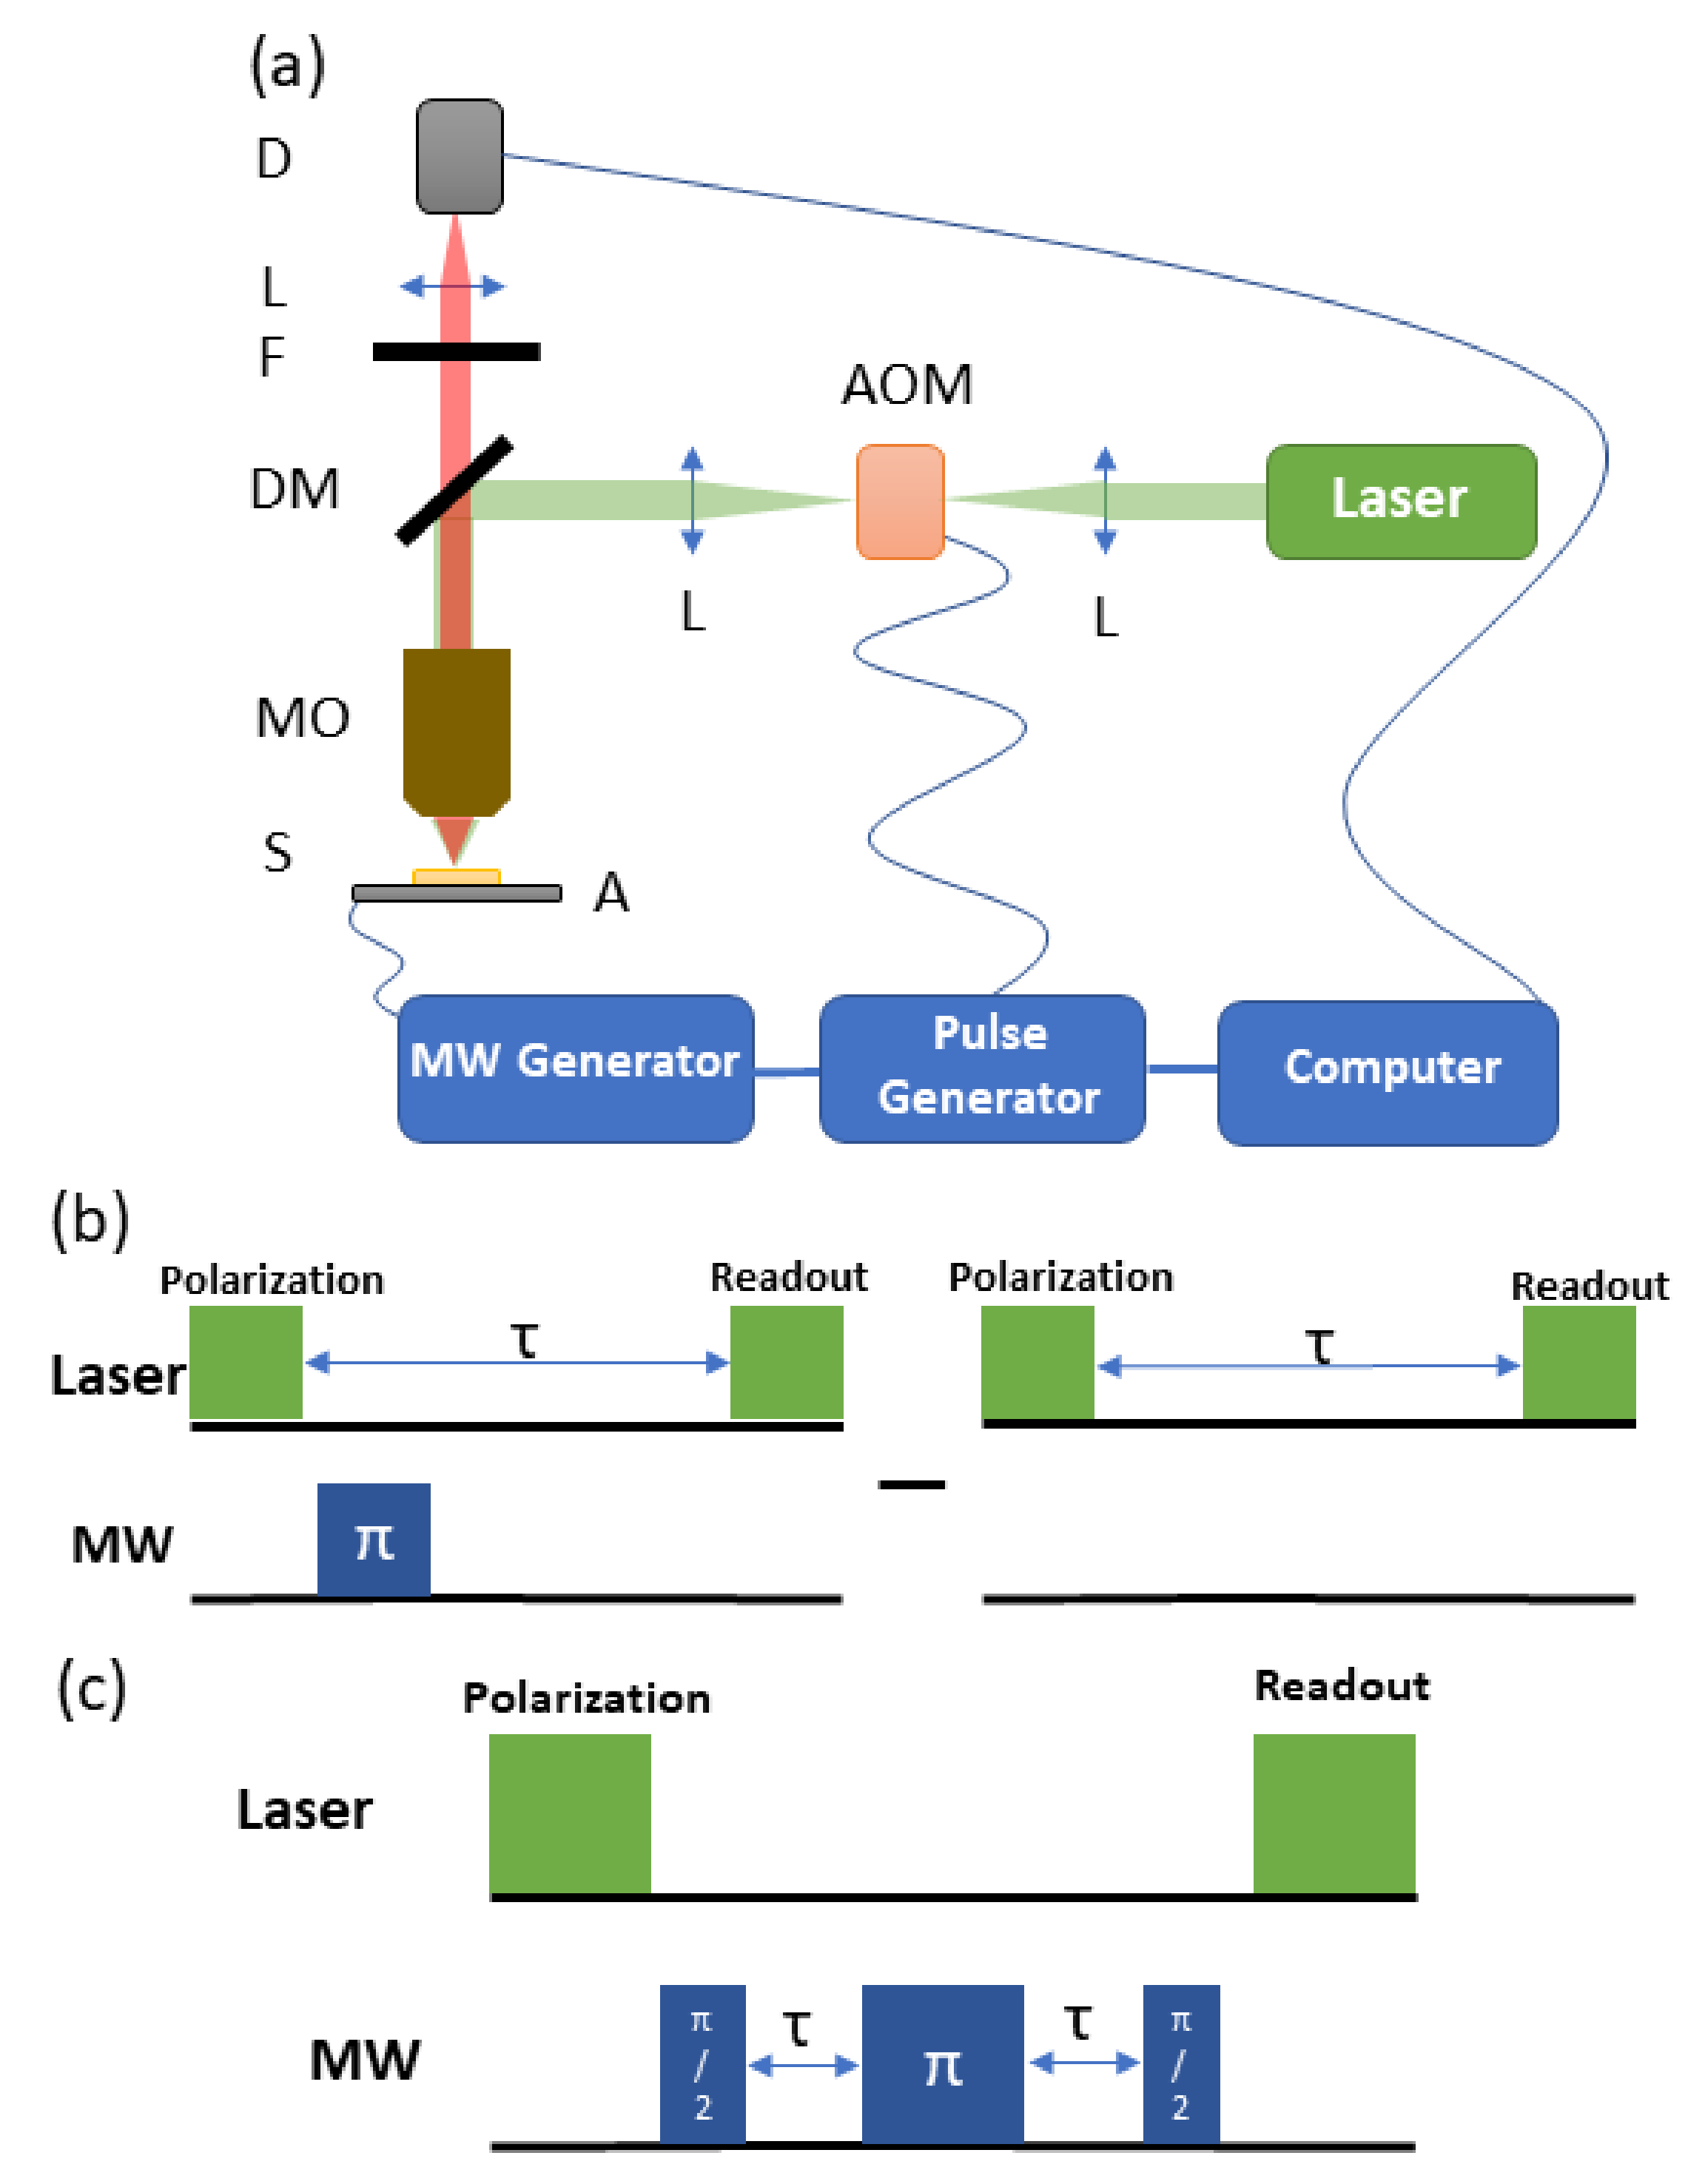
3. Experiment
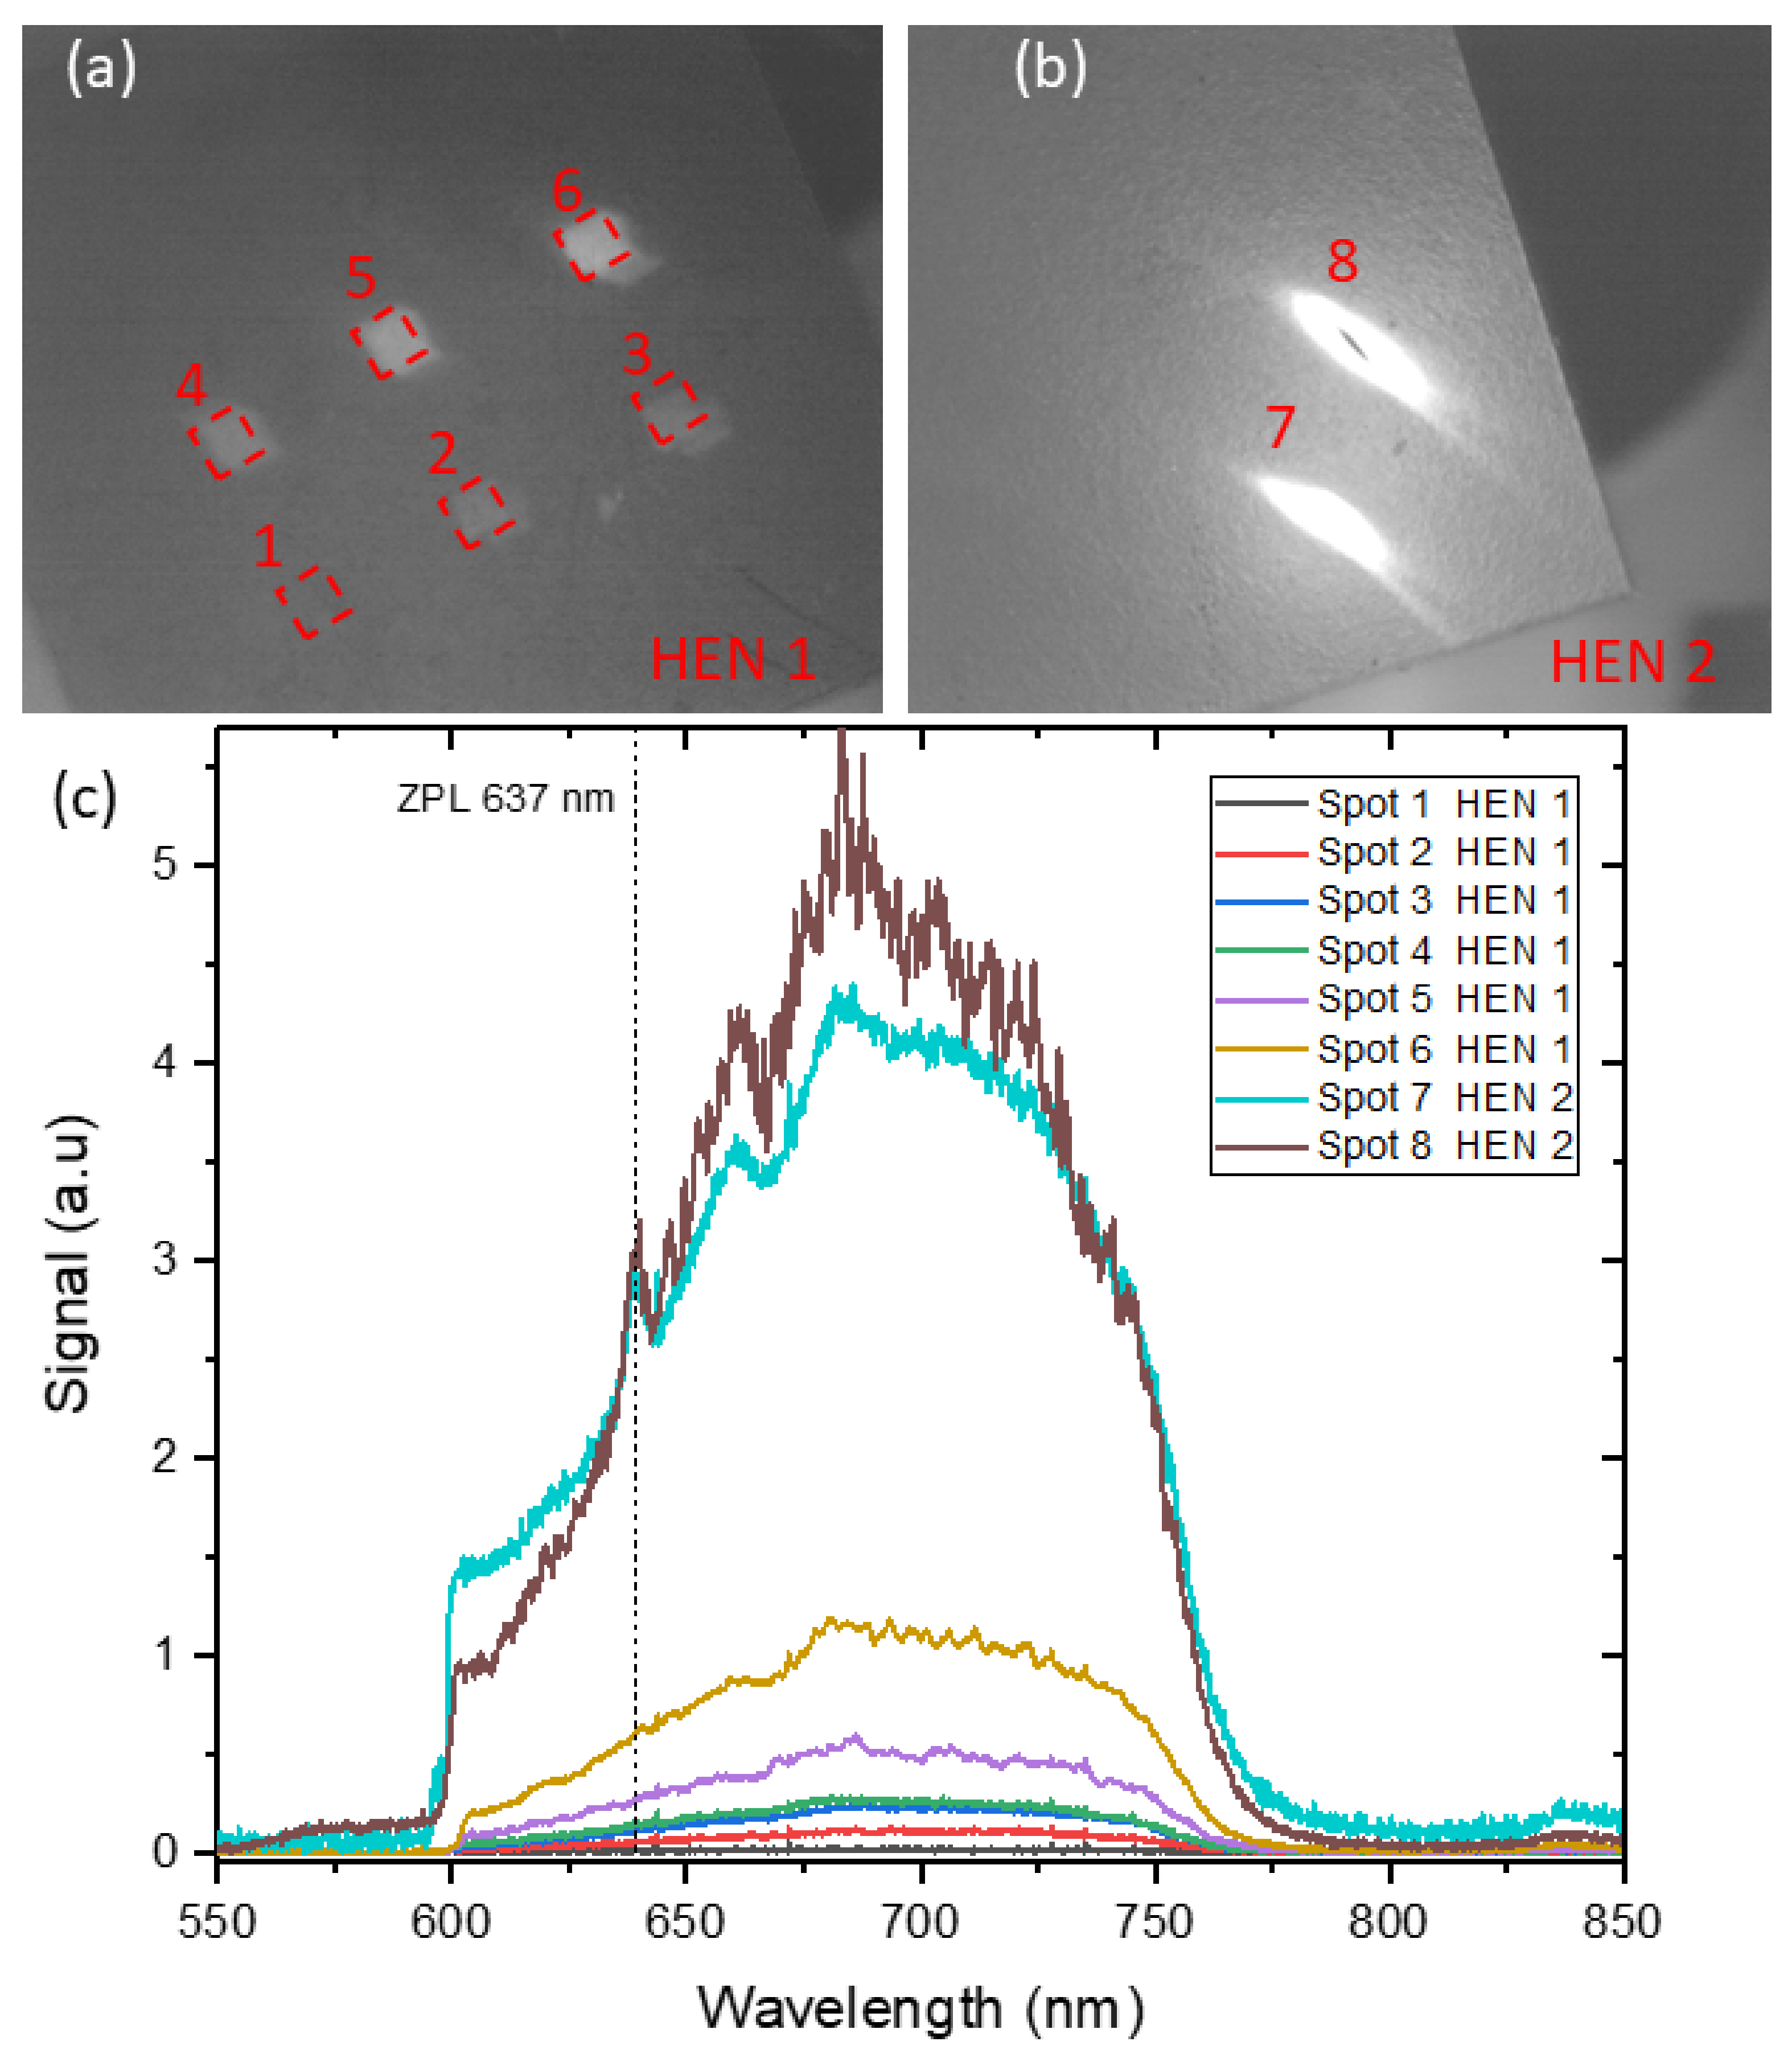
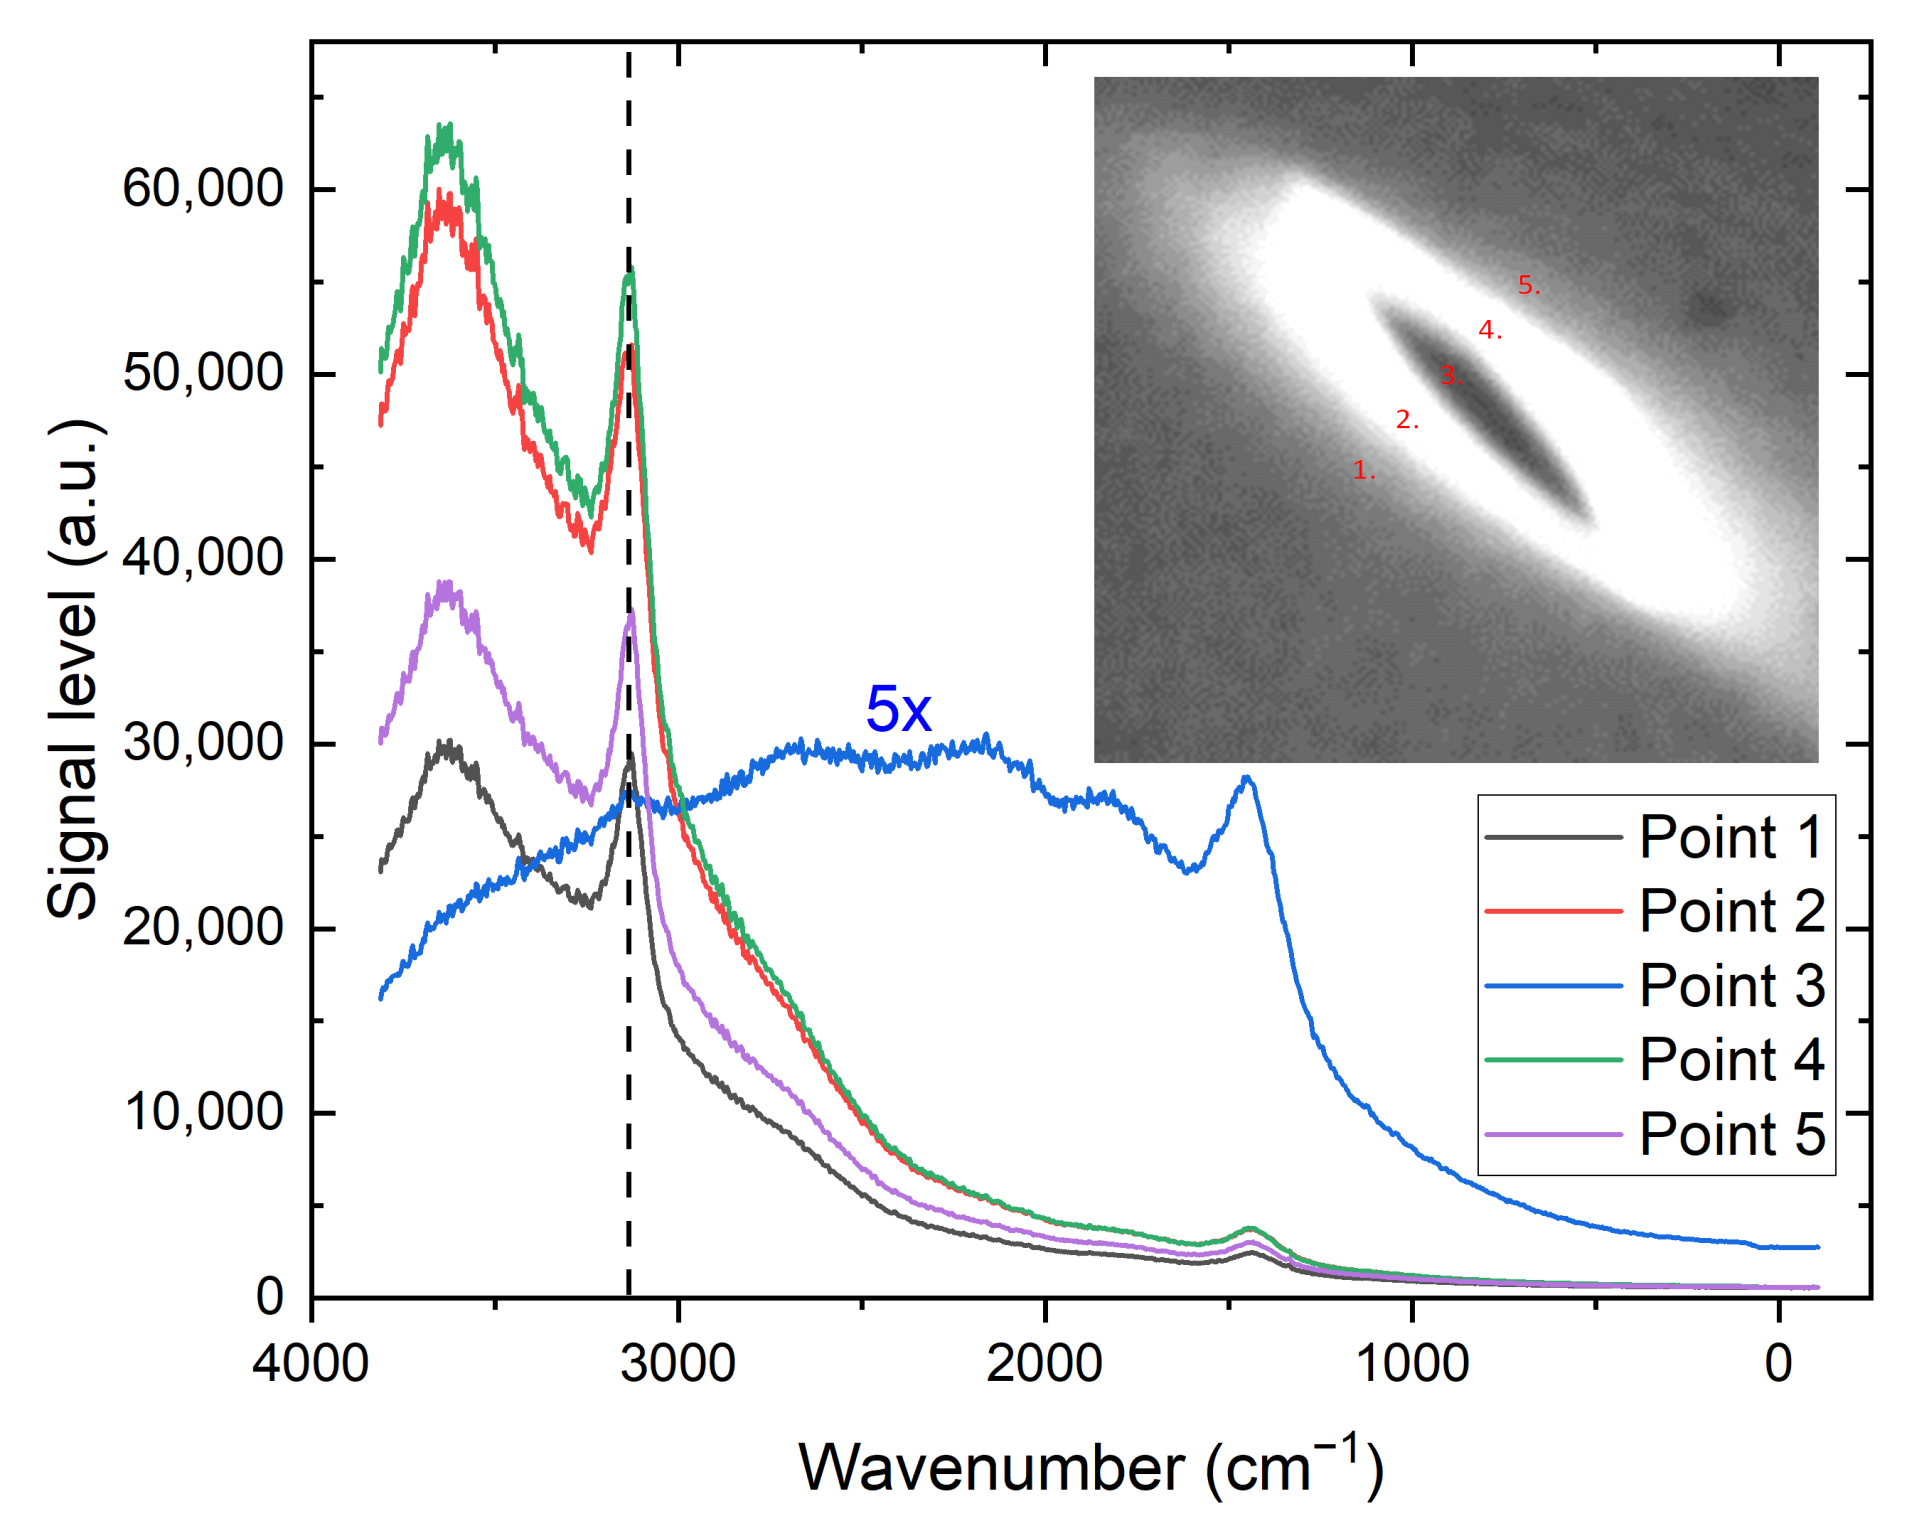
4. Results
5. Conclusions
Author Contributions
Funding
Institutional Review Board Statement
Informed Consent Statement
Data Availability Statement
Acknowledgments
Conflicts of Interest
References
- Hall, L.; Simpson, D.; Hollenberg, L. Nanoscale sensing and imaging in biology using the nitrogen-vacancy center in diamond. MRS Bull. 2013, 38, 162–167. [Google Scholar] [CrossRef]
- Kumar, R.; Pandit, P.; Pal, P.; Dhakate, S.R.; Pant, R.P.; Kumar, R.; Avasthi, D.K.; Singh, D.K. Engineering bright fluorescent nitrogen-vacancy (NV) nano-diamonds: Role of low-energy ion-irradiation parameters. AIP Adv. 2018, 8, 085023. [Google Scholar] [CrossRef] [Green Version]
- Unden, T.; Balasubramanian, P.; Louzon, D.; Vinkler, Y.; Plenio, M.B.; Markham, M.; Twitchen, D.; Stacey, A.; Lovchinsky, I.; Sushkov, A.O.; et al. Quantum Metrology Enhanced by Repetitive Quantum Error Correction. Phys. Rev. Lett. 2016, 116, 230502. [Google Scholar] [CrossRef] [Green Version]
- Rembold, P.; Oshnik, N.; Müller, M.M.; Montangero, S.; Calarco, T.; Neu, E. Introduction to quantum optimal control for quantum sensing with nitrogen-vacancy centers in diamond. AVS Quantum Sci. 2020, 2, 024701. [Google Scholar] [CrossRef]
- Acosta, V.M.; Bauch, E.; Ledbetter, M.P.; Santori, C.; Fu, K.M.C.; Barclay, P.E.; Beausoleil, R.G.; Linget, H.; Roch, J.F.; Treussart, F.; et al. Diamonds with a high density of nitrogen-vacancy centers for magnetometry applications. Phys. Rev. B 2009, 80, 115202. [Google Scholar] [CrossRef] [Green Version]
- Taylor, J.M.; Cappellaro, P.; Childress, L.; Jiang, L.; Budker, D.; Hemmer, P.R.; Yacoby, A.; Walsworth, R.; Lukin, M.D. High-sensitivity diamond magnetometer with nanoscale resolution. Nat. Phys. 2008. [Google Scholar] [CrossRef]
- Kucsko, G.; Choi, S.; Choi, J.; Maurer, P.C.; Zhou, H.; Landig, R.; Sumiya, H.; Onoda, S.; Isoya, J.; Jelezko, F.; et al. Critical Thermalization of a Disordered Dipolar Spin System in Diamond. Phys. Rev. Lett. 2018, 121, 023601. [Google Scholar] [CrossRef] [PubMed] [Green Version]
- Kehayias, P.; Mrózek, M.; Acosta, V.M.; Jarmola, A.; Rudnicki, D.S.; Folman, R.; Gawlik, W.; Budker, D. Microwave saturation spectroscopy of nitrogen-vacancy ensembles in diamond. Phys. Rev. B 2014, 89, 245202. [Google Scholar] [CrossRef] [Green Version]
- Page, M.R.; McCullian, B.A.; Purser, C.M.; Schulze, J.G.; Nakatani, T.M.; Wolfe, C.S.; Childress, J.R.; McConney, M.E.; Howe, B.M.; Hammel, P.C.; et al. Optically detected ferromagnetic resonance in diverse ferromagnets via nitrogen vacancy centers in diamond. J. Appl. Phys. 2019, 126, 124902. [Google Scholar] [CrossRef]
- Acosta, V.M.; Bauch, E.; Jarmola, A.; Zipp, L.J.; Ledbetter, M.P.; Budker, D. Broadband magnetometry by infrared-absorption detection of nitrogen-vacancy ensembles in diamond. Appl. Phys. Lett. 2010, 97, 174104. [Google Scholar] [CrossRef] [Green Version]
- Ladd, T.D.; Jelezko, F.; Laflamme, R.; Nakamura, Y.; Monroe, C.; O’Brien, J.L. Quantum Comput. Nature 2010, 464, 45–53. [Google Scholar] [CrossRef] [PubMed] [Green Version]
- Mrózek, M.; Rudnicki, D.; Kehayias, P.; Jarmola, A.; Budker, D.; Gawlik, W. Longitudinal spin relaxation in nitrogen-vacancy ensembles in diamond. EPJ Quantum Technol. 2015, 2, 22. [Google Scholar] [CrossRef] [Green Version]
- Pham, L.M.; Le Sage, D.; Stanwix, P.L.; Yeung, T.K.; Glenn, D.; Trifonov, A.; Cappellaro, P.; Hemmer, P.R.; Lukin, M.D.; Park, H.; et al. Magnetic field imaging with nitrogen-vacancy ensembles. New J. Phys. 2011, 13, 045021. [Google Scholar] [CrossRef]
- Chipaux, M.; Tallaire, A.; Achard, J.; Pezzagna, S.; Meijer, J.; Jacques, V.; Roch, J.F.; Debuisschert, T. Magnetic imaging with an ensemble of nitrogen-vacancy centers in diamond. Eur. Phys. J. D 2015, 69, 166. [Google Scholar] [CrossRef] [Green Version]
- Le Sage, D.; Arai, K.; Glenn, D.R.; DeVience, S.J.; Pham, L.M.; Rahn-Lee, L.; Lukin, M.D.; Yacoby, A.; Komeili, A.; Walsworth, R.L. Optical magnetic imaging of living cells. Nature 2013, 496, 486–489. [Google Scholar] [CrossRef] [PubMed] [Green Version]
- Simpson, D.A.; Tetienne, J.P.; McCoey, J.M.; Ganesan, K.; Hall, L.T.; Petrou, S.; Scholten, R.E.; Hollenberg, L.C.L. Magneto-optical imaging of thin magnetic films using spins in diamond. Sci. Rep. 2016, 6, 22797. [Google Scholar] [CrossRef] [PubMed]
- Smits, J.; Berzins, A.; Gahbauer, F.H.; Ferber, R.; Erglis, K.; Cebers, A.; Prikulis, J. Estimating the magnetic moment of microscopic magnetic sources from their magnetic field distribution in a layer of nitrogen-vacancy (NV) centres in diamond. Eur. Phys. J. Appl. Phys. 2016, 73, 20701. [Google Scholar] [CrossRef] [Green Version]
- Nowodzinski, A.; Chipaux, M.; Toraille, L.; Jacques, V.; Roch, J.F.; Debuisschert, T. Nitrogen-Vacancy centers in diamond for current imaging at the redistributive layer level of Integrated Circuits. Microelectron. Reliab. 2015, 55, 1549–1553. [Google Scholar] [CrossRef] [Green Version]
- Tetienne, J.P.; Dontschuk, N.; Broadway, D.A.; Stacey, A.; Simpson, D.A.; Hollenberg, L.C.L. Quantum imaging of current flow in graphene. Sci. Adv. 2017, 3, e1602429. [Google Scholar] [CrossRef] [Green Version]
- Aharonovich, I.; Santori, C.; Fairchild, B.A.; Orwa, J.; Ganesan, K.; Fu, K.M.C.; Beausoleil, R.G.; Greentree, A.D.; Prawer, S. Producing optimized ensembles of nitrogen-vacancy color centers for quantum information applications. J. Appl. Phys. 2009, 106, 124904. [Google Scholar] [CrossRef]
- Botsoa, J.; Sauvage, T.; Adam, M.P.; Desgardin, P.; Leoni, E.; Courtois, B.; Treussart, F.; Barthe, M.F. Optimal conditions for NV- center formation in type-1b diamond studied using photoluminescence and positron annihilation spectroscopies. Phys. Rev. B 2011, 84, 125209. [Google Scholar] [CrossRef] [Green Version]
- McLellan, C.A.; Myers, B.A.; Kraemer, S.; Ohno, K.; Awschalom, D.D.; Bleszynski Jayich, A.C. Patterned Formation of Highly Coherent Nitrogen-Vacancy Centers Using a Focused Electron Irradiation Technique. Nano Lett. 2016, 16, 2450–2454. [Google Scholar] [CrossRef] [PubMed] [Green Version]
- Barry, J.F.; Schloss, J.M.; Bauch, E.; Turner, M.J.; Hart, C.A.; Pham, L.M.; Walsworth, R.L. Sensitivity optimization for NV-diamond magnetometry. Rev. Mod. Phys. 2020, 92, 015004. [Google Scholar] [CrossRef]
- Choi, J.; Choi, S.; Kucsko, G.; Maurer, P.C.; Shields, B.J.; Sumiya, H.; Onoda, S.; Isoya, J.; Demler, E.; Jelezko, F.; et al. Depolarization Dynamics in a Strongly Interacting Solid-State Spin Ensemble. Phys. Rev. Lett. 2017, 118, 093601. [Google Scholar] [CrossRef] [PubMed]
- Schabikowski, M.; Wojciechowski, A.M.; Mitura-Nowak, M.; Mrózek, M.; Kruk, A.; Rajchel, B.; Gawlik, W.; Marszałek, M. Optical characterization of nitrogen-vacancy centers created by proton implantation in diamond. Acta Phys. Pol. A 2020. [Google Scholar] [CrossRef]
- Jin, H.; Bettiol, A.A. Influence of thermal annealing on the properties of proton implanted diamond waveguides. Carbon 2021, 171, 560–567. [Google Scholar] [CrossRef]
- Shin, C.S.; Avalos, C.E.; Butler, M.C.; Trease, D.R.; Seltzer, S.J.; Peter Mustonen, J.; Kennedy, D.J.; Acosta, V.M.; Budker, D.; Pines, A.; et al. Room-temperature operation of a radiofrequency diamond magnetometer near the shot-noise limit. J. Appl. Phys. 2012, 112, 124519. [Google Scholar] [CrossRef] [Green Version]
- Ziegler, J.F.; Ziegler, M.; Biersack, J. SRIM – The stopping and range of ions in matter (2010). Nucl. Instrum. Methods Phys. Res. Sect. B Beam Interact. Mater. Atoms. 2010, 268, 1818–1823. [Google Scholar] [CrossRef] [Green Version]
- Koike, J.; Parkin, D.M.; Mitchell, T.E. Displacement threshold energy for type IIa diamond. Appl. Phys. Lett. 1992, 60, 1450–1452. [Google Scholar] [CrossRef]
- Turaga, S.P.; Jin, H.; Teo, E.J.; Bettiol, A.A. Cross-sectional hyperspectral imaging of proton implanted diamond. Appl. Phys. Lett. 2019, 115, 021904. [Google Scholar] [CrossRef]
- Sasaki, K.; Monnai, Y.; Saijo, S.; Fujita, R.; Watanabe, H.; Ishi-Hayase, J.; Itoh, K.M.; Abe, E. Broadband, large-area microwave antenna for optically detected magnetic resonance of nitrogen-vacancy centers in diamond. Rev. Sci. Instrum. 2016, 87, 053904. [Google Scholar] [CrossRef]
- Jarmola, A.; Acosta, V.M.; Jensen, K.; Chemerisov, S.; Budker, D. Temperature- and Magnetic-Field-Dependent Longitudinal Spin Relaxation in Nitrogen-Vacancy Ensembles in Diamond. Phys. Rev. Lett. 2012, 108, 197601. [Google Scholar] [CrossRef] [Green Version]
- Hahn, E.L. Spin Echoes. Phys. Rev. 1950, 80, 580–594. [Google Scholar] [CrossRef]
- Pezzagna, S.; Naydenov, B.; Jelezko, F.; Wrachtrup, J.; Meijer, J. Creation efficiency of nitrogen-vacancy centres in diamond. New J. Phys. 2010, 12, 065017. [Google Scholar] [CrossRef]
- Levchenko, A.O.; Vasil’ev, V.V.; Zibrov, S.A.; Zibrov, A.S.; Sivak, A.V.; Fedotov, I.V. Inhomogeneous broadening of optically detected magnetic resonance of the ensembles of nitrogen-vacancy centers in diamond by interstitial carbon atoms. Appl. Phys. Lett. 2015, 106, 102402. [Google Scholar] [CrossRef]
- Jarmola, A.; Berzins, A.; Smits, J.; Smits, K.; Prikulis, J.; Gahbauer, F.; Ferber, R.; Erts, D.; Auzinsh, M.; Budker, D. Longitudinal spin-relaxation in nitrogen-vacancy centers in electron irradiated diamond. Appl. Phys. Lett. 2015, 107, 242403. [Google Scholar] [CrossRef] [Green Version]
- Trofimov, S.D.; Tarelkin, S.A.; Bolshedvorskii, S.V.; Bormashov, V.S.; Troshchiev, S.Y.; Golovanov, A.V.; Luparev, N.V.; Prikhodko, D.D.; Boldyrev, K.N.; Terentiev, S.A.; et al. Spatially controlled fabrication of single NV centers in IIa HPHT diamond. Opt. Mater. Express 2020, 10, 198–207. [Google Scholar] [CrossRef] [Green Version]
- Stepanov, V.; Takahashi, S. Determination of nitrogen spin concentration in diamond using double electron-electron resonance. Phys. Rev. B 2016, 94, 024421. [Google Scholar] [CrossRef] [Green Version]
- Van Wyk, J.A.; Reynhardt, E.C.; High, G.L.; Kiflawi, I. The dependences of ESR line widths and spin - spin relaxation times of single nitrogen defects on the concentration of nitrogen defects in diamond. J. Phys. Appl. Phys. 1997, 30, 1790–1793. [Google Scholar] [CrossRef]
- Choi, S.; Choi, J.; Landig, R.; Kucsko, G.; Zhou, H.; Isoya, J.; Jelezko, F.; Onoda, S.; Sumiya, H.; Khemani, V.; et al. Observation of discrete time-crystalline order in a disordered dipolar many-body system. Nature 2017. [Google Scholar] [CrossRef] [PubMed] [Green Version]
- Alsid, S.T.; Barry, J.F.; Pham, L.M.; Schloss, J.M.; O’Keeffe, M.F.; Cappellaro, P.; Braje, D.A. Photoluminescence Decomposition Analysis: A Technique to Characterize N-V Creation in Diamond. Phys. Rev. Appl. 2019, 12, 044003. [Google Scholar] [CrossRef] [Green Version]
- Bauch, E.; Singh, S.; Lee, J.; Hart, C.A.; Schloss, J.M.; Turner, M.J.; Barry, J.F.; Pham, L.; Bar-Gill, N.; Yelin, S.F.; et al. Decoherence of dipolar spin ensembles in diamond. arXiv 2019, arXiv:1904.08763. [Google Scholar]
- Bauch, E.; Hart, C.A.; Schloss, J.M.; Turner, M.J.; Barry, J.F.; Kehayias, P.; Singh, S.; Walsworth, R.L. Ultralong Dephasing Times in Solid-State Spin Ensembles via Quantum Control. Phys. Rev. X 2018, 8, 031025. [Google Scholar] [CrossRef] [Green Version]
- Lei, C.; Peng, S.; Ju, C.; Yung, M.H.; Du, J. Decoherence Control of Nitrogen-Vacancy Centers. Sci. Rep. 2017. [Google Scholar] [CrossRef] [Green Version]
- Wojciechowski, A.M.; Karadas, M.; Osterkamp, C.; Jankuhn, S.; Meijer, J.; Jelezko, F.; Huck, A.; Andersen, U.L. Precision temperature sensing in the presence of magnetic field noise and vice versa using nitrogen-vacancy centers in diamond. Appl. Phys. Lett. 2018, 113, 013502. [Google Scholar] [CrossRef]
- Kleinsasser, E.E.; Stanfield, M.M.; Banks, J.K.Q.; Zhu, Z.; Li, W.D.; Acosta, V.M.; Watanabe, H.; Itoh, K.M.; Fu, K.M.C. High density nitrogen-vacancy sensing surface created via He+ ion implantation of 12C diamond. Appl. Phys. Lett. 2016, 108, 202401. [Google Scholar] [CrossRef] [Green Version]
- Genish, H.; Ganesan, K.; Stacey, A.; Prawer, S.; Rosenbluh, M. Effect of radiation damage on the quantum optical properties of nitrogen vacancies in diamond. Diam. Relat. Mater. 2020, 109, 108049. [Google Scholar] [CrossRef]
- Rondin, L.; Tetienne, J.P.; Hingant, T.; Roch, J.F.; Maletinsky, P.; Jacques, V. Magnetometry with nitrogen-vacancy defects in diamond. Rep. Prog. Phys. 2014, 77, 056503. [Google Scholar] [CrossRef] [PubMed] [Green Version]

| Spot Number | Dose [ions/cm] |
|---|---|
| 1 | |
| 2 | |
| 3 | |
| 4 | |
| 5 | |
| 6 | |
| 7 | |
| 8 |
| Type of Diamond | Initial N Concentration [ppm] | Energy [MeV] | Type Implantation | Depth [m] | Dose [cm] | [ms] | [s] | Authors |
|---|---|---|---|---|---|---|---|---|
| HPHT | 200 | 0.2 | electron | 20 | – | 4.8–0.83 | Jarmola et al. [36] | |
| CVD | 0.1 | 1 | electron | – | 5.5 | 100–300 | Alsid et al. [41] | |
| CVD | 10 | 1.8 | He | 1 | 1 () | Wojciechowski et al. [45] | ||
| HPHT CVD | 50–0.5 | 0.05 | He | 0.25 | 0.3 () | Trofimov et al. [37] | ||
| CVD | 0.001 | 0.15–0.05 | He | 0.1 | – | 1.5 () | Kleinsasser et al. [46] | |
| CVD | 0.005 | 2 | He | 3.4 | – | 150 | Genish et al. [47] | |
| CVD | 200 | 2 | proton | 25 | – | Jin et al. [26] | ||
| HPHT | 50 | 1.8 | proton | 20 | – | 6–1.25 | 2.5–1.1 | This paper |
| HPHT CVD | 100 0.001 | non implantation | 1 300 | Rodin et al. [48] |
Publisher’s Note: MDPI stays neutral with regard to jurisdictional claims in published maps and institutional affiliations. |
© 2021 by the authors. Licensee MDPI, Basel, Switzerland. This article is an open access article distributed under the terms and conditions of the Creative Commons Attribution (CC BY) license (http://creativecommons.org/licenses/by/4.0/).
Share and Cite
Mrózek, M.; Schabikowski, M.; Mitura-Nowak, M.; Lekki, J.; Marszałek, M.; Wojciechowski, A.M.; Gawlik, W. Nitrogen-Vacancy Color Centers Created by Proton Implantation in a Diamond. Materials 2021, 14, 833. https://doi.org/10.3390/ma14040833
Mrózek M, Schabikowski M, Mitura-Nowak M, Lekki J, Marszałek M, Wojciechowski AM, Gawlik W. Nitrogen-Vacancy Color Centers Created by Proton Implantation in a Diamond. Materials. 2021; 14(4):833. https://doi.org/10.3390/ma14040833
Chicago/Turabian StyleMrózek, Mariusz, Mateusz Schabikowski, Marzena Mitura-Nowak, Janusz Lekki, Marta Marszałek, Adam M. Wojciechowski, and Wojciech Gawlik. 2021. "Nitrogen-Vacancy Color Centers Created by Proton Implantation in a Diamond" Materials 14, no. 4: 833. https://doi.org/10.3390/ma14040833