
Simulation and Experimental Study on Wear of U-Shaped Rings of Power Connection Fittings under Strong Wind Environment

Abstract
:1. Introduction
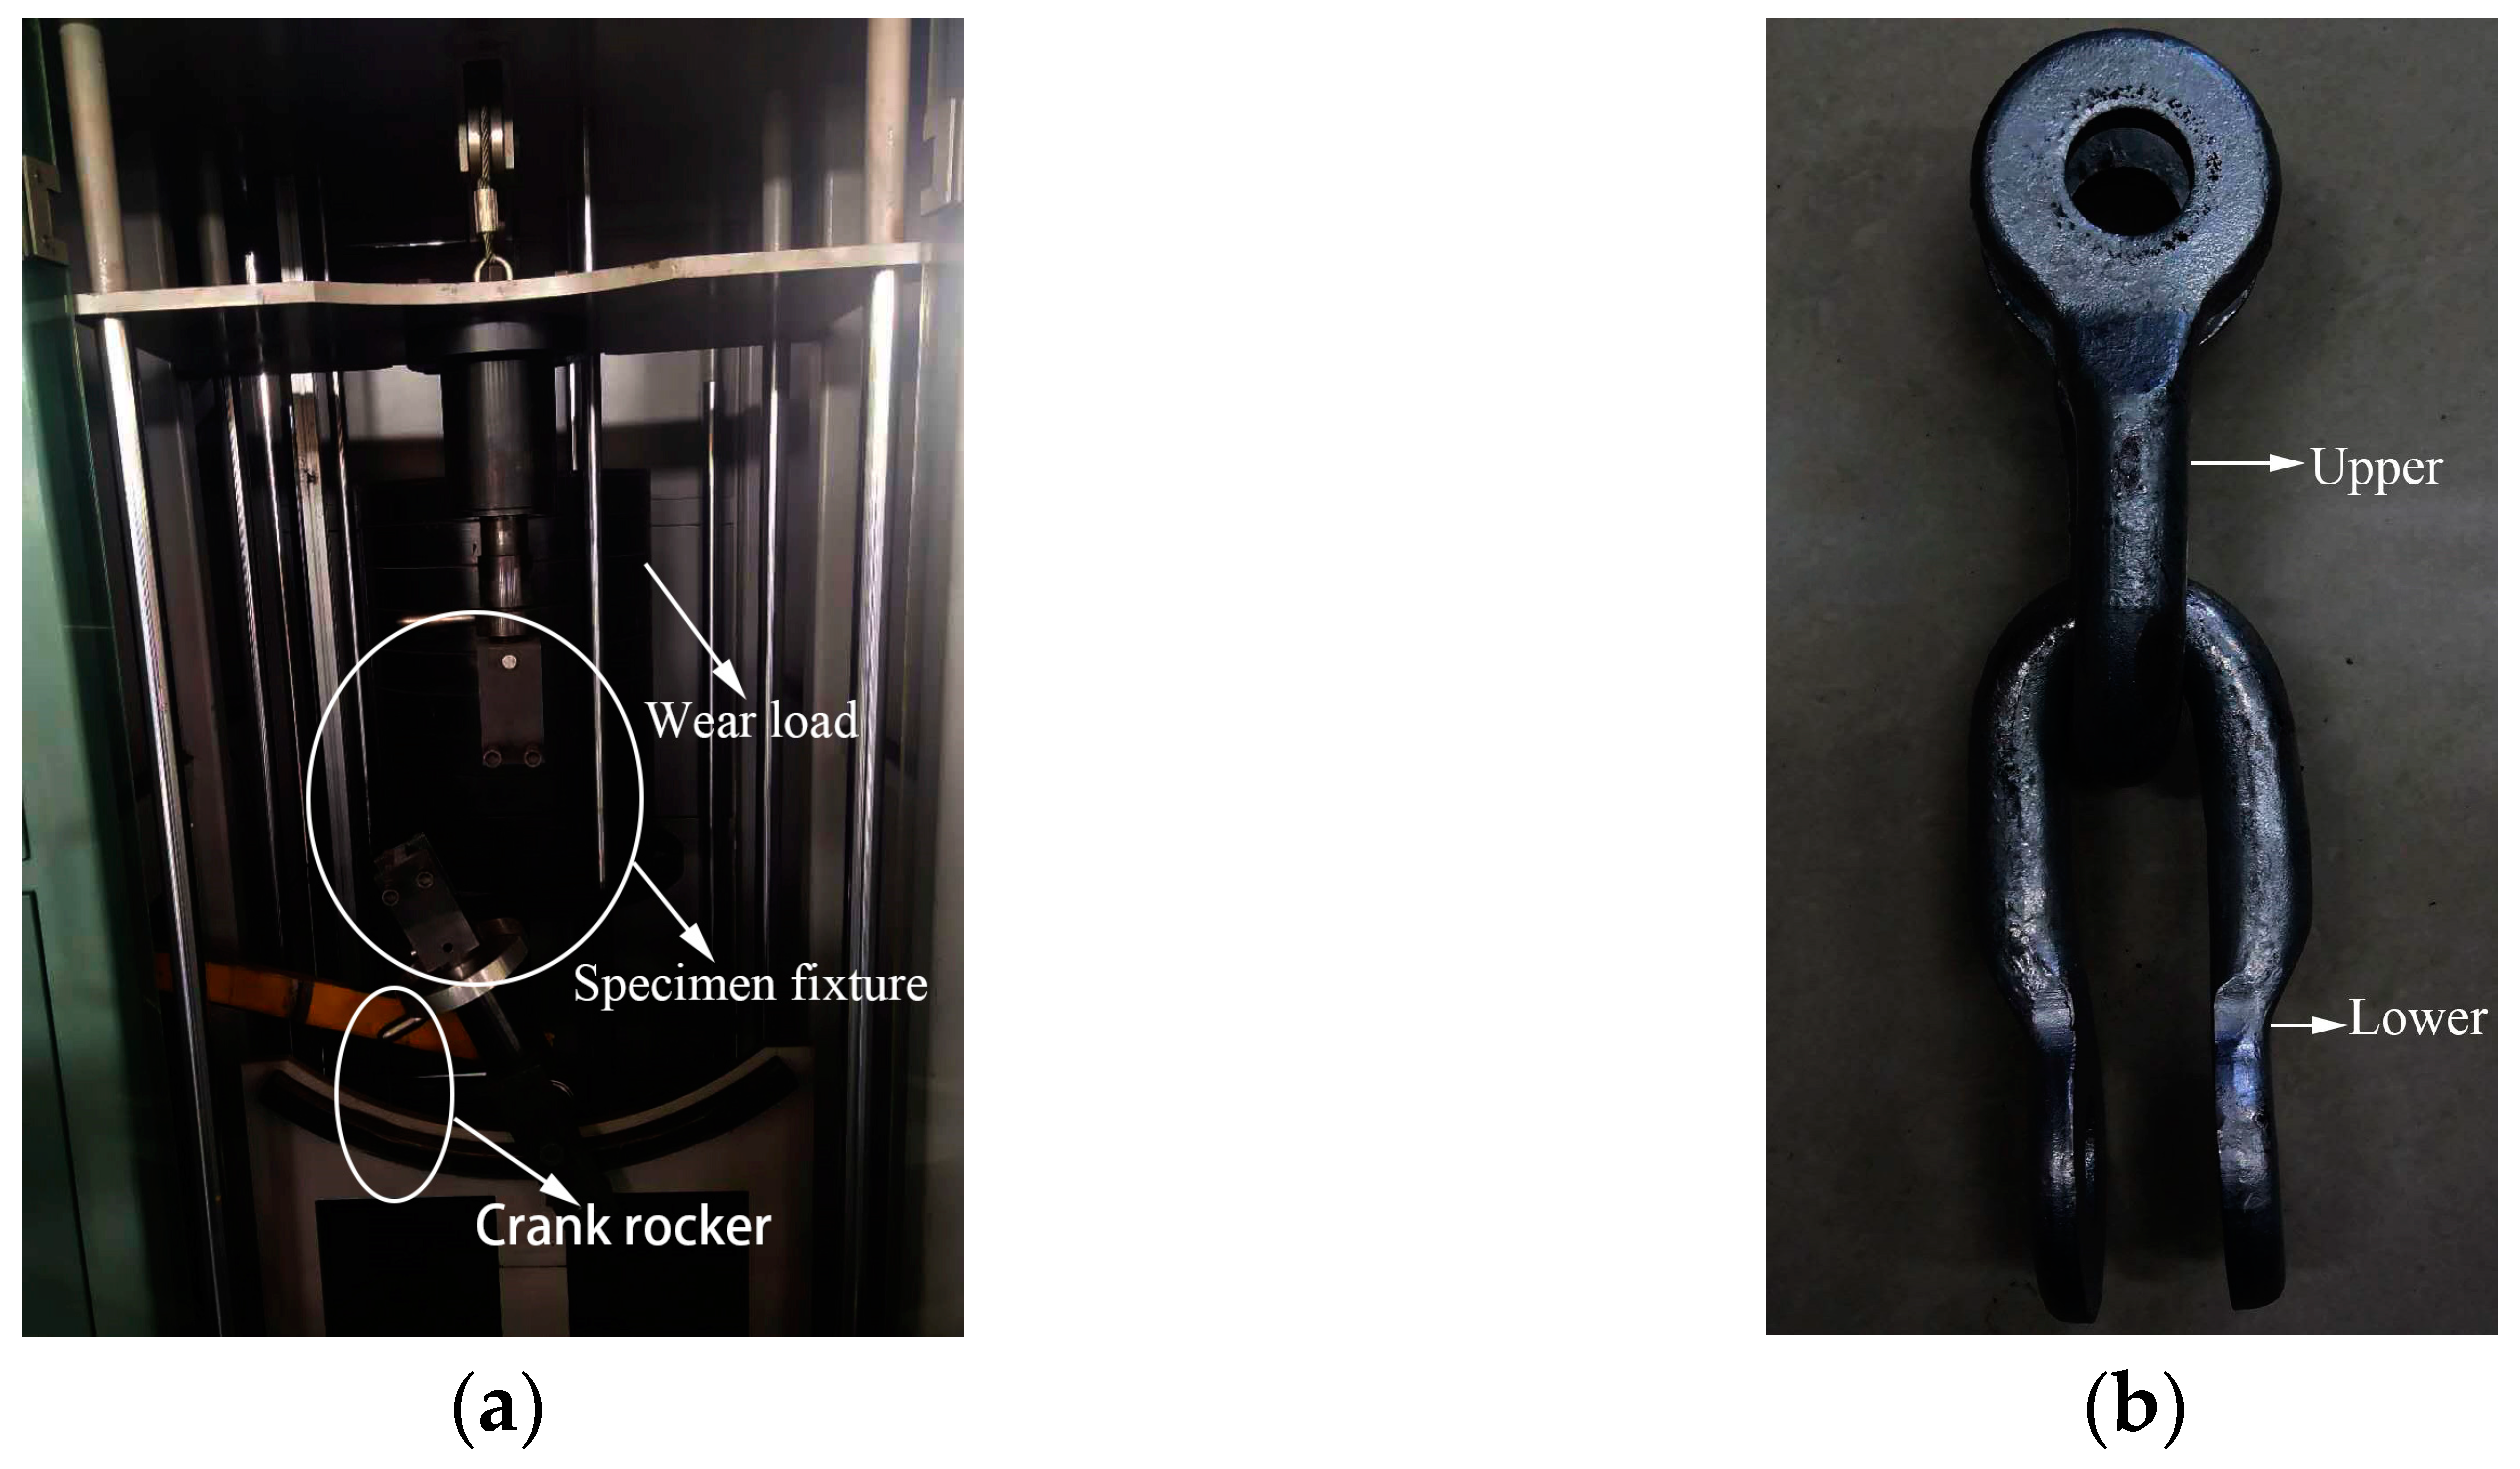
2. Experimental Details
3. Results
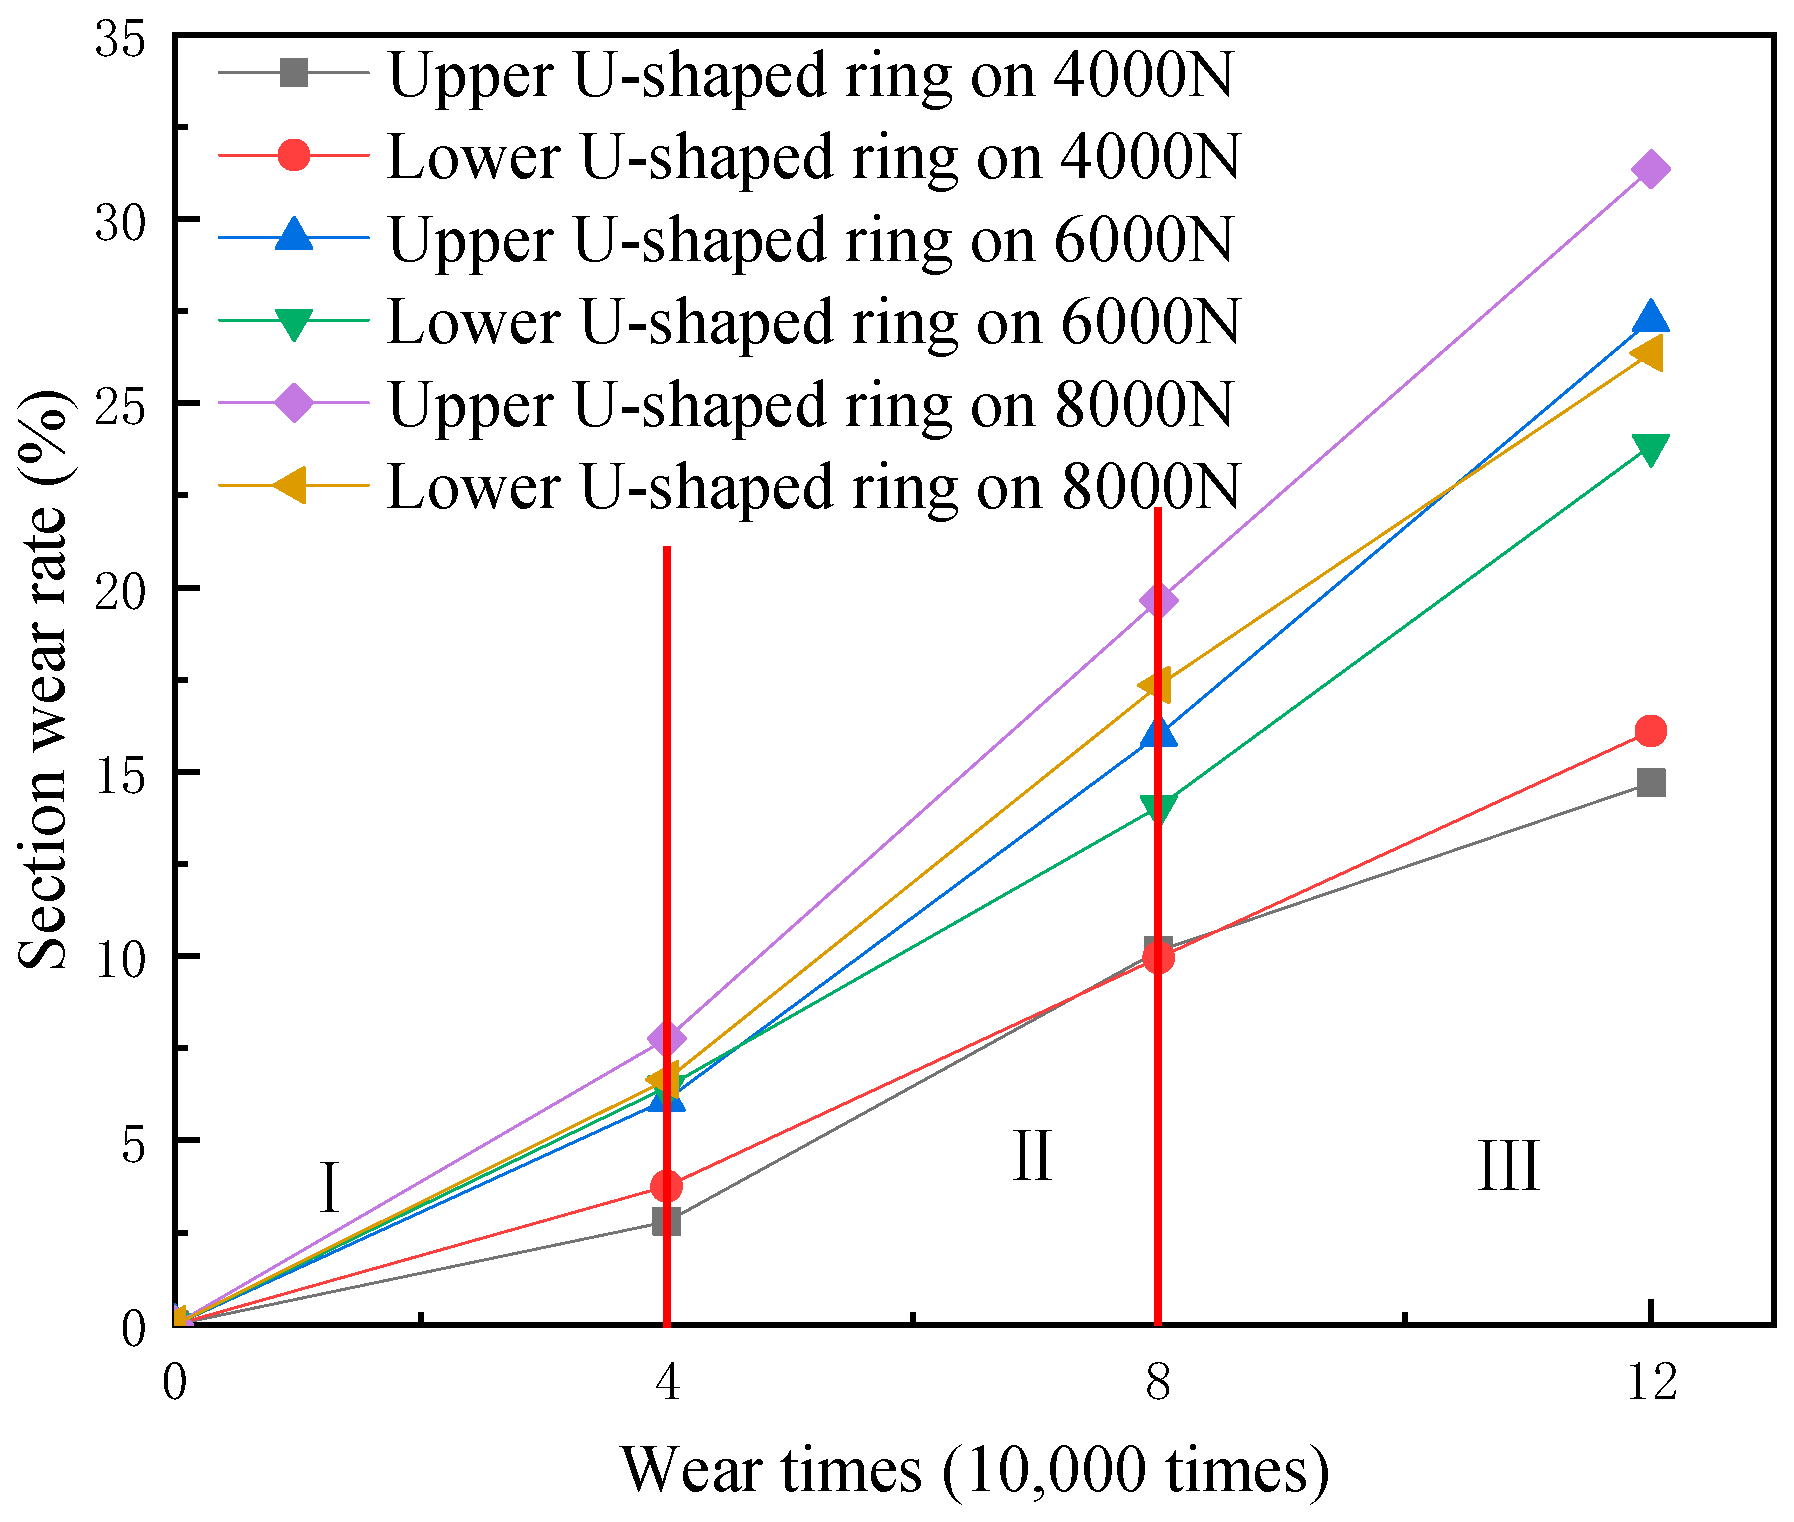
3.1. Wear Behavior
3.2. Macroscopic Surface Morphology
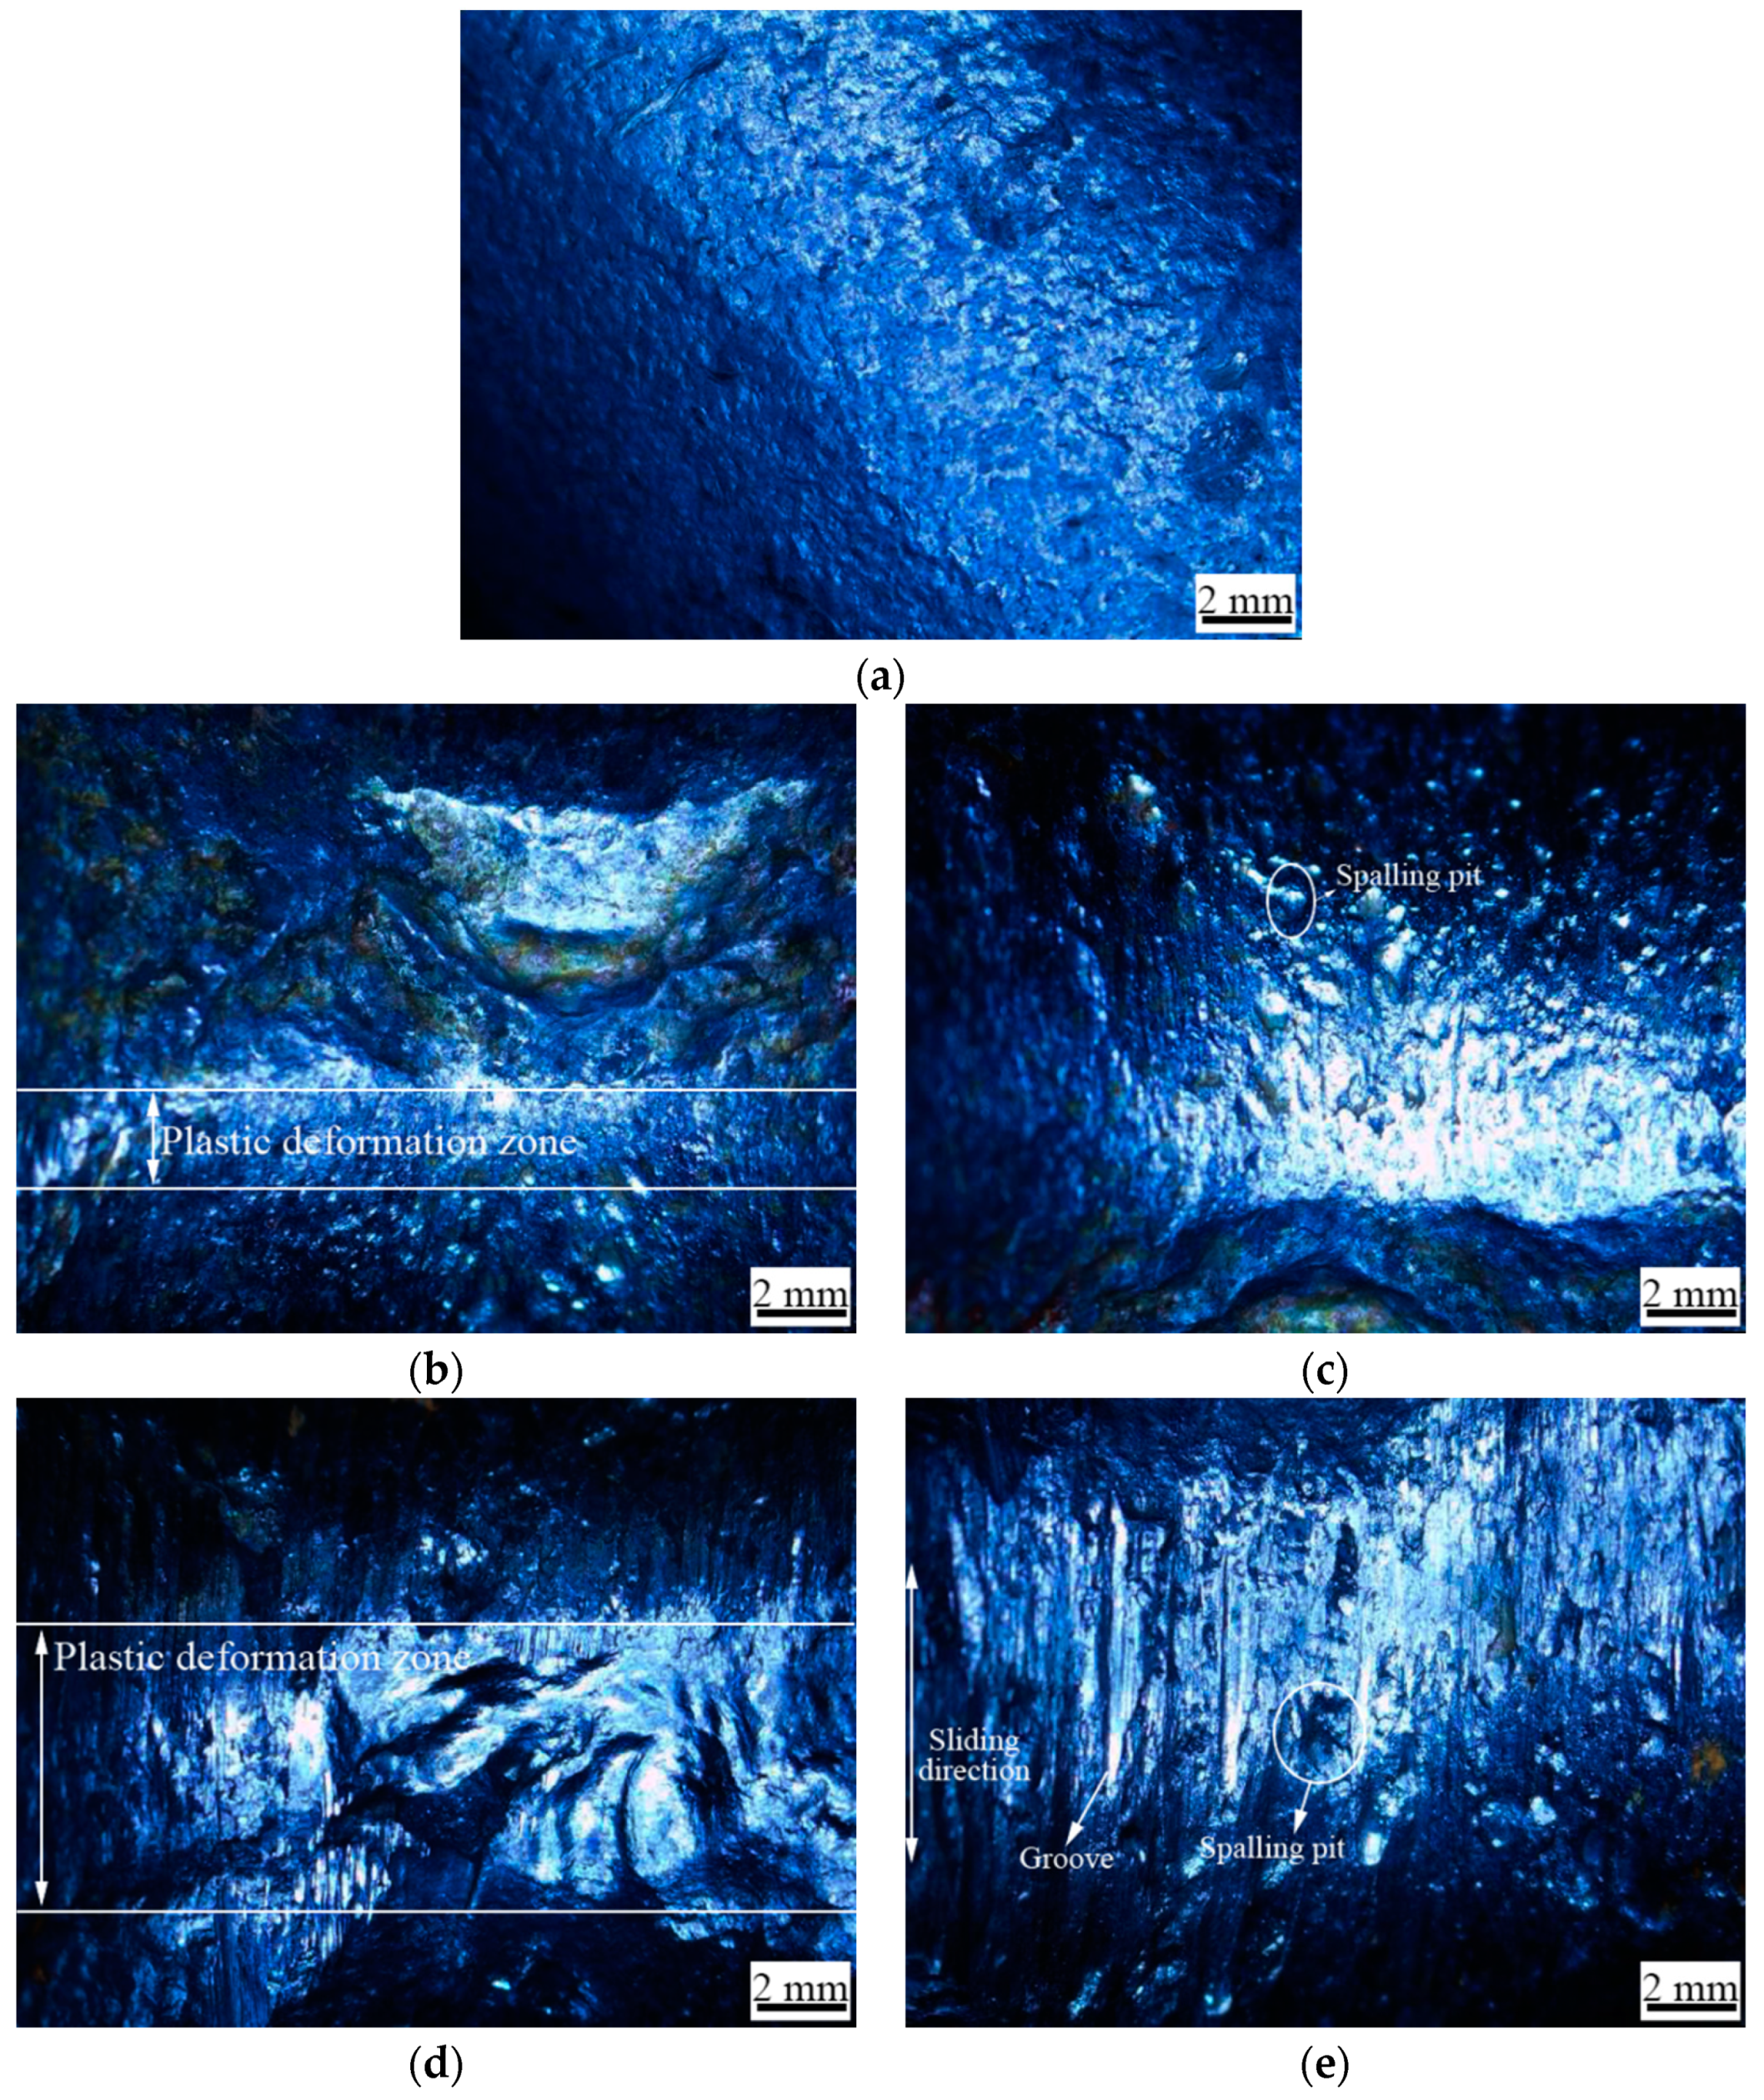
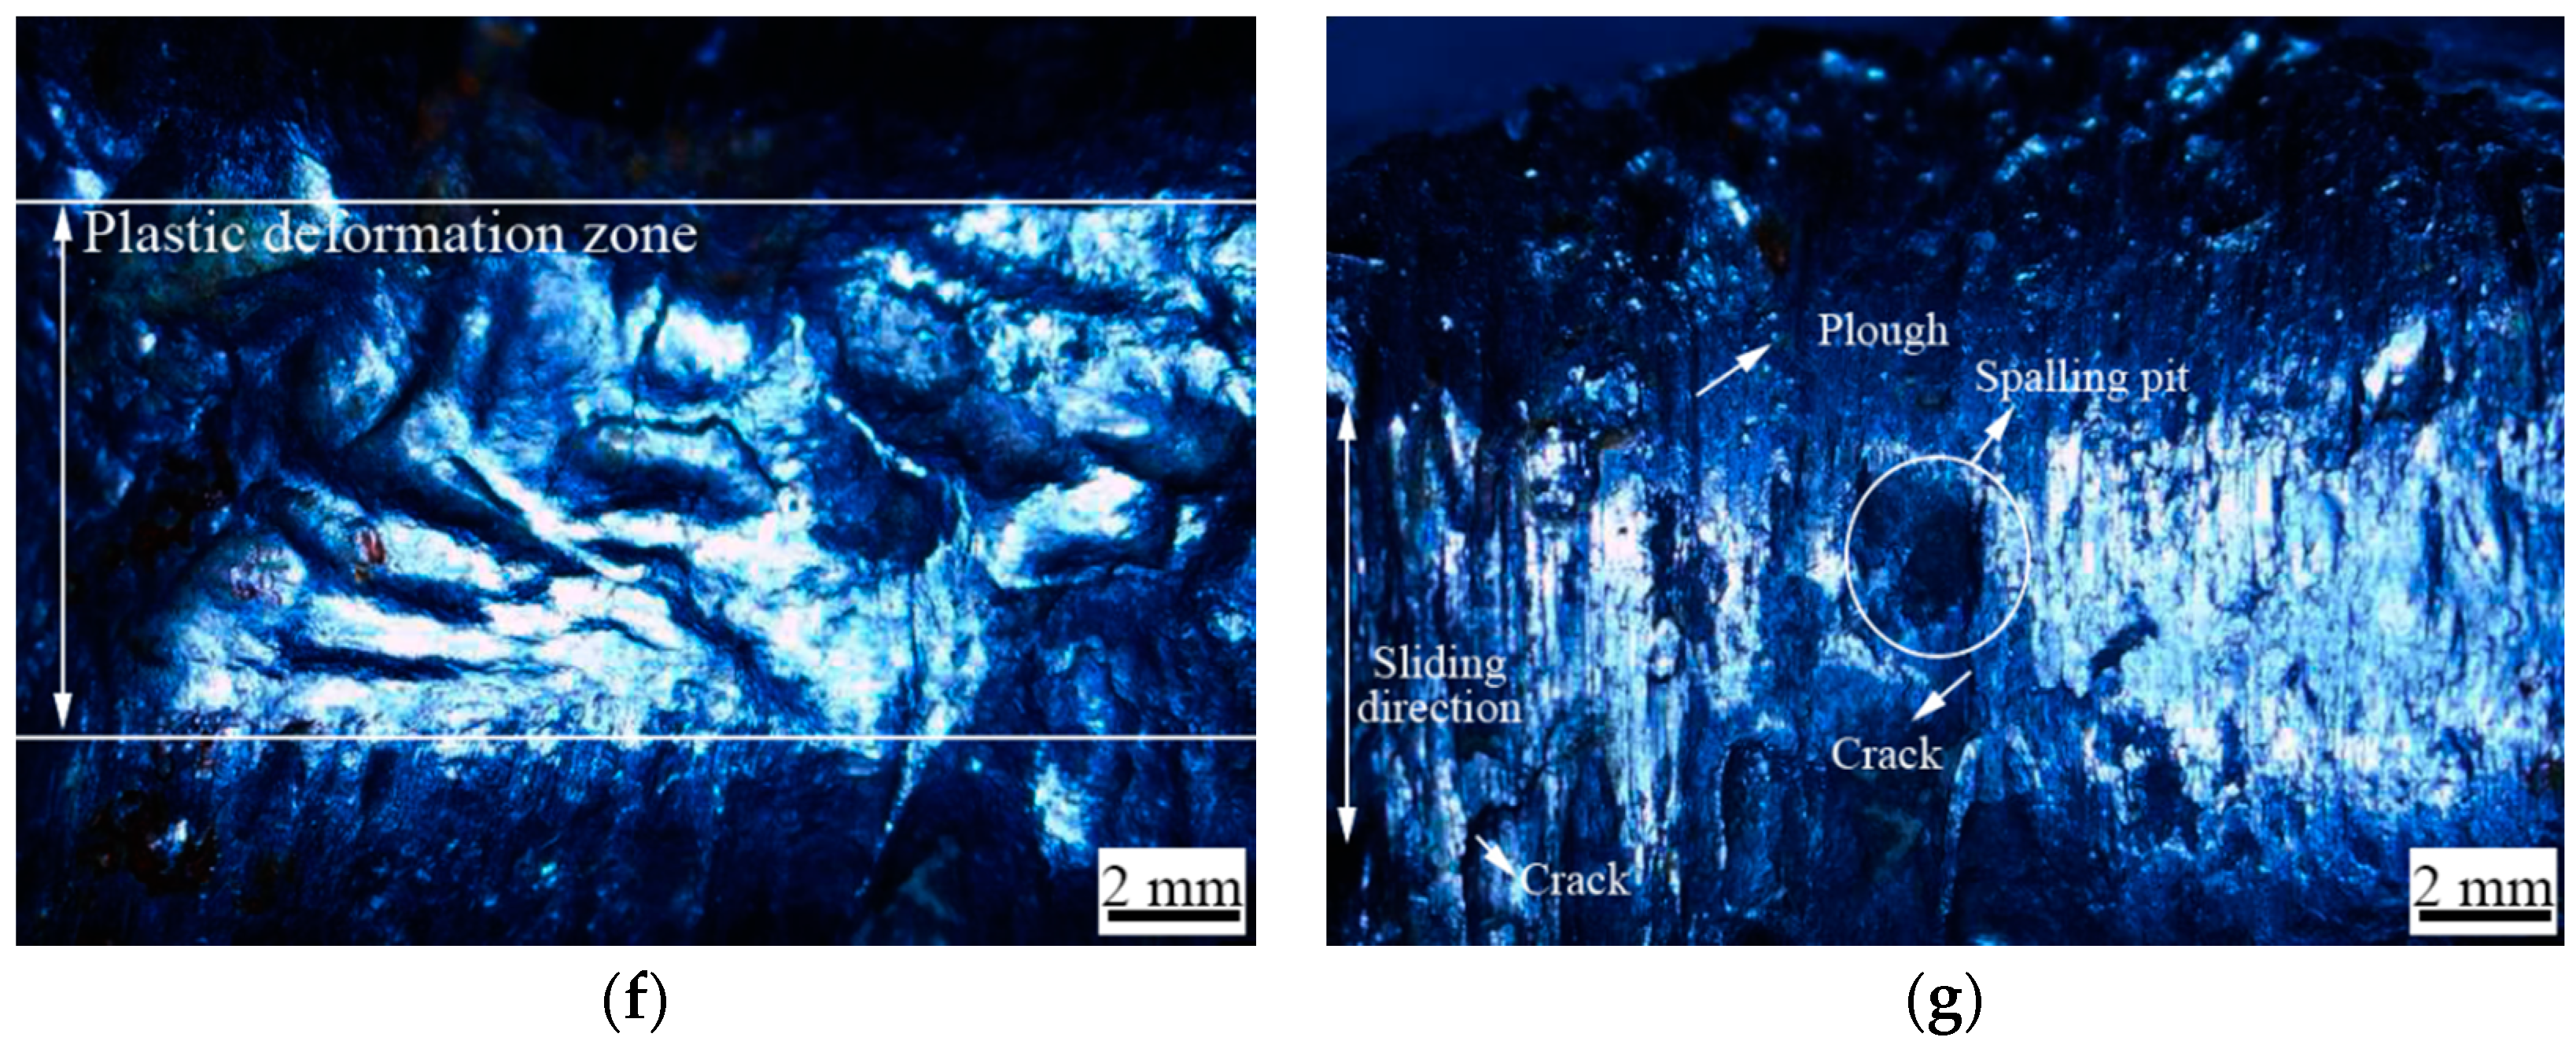
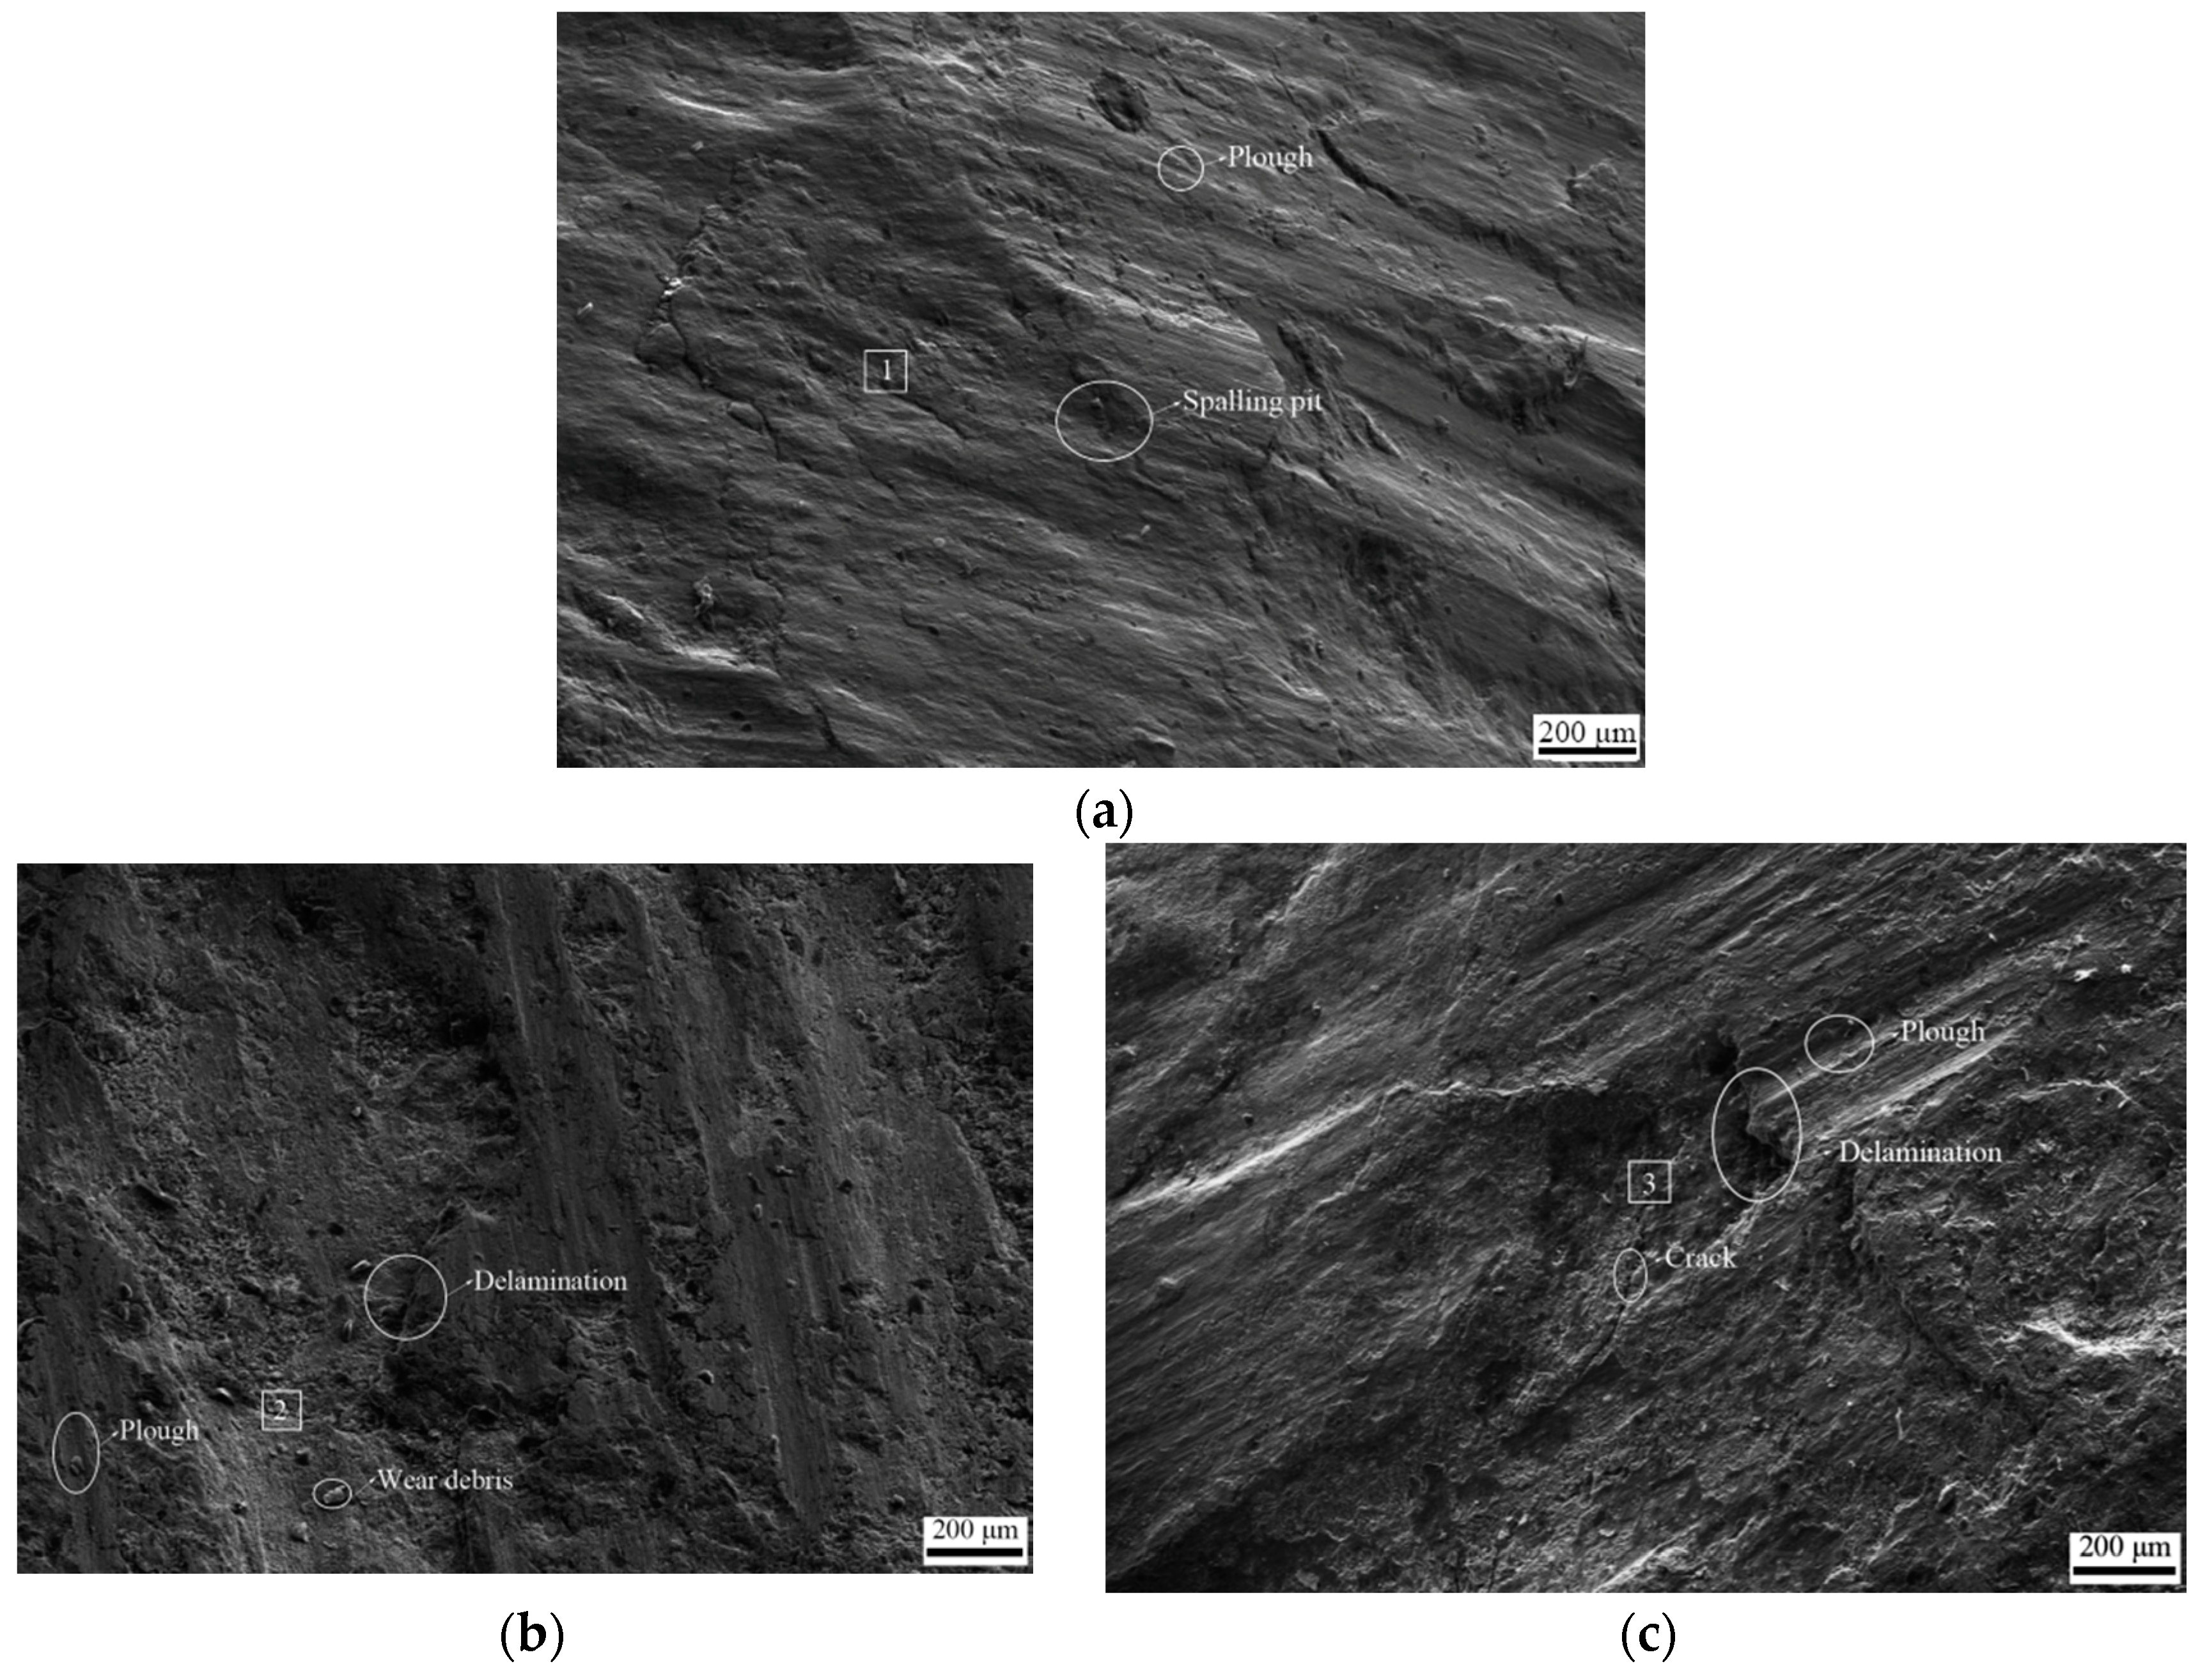
3.3. Surface Damage
3.4. Metallography
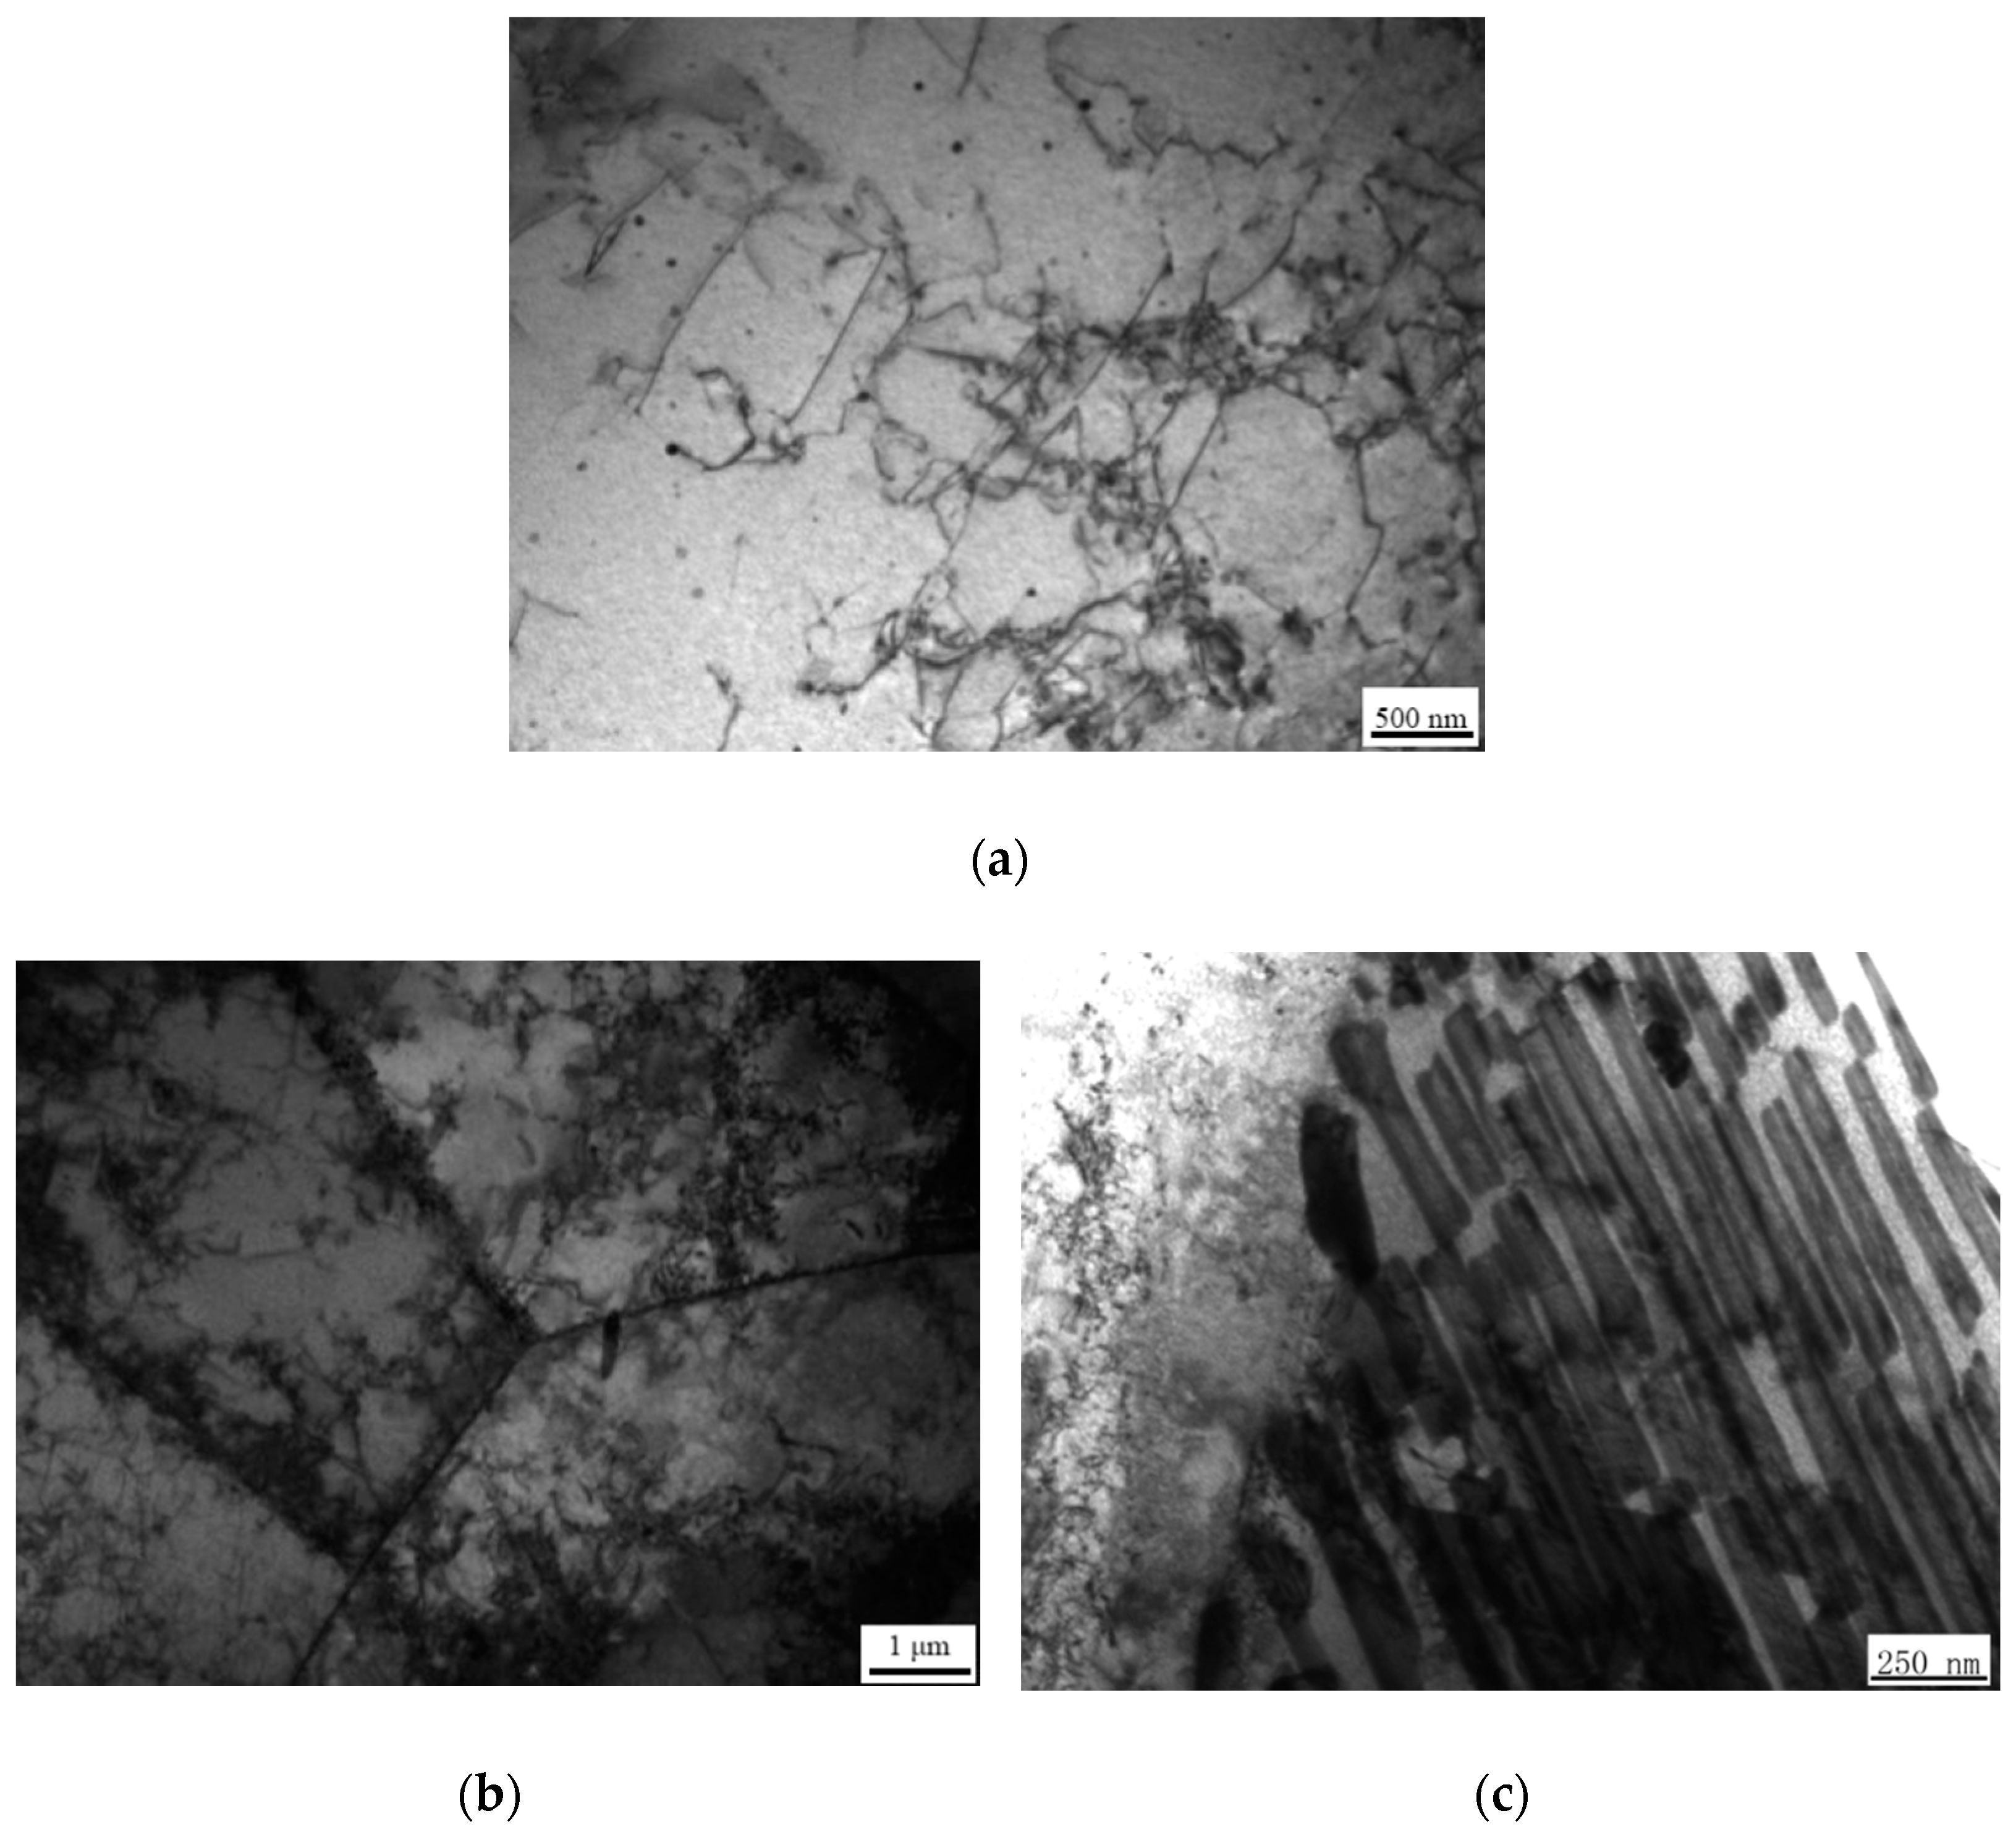
3.5. TEM
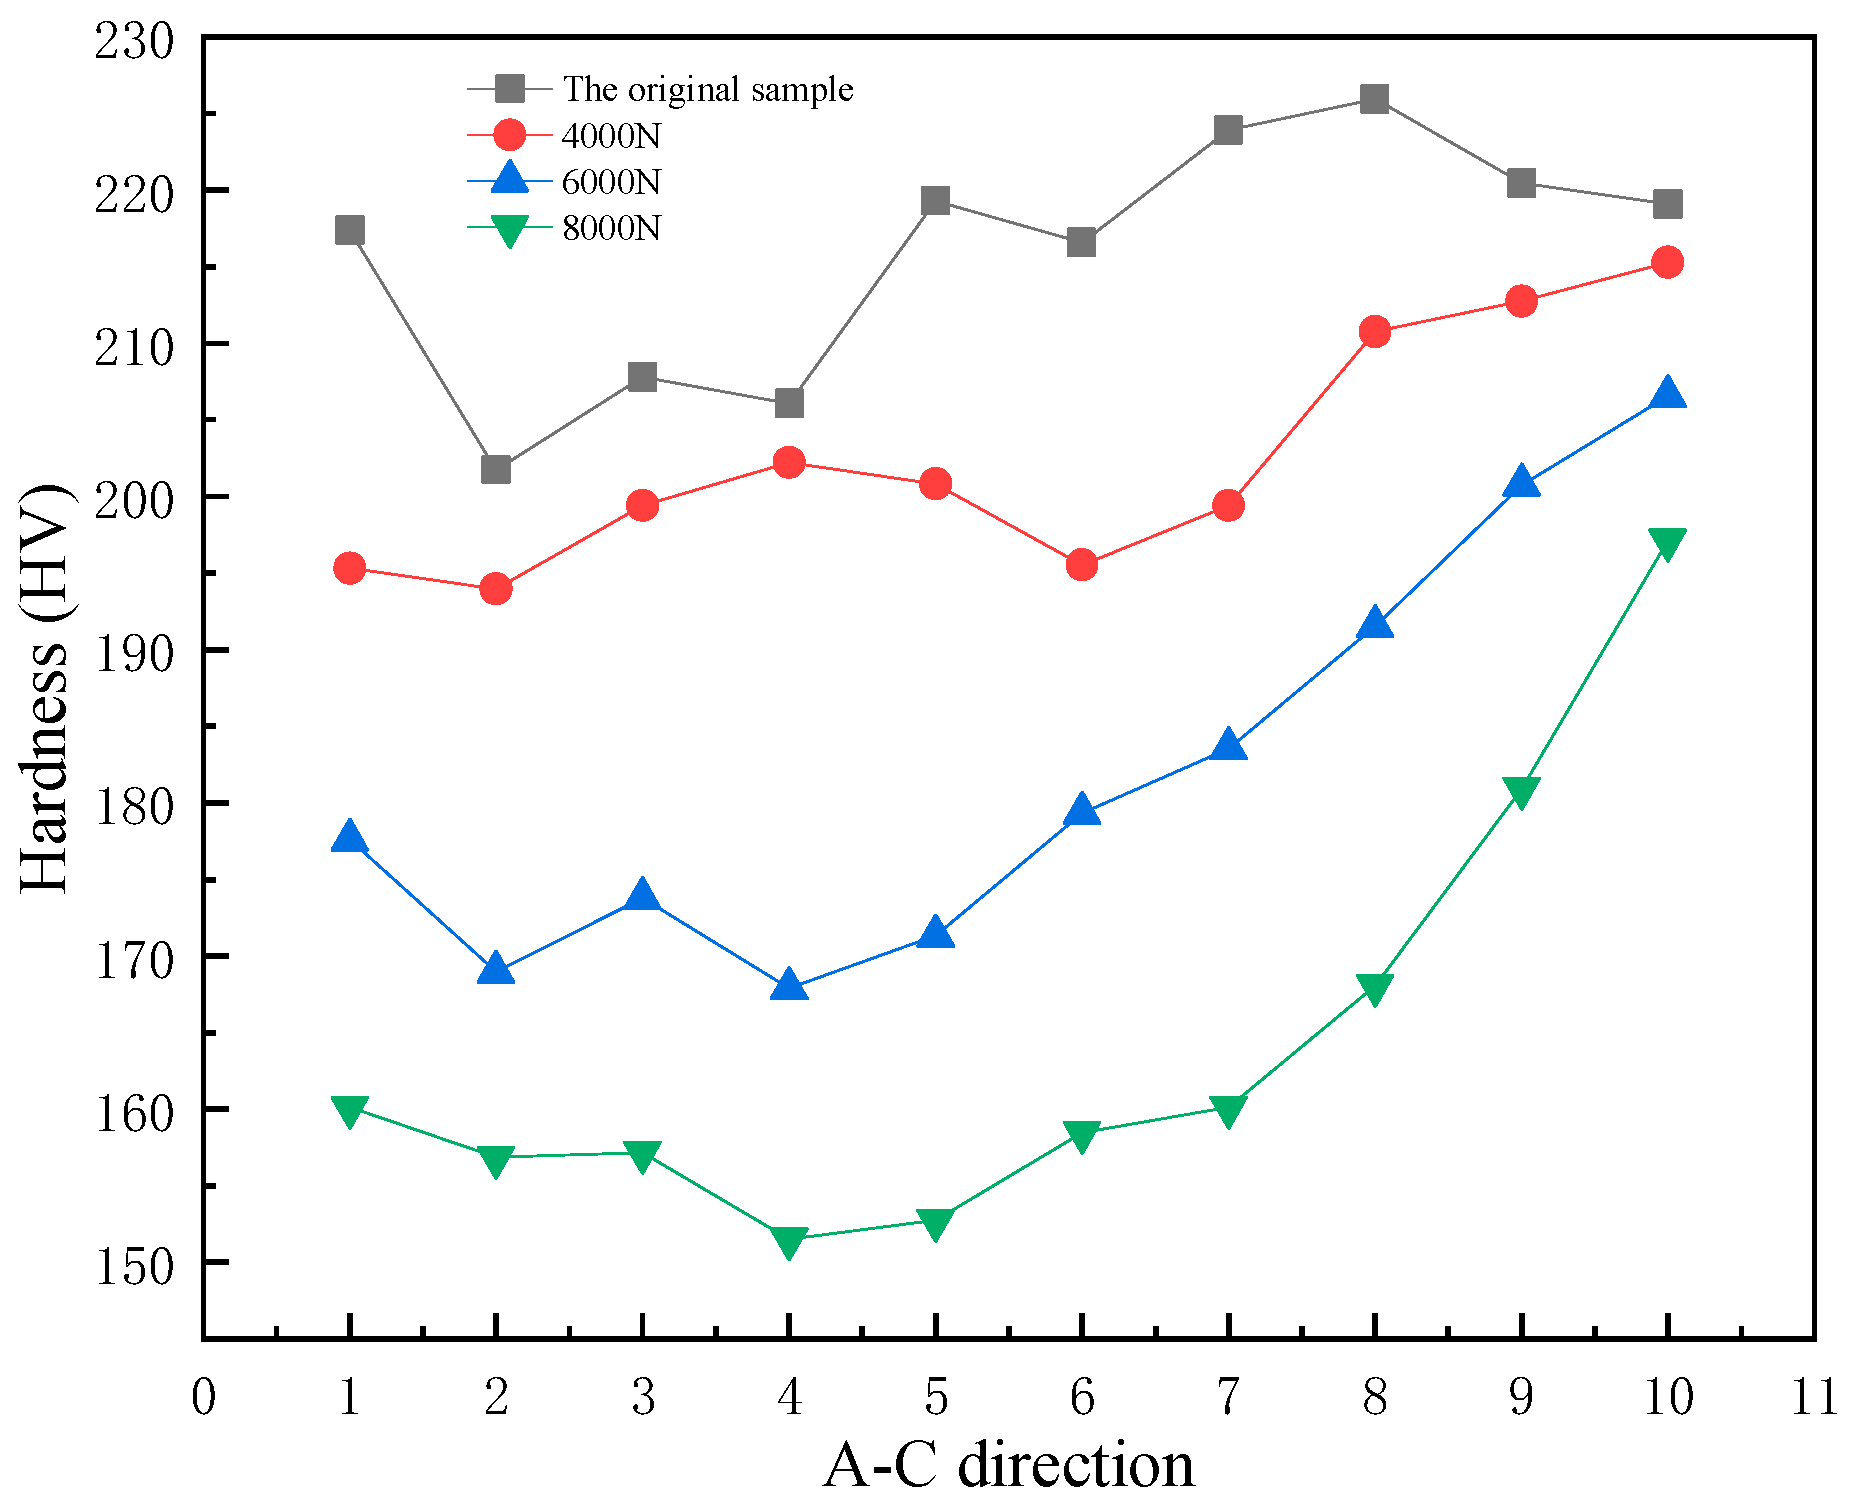
3.6. Hardness
3.7. Wear Mechanism
4. Wear Simulation Analysis
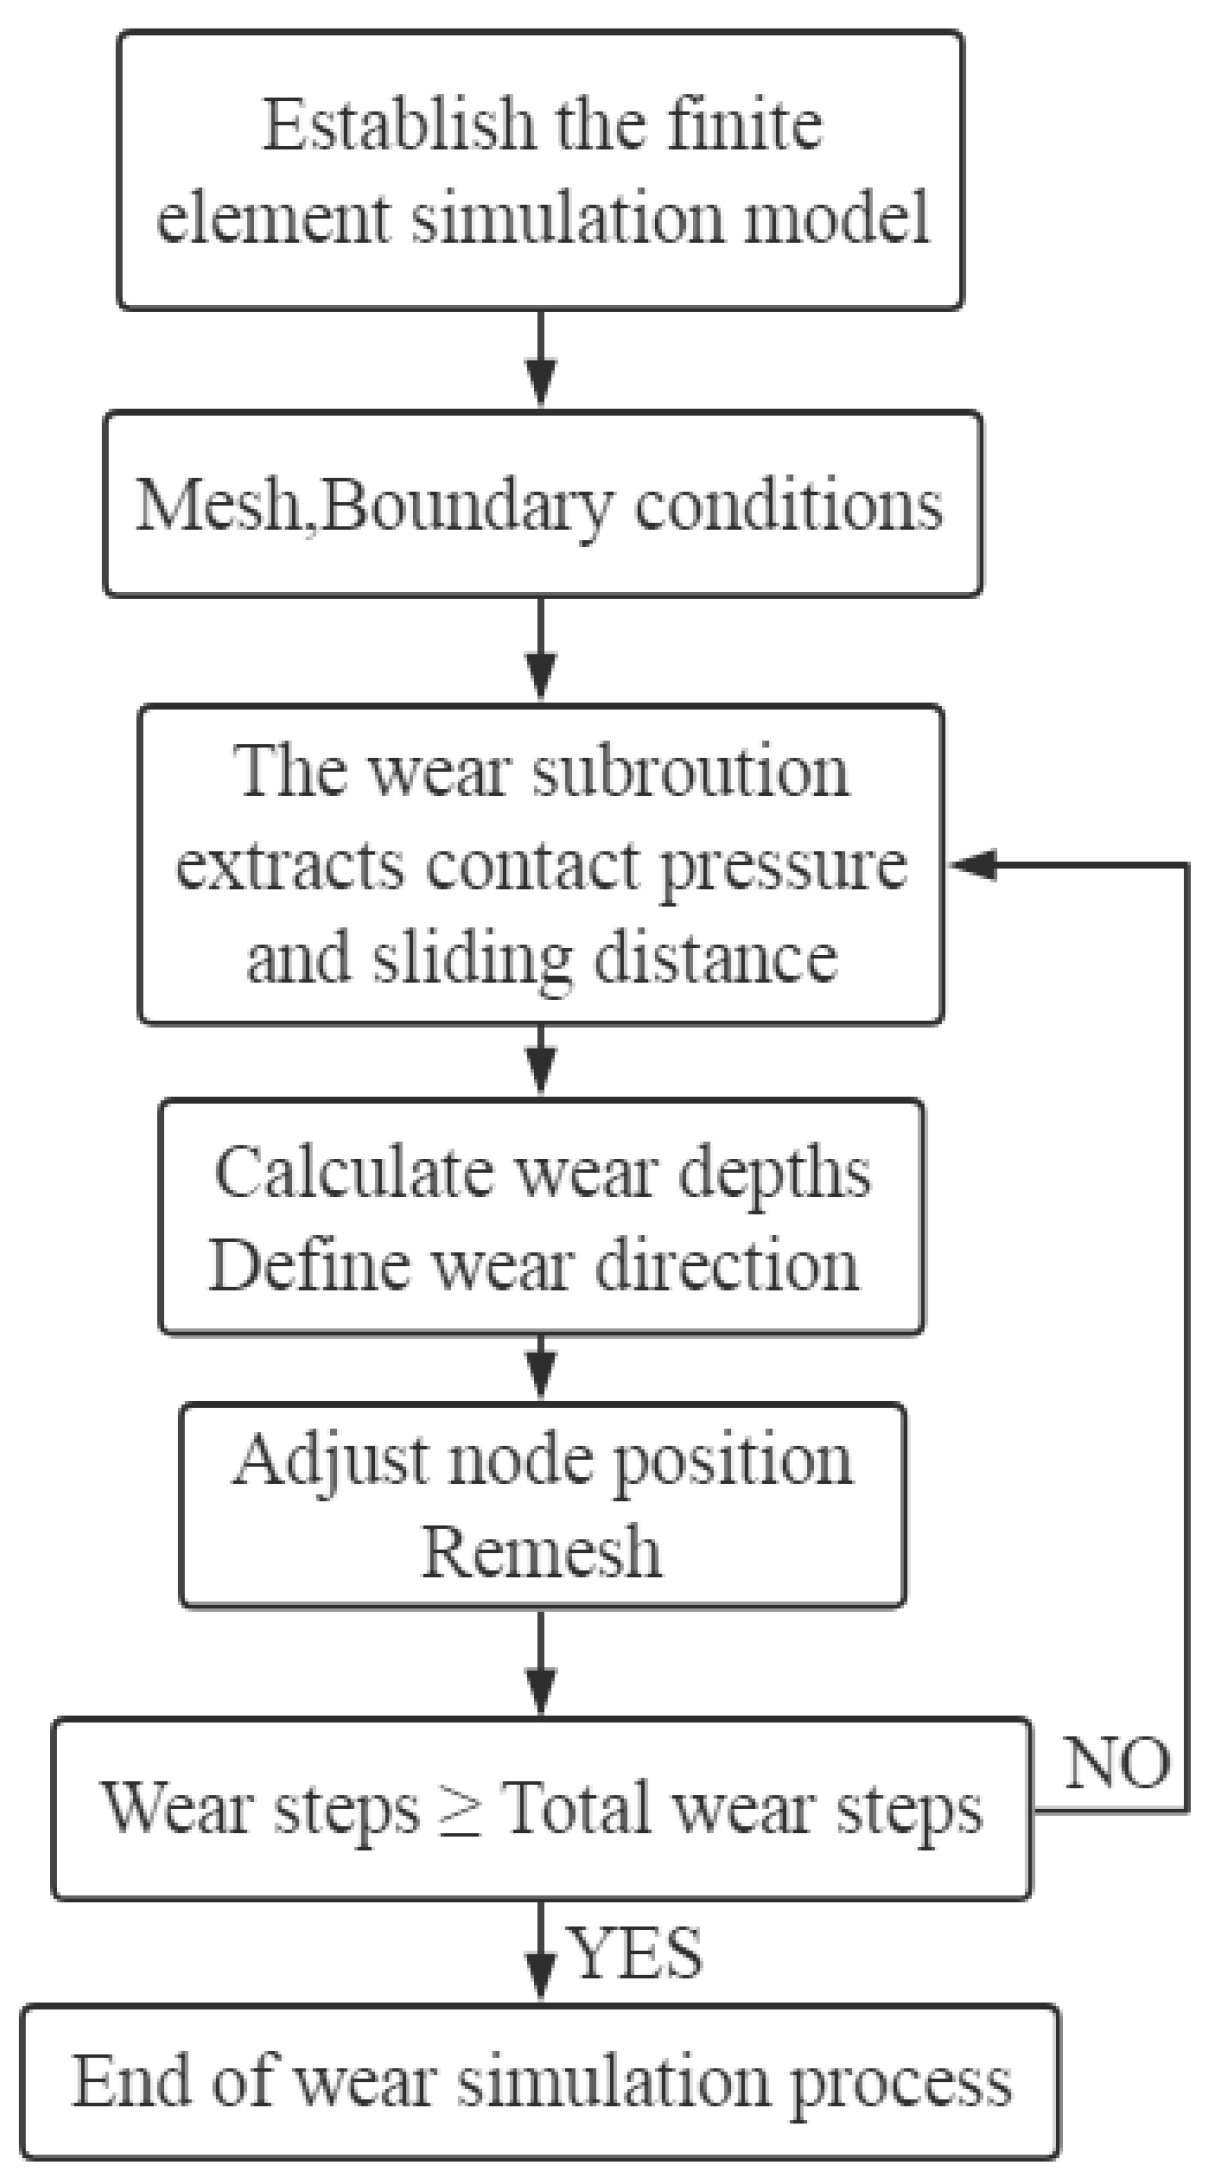
4.1. Theoretical Basis of Wear Simulation
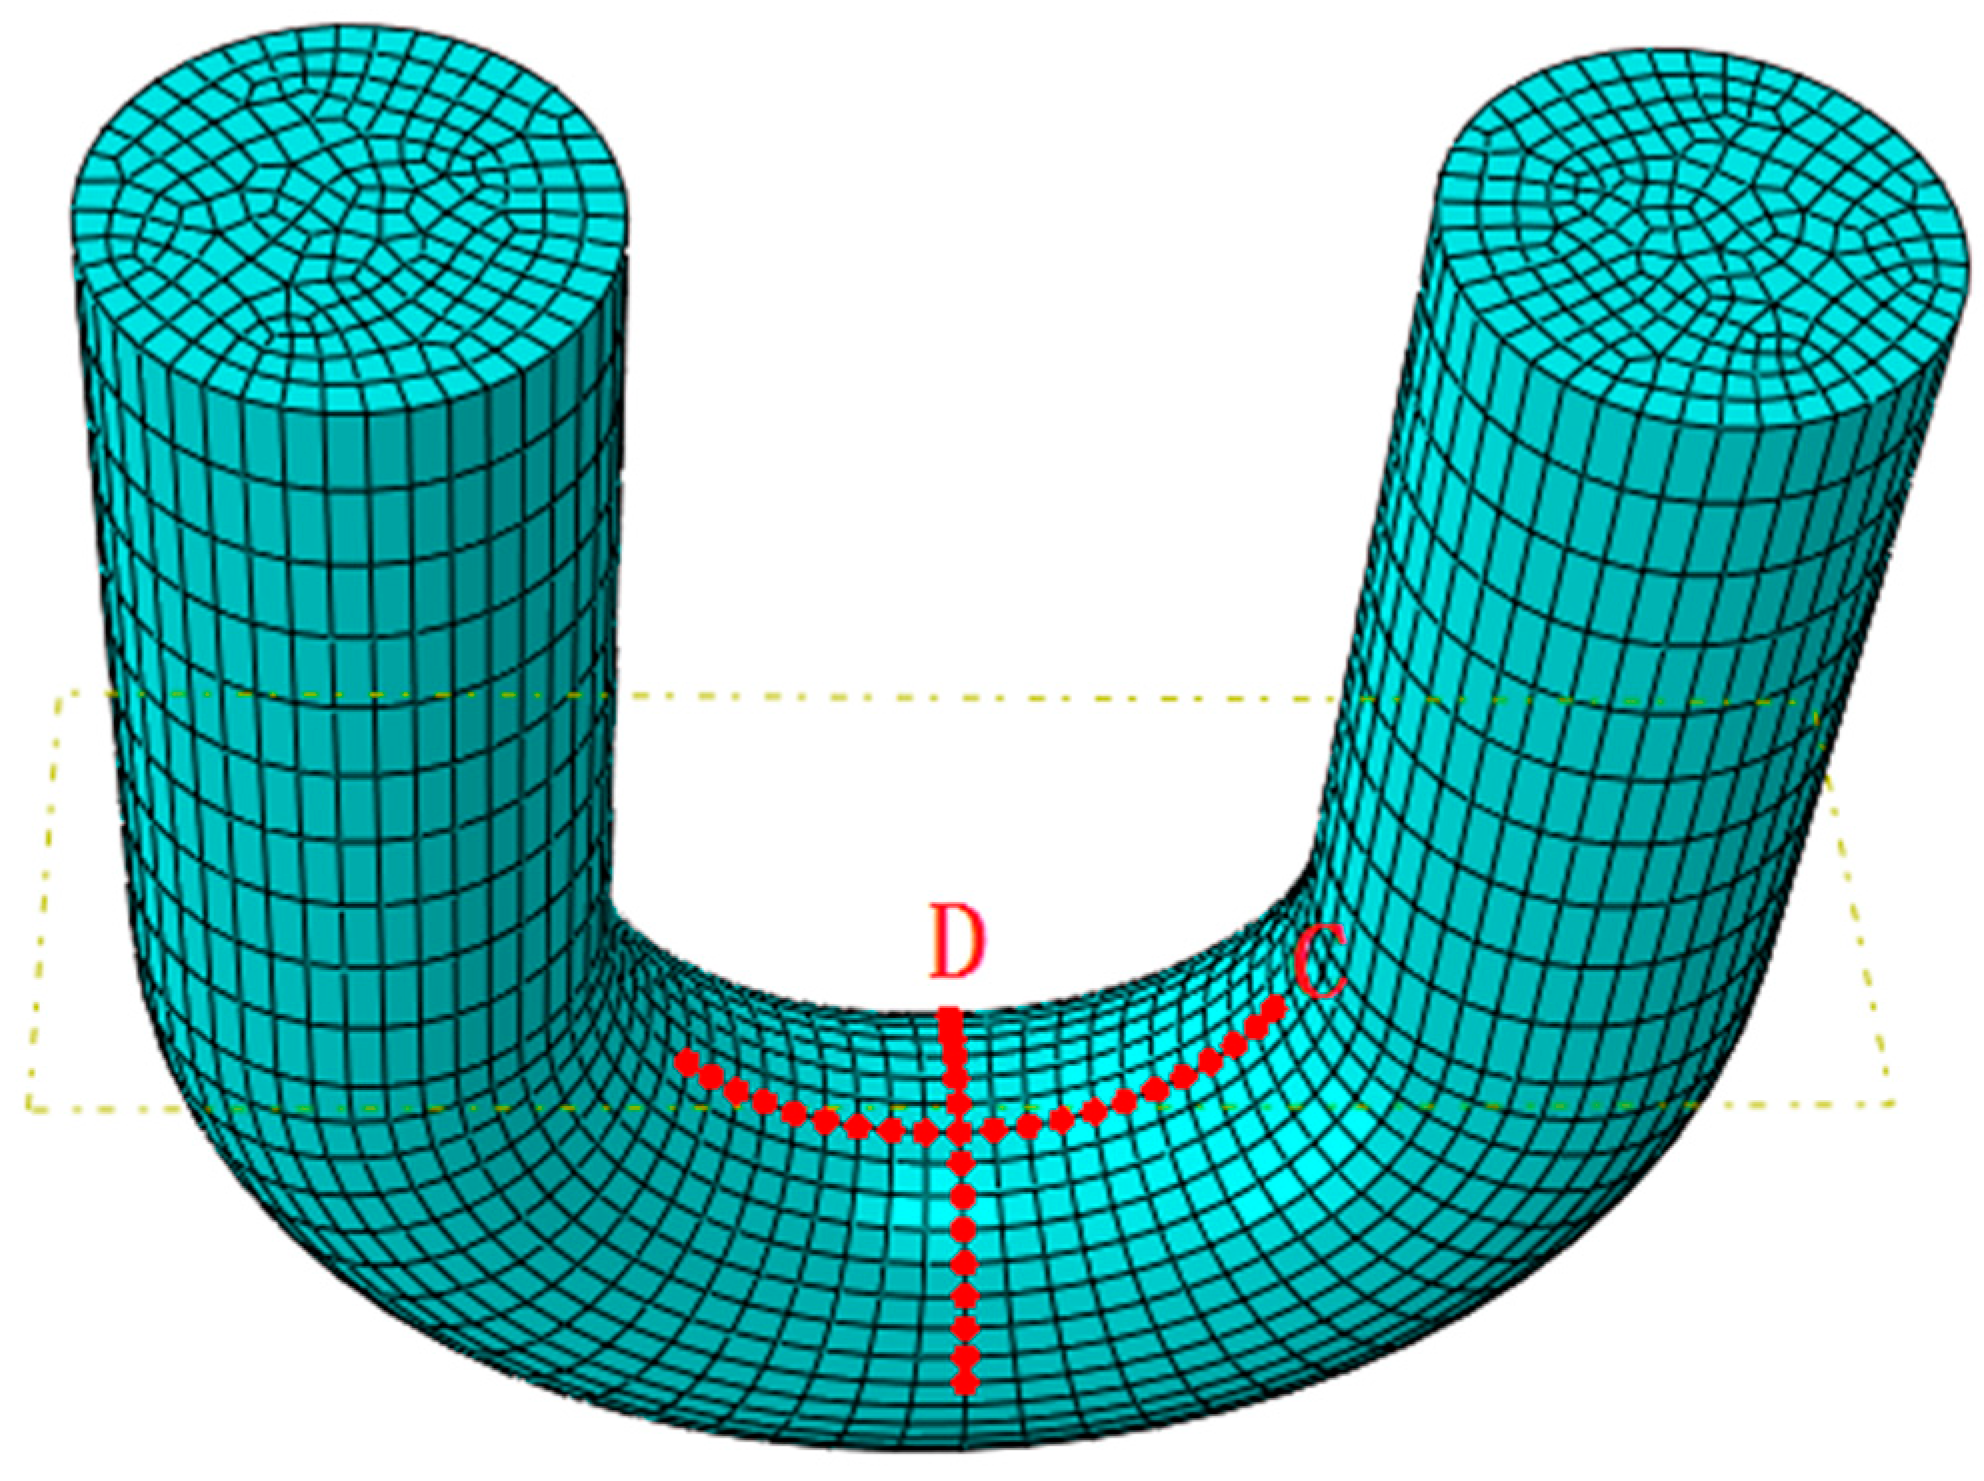
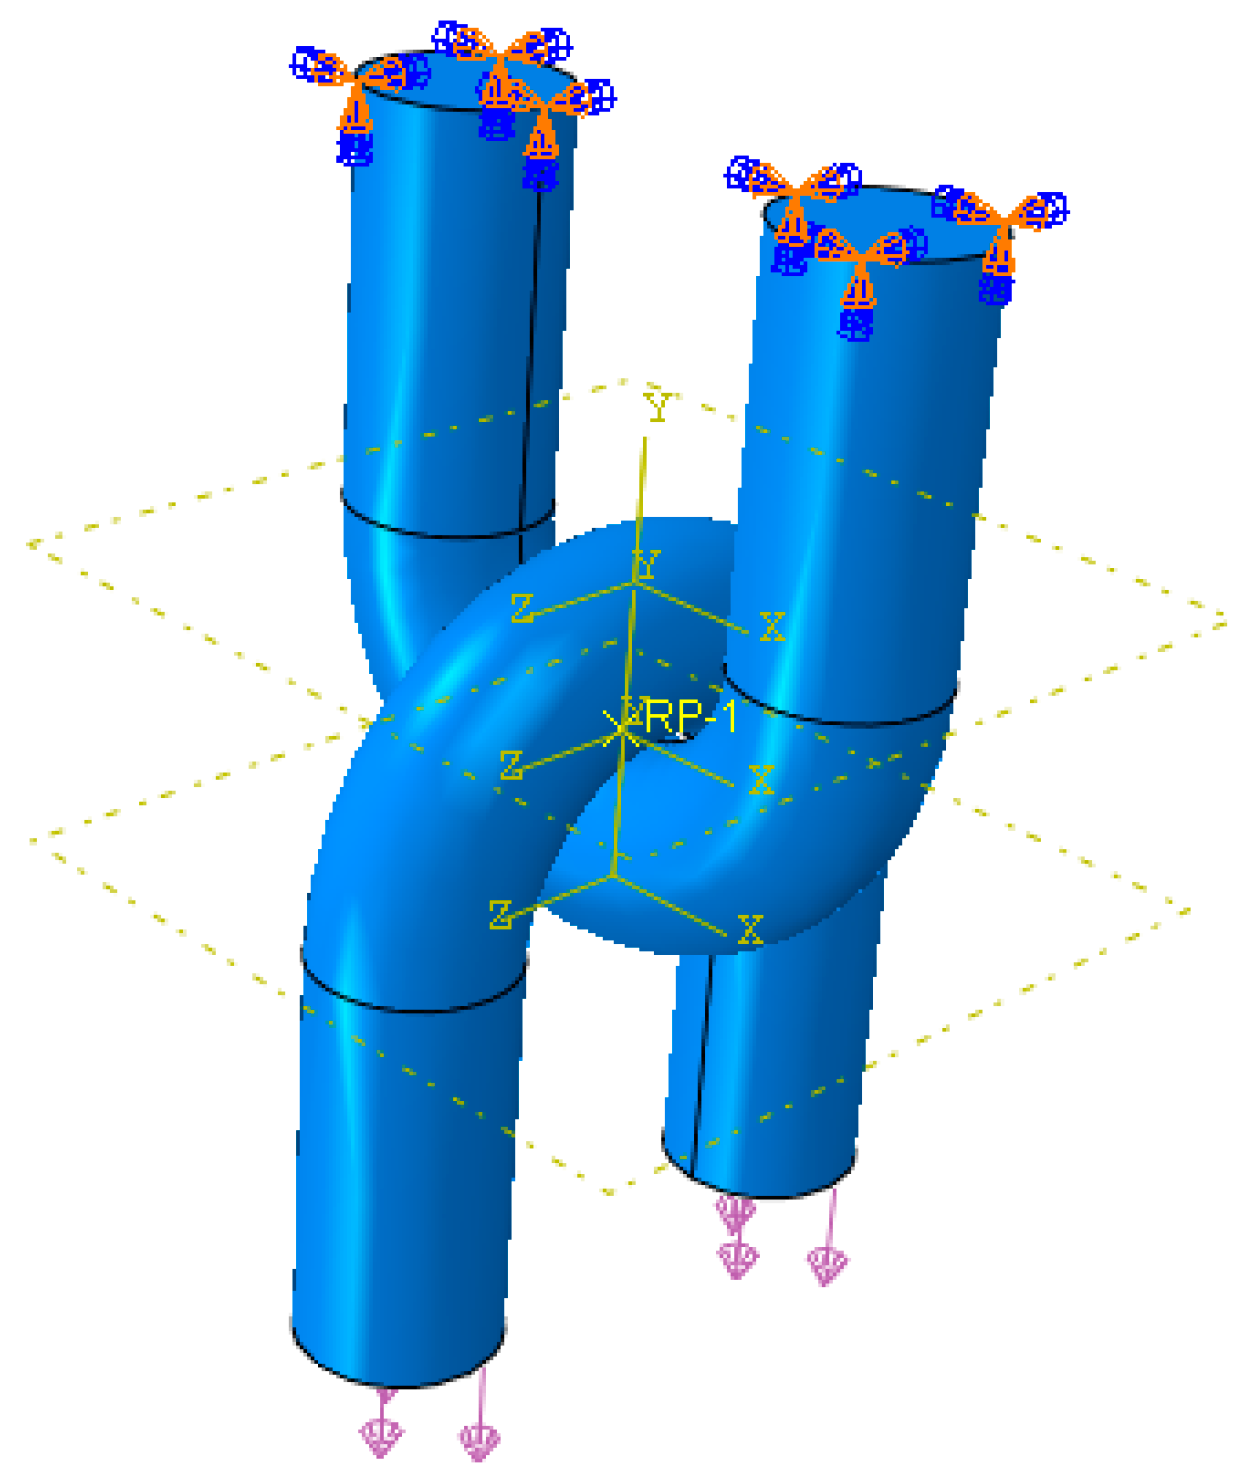
4.2. Wear Model
5. Simulation Results and Analysis
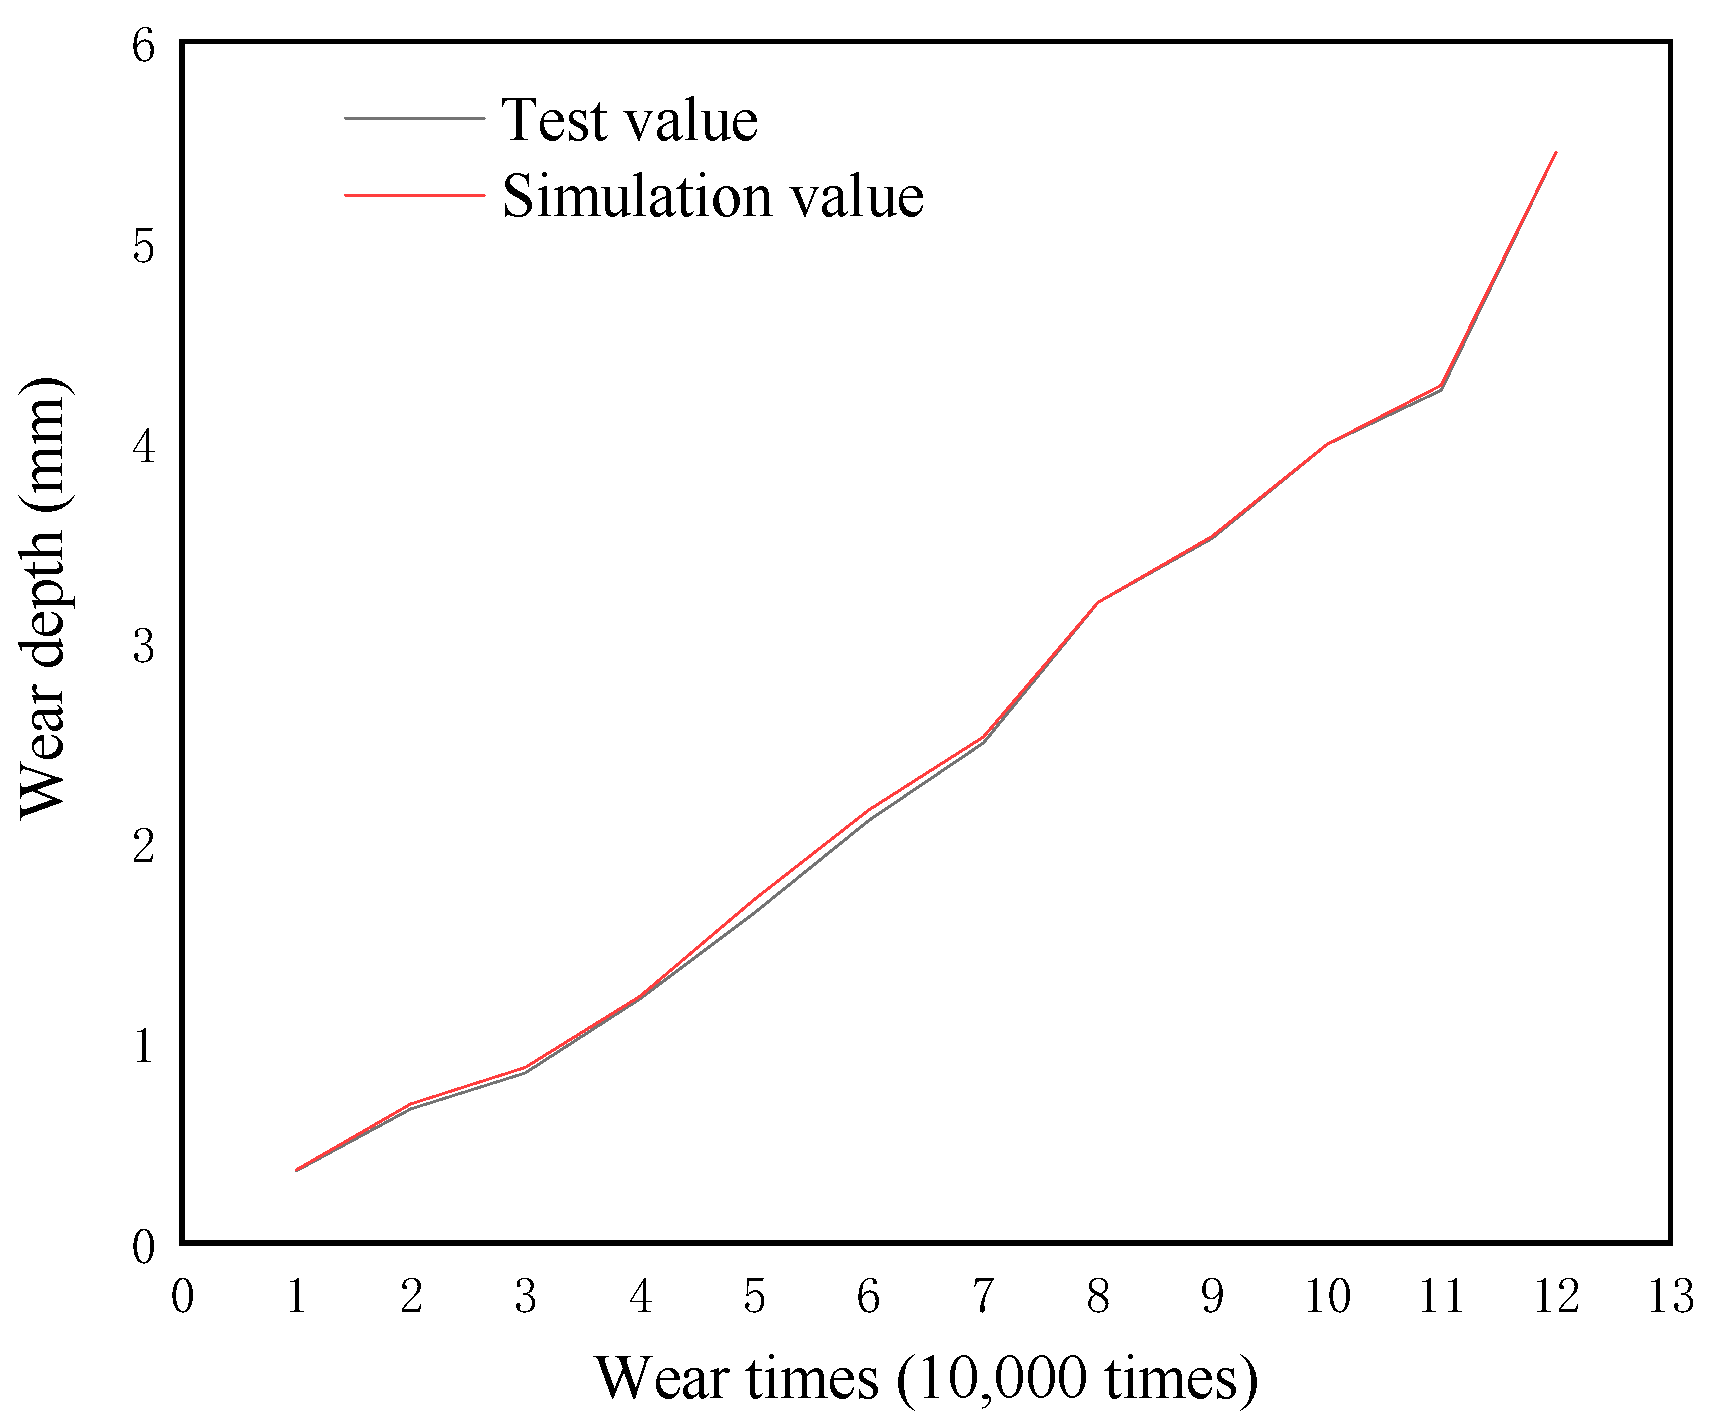
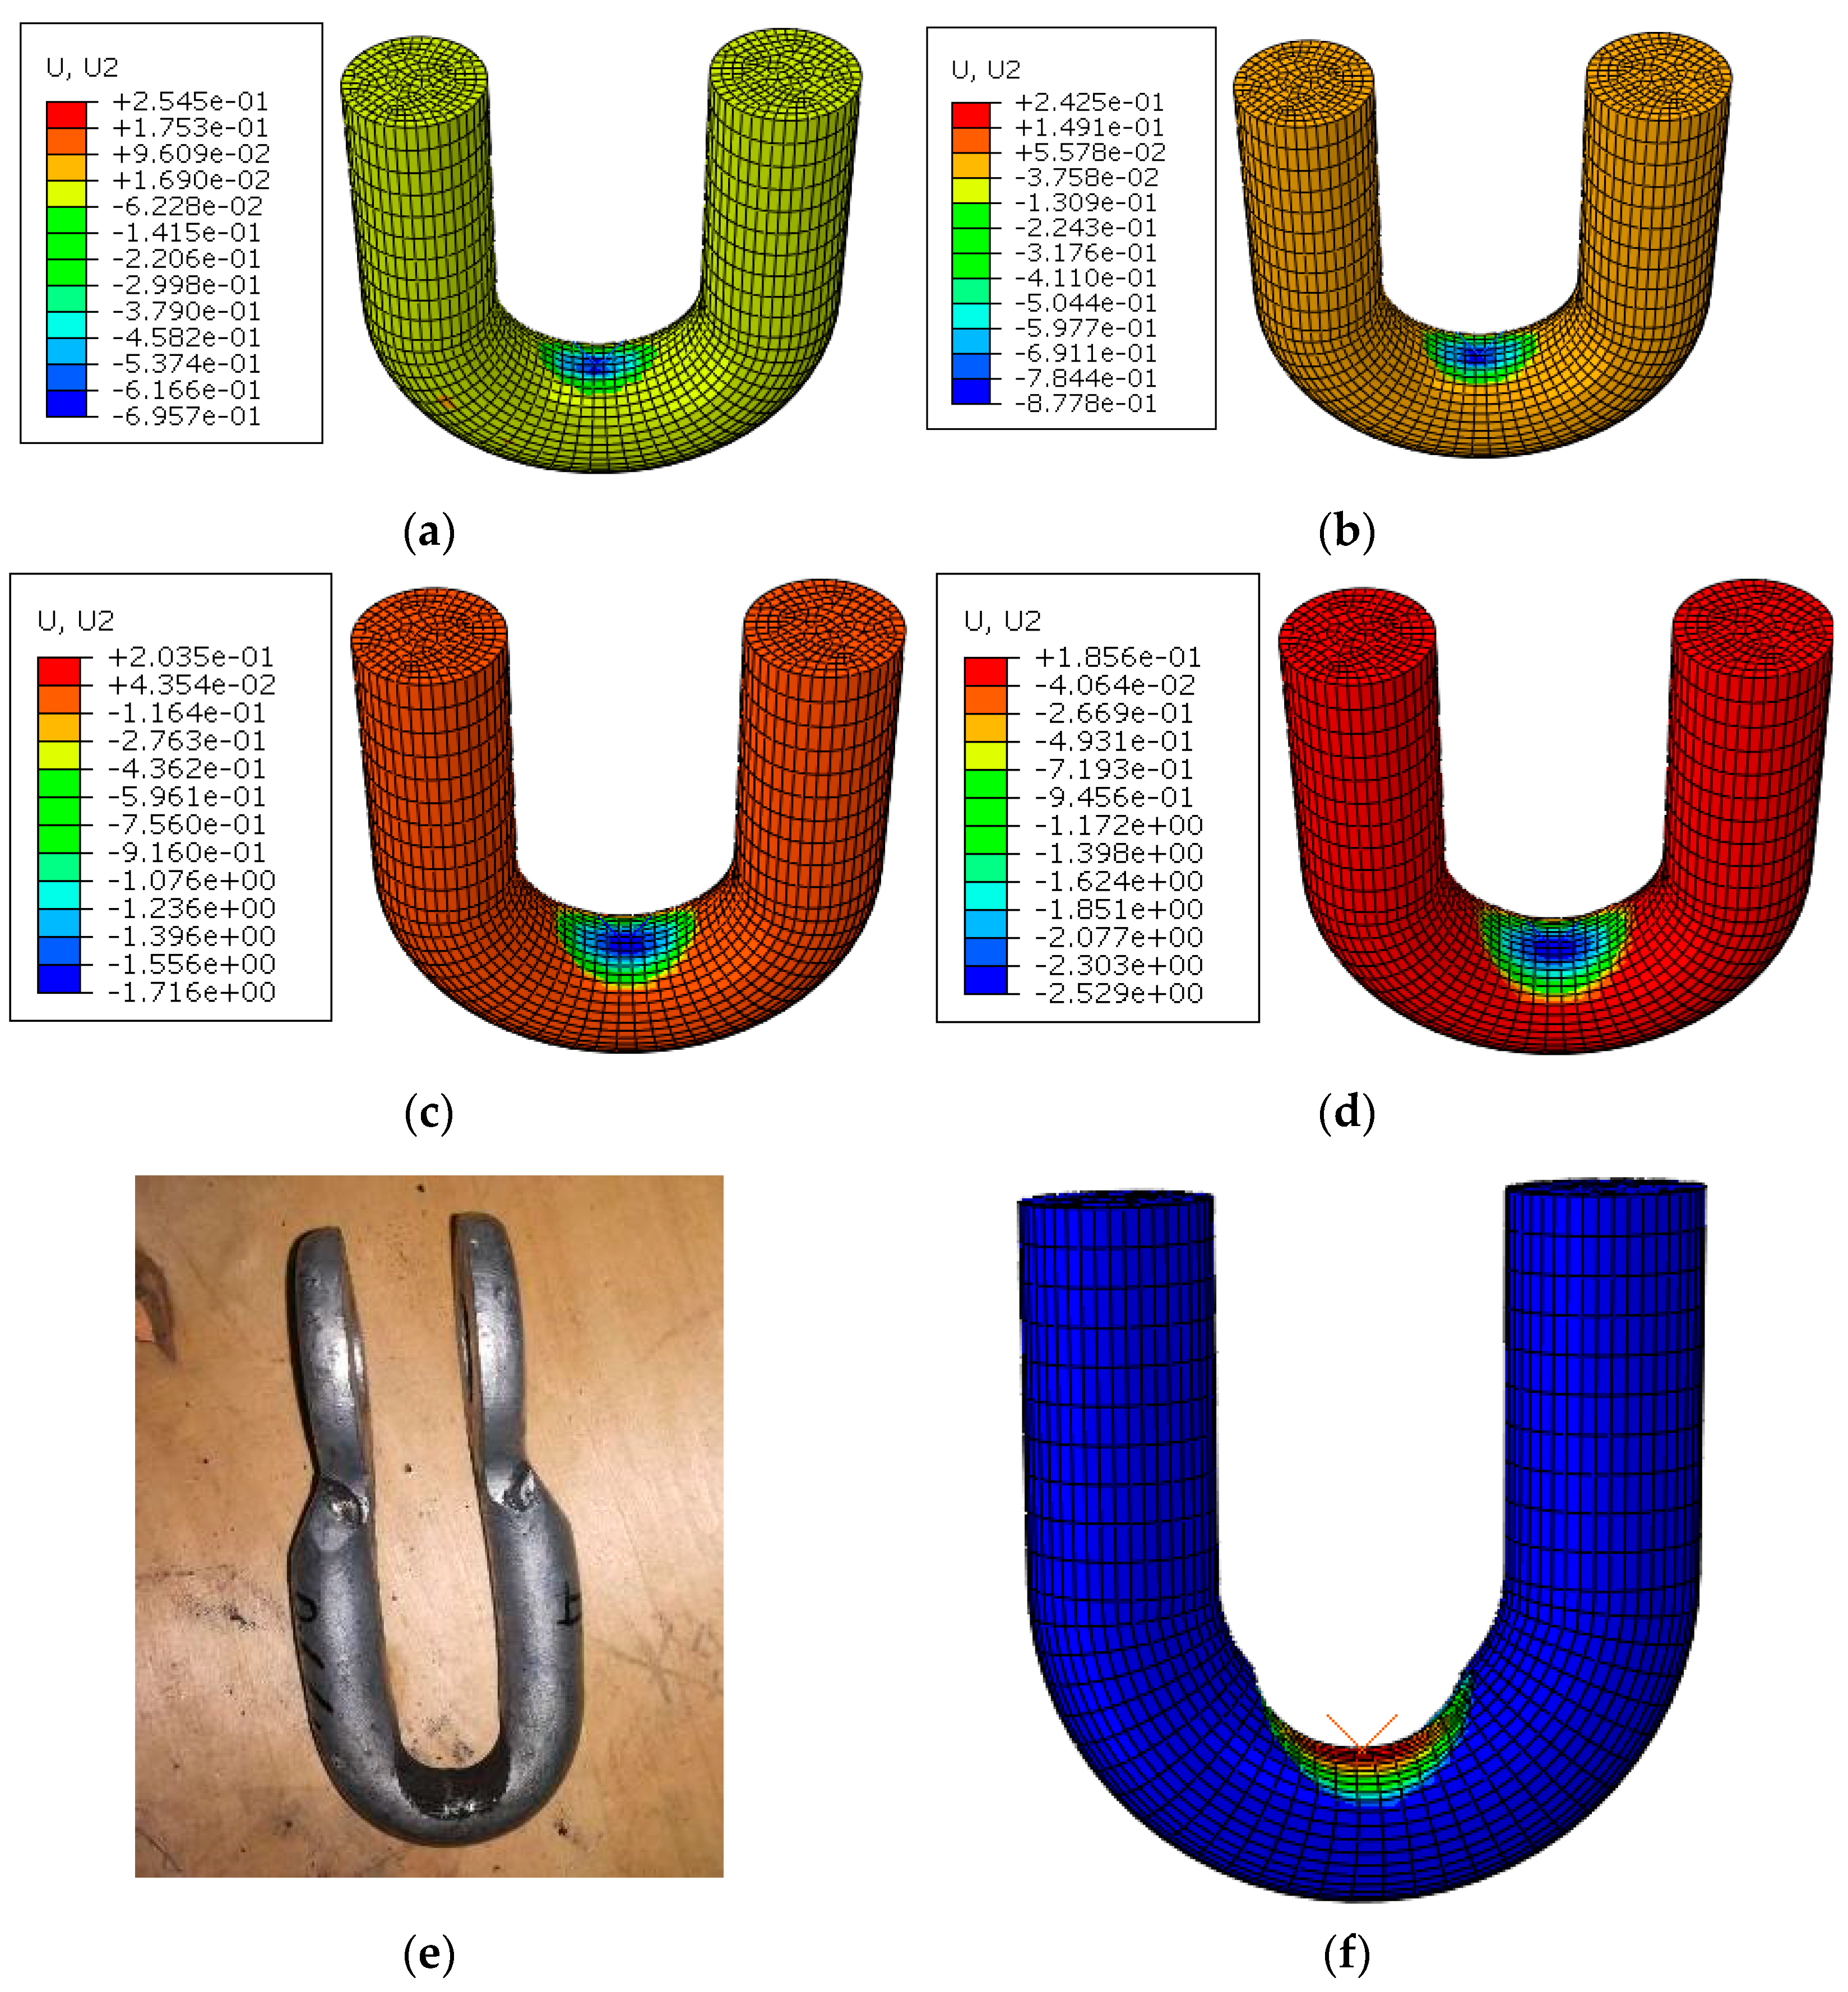
5.1. Wear Depth Simulation
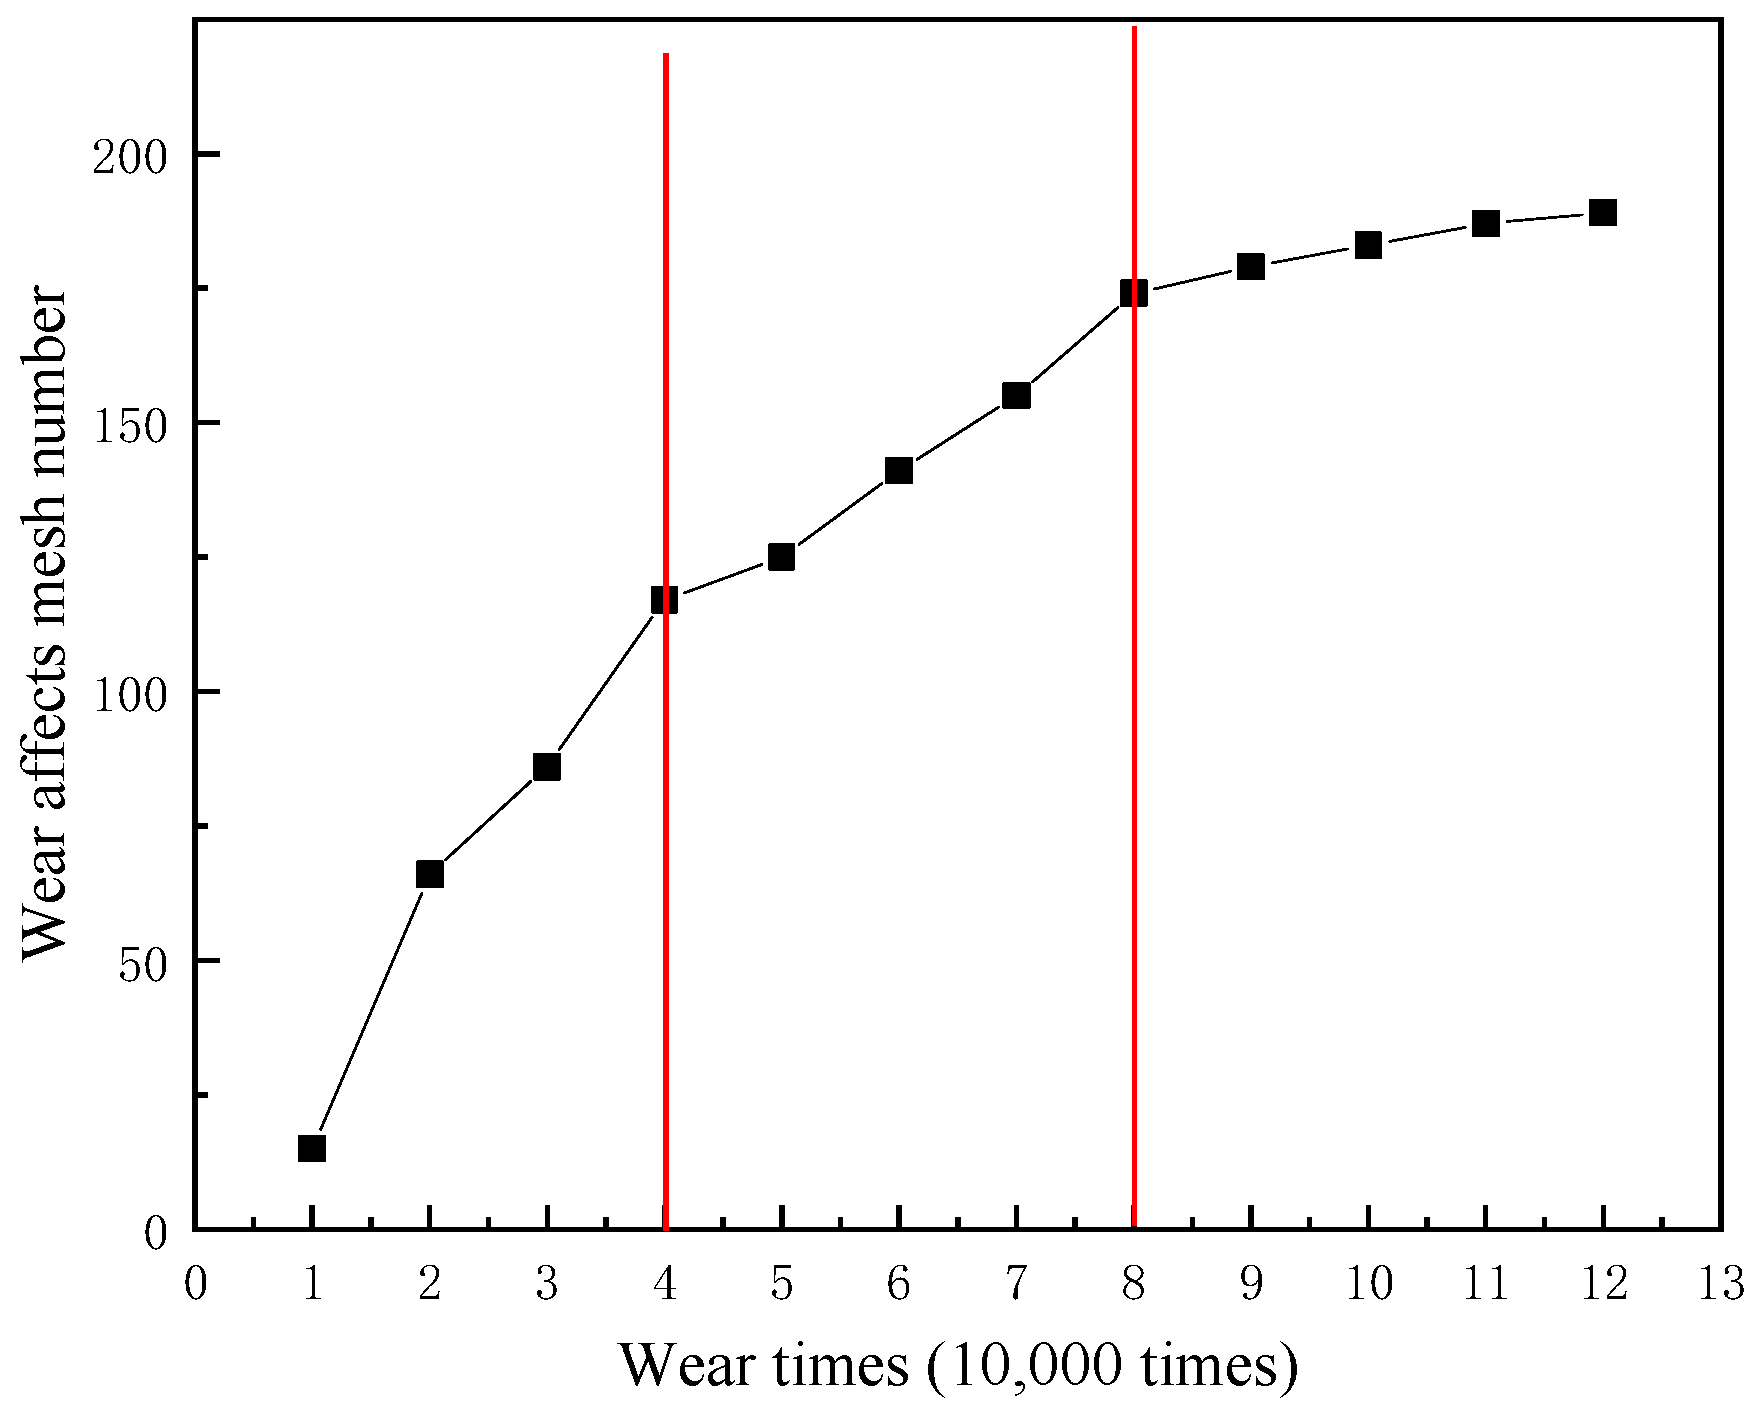
5.2. Wear Affected Area
6. Conclusions
- In strong wind environments, the wear depth of upper and lower U-shaped rings increases gradually with the increase of wear times, and the wear depth of the upper U-shaped ring is more serious than that of the lower U-shaped ring. There are two ways of increasing wear rate, the wear rate fluctuations can be divided into three stages under different wear loads, II Wear rate > IIIWear rate > IWear rate.
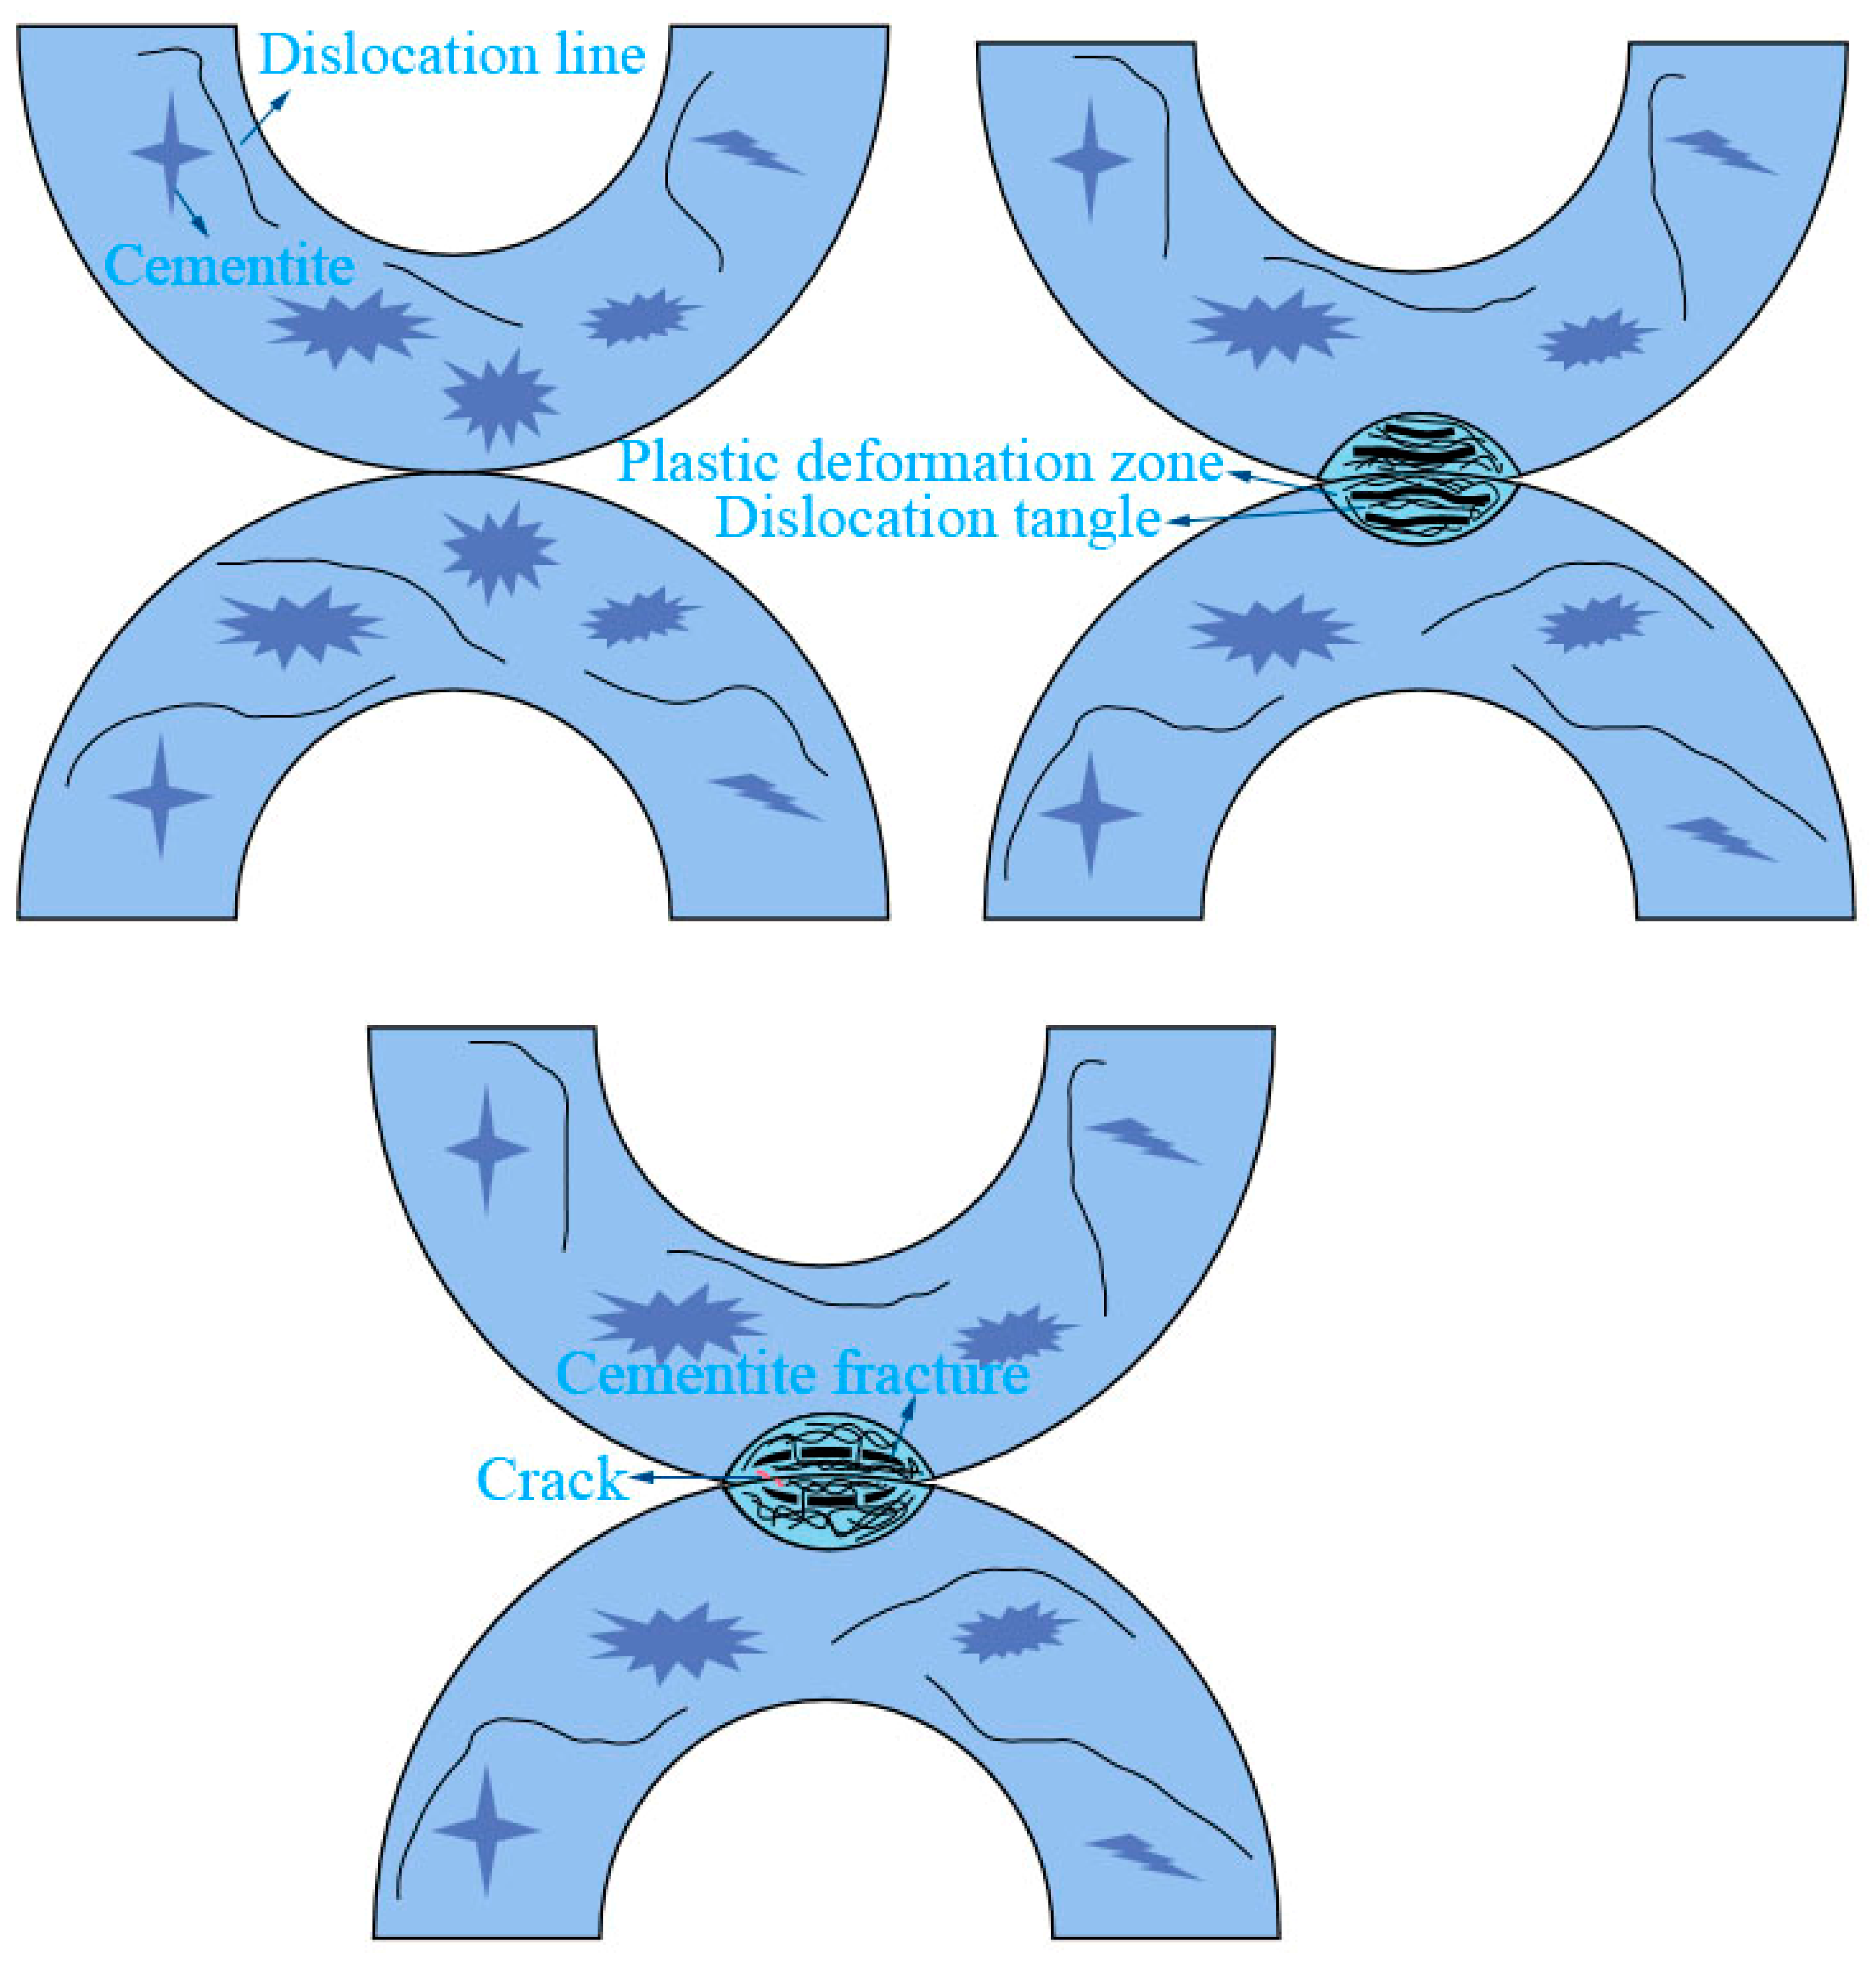
- The wear mechanism transforms from adhesive wear, slight abrasive wear, and slight oxidation wear, to serious adhesive wear, abrasive wear, and oxidation wear with the increase of wear load. Meanwhile, with the increase of wear load, the surface damage is aggravated, the hardness of the wear edge decreases, and the plastic deformation area increases. In the plastic deformation area, dislocation plugging occurs at the ferrite phase interface, and cementite fracture occurs.
- The error between the test value and the simulation value of the wear depth was 1.56%, which proves the reliability of the established wear failure prediction model for power connection fittings.
Author Contributions
Funding
Data Availability Statement
Conflicts of Interest
References
- Huang, Y.D. Study on the Planning and Some Problems of Xinjiang 750 kV Ultra High-Voltage Power Grid. Master’s Thesis, North China Electric Power University, Beijing, China, 2015. [Google Scholar]
- Zhang, W.B.; Zhang, H.; Wang, J. Temporal and spstial analysis of terrain and wind characteristics along 750 kV UHV transmission line in xinjiang. High Volt Appar. 2019, 55, 190−196. [Google Scholar]
- Li, Q. Analysis and calculation of design wind speed for 750 kV transmission line from urumqi to hami. Electric. Powr. Surv. Des. 2013, 4, 17−30. [Google Scholar]
- Shao, J.N.; Wei, C.; Wang, Y. Analysis and study of transmission line windproof measures in xinjiang strong wind area. J. Henan Inst. Eng. 2016, 28, 45−48. [Google Scholar]
- Liu, G.C. Research of the Wear Performance of the UHV Transmission Lines U-Rings and Adjusting Rings. Master’s Thesis, North China Electric Power University, Beijing, China, 2016. [Google Scholar]
- Yang, X.C. Research of Transmission Line Electric Power Fittings Wear in Xinjiang Wind Region. Master’s Thesis, Xinjiang University, Urumqi, China, 2017. [Google Scholar]
- Deng, H.M.; Cai, W.; Zhang, W. Sand erosion simulation experiments on link hardware of transmission lines: Mechanical property and microanalysis. High Volt Eng. 2018, 44, 3920−3928. [Google Scholar]
- Chen, J. Numerical Simulation Research on Surface Wear Behavior of H13 Steel and Prediction of the Mould Life. Master’s Thesis, Jilin University, Changchun, China, 2015. [Google Scholar]
- Mohd Tobi, A.L.; Ding, J.; Bandak, G. A study on the interaction between fretting wear and cyclic plasticity for Ti-6Al-4V. Wear 2009, 267, 270−282. [Google Scholar] [CrossRef]
- Kanavalli, B. Application of User Defined Subroutine UMESHMOTION in ABAQUS for Simulatinf Dry Rolling/Sliding Wear. Ph.D. Thesis, Royal Institute of Technology, Stockholm, Sweden, 2006. [Google Scholar]
- Rajesh, A.M.; Doddamani, S.; Mohamed, K. Dry sliding wear simulation of hybrid aluminum metal matrix composites. Adv. Compos. Hybrid. Mater. 2020, 3, 120−126. [Google Scholar] [CrossRef]
- Arnaud, P.; Fouvry, S.; Garcin, S. A numerical simulation of fretting wear profile taking account of the evolution of third body layer. Wear 2017, 376, 1475–1488. [Google Scholar] [CrossRef]
- Liu, N. Multiscale Modeling of Surface Ablation on Carbon/Carbon Composites. Master’s Thesis, Beijing University of Technology, Beijing, China, 2014. [Google Scholar]
- Wang, X.X.; Yang, X.C.; Li, X.M. Wear prediction of power line U-shaped in xinjiang wind region. Foundry Tech. 2017, 38, 1624−1627. [Google Scholar]
- Lu, P.P. Research on Wear Behaviors of Transimission Lines Power Fittings under Strong Wind Environment. Master’s Thesis, Xinjiang University, Urumqi, China, 2019. [Google Scholar]
- Ding, H.H.; Fu, M.K.; Guo, H.M. Rolling wear and damage behaviors between three kinds of rail materials and wheel material. Tribology 2014, 34, 233–239. [Google Scholar]
- He, C.G. Study on Tribo-Fatigue Damage Mechanism and Microstructure Evolution Behaviors of Wheel Materials. Ph.D. Thesis, Southwest Jiaotong University, Chongqing, China, 2018. [Google Scholar]
- Zhan, W.; Yan, A.S.; Ding, C.X. Analysis on the principle of metal friction and abrade wear. J. Tianjin Univ. Tech. 2001, s1, 19–22. [Google Scholar]
- He, C.G.; Guo, J.; Liu, Q.Y.; Wang, W.J. Experimental investigation on the effect of operating speeds on wear and rolling contact fatigue damage of wheel materials. Wear 2016, 364, 257–269. [Google Scholar] [CrossRef]
- Archard, J.F. Contact and rubbing of flat surfaces. J. Appl. Phys. 1953, 24, 981−988. [Google Scholar] [CrossRef]
- Soderberg, A.; Andersson, S. Simulation of wear and contact pressure distribution at the Pad-to-Rotor interface in a Disc-Brake using general purpose finite element analysis software. Wear 2009, 267, 2243−2251. [Google Scholar] [CrossRef]
- Huo, Y.J. Spherical Plain Bearing Friction and Wear Simulation and Experimental Analysis. Master’s Thesis, Shanghai Jiaotong University, Shanghai, China, 2015. [Google Scholar]
- Hibbitte, K. Abaqus User Subroutine Reference Manual; Simulia, Dassault Systèmes: Hksinc, Taiwan, 2005. [Google Scholar]
- Hibbitt, D.; Karlsson, B.; Sorensen, P. Abaqus Analysis User’s Manual; Simulia, Dassault Systèmes: Pawtucket, RI, USA, 2004. [Google Scholar]
- Xu, S.K. Analysis of Tire Tread Wear Behavior Based on Update Geometry Method. Master’s Thesis, South China University of Technology, Guangzhou, China, 2018. [Google Scholar]


| Chemical Composition | ||||
|---|---|---|---|---|
| Fe | C | Mn | Si | S |
| 99.30 | 0.16 | 0.30 | 0.20 | 0.04 |
| Project | Ground Wire | Optical Cable |
|---|---|---|
| Total horizontal load of wire/N | 6931 | 7731 |
| Total vertical load of wire/N | 4786 | 5275 |
| Comprehensive wire load/N | 8423 | 9359 |
| Safety factor of hanging wire fittings | 14 | 13 |
| Wind deflection (gale) degrees | 55.33 | 55.68 |
| WearLoad | Wear Times | |||||||
| 0 time | 40,000 times | 80,000 times | 120,000 times | |||||
| upper/mm | lower/mm | upper/mm | lower/mm | upper/mm | lower/mm | upper/mm | lower/mm | |
| 4000 N | 20 | 20 | 19.44 | 19.25 | 17.97 | 18.01 | 17.06 | 16.78 |
| 6000 N | 20 | 20 | 18.78 | 18.71 | 16.8 | 17.19 | 14.55 | 15.23 |
| 8000 N | 20 | 20 | 18.45 | 18.67 | 16.07 | 16.53 | 13.73 | 14.73 |
| Area | Fe | O | C | Mn | Si | S |
|---|---|---|---|---|---|---|
| 1 | 79.96 | 12.09 | 7.53 | 0.17 | 0.18 | 0.06 |
| 2 | 69.72 | 21.66 | 7.86 | 0.09 | 0.65 | 0.02 |
| 3 | 62.01 | 33.16 | 4.37 | 0.3 | 0.13 | 0.03 |
| Density/(g/cm3) | Elastic Modulus/MPa | Poisson’s ratio | Yield Strength/MPa |
|---|---|---|---|
| 7.85 | 210,000 | 0.3 | 235 |
| Wear Times (Ten Thousand Times) Wear Loads are 6000 N | The Test Results | Simulation Value |
|---|---|---|
| 0 | 0 | 0 |
| 1 | 0.036 | 0.3675 |
| 2 | 0.57 | 0.6957 |
| 3 | 0.85 | 0.8778 |
| 4 | 1.22 | 1.233 |
| 5 | 1.65 | 1.716 |
| 6 | 2.11 | 2.164 |
| 7 | 2.50 | 2.529 |
| 8 | 3.20 | 3.300 |
| 9 | 3.52 | 3.529 |
| 10 | 3.99 | 3.990 |
| 11 | 4.26 | 4.286 |
| 12 | 5.45 | 5.452 |
Publisher’s Note: MDPI stays neutral with regard to jurisdictional claims in published maps and institutional affiliations. |
© 2021 by the authors. Licensee MDPI, Basel, Switzerland. This article is an open access article distributed under the terms and conditions of the Creative Commons Attribution (CC BY) license (http://creativecommons.org/licenses/by/4.0/).
Share and Cite
Wang, S.; Yang, X.; Li, X.; Chai, C.; Wang, G.; Wang, X. Simulation and Experimental Study on Wear of U-Shaped Rings of Power Connection Fittings under Strong Wind Environment. Materials 2021, 14, 735. https://doi.org/10.3390/ma14040735
Wang S, Yang X, Li X, Chai C, Wang G, Wang X. Simulation and Experimental Study on Wear of U-Shaped Rings of Power Connection Fittings under Strong Wind Environment. Materials. 2021; 14(4):735. https://doi.org/10.3390/ma14040735
Chicago/Turabian StyleWang, Songchen, Xianchen Yang, Xinmei Li, Cheng Chai, Gen Wang, and Xiaohui Wang. 2021. "Simulation and Experimental Study on Wear of U-Shaped Rings of Power Connection Fittings under Strong Wind Environment" Materials 14, no. 4: 735. https://doi.org/10.3390/ma14040735
APA StyleWang, S., Yang, X., Li, X., Chai, C., Wang, G., & Wang, X. (2021). Simulation and Experimental Study on Wear of U-Shaped Rings of Power Connection Fittings under Strong Wind Environment. Materials, 14(4), 735. https://doi.org/10.3390/ma14040735