
Experimental Study of Hardened Young’s Modulus for 3D Printed Mortar

 ,
,  , , and
Abstract
:1. Introduction
2. Materials and Methods
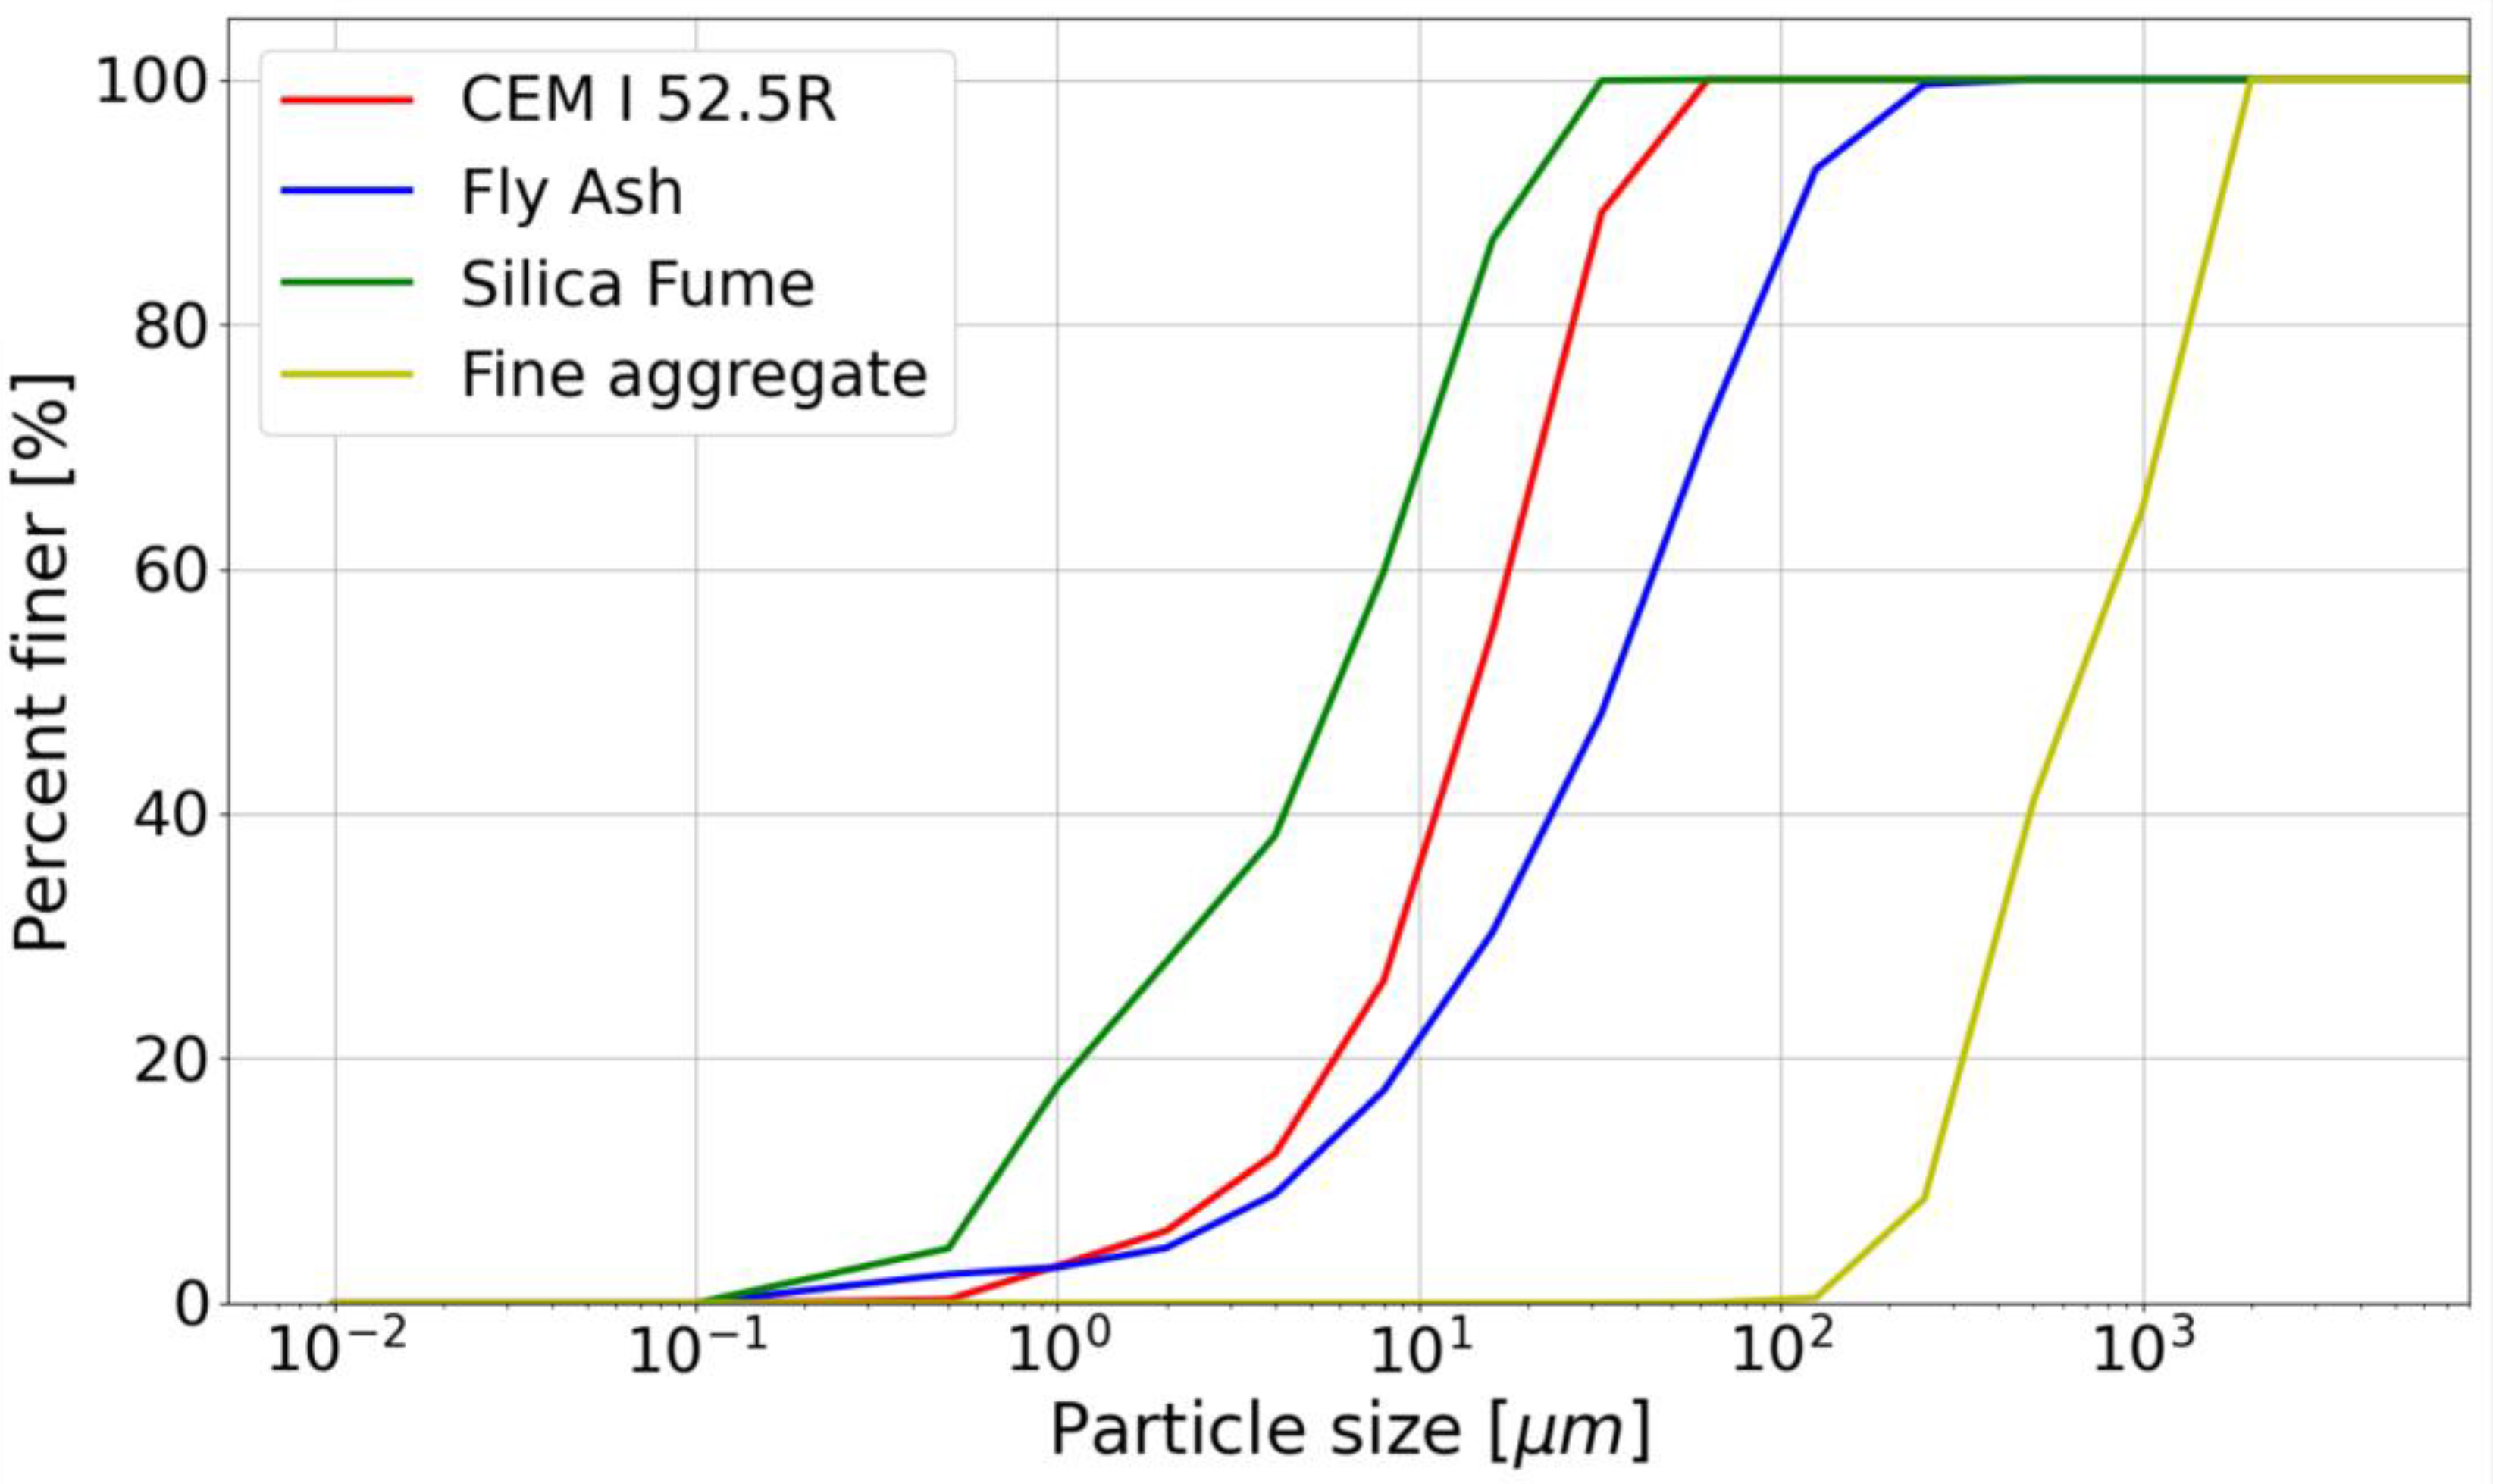
2.1. Materials
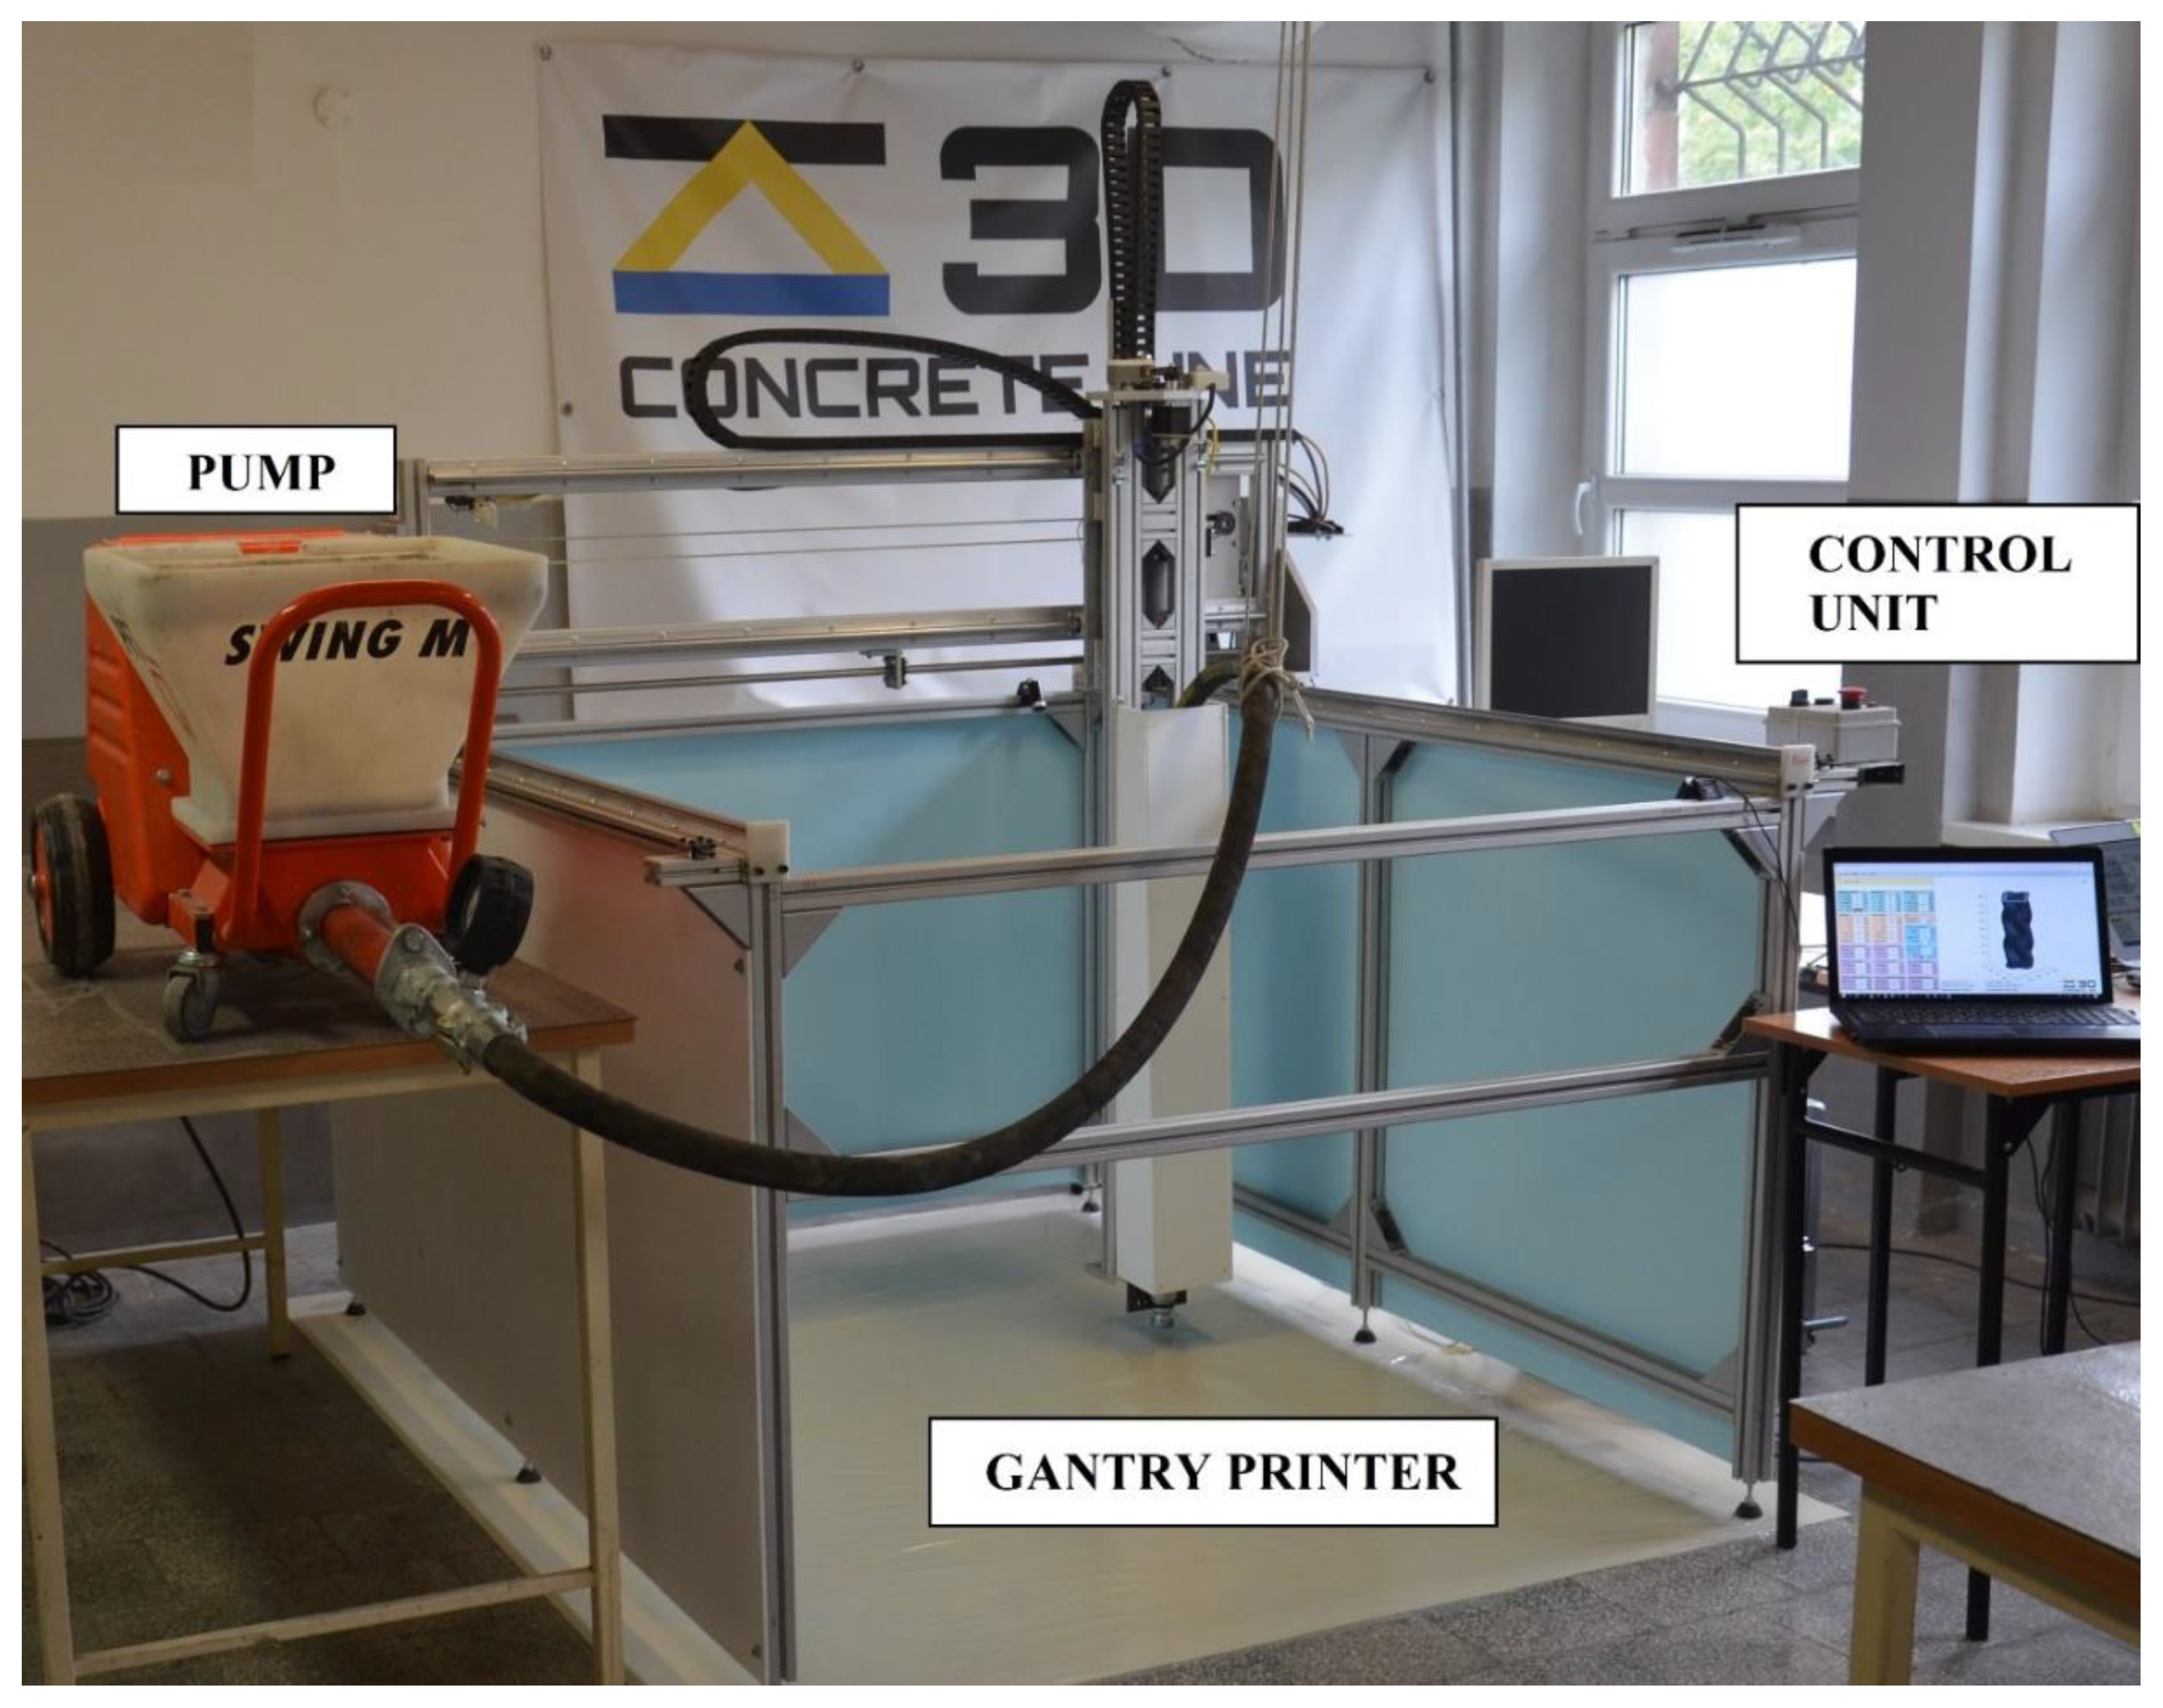
2.2. Experimental Procedure
2.2.1. Mixing Procedure
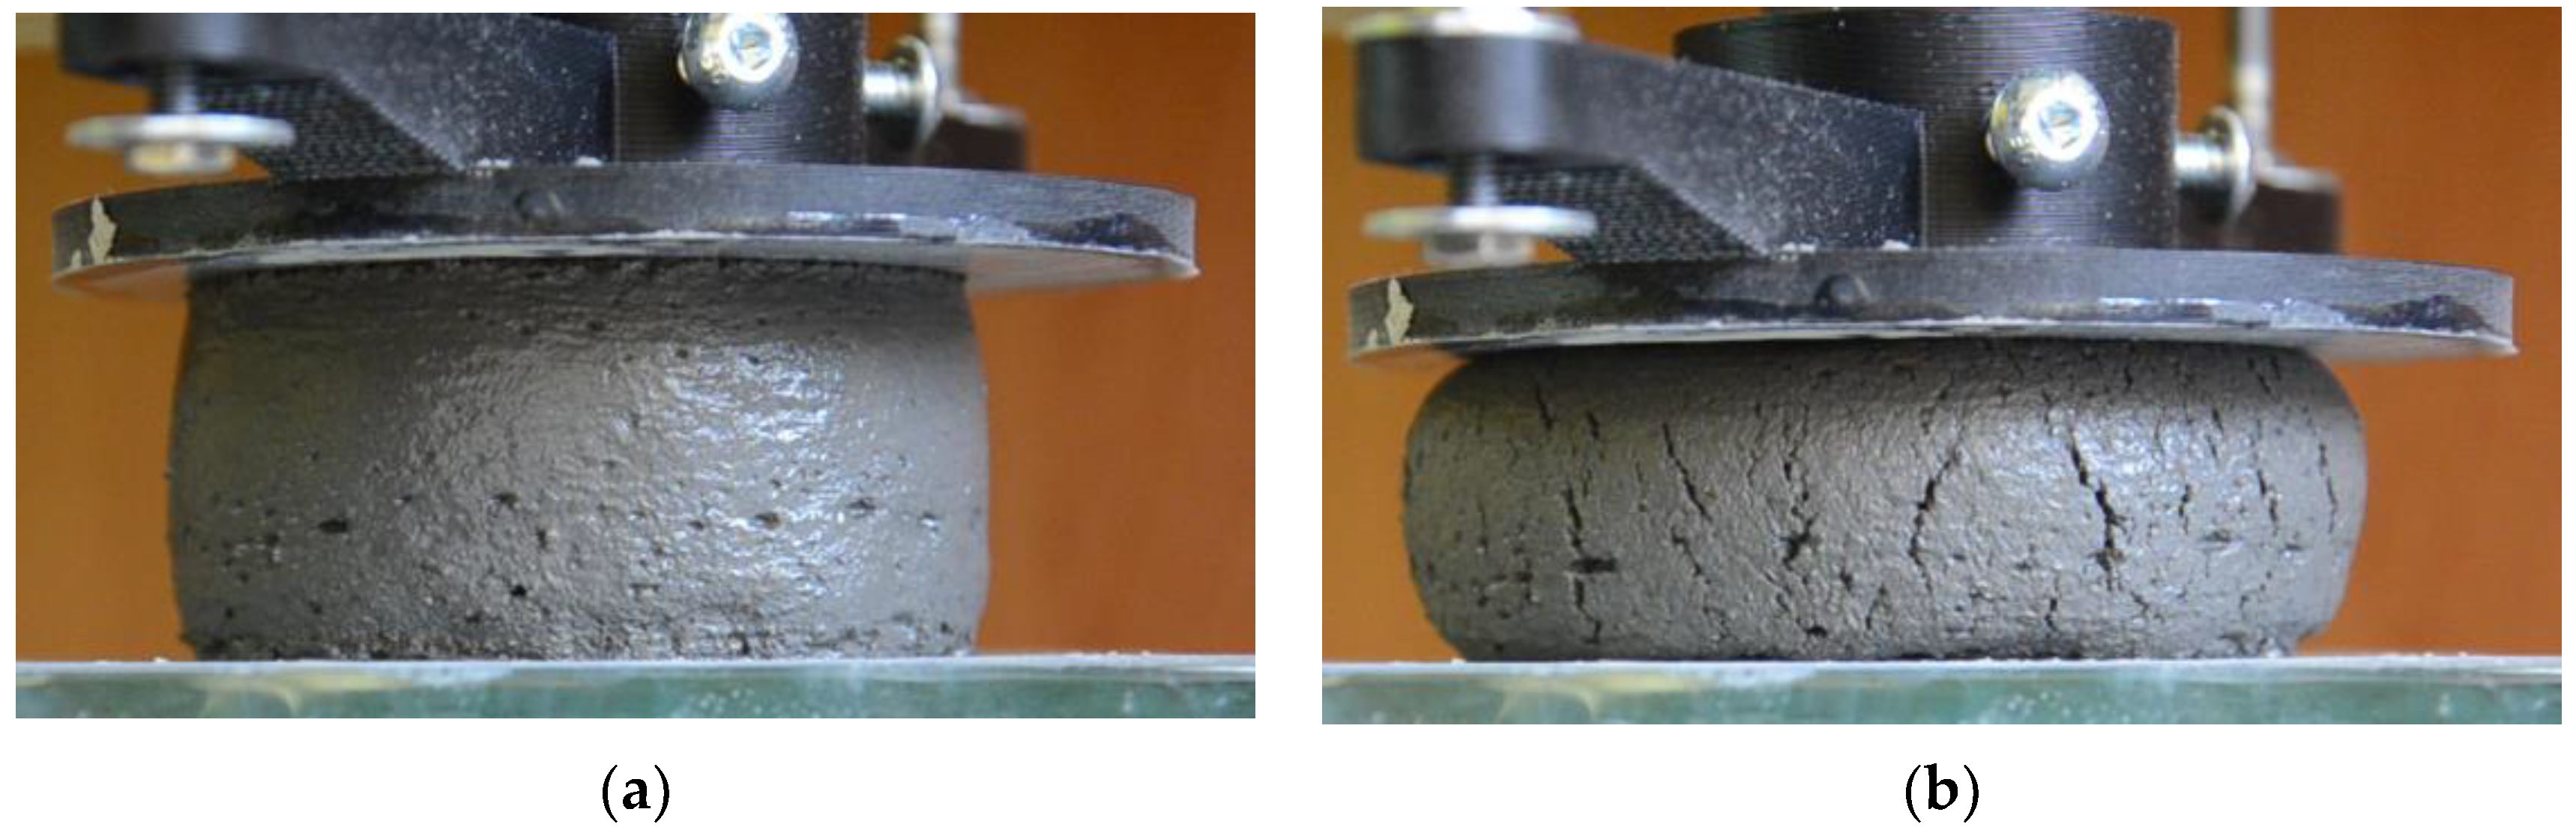
2.2.2. Fresh Properties
- The sizes of path should be constant;
- The global deformations of path are unacceptable;
- The printed layer must be free of surface defects and cracks (only small minor cracks and defect can be acceptable).
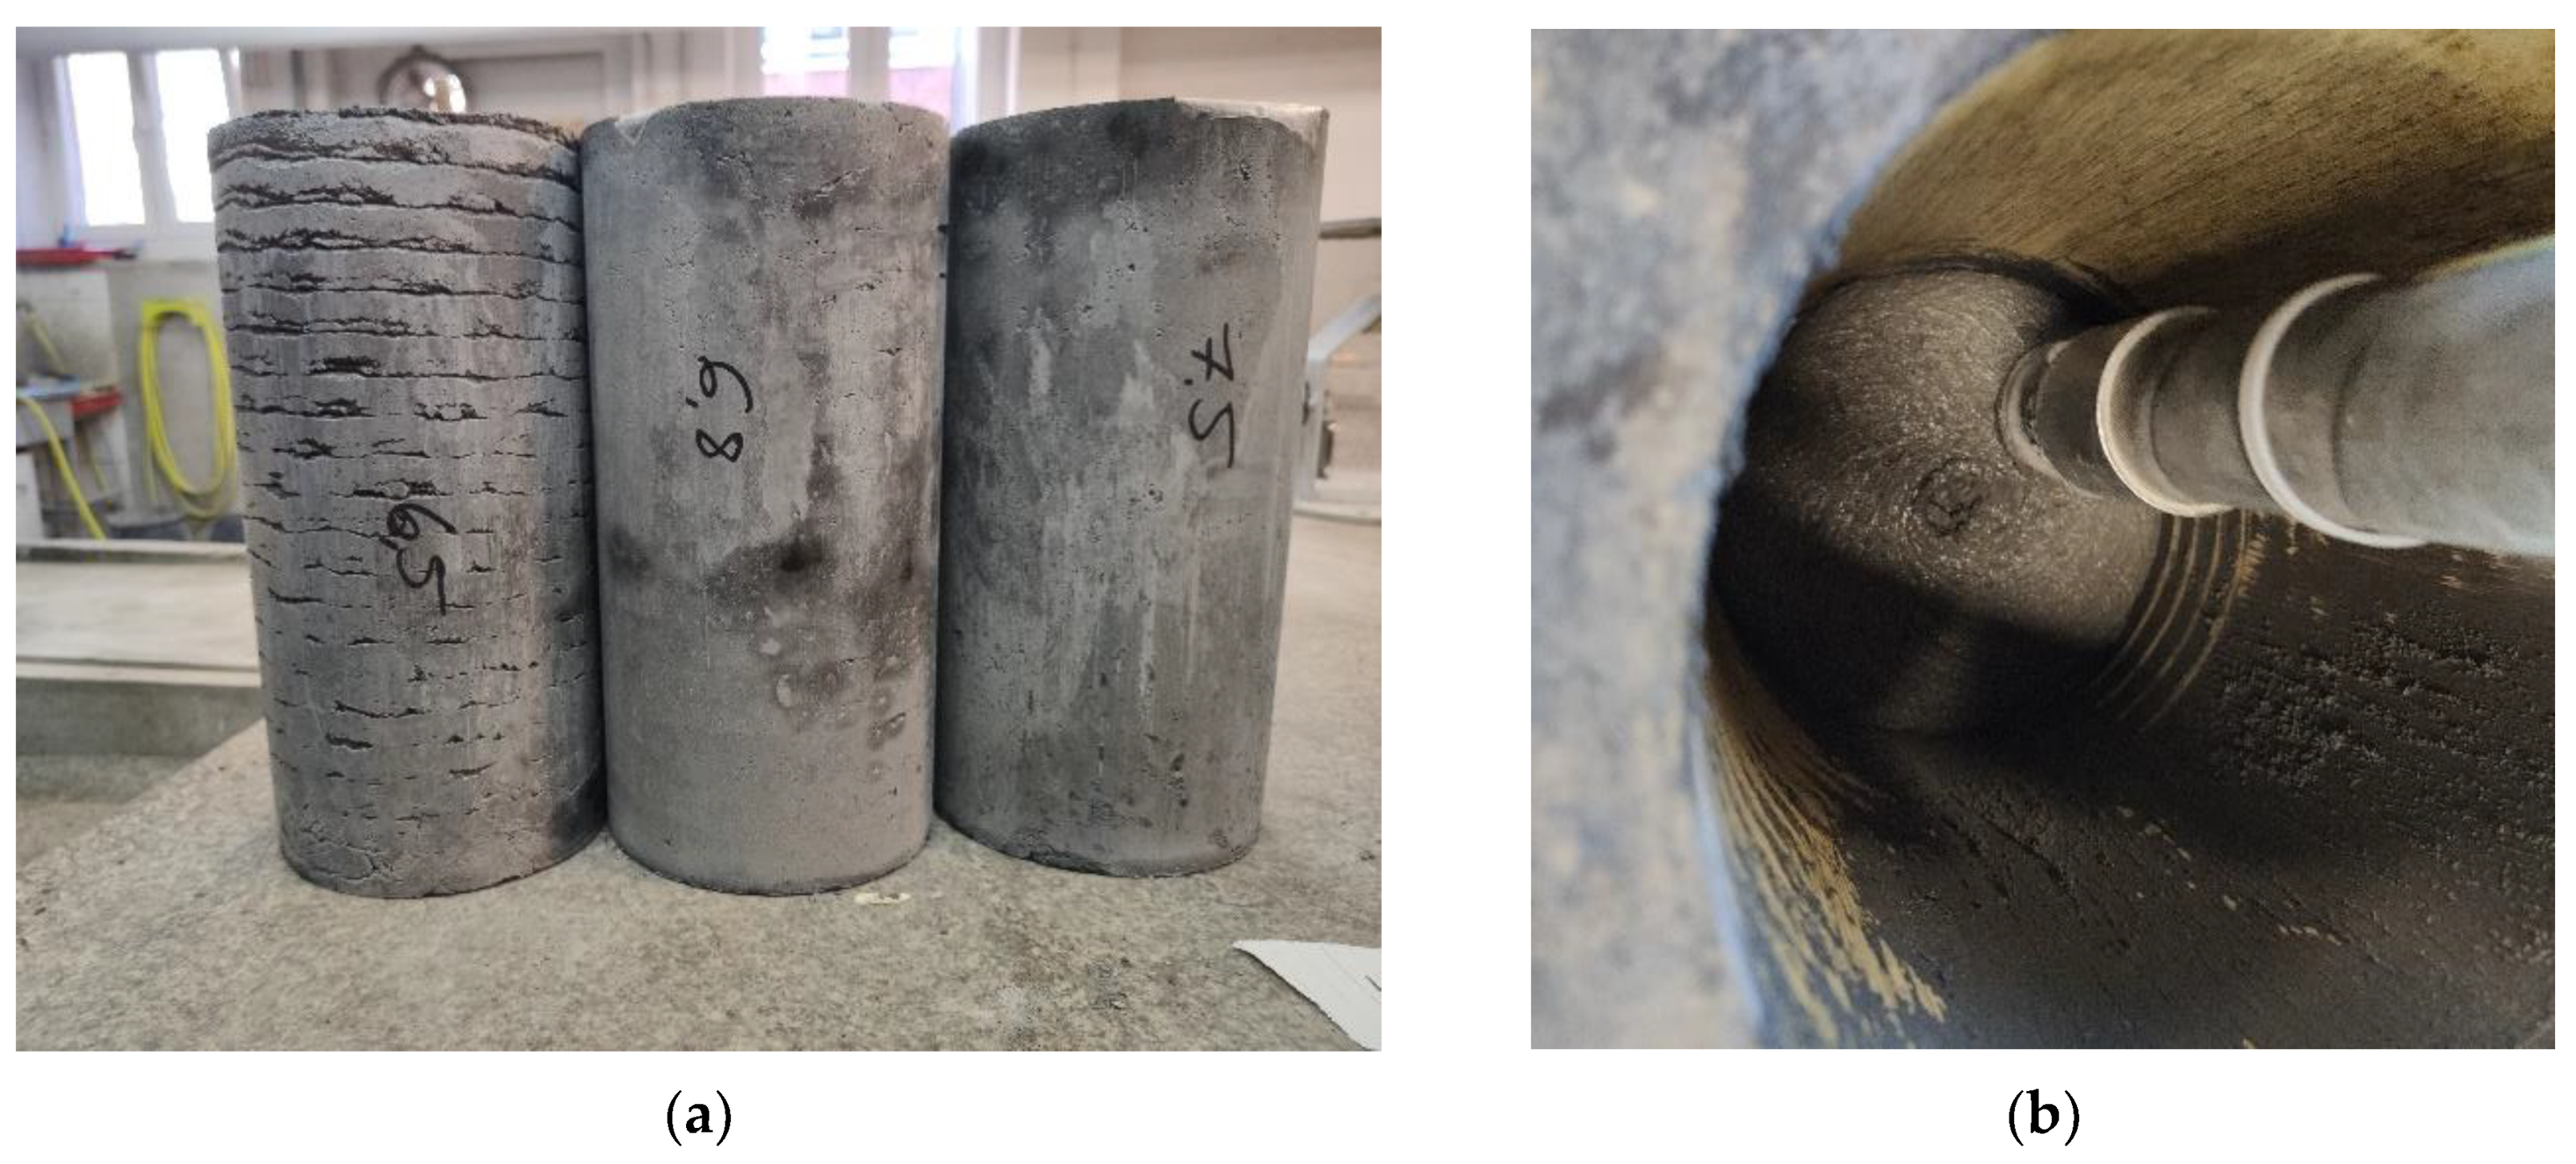
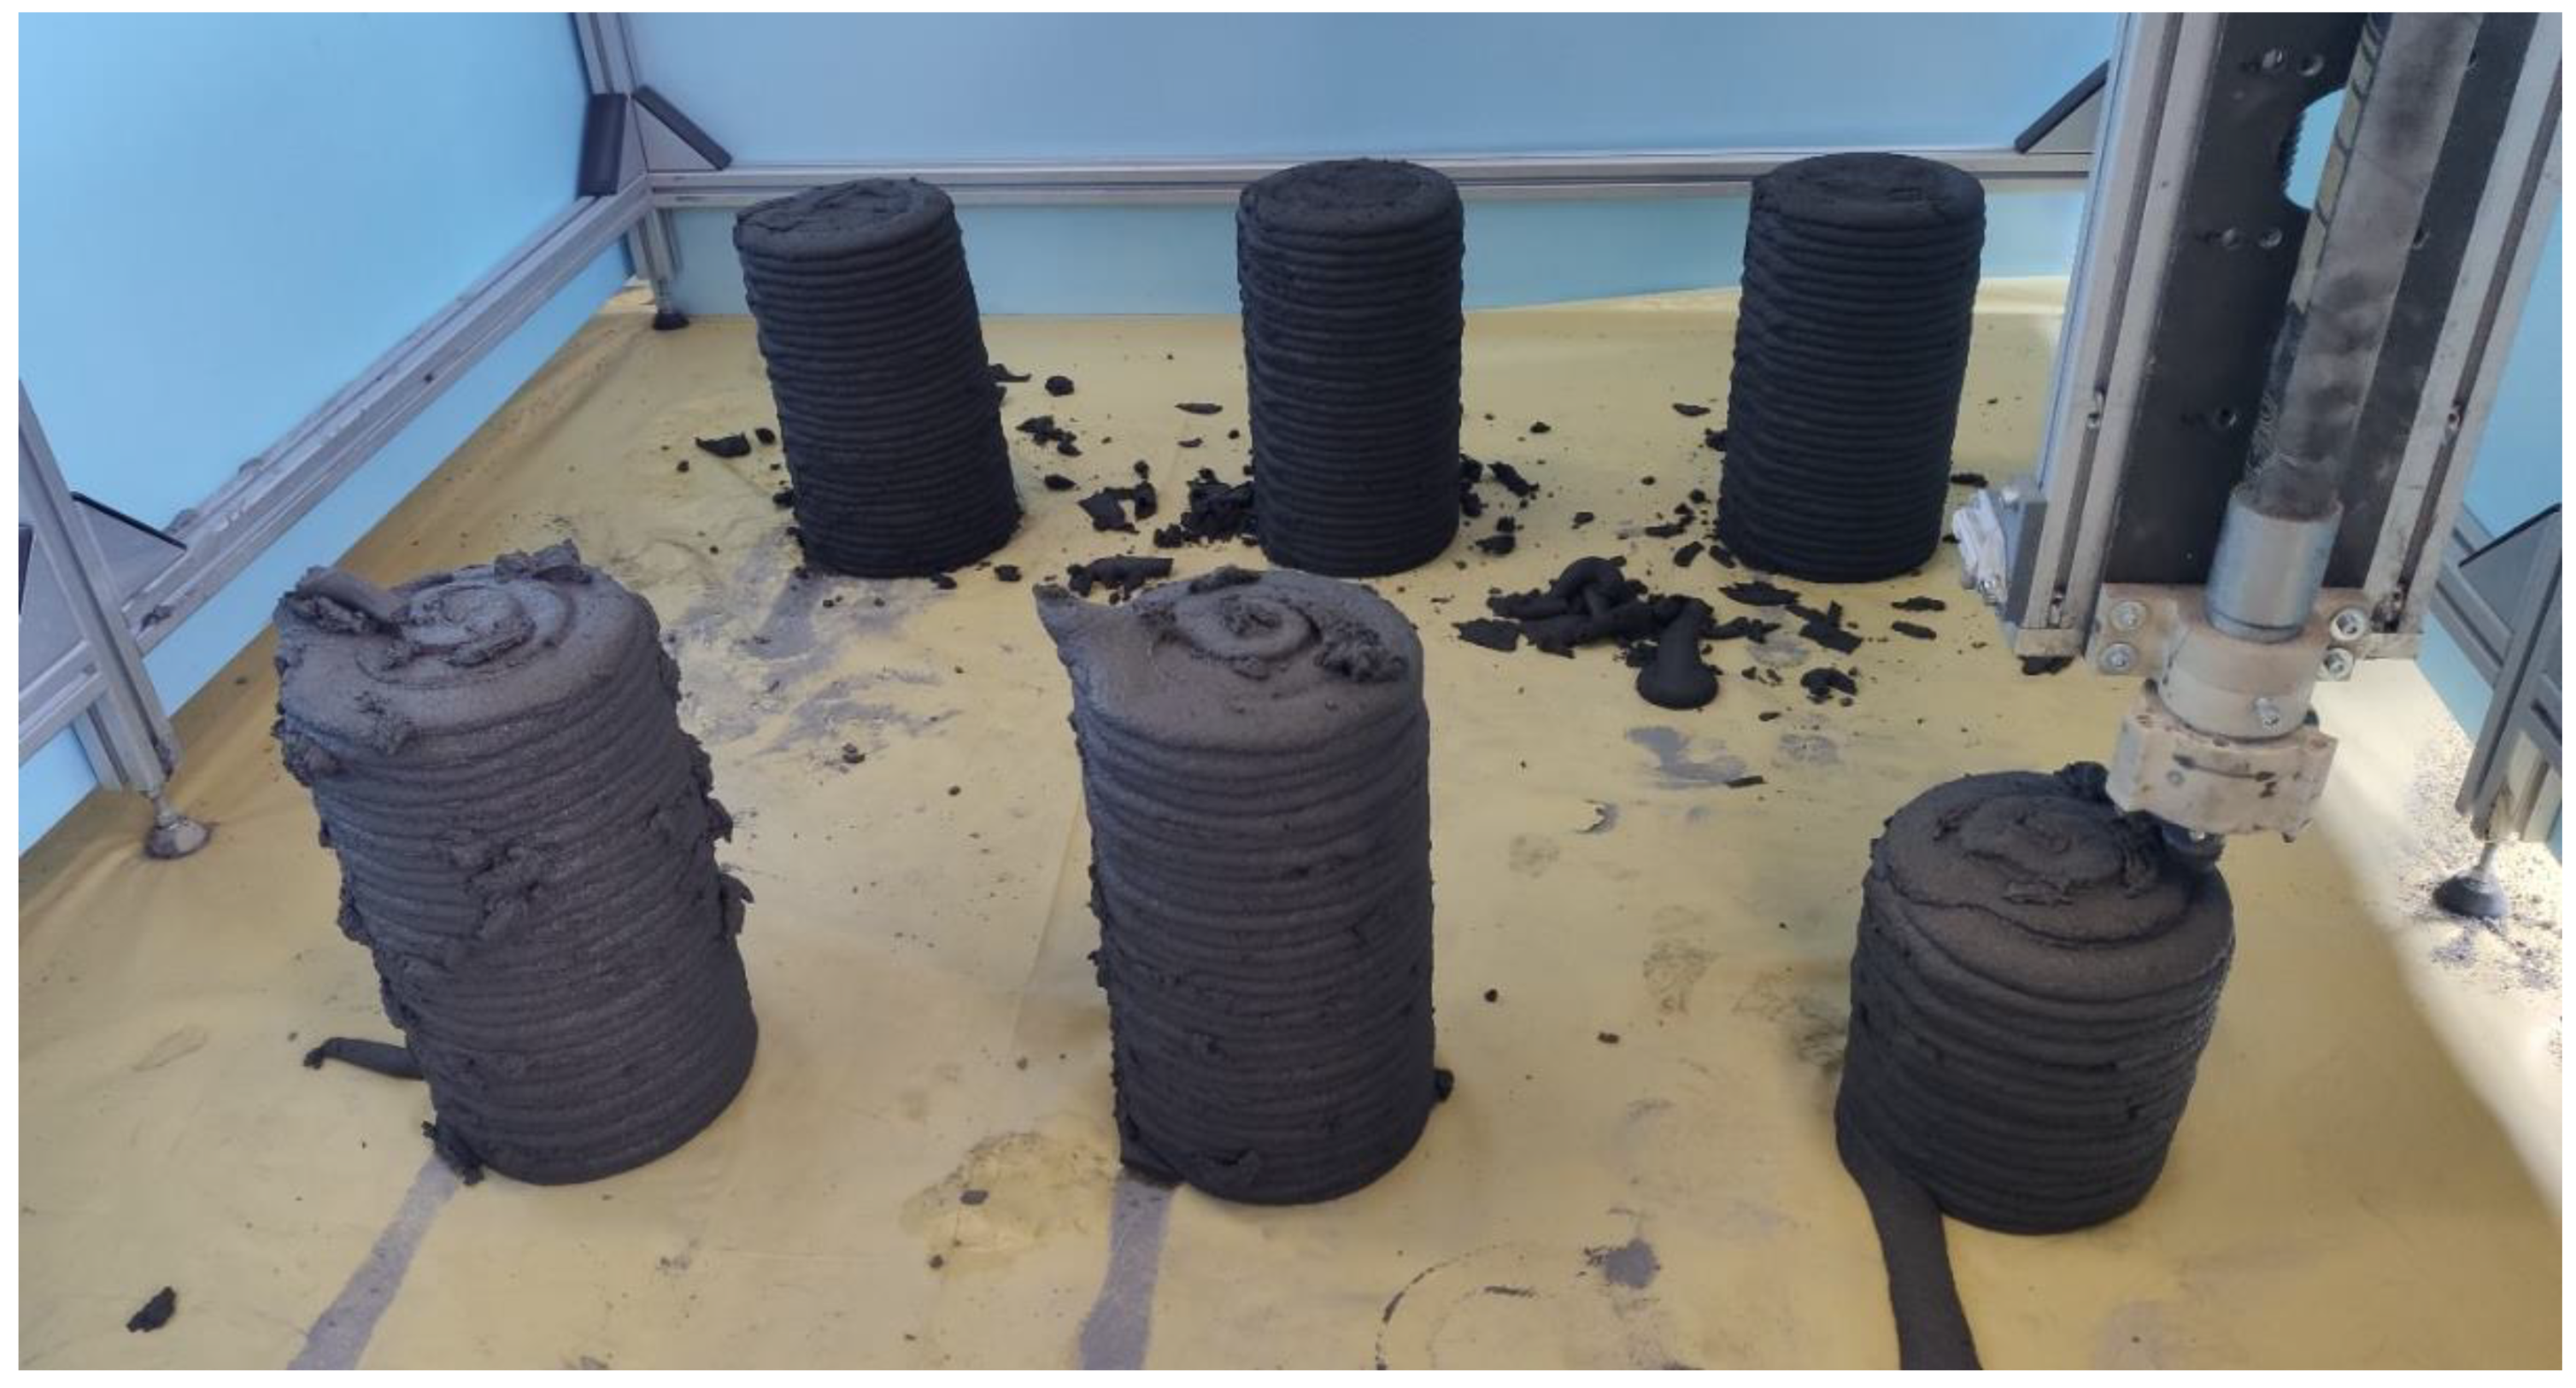
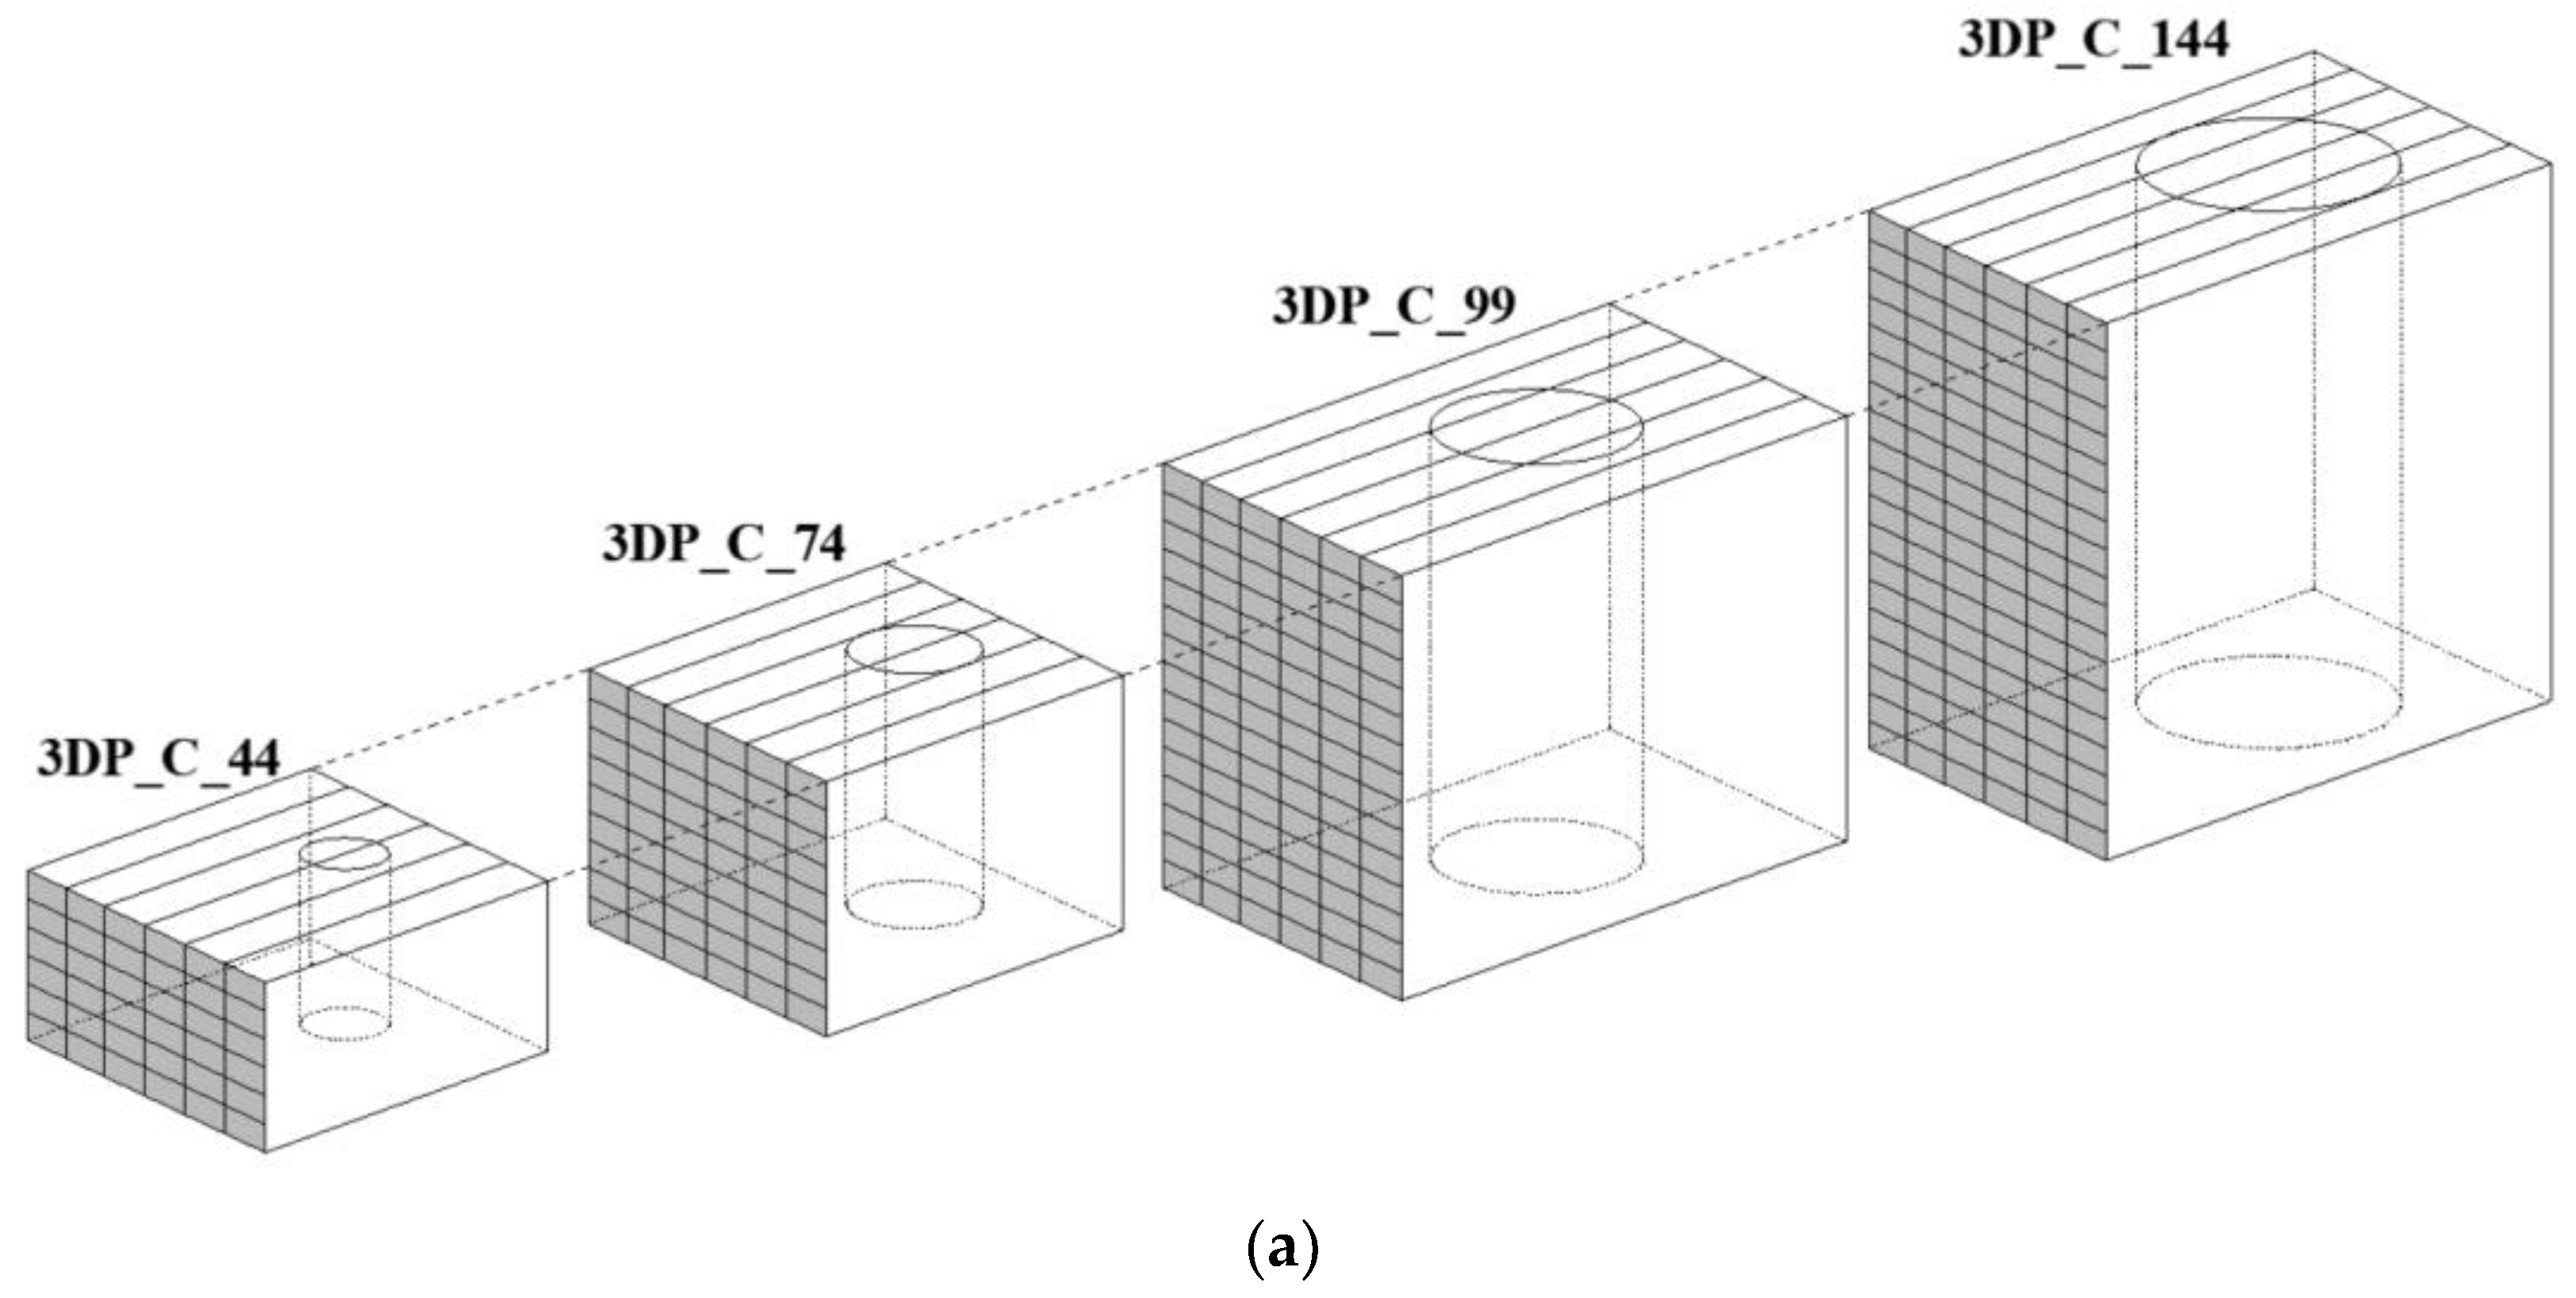
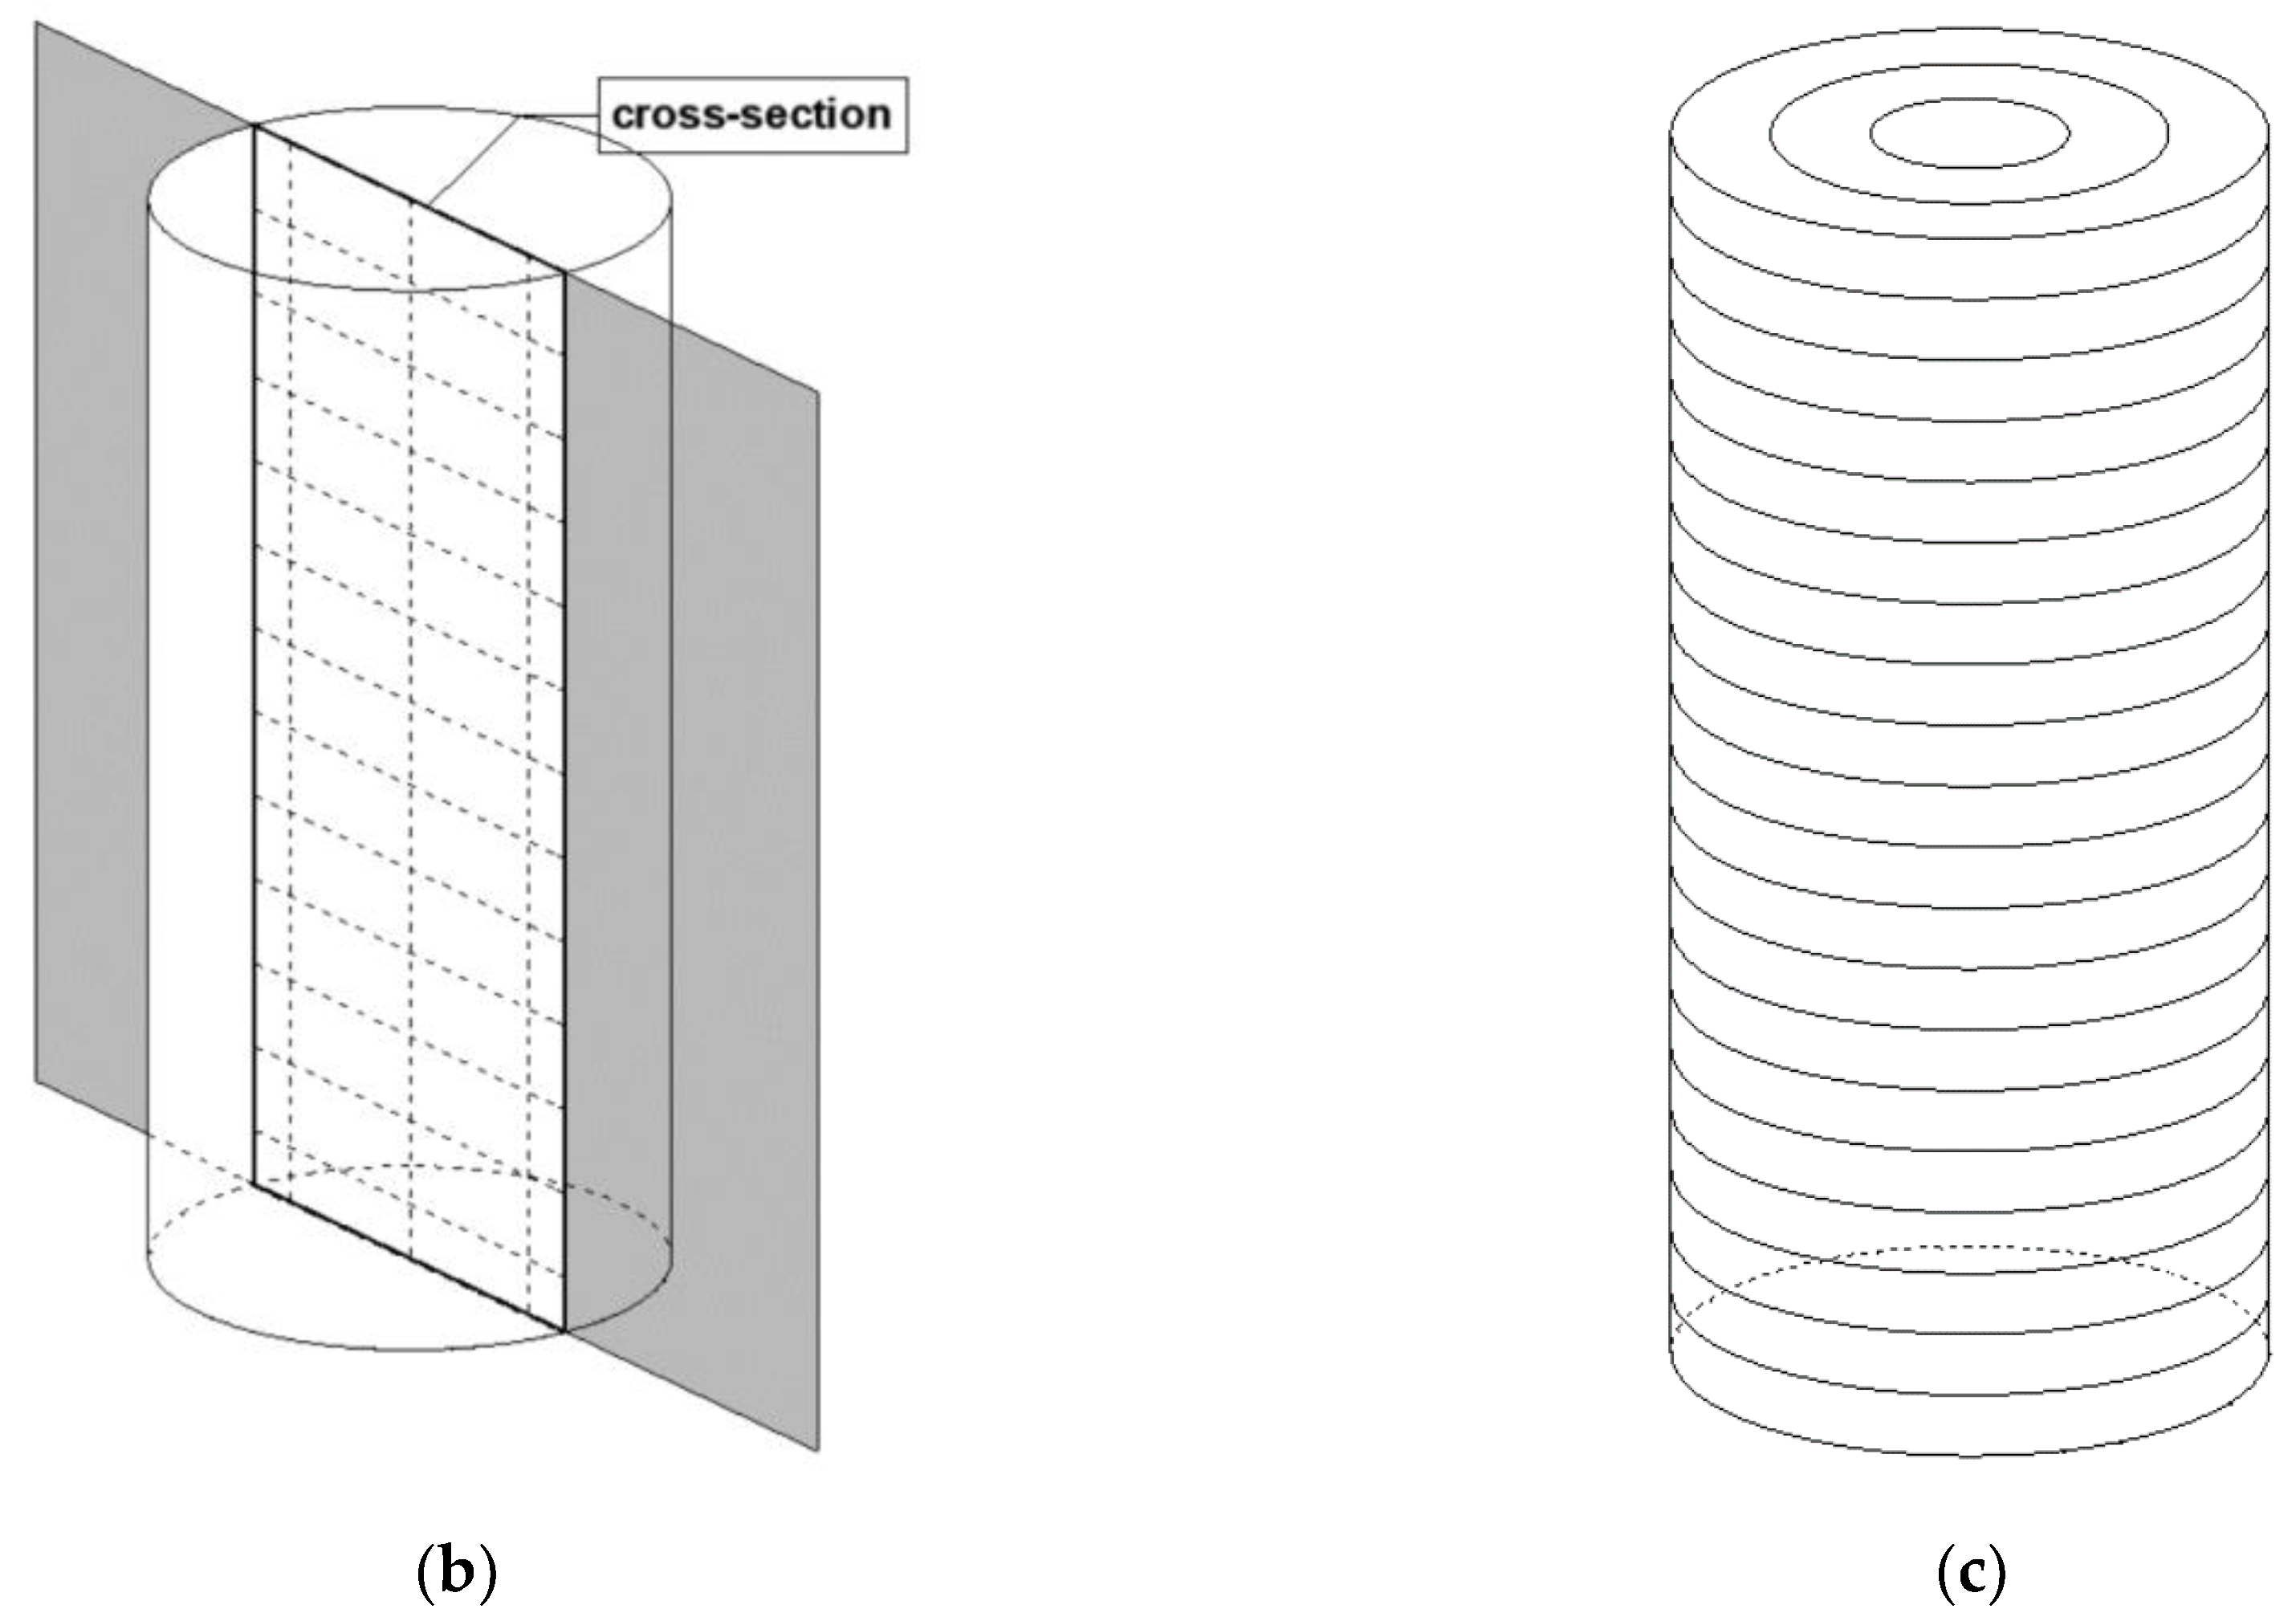
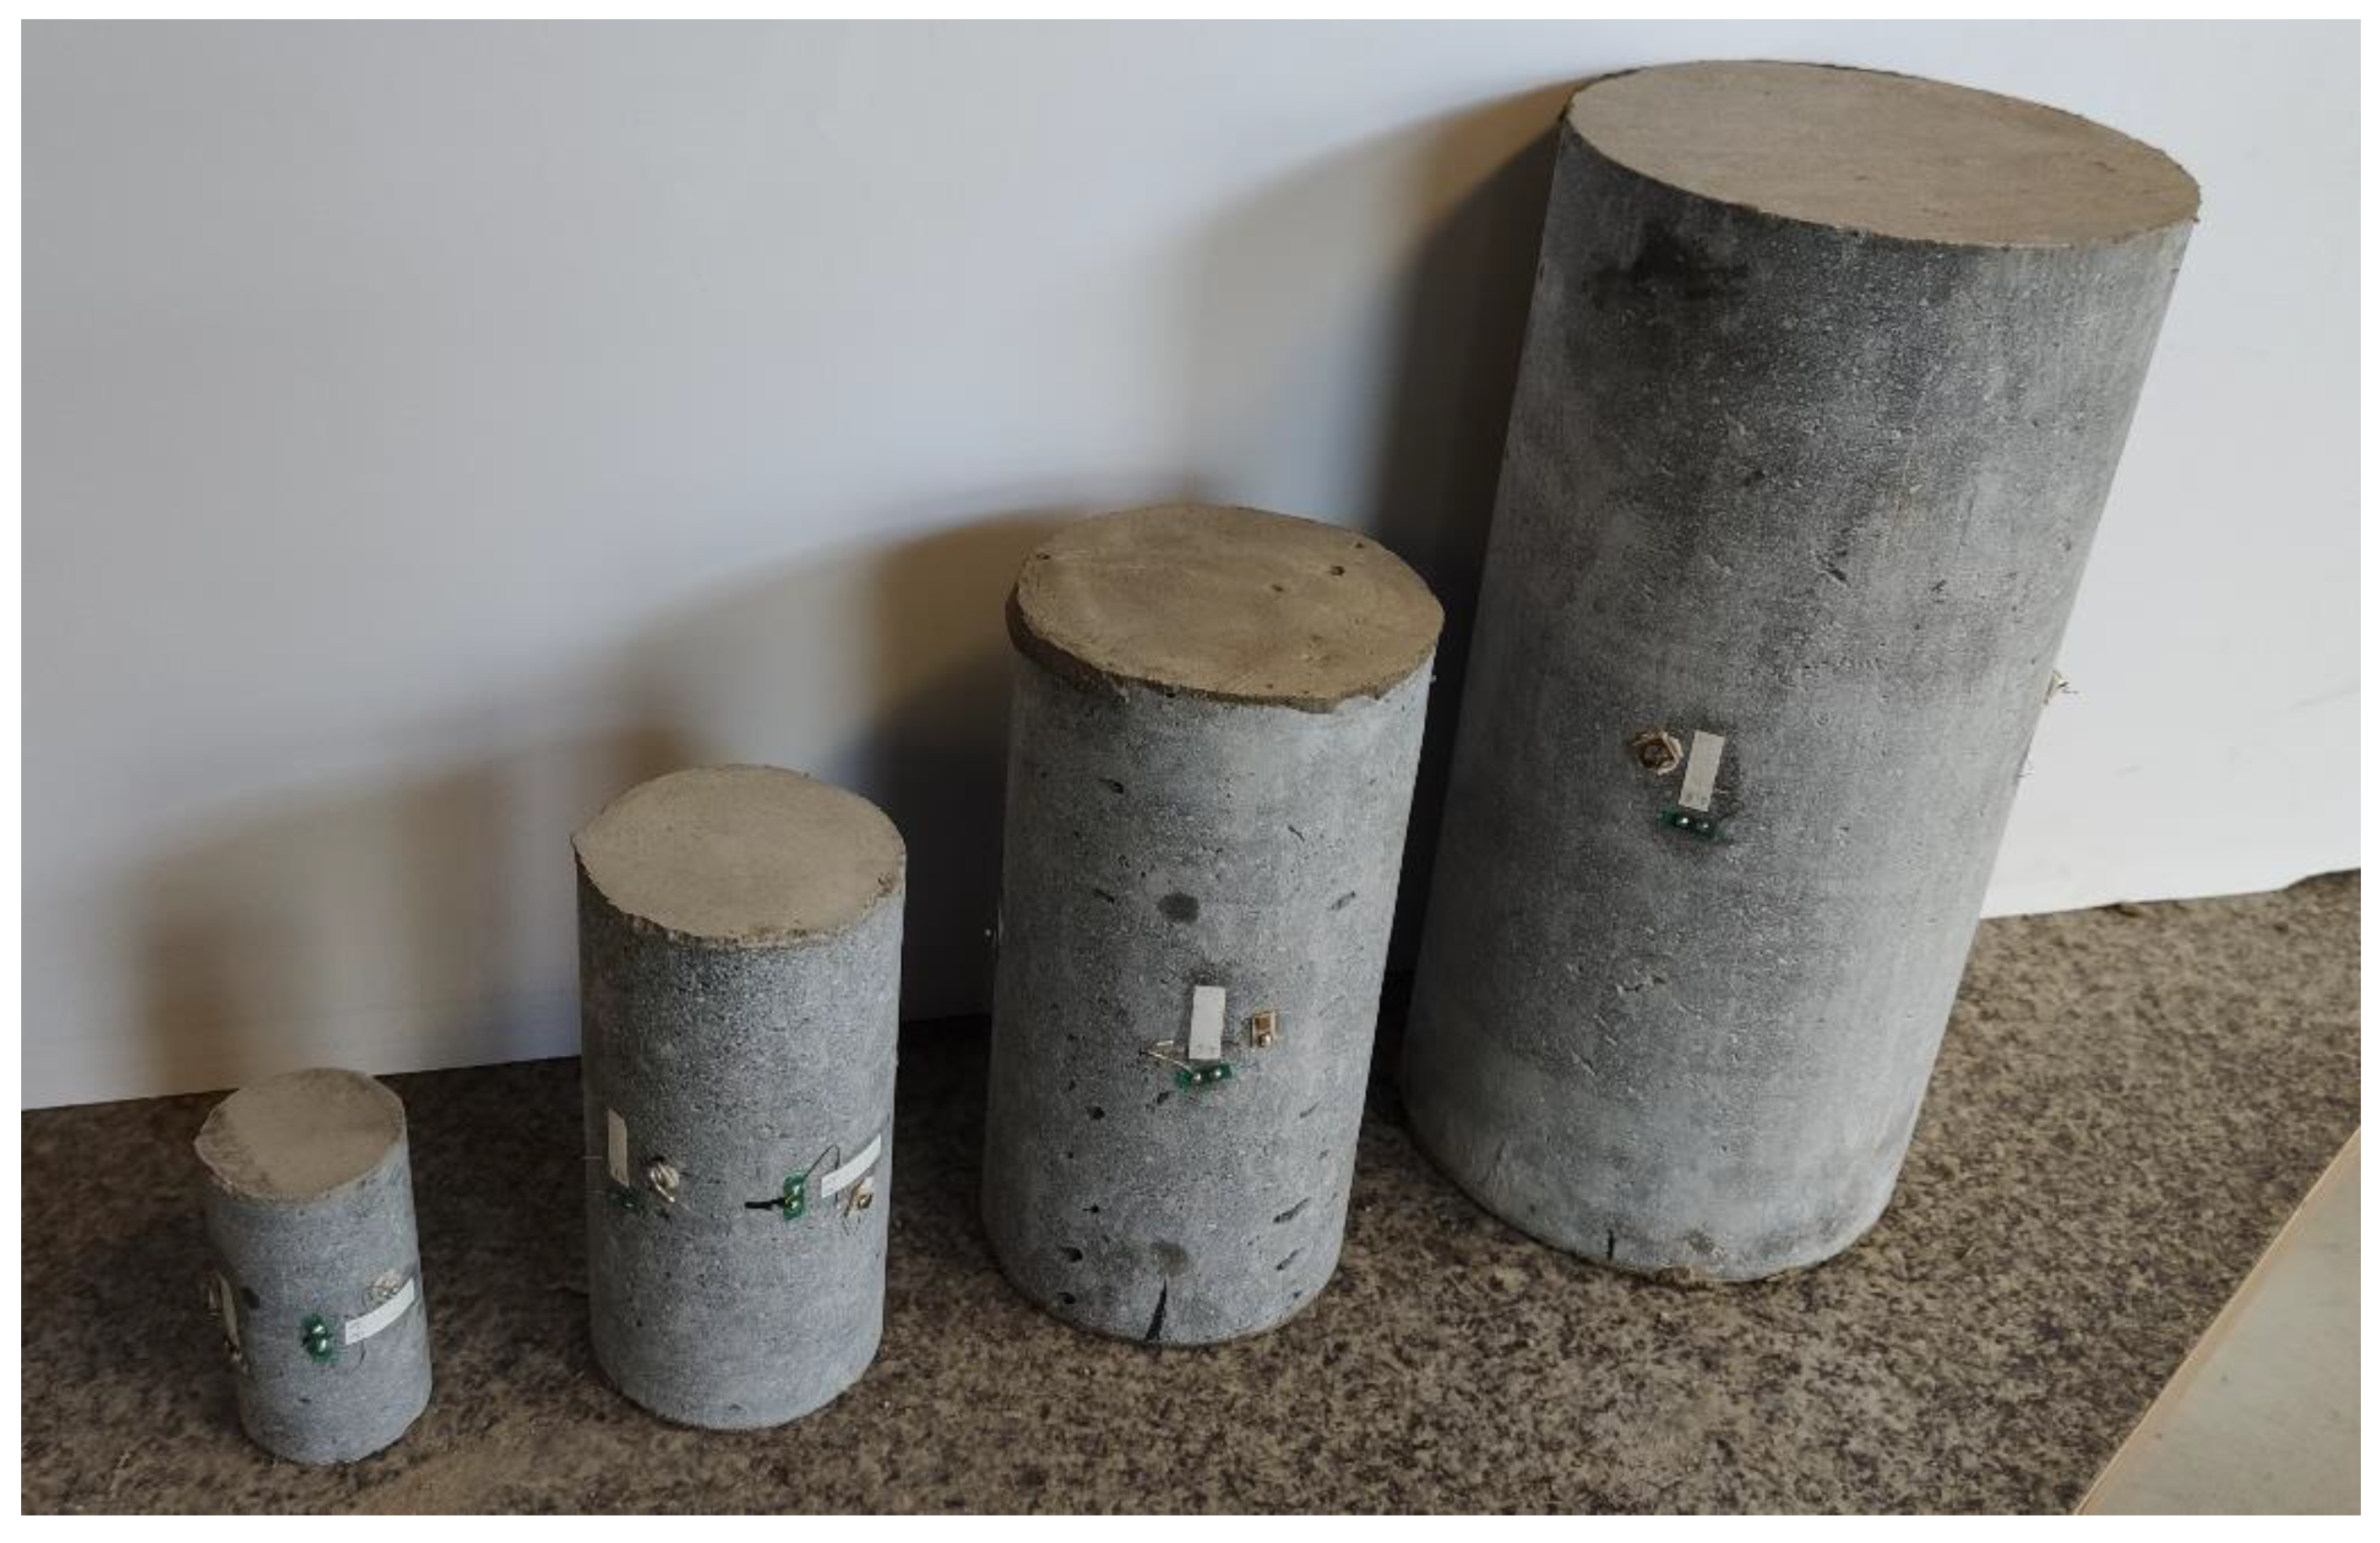
2.2.3. Specimen Preparation
- STDR—standard mold-casted specimens Φ15 cm × 30 cm;
- 3DP_M—specimens 3D printed into a Φ15 cm × 30 cm mold;
- 3DP_F—freely 3D printed columns approx. Φ15 cm × 30 cm;
- 3DP_C_X—3D printed specimens cut from a block. The X stands for a diameter of the sample in mm.
2.2.4. Young’s Modulus and Compressive Strength
3. Results
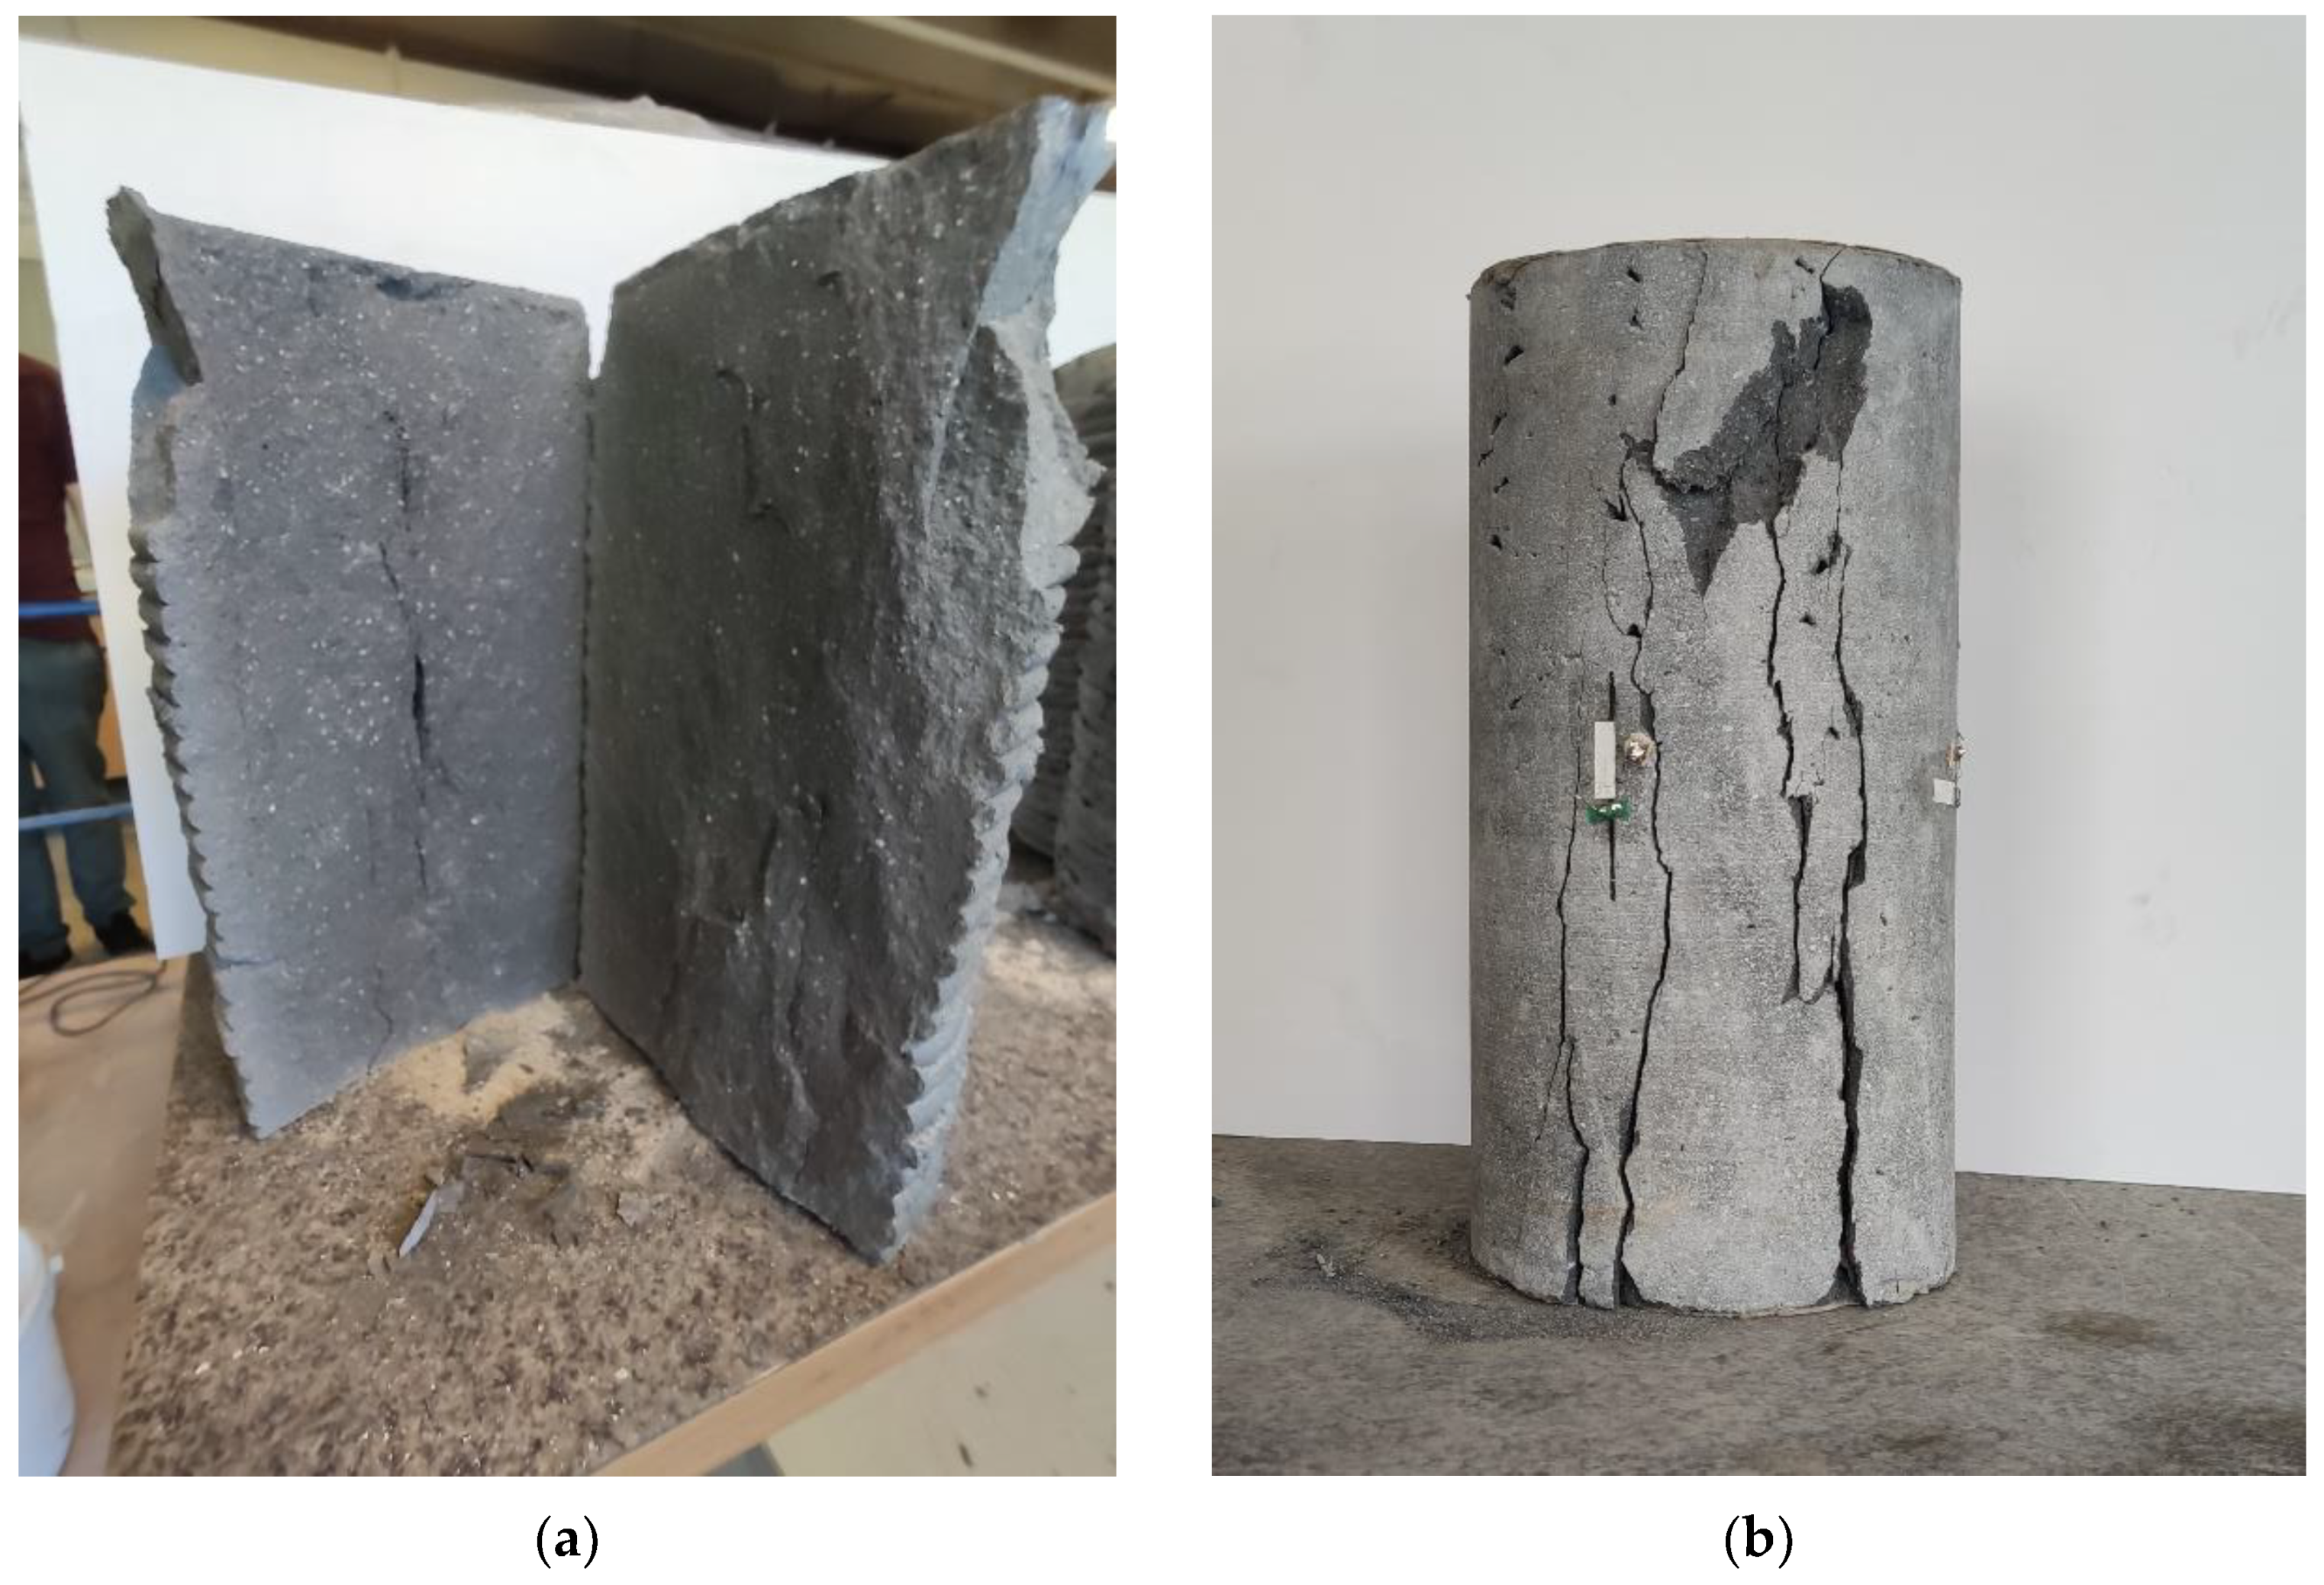
3.1. Unconfined Uniaxial Compression Test
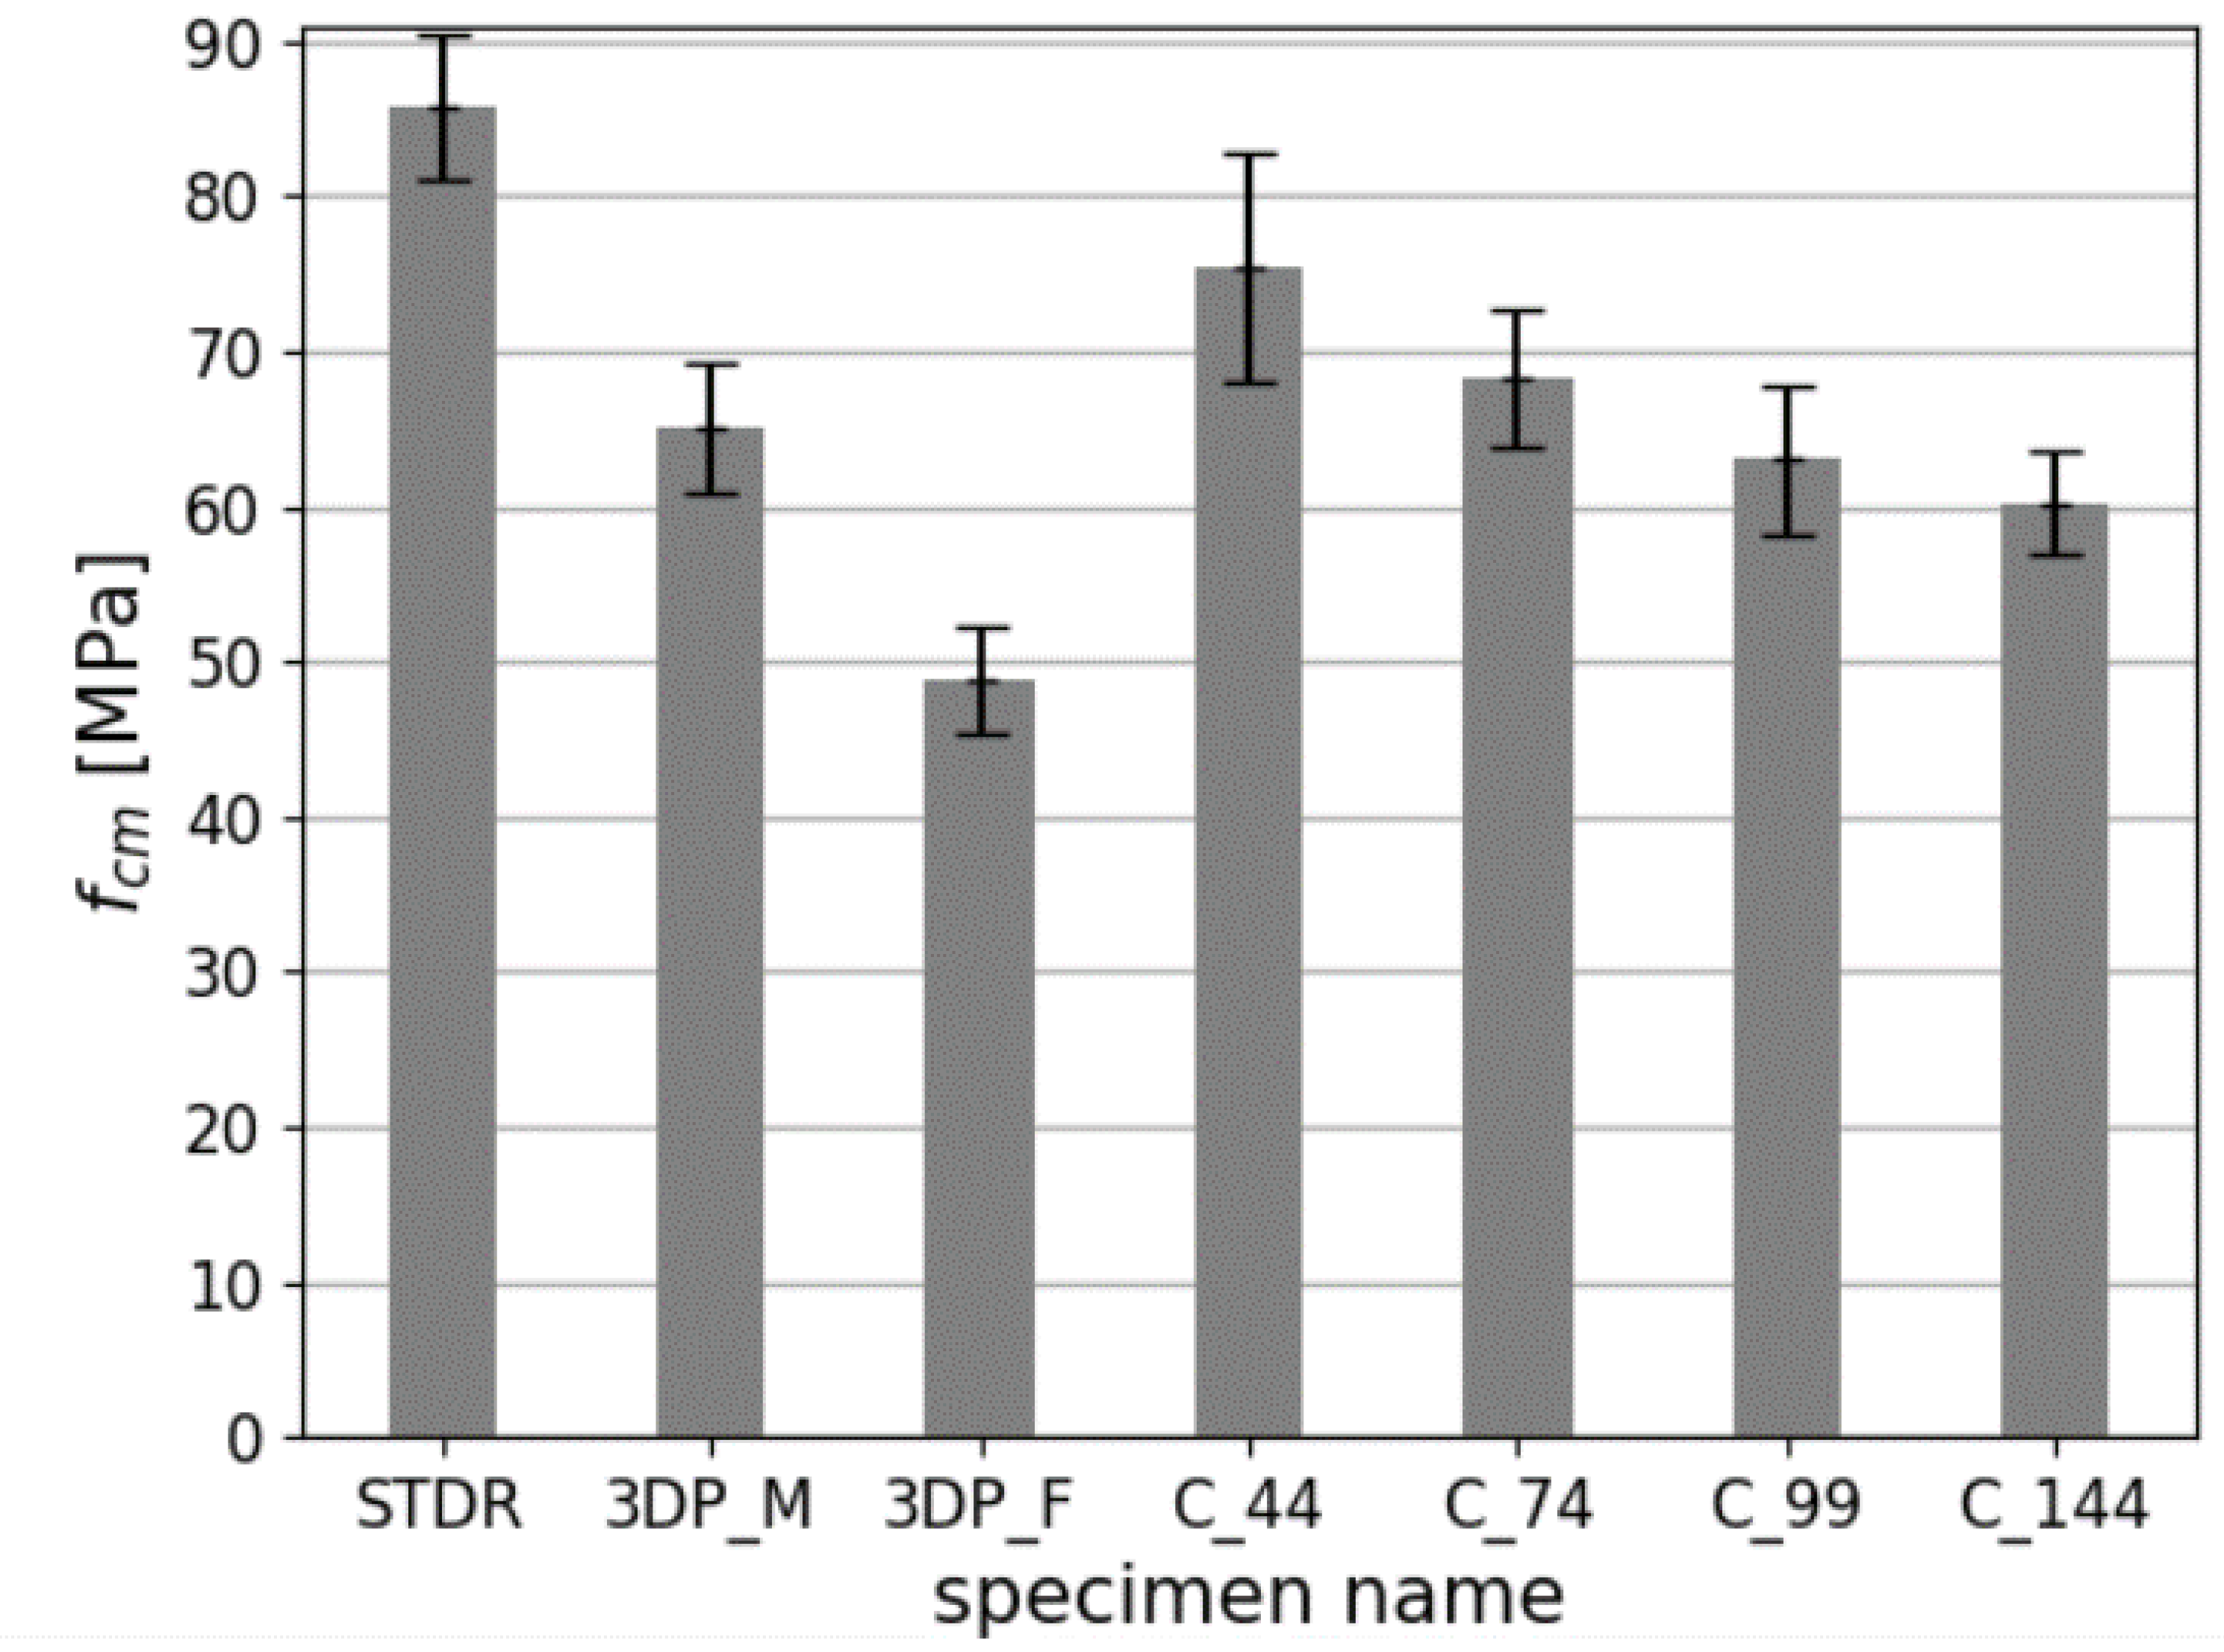
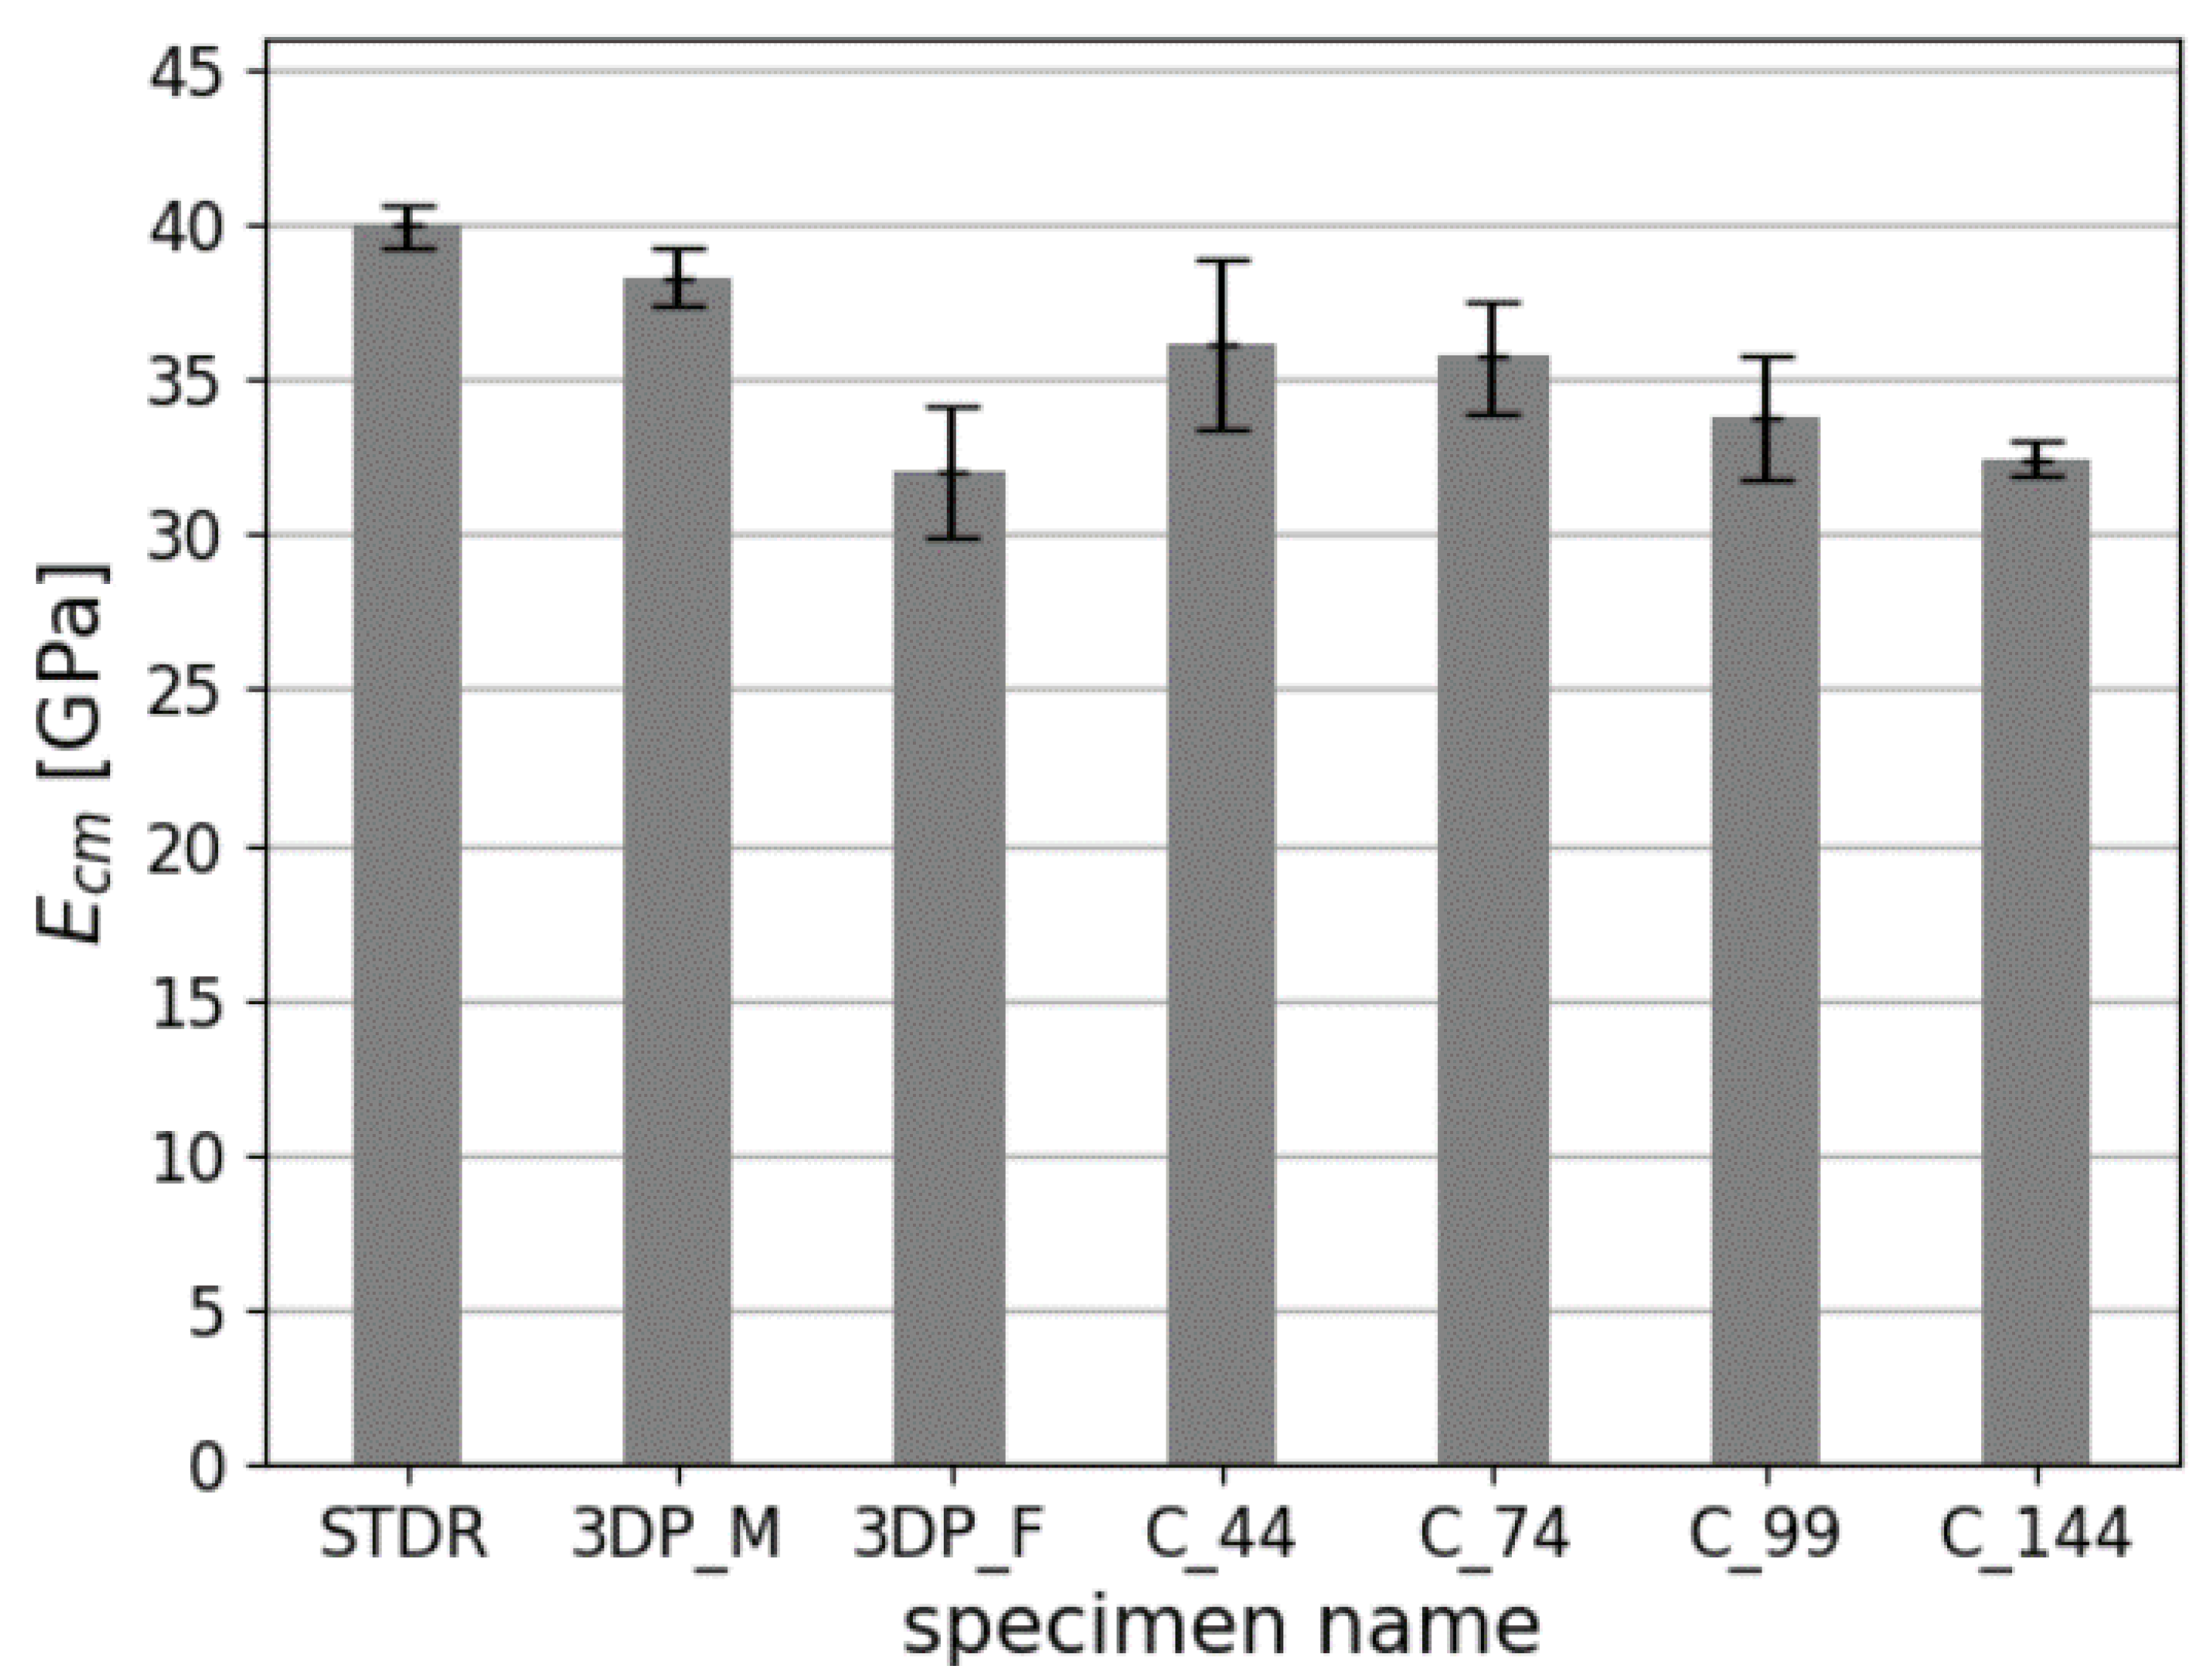
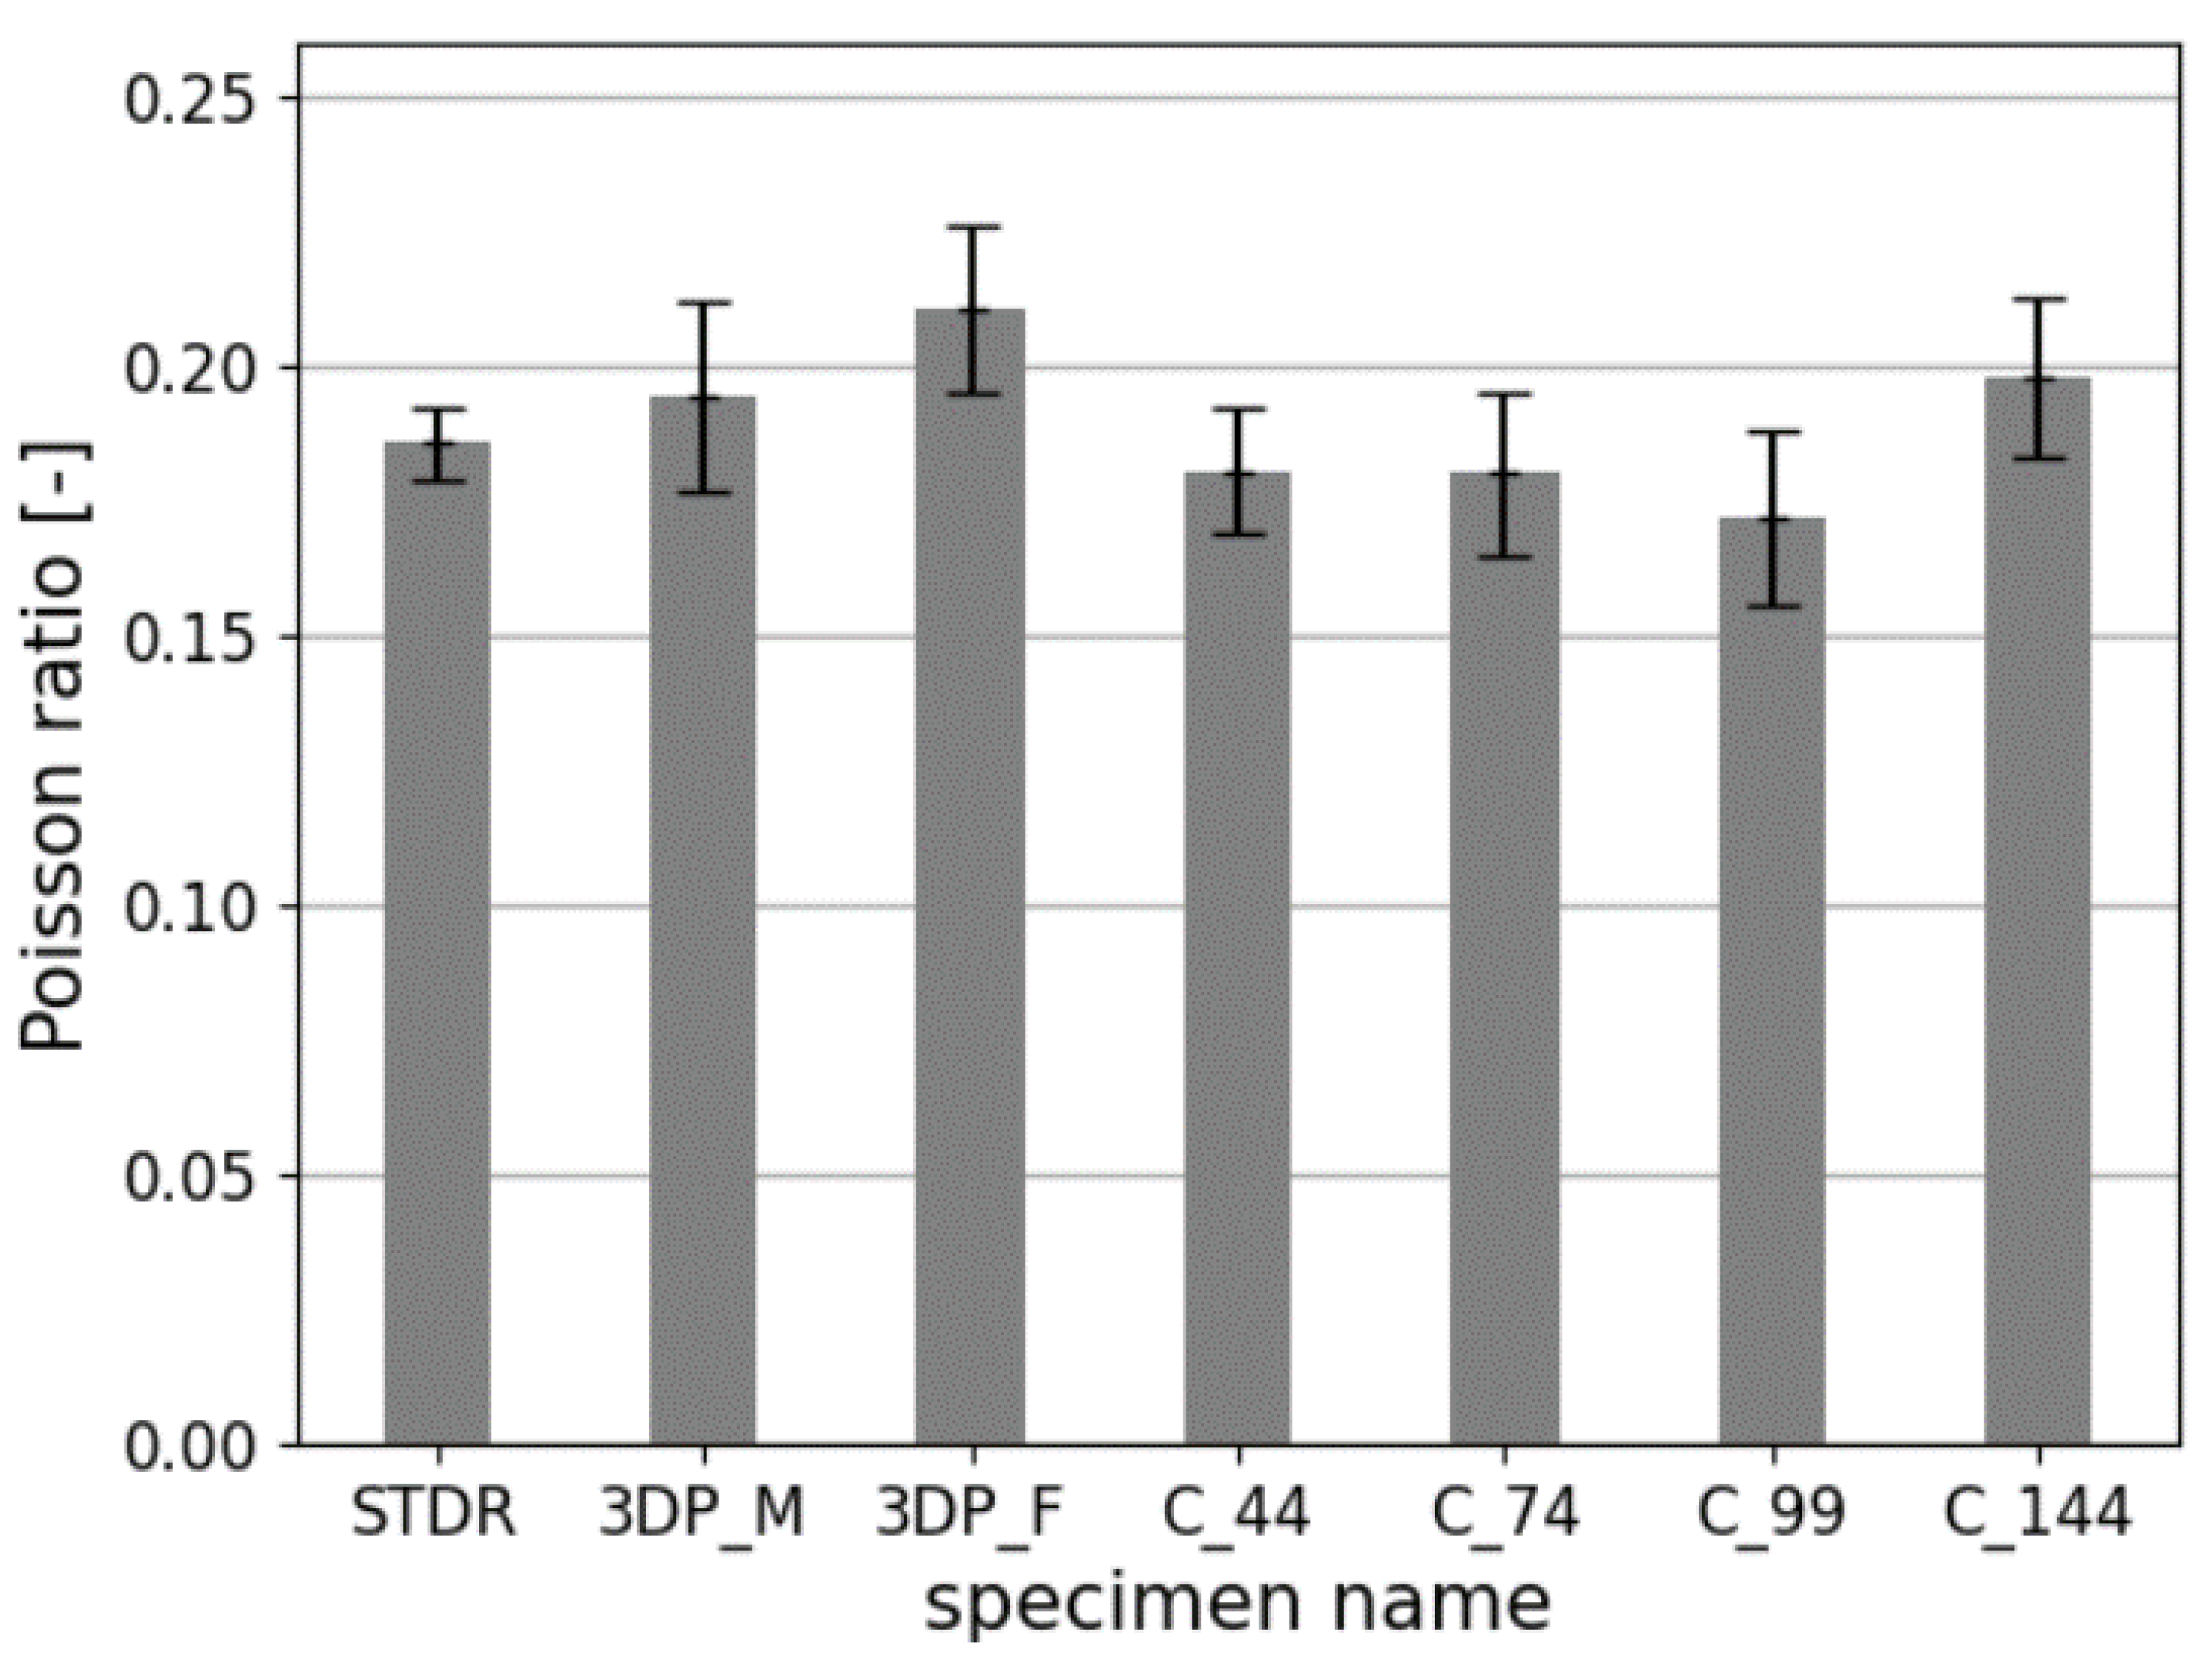
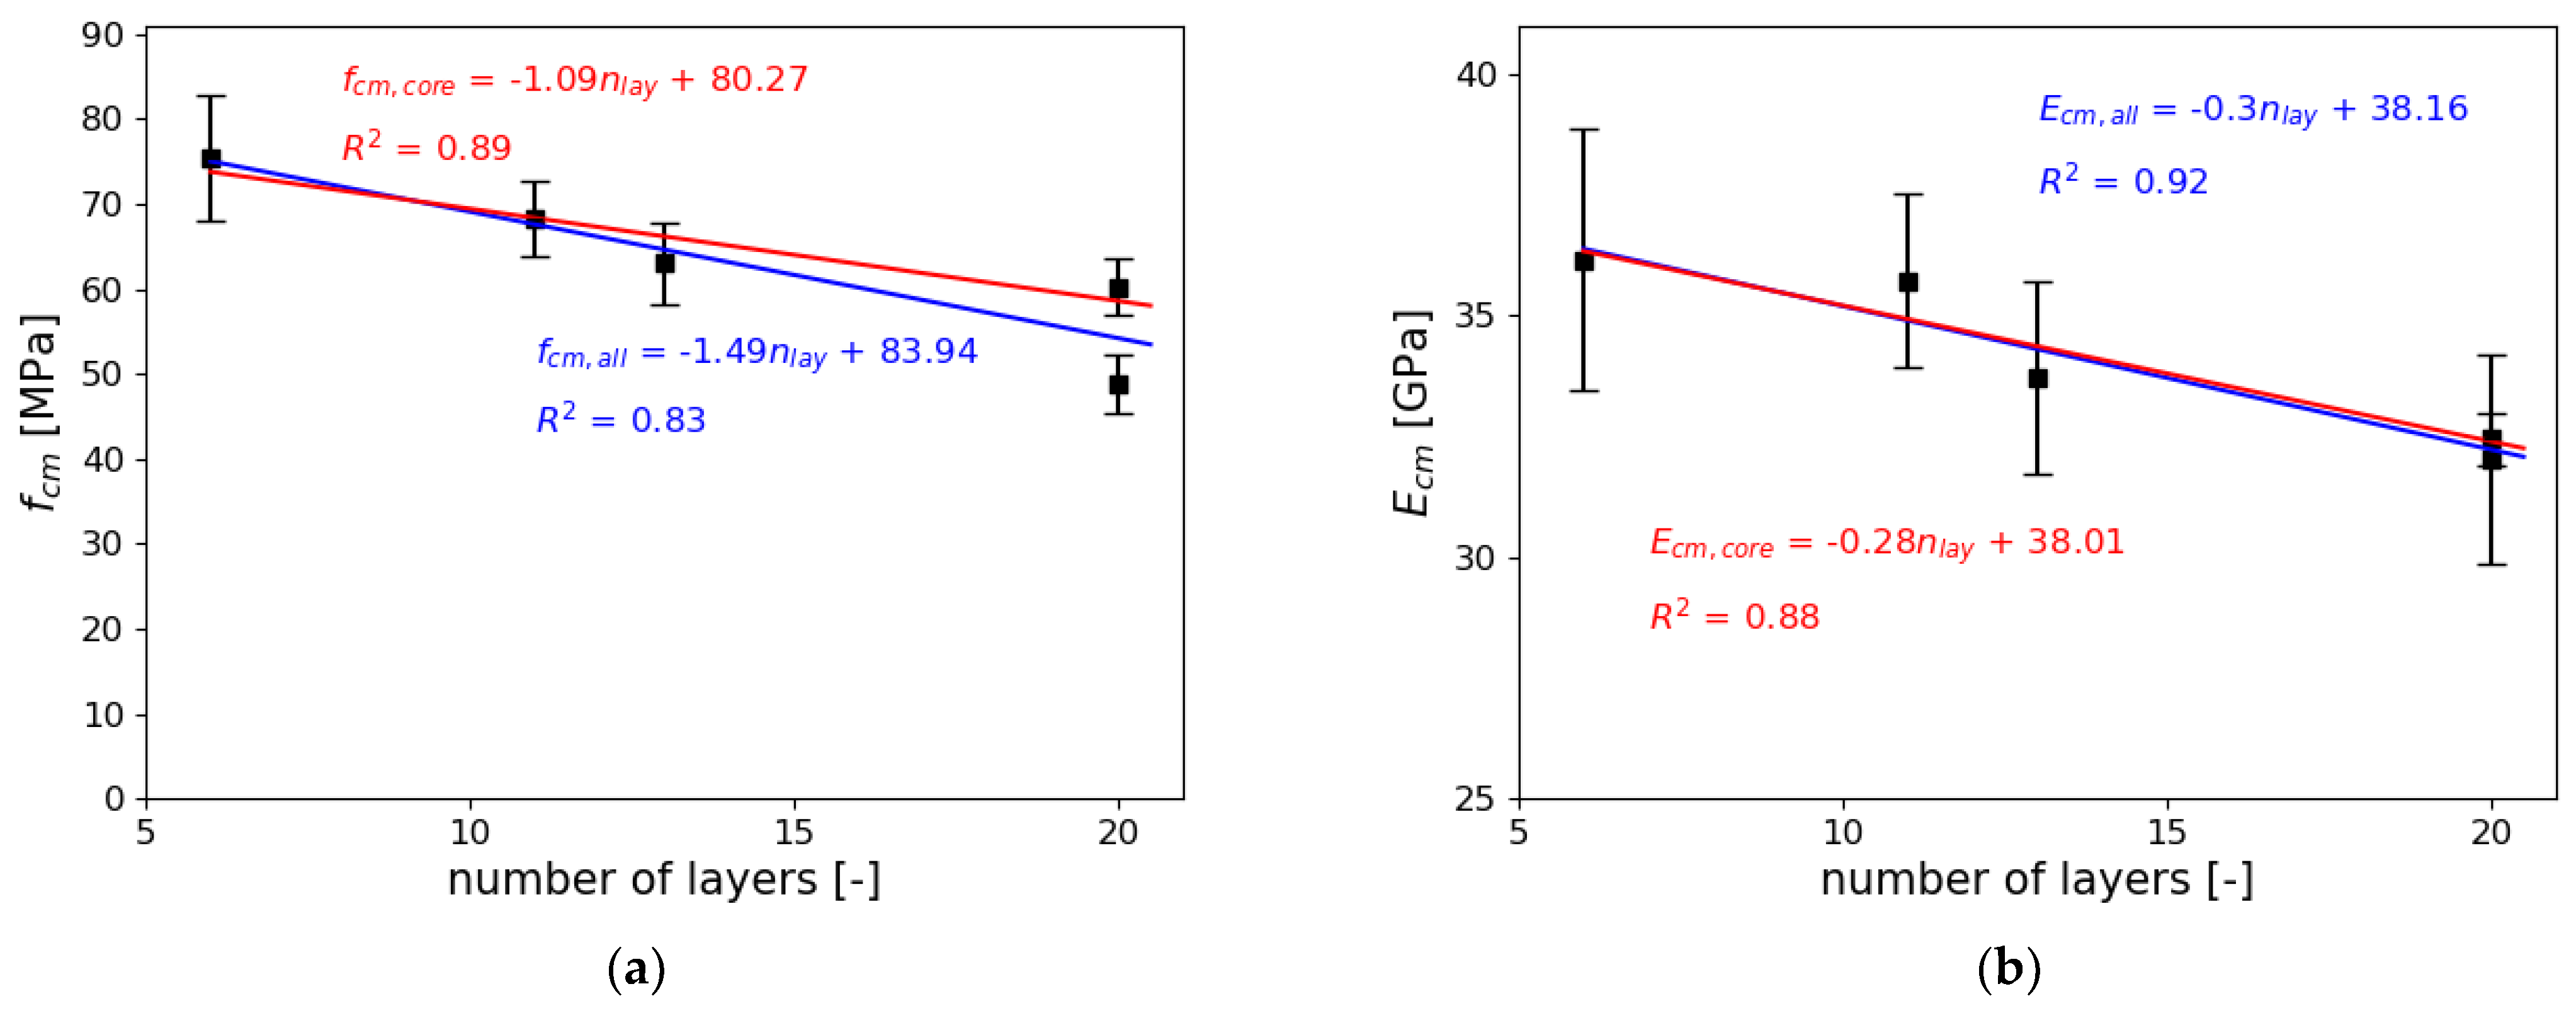
3.2. Young’s Modulus and Compressive Strength
- —percentage change (–for Young’s modulus, –for compressive strength, –for Poisson’s ratio);
- —mean value obtained for standard specimens;
- —mean value obtained on a specific specimens type.
- and —all cut out samples 3DP_C_X and 3DP_F
- and —only cut out samples, excluding 3DP_F
4. Conclusions
- The bigger the specimen, the lower the mechanical performance of cut-out samples.
- The higher the number of layers, the lower the value of compressive strength of printed samples. The strength reduction compared to standard cylindrical sample was the highest for freely printed columns (approximately 43%). The strength reduction was lower for samples printed into a mold or cut out from a bigger printed block.
- The higher the number of layers, the lower the value of Young’s modulus of printed samples. The difference between the biggest printed sample and the standard sample reached 20%.
- Samples printed into a mold or cut out from a bigger printed block had better mechanical performance than freely printed columns. This is caused by lateral restriction of concrete due to either mold itself or surrounding layers.
- The value of Poisson’s ratio for printed samples in this study differed by ±13% from the standard samples.
Author Contributions
Funding
Institutional Review Board Statement
Informed Consent Statement
Data Availability Statement
Conflicts of Interest
References
- Kazemian, A.; Yuan, X.; Cochran, E.; Khoshnevis, B. Cementitious materials for construction-scale 3D printing: Laboratory testing of fresh printing mixture. Constr. Build. Mater. 2017, 145, 639–647. [Google Scholar] [CrossRef]
- Le, T.T.; Austin, S.A.; Lim, S.; Buswell, R.A.; Gibb, A.G.F.; Thorpe, T. Mix design and fresh properties for high-performance. Mater. Struct. 2012, 45, 1221–1232. [Google Scholar] [CrossRef] [Green Version]
- Skibicki, S.; Kaszyńska, M.; Wahib, N.; Techman, M.; Federowicz, K.; Zieliński, A.; Wróblewski, T.; Olczyk, N.; Hoffmann, M. Properties of Composite Modified with Limestone Powder for 3D Concrete Printing. In Proceedings of the Second RILEM International Conference on Concrete and Digital Fabrication; Bos, F.P., Lucas, S.S., Wolfs, R.J.M., Salet, T.A.M., Eds.; Springer International Publishing: Cham, Switzerland, 2020; pp. 125–134. ISBN 978-3-030-49916-7. [Google Scholar]
- Cuevas, K.; Chougan, M.; Martin, F.; Ghaffar, S.H.; Stephan, D.; Sikora, P. 3D printable lightweight cementitious composites with incorporated waste glass aggregates and expanded microspheres—Rheological, thermal and mechanical properties. J. Build. Eng. 2021, 44, 102718. [Google Scholar] [CrossRef]
- Wangler, T.; Roussel, N.; Bos, F.P.; Salet, T.A.M.; Flatt, R.J. Digital Concrete: A Review. Cem. Concr. Res. 2019, 123, 105780. [Google Scholar] [CrossRef]
- Buswell, R.A.; Leal de Silva, W.R.; Jones, S.Z.; Dirrenberger, J. 3D printing using concrete extrusion: A roadmap for research. Cem. Concr. Res. 2018, 112, 37–49. [Google Scholar] [CrossRef]
- Skibicki, S.; Kaszyńska, M.; Techman, M. Maturity testing of 3D printing concrete with inert microfiller. MATEC Web Conf. 2018, 219, 3008. [Google Scholar] [CrossRef]
- Federowicz, K.; Kaszyńska, M.; Zieliński, A.; Hoffmann, M. Effect of Curing Methods on Shrinkage Development in 3D-Printed Concrete. Materials 2020, 13, 2590. [Google Scholar] [CrossRef]
- Sikora, P.; Chougan, M.; Cuevas, K.; Liebscher, M.; Mechtcherine, V.; Ghaffar, S.H.; Liard, M.; Lootens, D.; Krivenko, P.; Sanytsky, M.; et al. The effects of nano- and micro-sized additives on 3D printable cementitious and alkali-activated composites: A review. Appl. Nanosci. 2021, 6, 100135. [Google Scholar] [CrossRef]
- Abdullah, A.; Taha, M.; Rashwan, M.; Fahmy, M. Efficient Use of Graphene Oxide and Silica Fume in Cement-Based Composites. Materials 2021, 14, 6541. [Google Scholar] [CrossRef] [PubMed]
- Allalou, S.; Kheribet, R.; Benmounah, A. Effects of calcined halloysite nano-clay on the mechanical properties and microstructure of low-clinker cement mortar. Case Stud. Constr. Mater. 2019, 10, e00213. [Google Scholar] [CrossRef]
- Jura, J.; Ulewicz, M. Assessment of the Possibility of Using Fly Ash from Biomass Combustion for Concrete. Materials 2021, 14, 6708. [Google Scholar] [CrossRef]
- Lisuzzo, L.; Cavallaro, G.; Milioto, S.; Lazzara, G. Halloysite nanotubes filled with MgO for paper reinforcement and deacidification. Appl. Clay Sci. 2021, 213, 106231. [Google Scholar] [CrossRef]
- Wei Chong, B.; Othman, R.; Jaya, R.P.; Shu Ing, D.; Li, X.; Wan Ibrahim, M.H.; Abdullah, M.M.A.B.; Sandu, A.V.; Płoszaj, B.; Szmidla, J.; et al. Image Analysis of Surface Porosity Mortar Containing Processed Spent Bleaching Earth. Materials 2021, 14, 1658. [Google Scholar] [CrossRef]
- Wei Chong, B.; Othman, R.; Sheng, T.W.; Ramadhansyah, P.J.; Abdullah, M.M.A.B. Properties of Mortar with Waste Tyre Rubber as Partial Sand Replacement. Key Eng. Mater. 2021, 879, 49–61. [Google Scholar]
- Zahabizadeh, B.; Pereira, J.; Gonçalves, C.; Pereira, E.N.B.; Cunha, V.M.C.F. Influence of the printing direction and age on the mechanical properties of 3D printed concrete. Mater. Struct. 2021, 54, 25. [Google Scholar] [CrossRef]
- Wolfs, R.J.M.; Bos, F.P.; Salet, T.A.M. Hardened properties of 3D printed concrete: The influence of process parameters on interlayer adhesion. Cem. Concr. Res. 2019, 119, 132–140. [Google Scholar] [CrossRef]
- Rahul, A.V.; Santhanam, M.; Meena, H.; Ghani, Z. Mechanical characterization of 3D printable concrete. Constr. Build. Mater. 2019, 227, 116710. [Google Scholar] [CrossRef]
- Sanjayan, J.G.; Nematollahi, B.; Xia, M.; Marchment, T. Effect of surface moisture on inter-layer strength of 3D printed concrete. Constr. Build. Mater. 2018, 172, 468–475. [Google Scholar] [CrossRef]
- Panda, B.; Chandra Paul, S.; Jen Tan, M. Anisotropic mechanical performance of 3D printed fiber reinforced sustainable construction material. Mater. Lett. 2017, 209, 146–149. [Google Scholar] [CrossRef]
- Zhang, Y.; Zhang, Y.; She, W.; Yang, L.; Liu, G.; Yang, Y. Rheological and harden properties of the high-thixotropy 3D printing concrete. Constr. Build. Mater. 2019, 201, 278–285. [Google Scholar] [CrossRef]
- Le, T.T.; Austin, S.A.; Lim, S.; Buswell, R.A.; Law, R.; Gibb, A.G.F.; Thorpe, T. Hardened properties of high-performance printing concrete. Cem. Concr. Res. 2012, 42, 558–566. [Google Scholar] [CrossRef] [Green Version]
- Kaszyńska, M.; Skibicki, S.; Hoffmann, M. 3D Concrete Printing for Sustainable Construction. Energies 2020, 13, 6351. [Google Scholar] [CrossRef]
- Shakor, P.; Nejadi, S.; Sutjipto, S.; Paul, G.; Gowripalan, N. Effects of deposition velocity in the presence/absence of E6-glass fibre on extrusion-based 3D printed mortar. Addit. Manuf. 2020, 32, 101069. [Google Scholar] [CrossRef]
- Khalil, N.; Aouad, G.; El Cheikh, K.; Rémond, S. Use of calcium sulfoaluminate cements for setting control of 3D-printing mortars. Constr. Build. Mater. 2017, 157, 382–391. [Google Scholar] [CrossRef]
- Jianchao, Z.; Zhang, T.; Faried, M.; Wengang, C.; Shanableh, A.; Maalej, M.; Barakat, S.; Omar, M.; Al-Toubat, S.; Al-Ruzouq, R.; et al. 3D printing cement based ink, and it’s application within the construction industry. MATEC Web Conf. 2017, 120, 2003. [Google Scholar] [CrossRef] [Green Version]
- Nerella, V.N.; Krause, M.; Näther, M.; Mechtcherine, V. Studying printability of fresh concrete for formwork free Concrete on-site 3D Printing technology (CONPrint3D). In Proceedings of the 25th Conference on Rheology of Building Materials, Regensburg, Germany, 2–3 March 2016. [Google Scholar]
- Paul, S.C.; Tay, Y.W.D.; Panda, B.; Tan, M.J. Fresh and hardened properties of 3D printable cementitious materials for building and construction. Arch. Civ. Mech. Eng. 2018, 18, 311–319. [Google Scholar] [CrossRef]
- Wolfs, R.J.M.; Suiker, A.S.J. Structural failure during extrusion-based 3D printing processes. Int. J. Adv. Manuf. Technol. 2019, 104, 565–584. [Google Scholar] [CrossRef] [Green Version]
- Perrot, A.; Rangeard, D.; Pierre, A. Structural built-up of cement-based materials used for 3D-printing extrusion techniques. Mater. Struct. 2016, 49, 1213–1220. [Google Scholar] [CrossRef]
- Hoffmann, M.; Skibicki, S.; Pankratow, P.; Zieliński, A.; Pajor, M.; Techman, M. Automation in the Construction of a 3D-Printed Concrete Wall with the Use of a Lintel Gripper. Materials 2020, 13, 1800. [Google Scholar] [CrossRef] [Green Version]
- Kaszynska, M.; Hoffmann, M.; Skibicki, S.; Zielinski, A.; Techman, M.; Olczyk, N.; Wróblewski, T. Evaluation of suitability for 3D printing of high performance concretes. MATEC Web Conf. 2018, 163, 1002. [Google Scholar] [CrossRef]
- Skibicki, S.; Pultorak, M.; Kaszynska, M. Evaluation of Material Modification using PET in 3D Concrete Printing Technology. IOP Conf. Ser. Mater. Sci. Eng. 2021, 1044, 12002. [Google Scholar] [CrossRef]
- Ding, T.; Xiao, J.; Qin, F.; Duan, Z. Mechanical behavior of 3D printed mortar with recycled sand at early ages. Constr. Build. Mater. 2020, 248, 118654. [Google Scholar] [CrossRef]
- Nguyen-Van, V.; Panda, B.; Zhang, G.; Nguyen-Xuan, H.; Tran, P. Digital design computing and modelling for 3-D concrete printing. Autom. Constr. 2021, 123, 103529. [Google Scholar] [CrossRef]
- Panda, B.; Lim, J.H.; Tan, M.J. Mechanical properties and deformation behaviour of early age concrete in the context of digital construction. Compos. Part B Eng. 2019, 165, 563–571. [Google Scholar] [CrossRef]
- Federowicz, K.; Techman, M.; Sanytsky, M.; Sikora, P. Modification of Lightweight Aggregate Concretes with Silica Nanoparticles-A Review. Materials 2021, 14, 4242. [Google Scholar] [CrossRef]
- van den Heever, M.; Bester, F.; Kruger, J.; van Zijl, G. Mechanical characterisation for numerical simulation of extrusion-based 3D concrete printing. J. Build. Eng. 2021, 44, 102944. [Google Scholar] [CrossRef]
- Nematollahi, B.; Vijay, P.; Sanjayan, J.; Nazari, A.; Xia, M.; Naidu Nerella, V.; Mechtcherine, V. Effect of Polypropylene Fibre Addition on Properties of Geopolymers Made by 3D Printing for Digital Construction. Materials 2018, 11, 2352. [Google Scholar] [CrossRef] [Green Version]
- Du, X.; Jin, L.; Ma, G. Macroscopic effective mechanical properties of porous dry concrete. Cem. Concr. Res. 2013, 44, 87–96. [Google Scholar] [CrossRef]
- Wu, Y.-C.; Yang, Q.; Kong, X.; Zhi, P.; Xiao, J. Uncertainty quantification for the representative volume element of geometrically monoclinic 3D printed concrete. Int. J. Solids Struct. 2021, 226–227, 111102. [Google Scholar] [CrossRef]
- Xiao, J.; Li, W.; Corr, D.J.; Shah, S.P. Simulation Study on the Stress Distribution in Modeled Recycled Aggregate Concrete under Uniaxial Compression. J. Mater. Civ. Eng. 2013, 25, 504–518. [Google Scholar] [CrossRef]
- Kim, K.; Park, S.; Kim, W.; Jeong, Y.; Lee, J. Evaluation of Shear Strength of RC Beams with Multiple Interfaces Formed before Initial Setting Using 3D Printing Technology. Materials 2017, 10, 1349. [Google Scholar] [CrossRef] [Green Version]
- Marchment, T.; Sanjayan, J.G.; Nematollahi, B.; Xia, M. Interlayer Strength of 3D Printed Concrete. In 3D Concrete Printing Technology; Sanjayan, J., Nazari, A., Nematollahi, B., Eds.; Elsevier: Amsterdam, The Netherlands, 2019; pp. 241–264. ISBN 9780128154816. [Google Scholar]
- Panda, B.; Paul, S.C.; Mohamed, N.A.N.; Tay, Y.W.D.; Tan, M.J. Measurement of tensile bond strength of 3D printed geopolymer mortar. Measurement 2018, 113, 108–116. [Google Scholar] [CrossRef]
- Zareiyan, B.; Khoshnevis, B. Effects of interlocking on interlayer adhesion and strength of structures in 3D printing of concrete. Autom. Constr. 2017, 83, 212–221. [Google Scholar] [CrossRef]
- Feng, P.; Meng, X.; Chen, J.-F.; Ye, L. Mechanical properties of structures 3D printed with cementitious powders. Constr. Build. Mater. 2015, 93, 486–497. [Google Scholar] [CrossRef] [Green Version]
- EN 12390-13:2014-02. Testing Hardened Concrete—Determination of Secant Modulus of Elasticity in Compression.
- Kaszynska, M.; Olczyk, N.; Techman, M.; Skibicki, S.; Zielinski, A.; Filipowicz, K.; Wróblewski, T.; Hoffmann, M. Thermal-humidity parameters of 3D printed wall. IOP Mater. Sci. Eng. 2019, 471, 082018. [Google Scholar]
- EN 1015-3:2000. Methods of Test for Mortar for Masonry—Part 3: Determination of Consistence of Fresh Mortar (by Flow Table).
- Cho, S.; Kruger, J.; Bester, F.; van den Heever, M.; van Rooyen, A.; van Zijl, G. A Compendious Rheo-Mechanical Test for Printability Assessment of 3D Printable Concrete. In Proceedings of the Second RILEM International Conference on Concrete and Digital Fabrication; Bos, F.P., Lucas, S.S., Wolfs, R.J.M., Salet, T.A.M., Eds.; Springer International Publishing: Cham, Switzerland, 2020; pp. 196–205. ISBN 978-3-030-49916-7. [Google Scholar]
- Casagrande, L.; Esposito, L.; Menna, C.; Asprone, D.; Auricchio, F. Effect of testing procedures on buildability properties of 3D-printable concrete. Constr. Build. Mater. 2020, 245, 118286. [Google Scholar] [CrossRef]
- Chougan, M.; Ghaffar, S.H.; Sikora, P.; Chung, S.-Y.; Rucinska, T.; Stephan, D.; Albar, A.; Swash, M.R. Investigation of additive incorporation on rheological, microstructural and mechanical properties of 3D printable alkali-activated materials. Mater. Des. 2021, 202, 109574. [Google Scholar] [CrossRef]
- Sikora, P.; Chung, S.-Y.; Liard, M.; Lootens, D.; Dorn, T.; Kamm, P.H.; Stephan, D.; Abd Elrahman, M. The effects of nanosilica on the fresh and hardened properties of 3D printable mortars. Constr. Build. Mater. 2021, 281, 122574. [Google Scholar] [CrossRef]
- Roussel, N.; Lanos, C. Plastic Fluid Flow Parameters Identification Using a Simple Squeezing Test. Appl. Rheol. 2003, 13, 132–141. [Google Scholar] [CrossRef]
- Toutou, Z.; Roussel, N.; Lanos, C. The squeezing test: A tool to identify firm cement-based material’s rheological behaviour and evaluate their extrusion ability. Cem. Concr. Res. 2005, 35, 1891–1899. [Google Scholar] [CrossRef]
- EN 12390-3:2019. Testing Hardened Concrete—Part 3: Compressive Strength of Test Specimens.
- Duballet, R.; Baverel, O.; Dirrenberger, J. Classification of building systems for concrete 3D printing. Autom. Constr. 2017, 83, 247–258. [Google Scholar] [CrossRef] [Green Version]
- Wolfs, R.J.M.; Bos, F.P.; Salet, T.A.M. Early age mechanical behaviour of 3D printed concrete: Numerical modelling and experimental testing. Cem. Concr. Res. 2018, 106, 103–116. [Google Scholar] [CrossRef]
- Wolfs, R.J.M.; Bos, F.P.; Salet, T.A.M. Triaxial compression testing on early age concrete for numerical analysis of 3D concrete printing. Cem. Concr. Compos. 2019, 104, 103344. [Google Scholar] [CrossRef]
- Li, Z.; Hojati, M.; Wu, Z.; Piasente, J.; Ashrafi, N.; Duarte, J.P.; Nazarian, S.; Bilén, S.G.; Memari, A.M.; Radlińska, A. Fresh and Hardened Properties of Extrusion-Based 3D-Printed Cementitious Materials: A Review. Sustainability 2020, 12, 5628. [Google Scholar] [CrossRef]
- EN 1992-1-1:2004 + A1:2014 Eurocode 2: Design of Concrete Structures.


| Chemical Composition | CEM I 52.5 R [%] | Fly Ash [%] | Silica Fume [%] |
|---|---|---|---|
| SiO2 | 19.70 | 54.00 | 94.00 |
| Al2O3 | 4.93 | 28.40 | – |
| Fe2O3 | 2.54 | 7.30 | – |
| CaO | 64.23 | 3.10 | 0.30 |
| CaCo3 | – | – | – |
| MgO | 1.32 | 2.40 | – |
| SO3 | 2.91 | 0.40 | 1.90 |
| Na2O | 0.12 | 1.10 | – |
| K2O | 0.76 | 2.90 | – |
| Cl– | 0.07 | 0.01 | 0.10 |
| H2O | – | – | 0.70 |
| Na20eq | 0.63 | – | – |
| LOI | – | – | 3.00 |
| Material | Amount [kg/m3] |
|---|---|
| Cement CEM I 52.5R | 580 |
| Fly Ash | 166 |
| Silica Fume | 83 |
| Aggregate 0–2 mm | 1335 |
| Water | 200 |
| Water-reducing admixture | 1.9 |
| Group | Type | Diameter [mm] | Height [mm] | Number of Layers |
|---|---|---|---|---|
| I | STDR | 150 | 300 | - |
| 3DP_M | 150 | 300 ± 10 | 20 ± 1 | |
| 3DP_F | 150 ± 10 | 300 ± 10 | 20 ± 1 | |
| II | 3DP_C_44 | 44 | 90 ± 10 | 6 ± 1 |
| 3DP_C_74 | 74 | 160 ± 10 | 11 ± 1 | |
| 3DP_C_99 | 99 | 200 ± 10 | 13 ± 1 | |
| 3DP_C_144 | 144 | 300 ± 10 | 20 ± 1 |
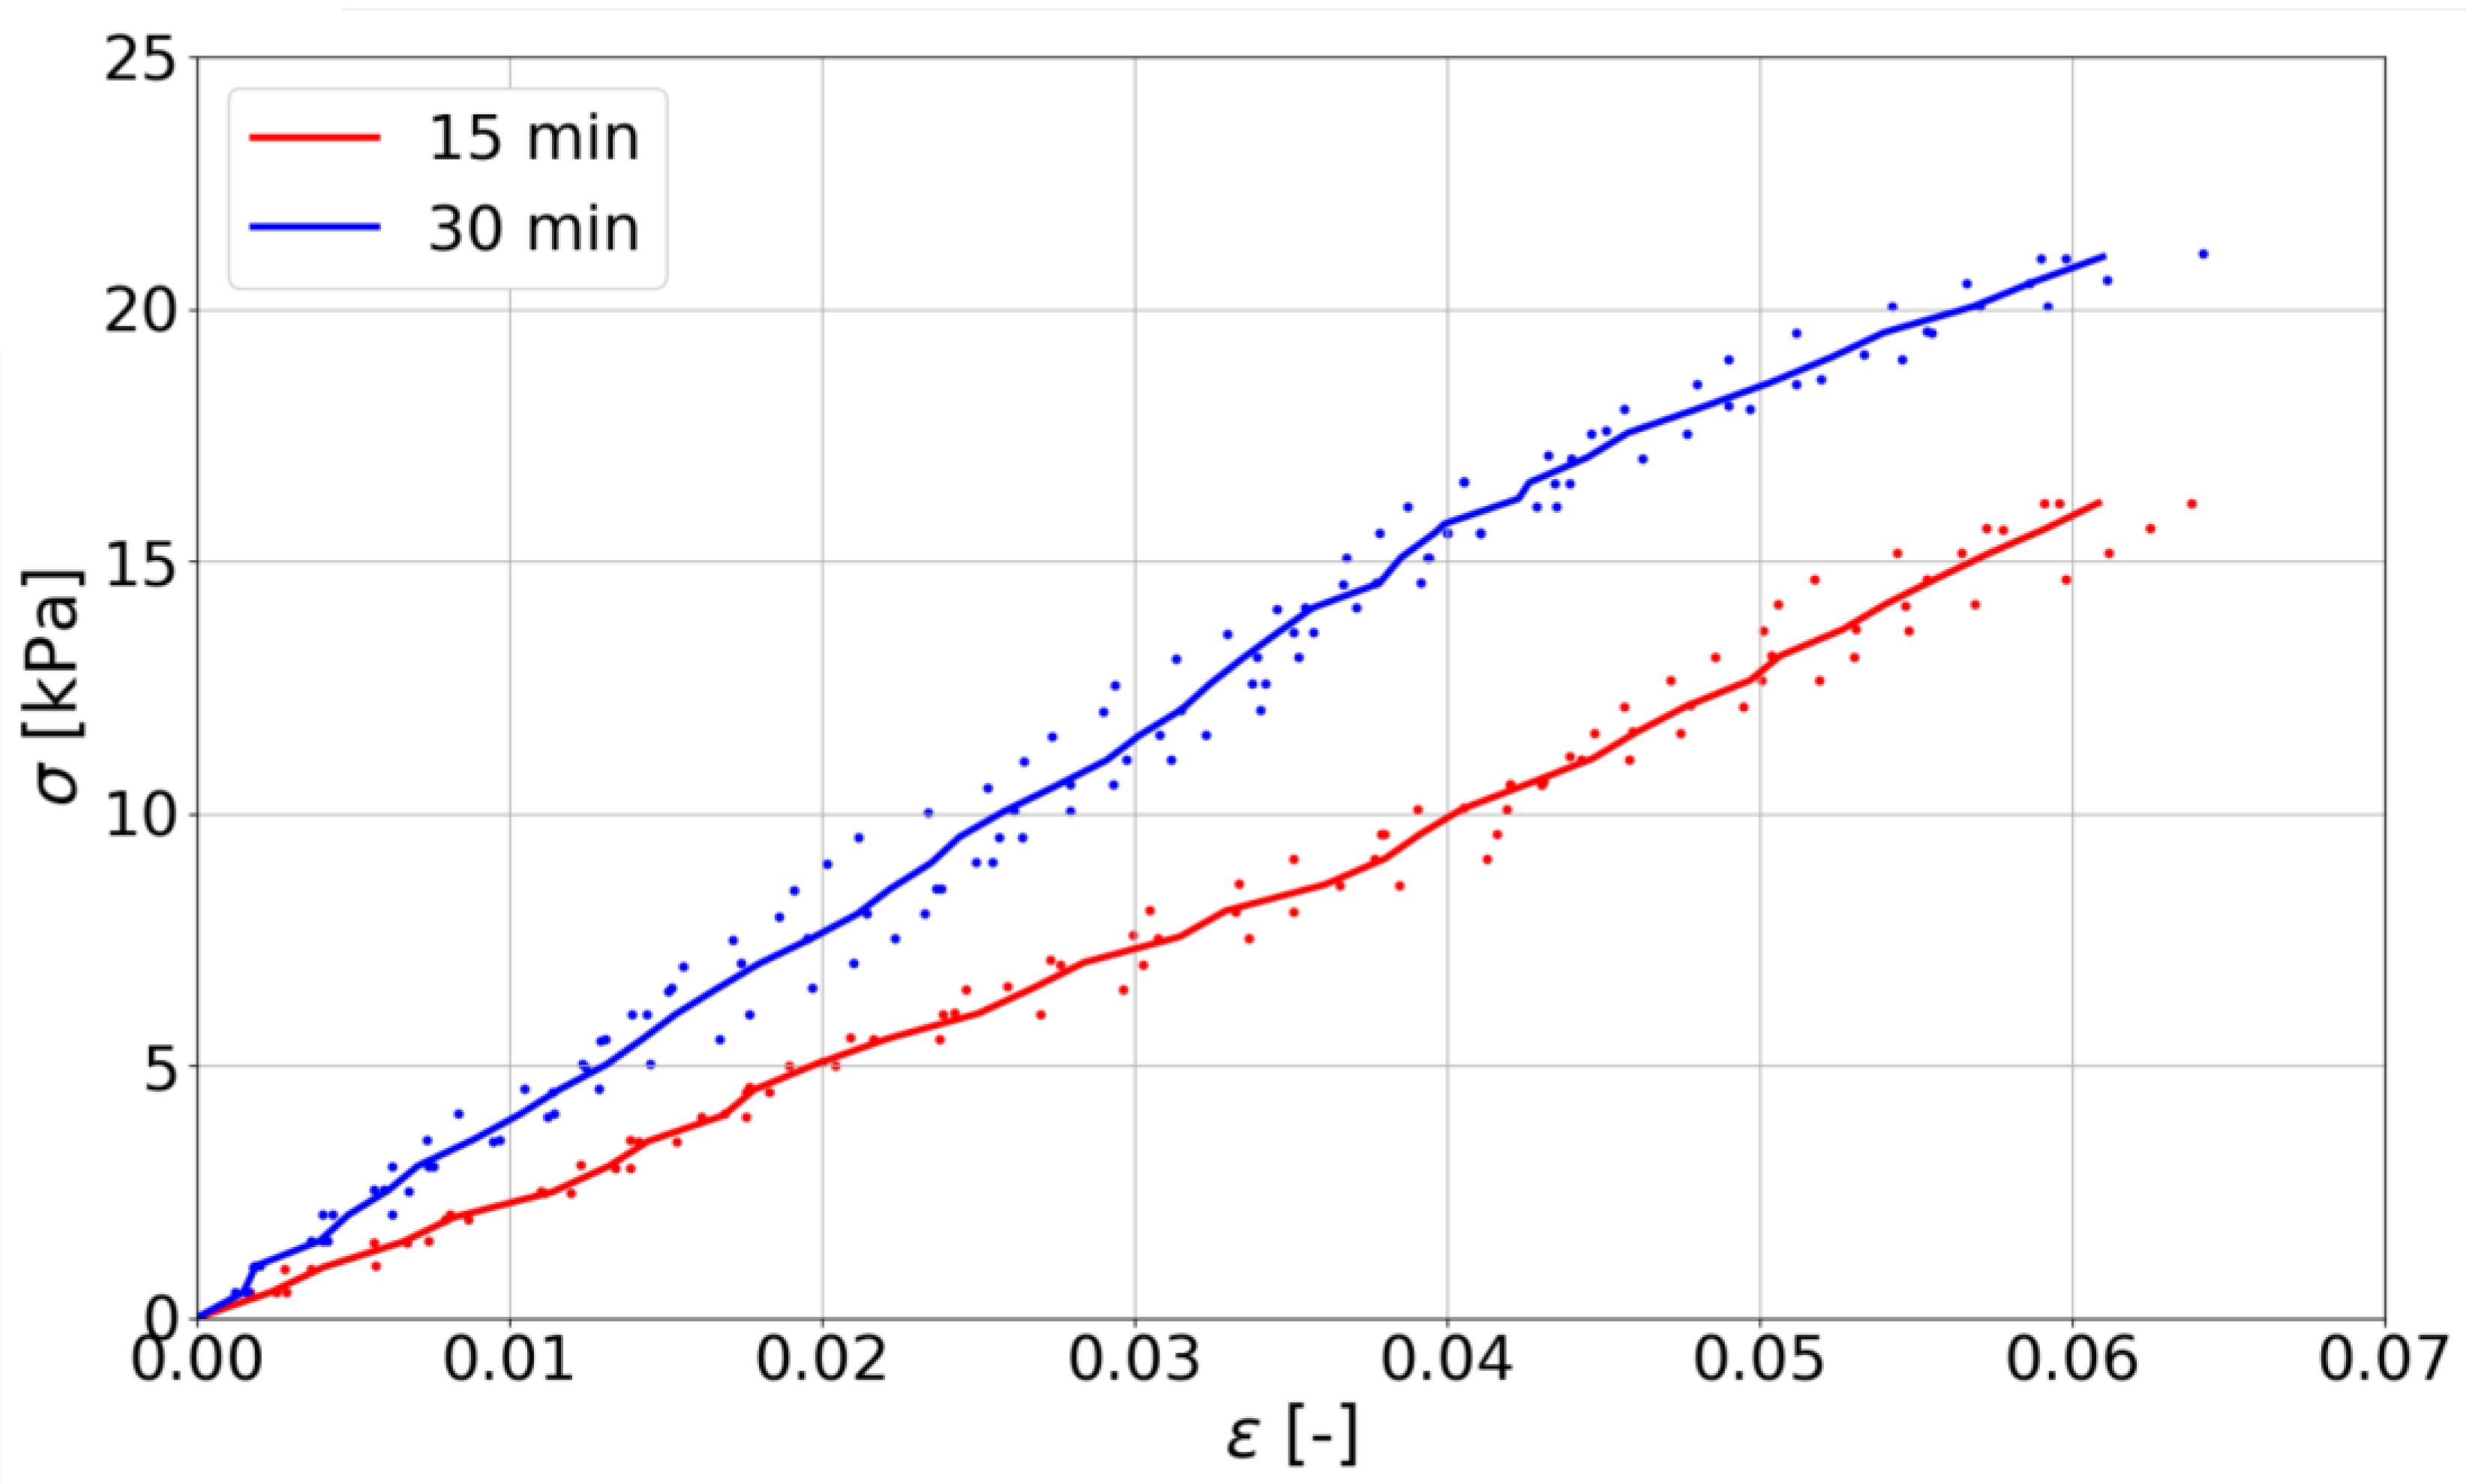
| Time | Green Strength [kPa] | Young’s Modulus [kPa] | ||
|---|---|---|---|---|
| Mean [kPa] | CoV [%] | Mean [kPa] | CoV [%] | |
| 15 min | 16.15 | 4.30 | 263.00 | 3.88 |
| 30 min | 21.03 | 3.20 | 359.32 | 3.52 |
| Specimen | fcm [MPa] | CoV [%] | Ecm [GPa] | CoV [%] | CoV [%] | ||||
|---|---|---|---|---|---|---|---|---|---|
| STDR | 85.72 | 5.5% | - | 39.93 | 1.7% | - | 0.19 | 3.5% | - |
| 3DP_M | 65.03 | 6.5% | −24.1% | 38.25 | 2.4% | −4.2% | 0.19 | 9.2% | 4.7% |
| 3DP_F | 48.77 | 7.2% | −43.1% | 32.01 | 6.8% | −19.8% | 0.21 | 7.4% | 13.3% |
| 3DP_C_44 (C_44) | 75.42 | 9.8% | −12.0% | 36.15 | 7.5% | −9.5% | 0.18 | 6.5% | −2.8% |
| 3DP_C_74 (C_74) | 68.17 | 6.6% | −20.5% | 35.71 | 5.0% | −10.6% | 0.18 | 8.5% | −3.0% |
| 3DP_C_99 (C_99) | 63.01 | 7.5% | −26.5% | 33.70 | 5.9% | −15.6% | 0.17 | 9.5% | −7.5% |
| 3DP_C_144 (C_144) | 60.18 | 5.5% | −29.8% | 32.44 | 1.7% | −18.8% | 0.20 | 7.5% | 6.7% |
Publisher’s Note: MDPI stays neutral with regard to jurisdictional claims in published maps and institutional affiliations. |
© 2021 by the authors. Licensee MDPI, Basel, Switzerland. This article is an open access article distributed under the terms and conditions of the Creative Commons Attribution (CC BY) license (https://creativecommons.org/licenses/by/4.0/).
Share and Cite
Skibicki, S.; Techman, M.; Federowicz, K.; Olczyk, N.; Hoffmann, M. Experimental Study of Hardened Young’s Modulus for 3D Printed Mortar. Materials 2021, 14, 7643. https://doi.org/10.3390/ma14247643
Skibicki S, Techman M, Federowicz K, Olczyk N, Hoffmann M. Experimental Study of Hardened Young’s Modulus for 3D Printed Mortar. Materials. 2021; 14(24):7643. https://doi.org/10.3390/ma14247643
Chicago/Turabian StyleSkibicki, Szymon, Mateusz Techman, Karol Federowicz, Norbert Olczyk, and Marcin Hoffmann. 2021. "Experimental Study of Hardened Young’s Modulus for 3D Printed Mortar" Materials 14, no. 24: 7643. https://doi.org/10.3390/ma14247643
APA StyleSkibicki, S., Techman, M., Federowicz, K., Olczyk, N., & Hoffmann, M. (2021). Experimental Study of Hardened Young’s Modulus for 3D Printed Mortar. Materials, 14(24), 7643. https://doi.org/10.3390/ma14247643