Article

Synthesis and Characterization of TiO2 Nanotubes (TiO2-NTs) Decorated with Platine Nanoparticles (Pt-NPs): Photocatalytic Performance for Simultaneous Removal of Microorganisms and Volatile Organic Compounds

1
Department of Chemistry, College of Sciences, Imam Mohammad Ibn Saud Islamic University (IMSIU), P.O. Box 5701, Riyadh 11432, Saudi Arabia
2
Laboratoire de Photovoltaïque, Centre de Recherches et des Technologies de l’Energie, Technopole de Borj-Cédria, BP 95, Hammam-Lif 2050, Tunisia
3
École Nationale Supérieure de Chimie de Rennes, Univ Rennes, CNRS, ISCR (Institut des Sciences Chimiques de Rennes) – UMR 6226, F-35000 Rennes, France
*
Authors to whom correspondence should be addressed.
Materials 2021, 14(23), 7341; https://doi.org/10.3390/ma14237341
Submission received: 22 October 2021 / Revised: 12 November 2021 / Accepted: 26 November 2021 / Published: 30 November 2021
(This article belongs to the Special Issue Advanced Materials and Photoreactors for Environmental Applications)

Abstract

:
This work reports on the effect of TiO2 nanotubes (TiO2-NTs), decorated wih platinum nanoparticles (Pt-NPs), on the removal of bacteria and volatile organic compounds (VOCs). The Pt-NPs were loaded onto the TiO2-NTs using the electrodeposition method at four decoration times (100, 200, 300, and 600 s). The realized Pt-NPs/TiO2-NTs nanocomposites were used for the degradation of cyclohexane, a highly toxic and carcinogenic VOC pollutant in the chemical industry. The achieved Pt-NPs/TiO2-NTs nanocomposites were characterized using X-ray diffraction (XRD), photoluminescence (PL), diffuse reflectance spectroscopy (UV–Vis), and scanning (SEM) and transmission (TEM) electron microscopy. To understand the photocatalytic and antibacterial behavior of the Pt-NPs/TiO2-NTs, simultaneous treatment of Escherichia coli and cyclohexane was conducted while varying the catalyst time decoration. We noticed a complete bacterial inactivation rate with 90% VOC removal within 60 min of visible light irradiation. Moreover, the Langmuir–Hinshelwood model correlated well with the experimental results of the photocatalytic treatment of indoor air.

1. Introduction

Today, humans spend most of their time in confined spaces (homes, transport compartments, and offices). In addition, in a constrained energy context, residential and tertiary buildings are increasingly insulated and airtight. Therefore, indoor air quality (IAQ) is becoming a significant public health concern [1]. Non-specific pollution (linked to human occupation) is characterized by a diffuse and fluctuating pollution according to activities and by a smaller pollutant concentration range (of the order of ppm or ppb) but can be dangerous for health at repetitive and lasting exposure. The main organic compounds involved are formaldehyde, cyclohexane, benzene, and toluene [2]. Moreover, the indoor air of most public spaces (hospitals, libraries, etc.) is highly contaminated according to the European Commission Classification [2,3]. Furthermore, most isolates are considered potential candidates for the establishment of sick building syndromes (SBS) and are often associated with clinical manifestations such as allergies, rhinitis, asthma, and conjunctivitis [3,4]. This SBS can be due to the presence of bacteria, viruses, and pollens. Thus, special attention must be given to controlling the keys environmental factors that lead to the growth and multiplication of microbes in public, closed indoor environments to protect the health of users and workers. This situation forces industrialists to reduce emissions by either revising processes and/or installing their effluents’ purification systems [5]. These are of a great variety, and each has its strengths and weaknesses. Indeed, some systems integrating various purification techniques (mechanical particle and molecular filters, electrostatic filters, and catalysis under UVC irradiation) were tested. The results show a diversity of performance profiles, and the overall treatment efficiencies have been unsatisfactory [3,4,5]. The photocatalytic process with visible light was found to be an indoor air remediation solution using materials, such as catalysts, with antimicrobial effects [6,7,8]. Recently, several studies have been developed around TiO2 tubular nanostructures thanks to their high specific surface area [9], excellent biocompatibility, and high uniformity. Nanoarchitectured titania can be fabricated using a variety of techniques including metalorganic chemical vapor deposition [10], sol-gel synthesis [11], hydrothermal [12], and anodization of titanium [13,14,15,16,17,18,19]. Among these techniques, our interest was focused on the anodization of titanium foil, which enables the achievement of self-organized TiO2 nanotube arrays with the easiness of geometry control (length, diameter, and wall thickness) via application of suitable anodization parameters. The fine-tuning of the dimensional features of the nanotube arrays facilitates their application in various fields, including dye-sensitized solar cells [20], biosensors [21,22], and highly efficient photocatalysis systems [23,24,25]. Despite its ability to be used in various applications TiO2 suffers from its restricted optical absorption in the visible range and the high recombination rate of photogenerated electron–hole pairs. Indeed, TiO2 is a wide band gap (3.2 eV for anatase) semiconductor that absorbs light only in the ultraviolet frequency range, representing only 4% of the solar spectrum [26], which significantly hampers its photocatalytic efficiency in the direct use of sunlight. Consequently, it is essential to develop an effective solution to improve the efficiency of charge separation and the photoactivity of TiO2 nanotubes by doping with metals (Ag [27,28,29,30], Cu, Au, etc.) or sensitizing with metallic nanoparticles or semiconductors (PbS [31,32] and Cu2O [33,34]) or decorating the surface with nanostructured noble metals (Pt [35] and Pd [36]).
This investigation aimed to prepare and characterize Pt-NPs/TiO2-NTs nanocomposites by depositing Pt nanoparticles onto entire TiO2 NTs structures using the electrodeposition method. The photocatalytic efficiency of the Pt/TiO2-NTs under UV–Visible light was studied to remove microorganisms and volatile organic compounds (VOCs). To our knowledge, there is no study on the catalytic activity of Pt/TiO2-NTs for the elimination of double pollution (i.e., microorganisms and VOC) in indoor air.

2. Experimental

2.1. Preparation of TiO2-NTs and Pt/TiO2-NTs Photoelectrodes

2.1.1. Elaboration of Nanotubes by Anodic Oxidation of Ti

TiO2 nanotubular layers were prepared from Ti substrates in the form of square plates having a surface of 2.5 cm × 2.5 cm, a thickness of approximately 1 mm, and 99.7% of purity. Surface preparation of the Ti substrates is essential before proceeding to the oxidation and anodization of titanium. The purpose of this step is to avoid possible adhesion problems and also to make the surface active. In the first step, the titanium substrates were mechanically polished using abrasive paper with different grain sizes, ranging from 320 to 2000, to make the titanium metal surface flat and shiny. In the second step, the obtained substrates were dipped in an acetone bath, then in a methanol bath, and afterward in an ultrapure water bath (15 min for each cleaning step) under ultrasound and at room temperature. Finally, the substrates were air-dried.
The TiO2 nanotubes were elaborated by the electrochemical anodization method in two steps. The first anodization was carried out for 45 min (as a minimum) under a constant voltage of 60 V at a temperature of 25–27 °C in a stirred electrolytic bath containing 100 mL of ethylene glycol (EG), 1% Vol. of ammonium fluoride (NH4F), and 2% Vol. of ultrapure water.
We kept almost the same conditions for the second anodization step and only changed the anodization time from 45 to 120 min. Finally, the TiO2 nanotubular layer formed on the Ti plate was immersed in an isopropan-2-ol (C3H8O) bath under ultrasound for 2 min to enhance the fixation of the nanotubular layer, as the formed nanotubes are very fragile. After, the sample was rinsed well in hot ultrapure water to remove ions resulting from the use of isopropyl alcohol. Finally, it was dried in air.
The crystallization step of the TiO2 nanotubes was achieved after thermal annealing in air for 3 h at 400 °C. In these conditions, we obtained crystallized anatase TiO2, which is known to have the highest photocatalytic activity compared to the other two existing phases (i.e., rutile and brookite).

2.1.2. Decoration of TiO2 NTs with Platinum Nanoparticles
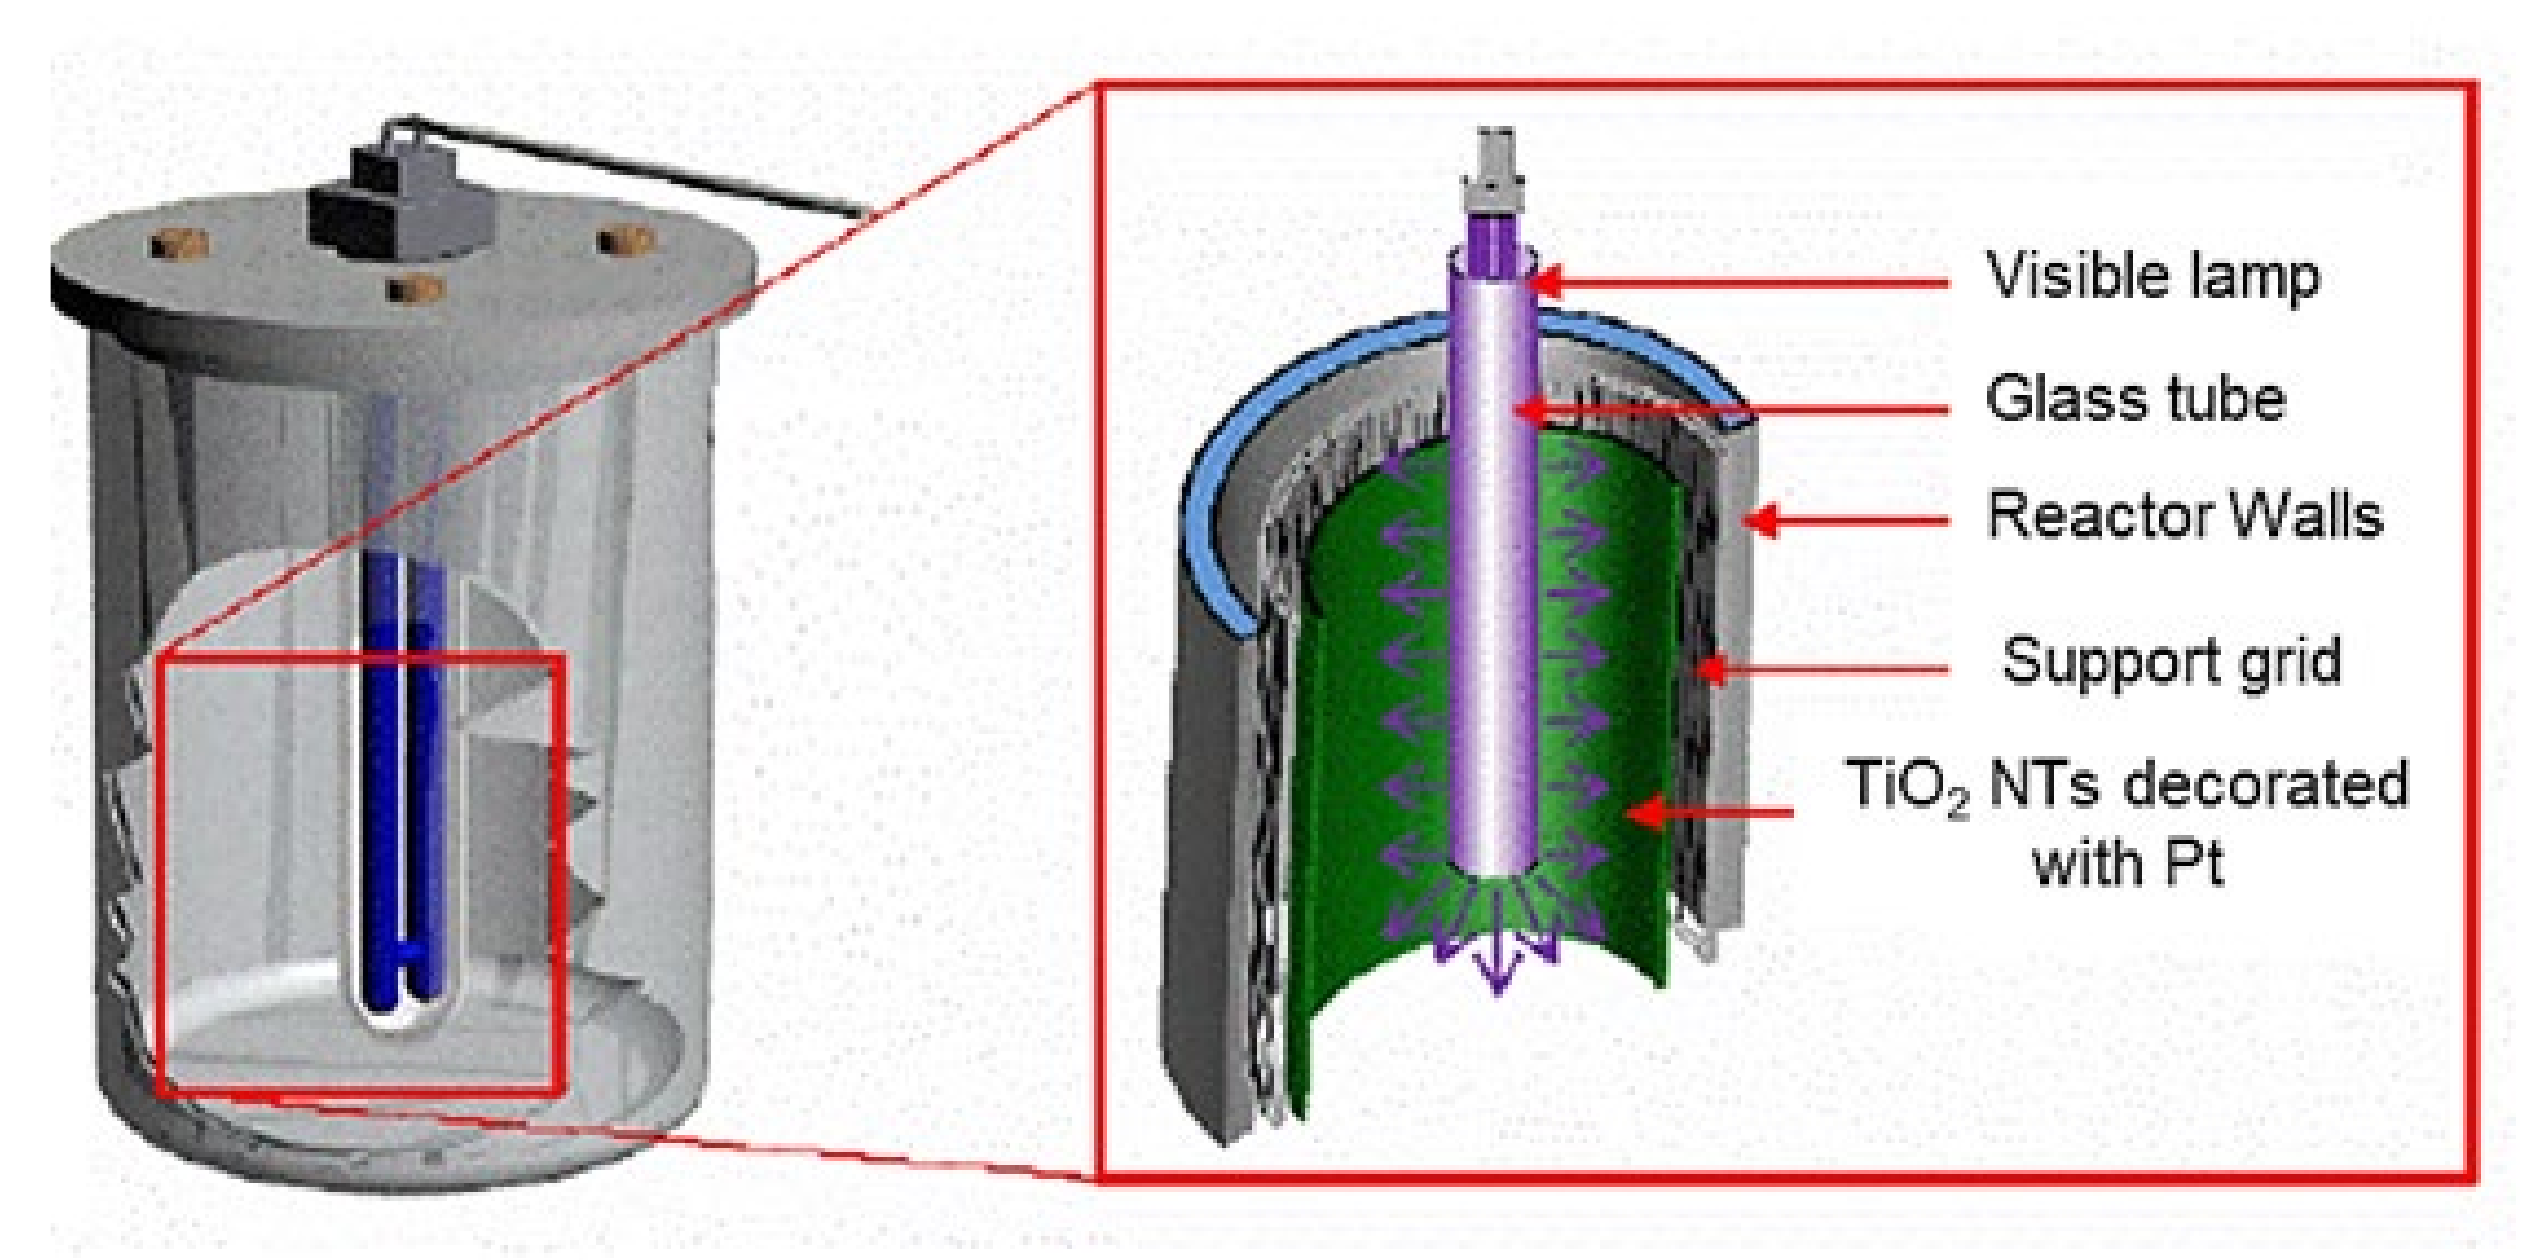
The electrodeposition of Pt nanoparticles on the developed TiO2 NTs substrates was performed using a three-electrode electrochemical cell. The electrodeposition process of Pt-NPs on the TiO2 nanotube substrate (working electrode) was carried out at room temperature at a constant cathodic potential of −0.12 V (vs. Ag/AgCl) for different durations (i.e., 100, 200, and 300 s) while magnetically stirring the electrolyte bath (100 mL). The latter contained 1.5 mL of 3 mM chloroplatinic acid (as a cationic precursor) and 2.75 mL of 0.5 M sulfuric acid. Further details on the synthesis of such Pt/TiO2-NTs composites are illustrated elsewhere [35].

2.2. Batch Reactor

The photocatalytic performances of the TiO2-NTs and Pt-NPs/TiO2-NTs at different deposition times (i.e., 100, 200, and 300 s) were evaluated throughout cyclohexane degradation under visible light irradiation. The catalysts (dimensions: 1.2 cm × 2.5 cm) were placed at the bottom of the photocatalytic reactor. An ultraviolet filter was installed to block ultraviolet radiation. The initial cyclohexane concentration was set at different values of 4–20 mg/m3. The concentration of CYCLO was monitored by gas chromatography using a flame ionization detector (FID) (Focus GC Thermo). Nitrogen was used as a carrier gas. The temperature conditions of the oven, the injection chamber, and the detector were, respectively, 50, 150, and 200 °C. The samples were performed by injection on GC-FID with a 250 µL syringe. Before switching-on the lamp, the assembly was kept in the dark for one hour to achieve the adsorption–desorption equilibrium between the pollutant cyclohexane and the catalyst. The batch reactor is shown in Figure 1. Its height was approximately 150 mm for a volume of 500 mL. The catalytic support was deposited on the tank, and the pollutant was injected into a hermetically closed chamber with a drop and then evaporated under gentle heating. Then, a series of sampling and dilution were carried out to infiltrate the appropriate volume into the reactor according to the desired concentrations (4–20 mg/m3). A magnetic stirrer and a magnetic barrel made it possible to homogenize the gases.

3. Results

3.1. Characterizations of Pt-NPs/TiO2-NTs

Scanning electron microscopy (TESCAN VEGA3) and energy-dispersive X-ray spectroscopy (EDS) were performed to examine the nanostructured morphology and to obtain elemental analysis of the samples. The TEM and HRTEM images were obtained with an FEI Tecnai G20 microscope operating at 200 kV and equipped with a LaB6 filament. The crystalline structure and phase identification of Pt nanoparticles were determined using an X-ray diffractometer (Cu Ka radiation, λ = 1.5406 Å, PANalytical B.V., Almelo, The Netherlands). The reflectivity measurements and spectral absorption were carried out utilizing a PerkinElmer Lambda 950 UV–Visible–NIR spectrophotometer. The photoluminescence (PL) spectra were recorded with a PerkinElmer spectrophotometer equipped with a xenon lamp at an excitation wavelength λ = 340 nm.

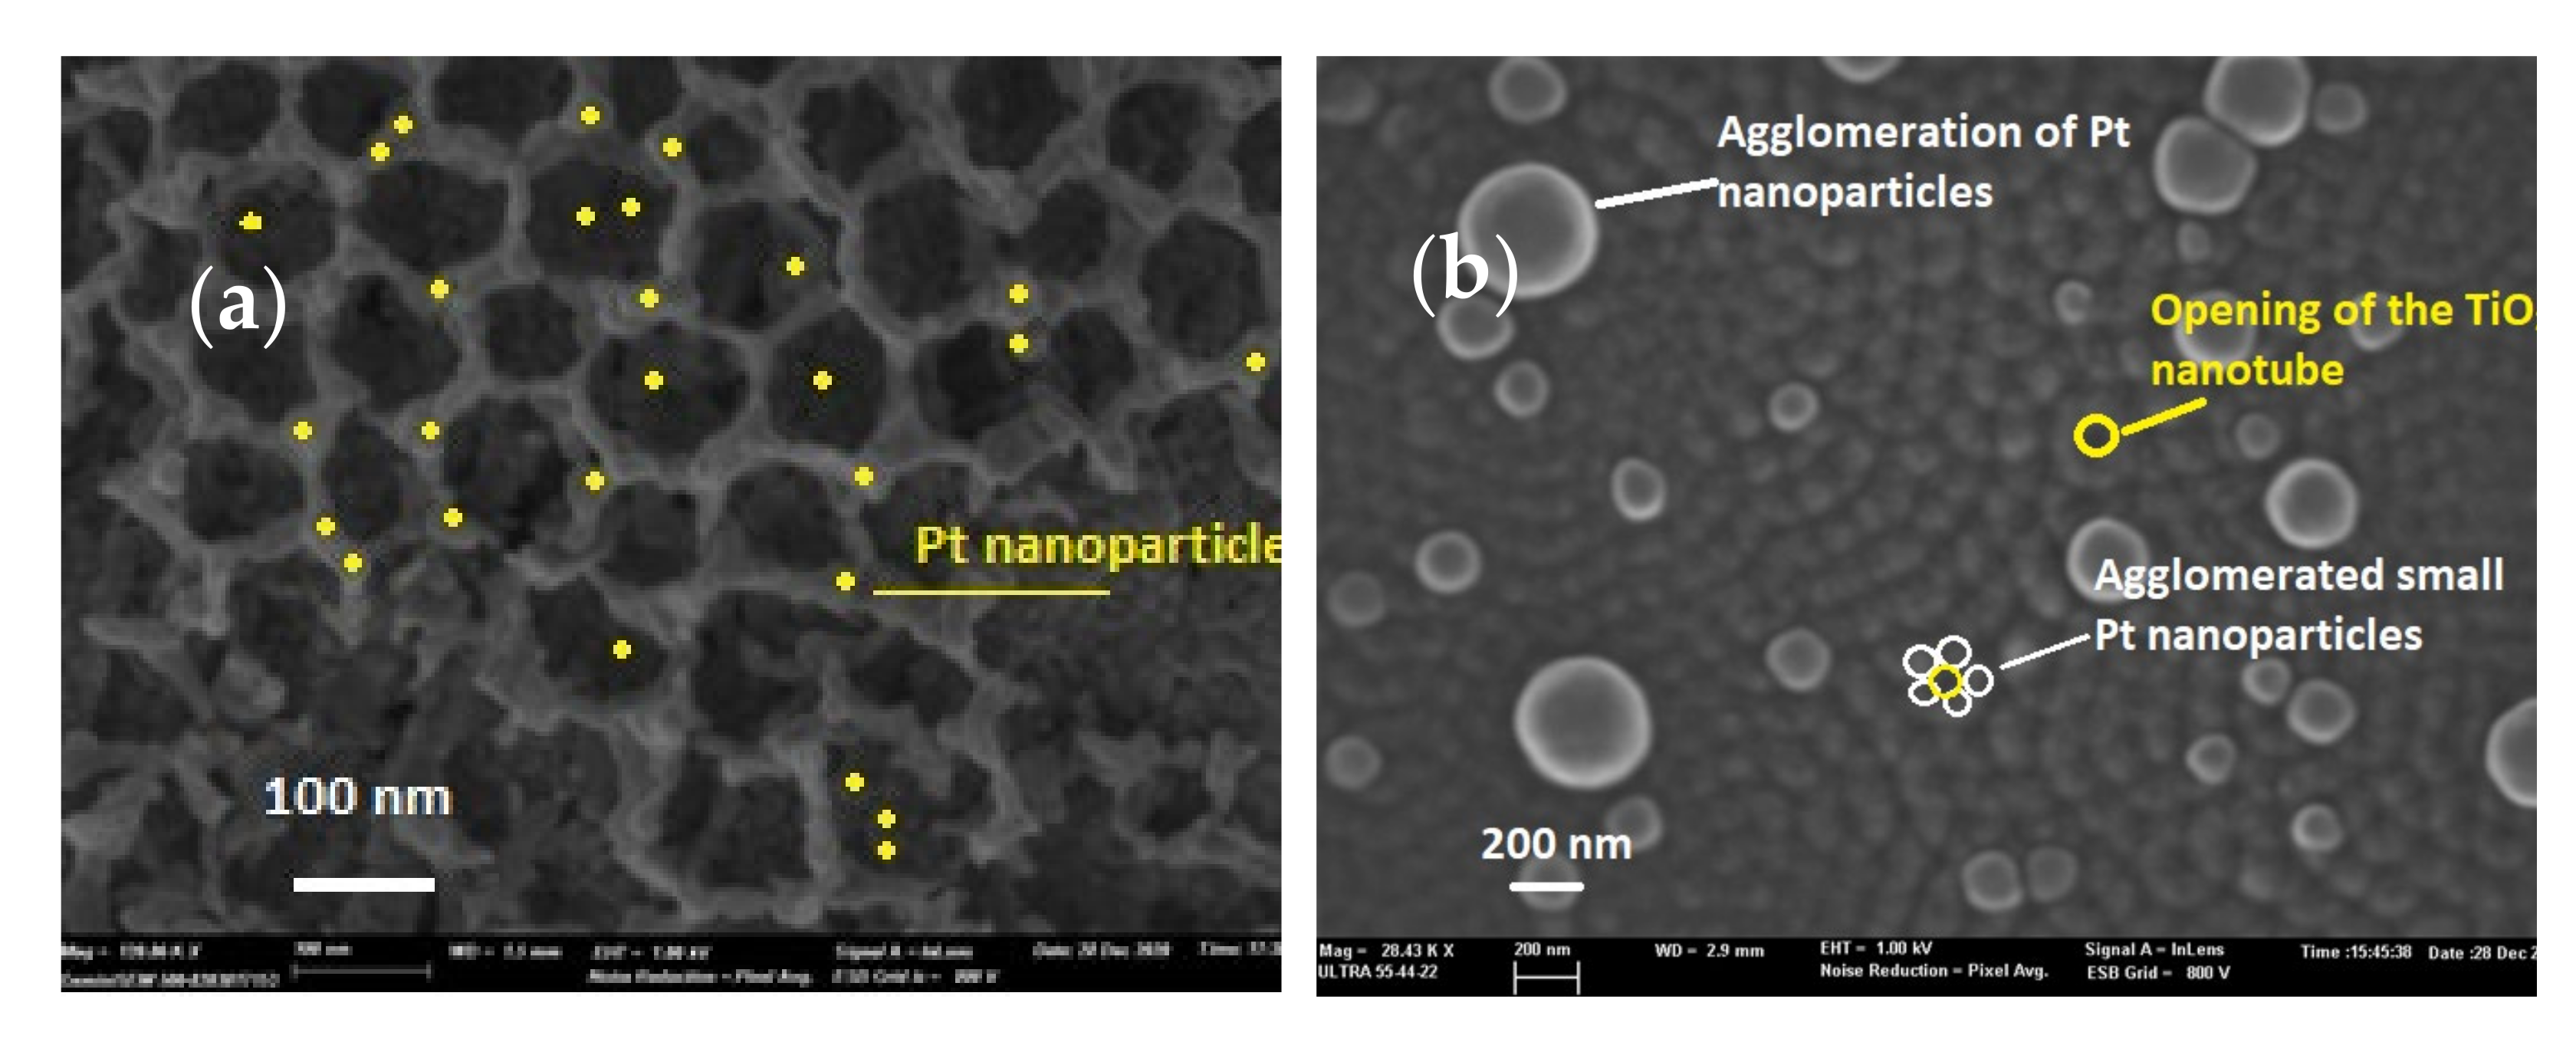
3.1.1. Scanning Electron Microscopy

To study the morphological properties of TiO2-NTs decorated with Pt-NPs, we used SEM and transmission electron microscopy (TEM). Figure 2a exhibits an SEM image of TiO2 nanotubes decorated with Pt nanoparticles electrodeposited over 200 s. This image shows well-formed, well-immobilized, and vertically aligned nanotubular layers on the Ti substrates. The TiO2-NTs had an average diameter size of approximately 100 nm. It should be noted that there existed free and agglomerated Pt-NPs having a size of the order of ~10 nm on the edges and inside the TiO2-NTs.
Figure 2b shows a SEM image of TiO2 nanotubes decorated with Pt nanoparticles electrodeposited over 300 s. Visibly, the Pt-NPs agglomerated further and further as the deposition time increased. In fact, the light spots appearing at a 300 s deposition time were large Pt particles formed from an agglomeration of several NPs. This was the consequence of an increased deposition time, and it was verified by EDX analysis.

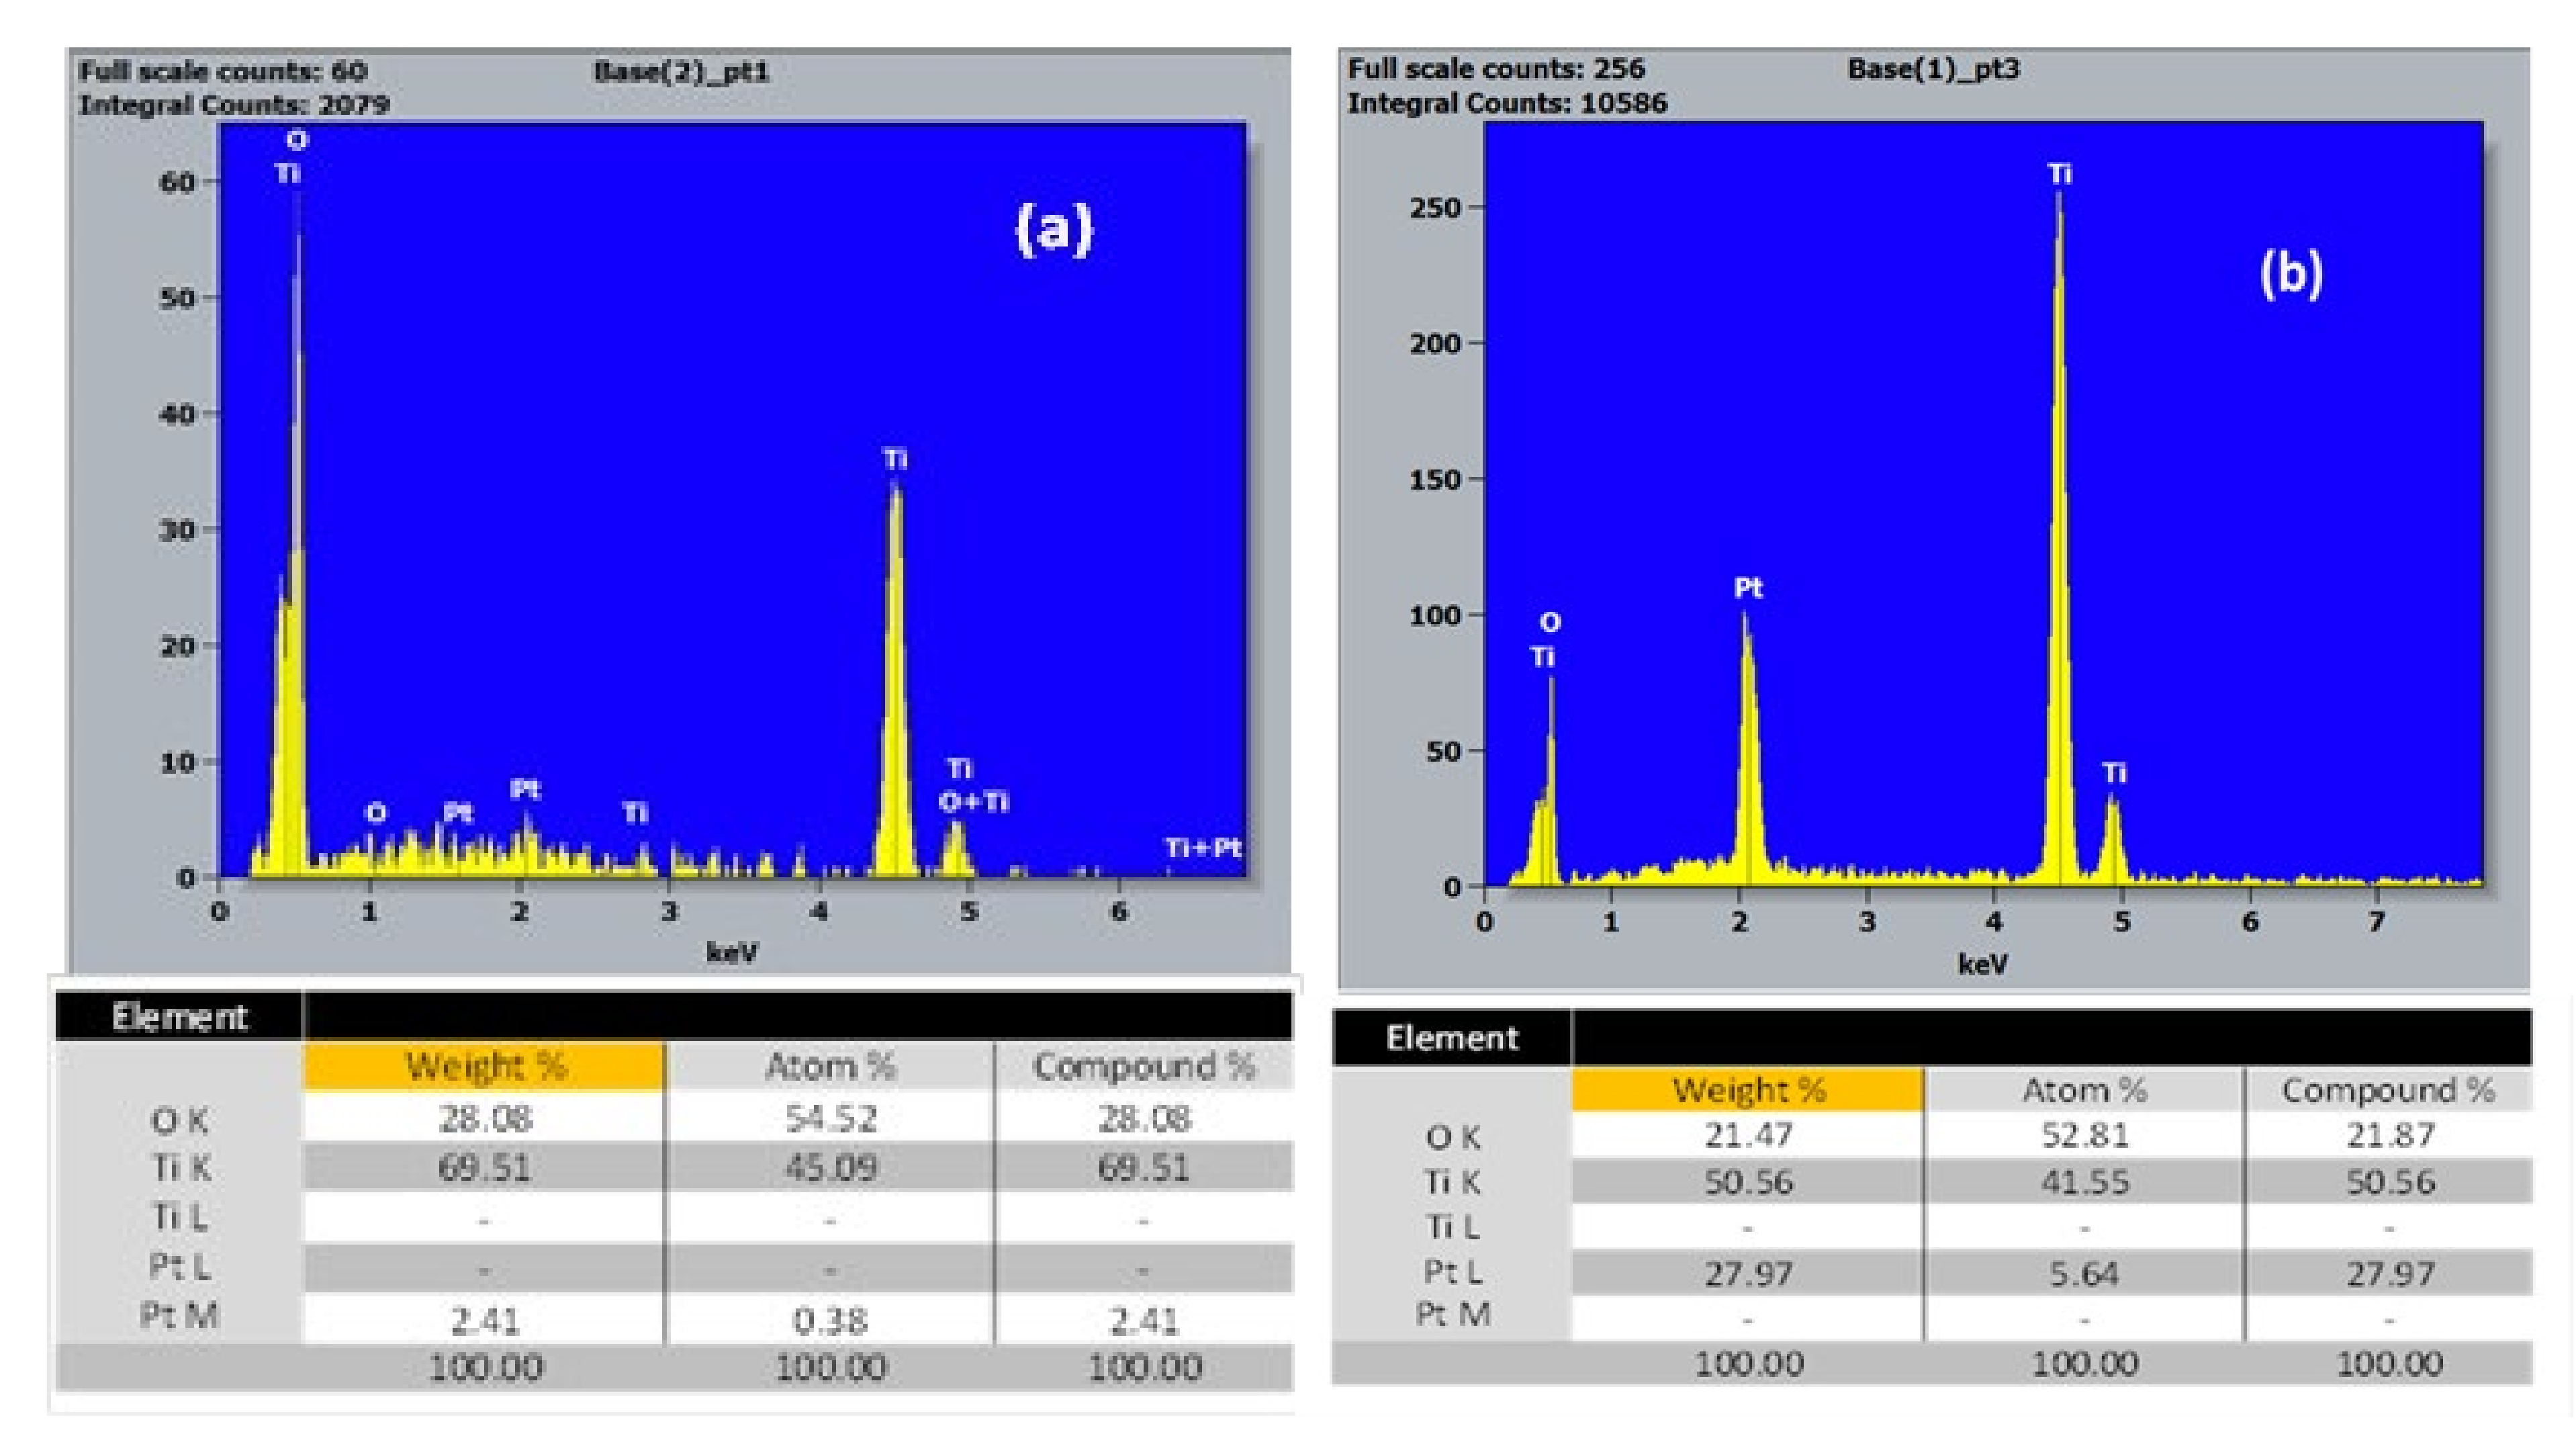
3.1.2. EDX Study of the Chemical Composition of TiO2-NTs Decorated with Pt-NPs

The chemical composition of the TiO2-NTs decorated with Pt-NPs was qualitatively studied by EDX using a microanalyzer coupled to the SEM. Figure 3a,b show the EDX spectrum taken on the wall of one of the TiO2 nanotubes for two different Pt electrodeposition times (i.e., 200 and 600 s).
These EDX spectra revealed the presence of titanium, oxygen, and platinum for both deposition times on the nanotube walls. According to the obtained results, one can notice that the Pt concentration for a 200 s deposition time was negligible compared to that for a deposition time of 600 s. This remarkable increase was due to the formation of Pt-NPs agglomerates and the beginning of the development of a film covering the TiO2 nanotubes.

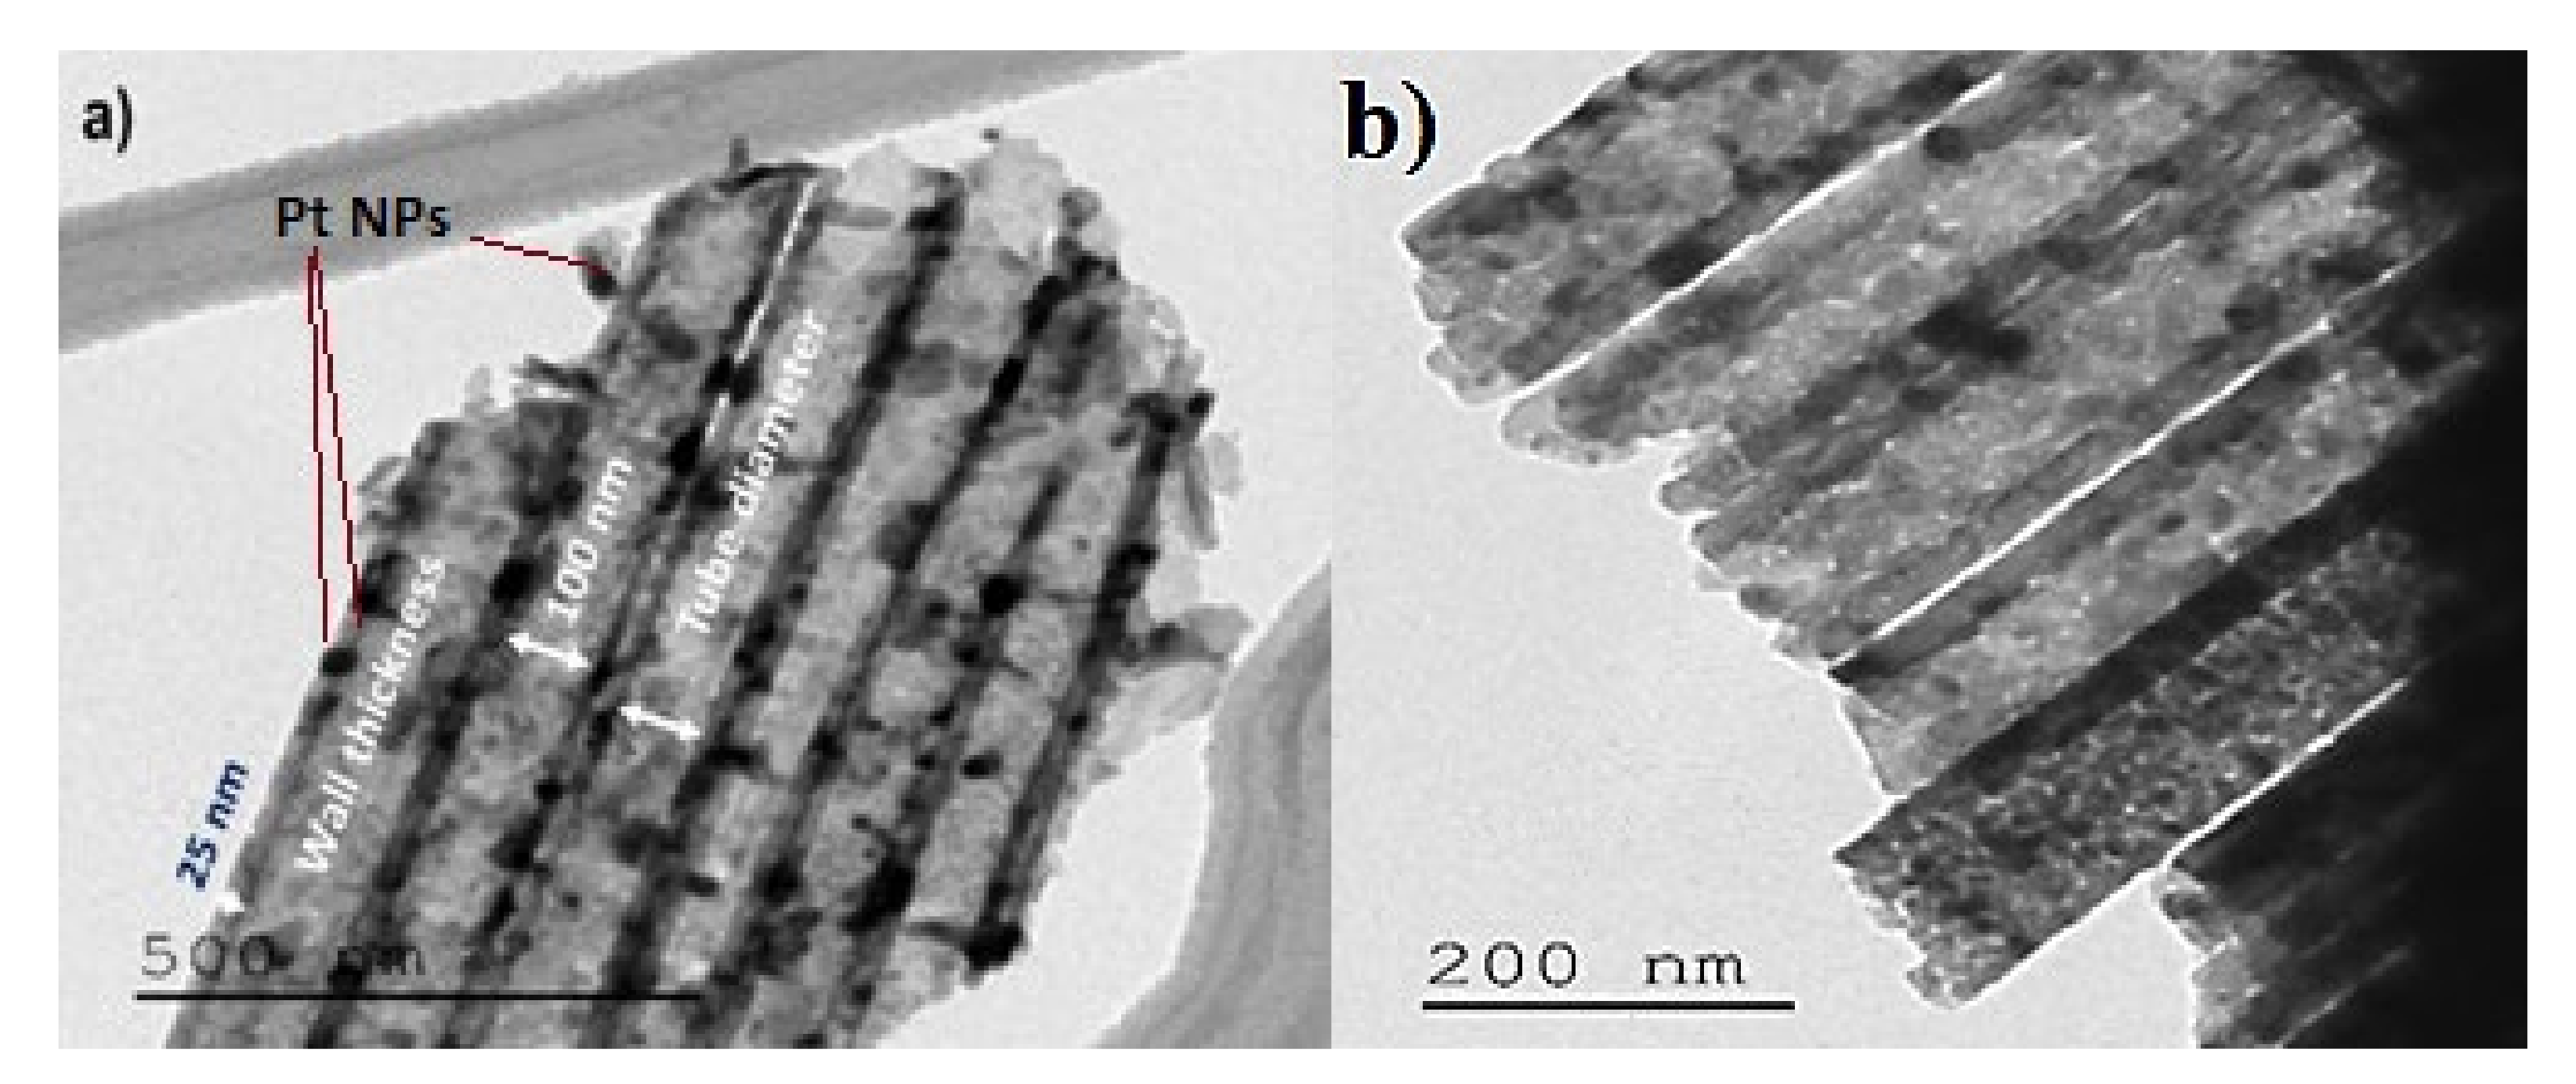
3.1.3. Transmission Electron Microscopy Characterization

TEM images (Figure 4) show that the adopted methodology promoted the formation and growth of highly ordered and structured TiO2 nanotubes, having an average inner diameter of approximately 100 nm and a thickness of nanotube walls of approximately 25 nm.

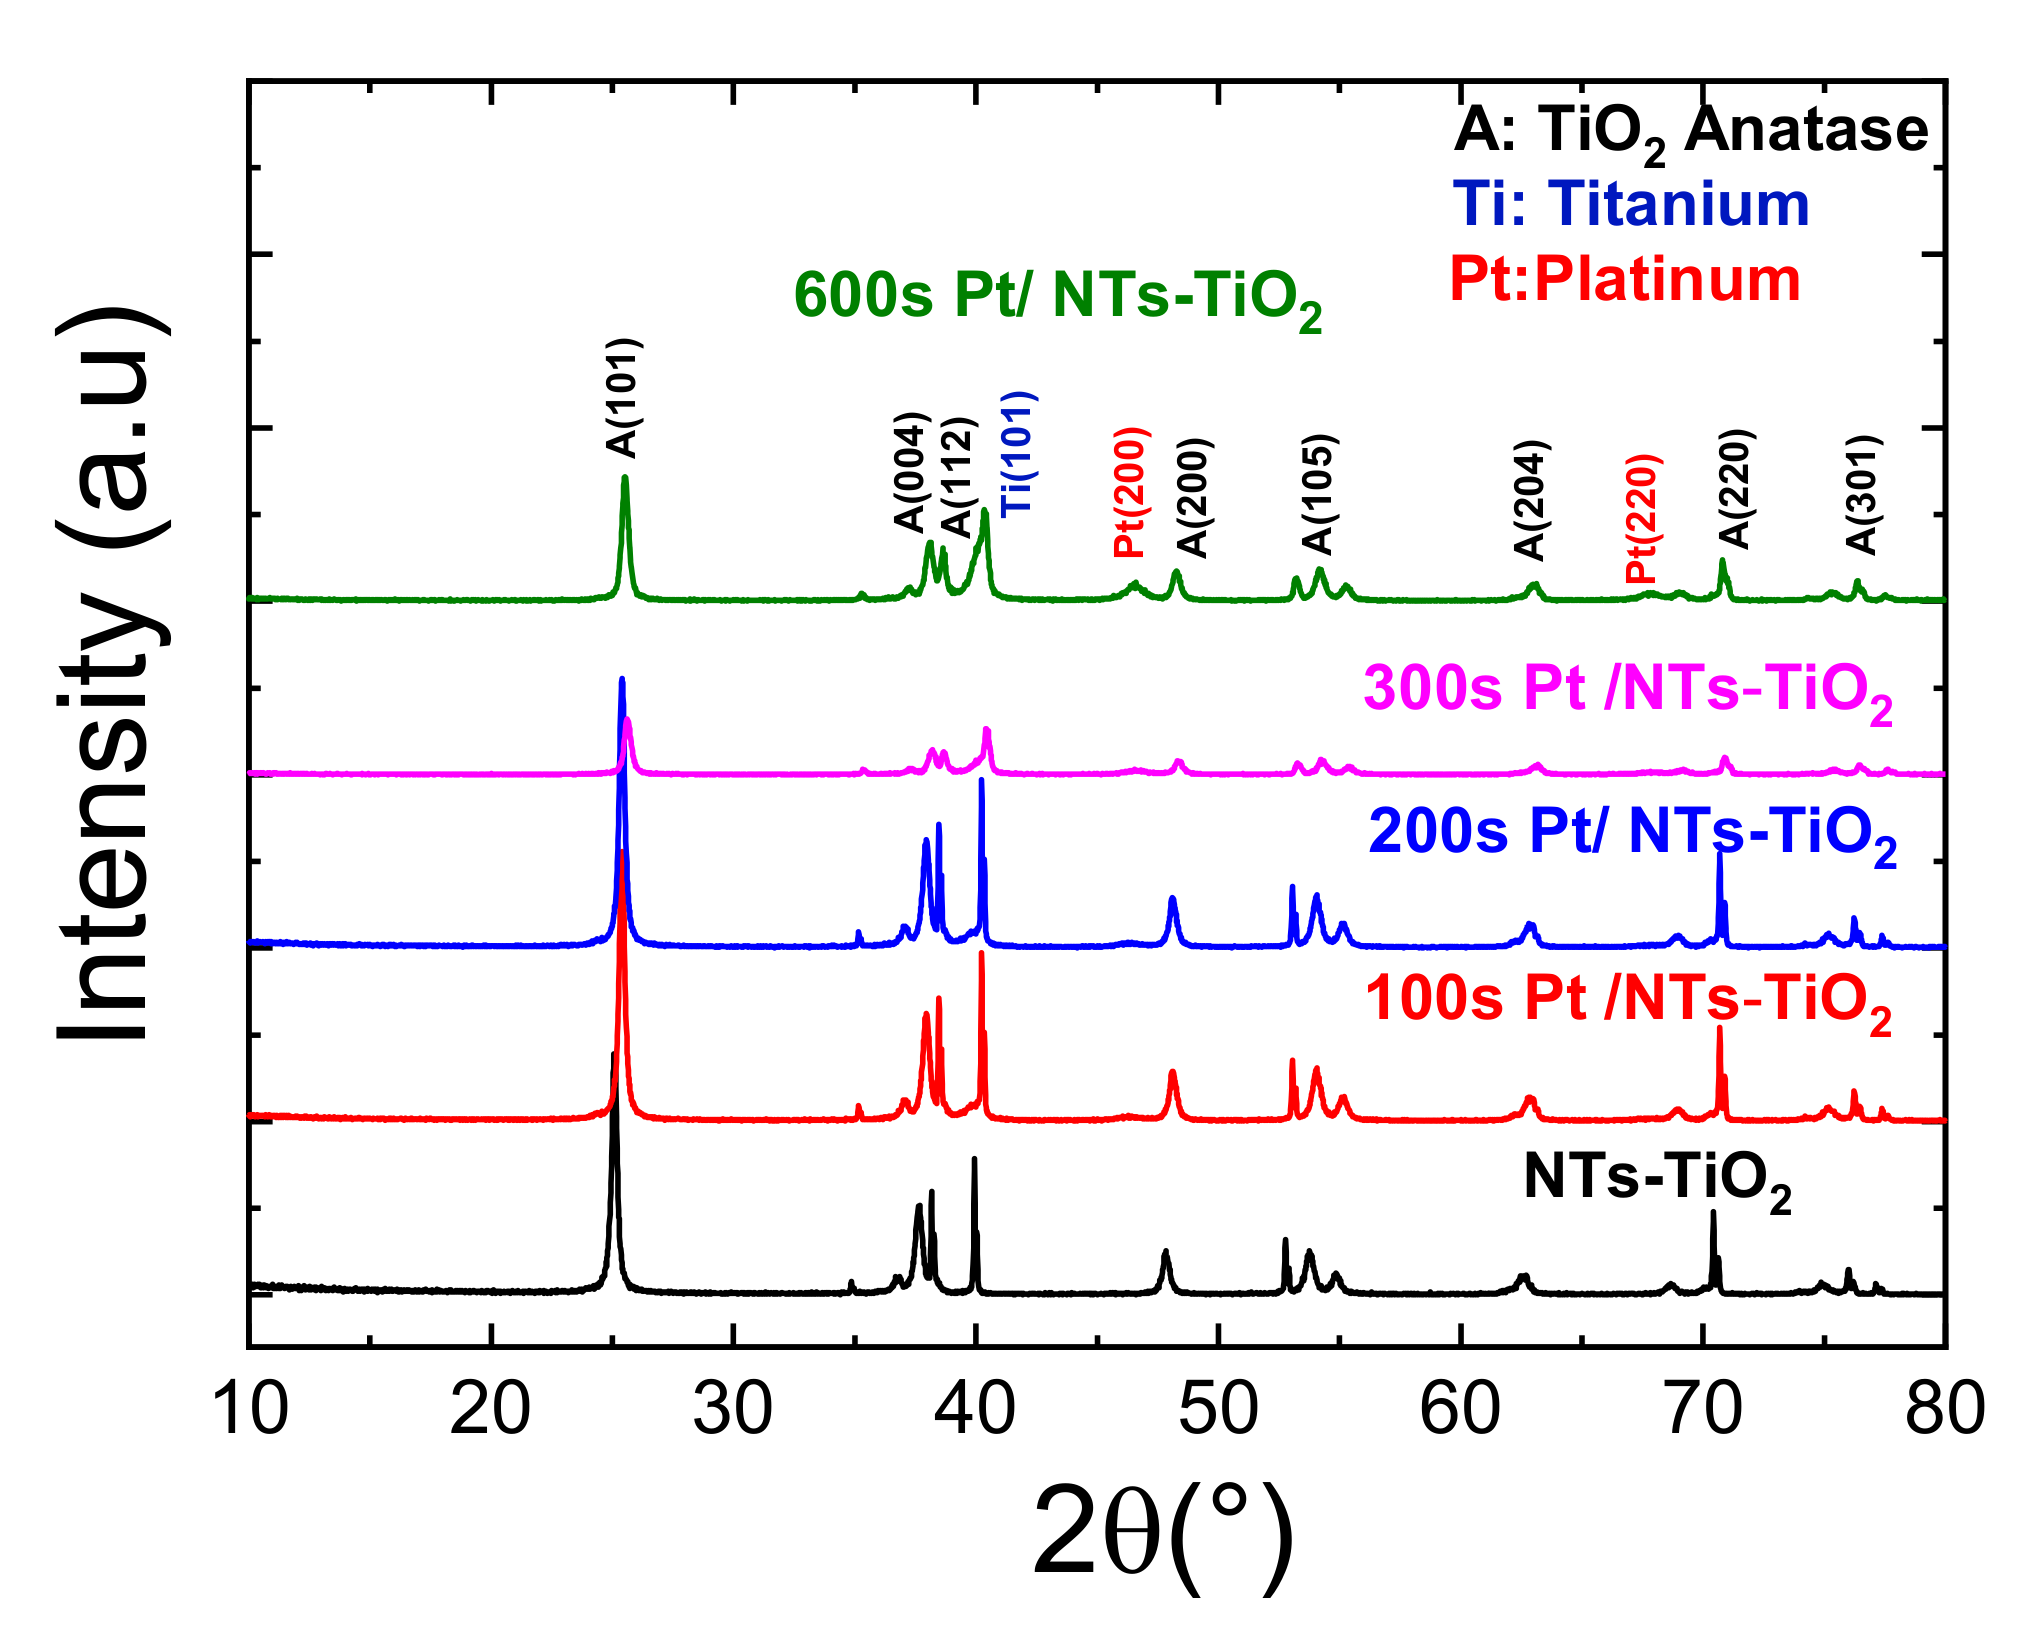
3.1.4. X-ray Diffraction Characterization

The X-ray diffraction analysis permitted the determination of the crystalline phase, the elemental lattice parameters, and approximately the crystallite size. Figure 5 depicts the XRD patterns of pure TiO2-NTs annealed at 400 °C and decorated with Pt-NPs at different electrodeposition times. It can be perceived that all samples crystallized in the anatase phase. Additional peaks characterizing the presence of Pt-NPs are clearly observable, beginning from a deposition time of 300 s; below this time, the amount of Pt incorporated was insufficient to be detected, probably due to the sensitivity threshold of the XRD [37,38].
The diffraction peaks obtained at 2θ = 25.35°, 36.96°, 37.95°, 38.54°, 48.12°, 53.98°, 55.13°, 62.88°, 68.88°, 70.60°, 75.18°, and 76, 32° corresponded to the (101), (103), (004), (112), (200), (105), (211), (204), (116), (220), (215), and (301) orientation planes of the anatase phase of TiO2, respectively. The peaks at 2θ = 35.14°, 40.33°, 53.15°, and 77.59° were due to the diffraction from the titanium substrate. The Pt-related peaks corresponded to the (200) and (220) crystallographic orientation of the Pt face-centered cubic structure that well agreed with the JCPDS N° 70–2075 [39].
The XRD peak intensities of the TiO2-NTs decorated with Pt-NPs decreased as the electrodeposition time increased. This phenomenon was due to the aggregation of the Pt-NPs as the Pt electrodeposition time increased.
The main XRD peak related to the (101) orientation slightly shifted towards higher angles as the Pt-NPs’ deposition time increased. The FWHM of the TiO2 (101) peak remained quasi constant as the Pt electrodeposition time increased. Therefore, by only looking at the Bragg relation, this shift would be due to the lattice parameter contraction. The overall stress field sustained by the Pt-NP agglomeration is believed to have caused the observed lattice parameter contraction.

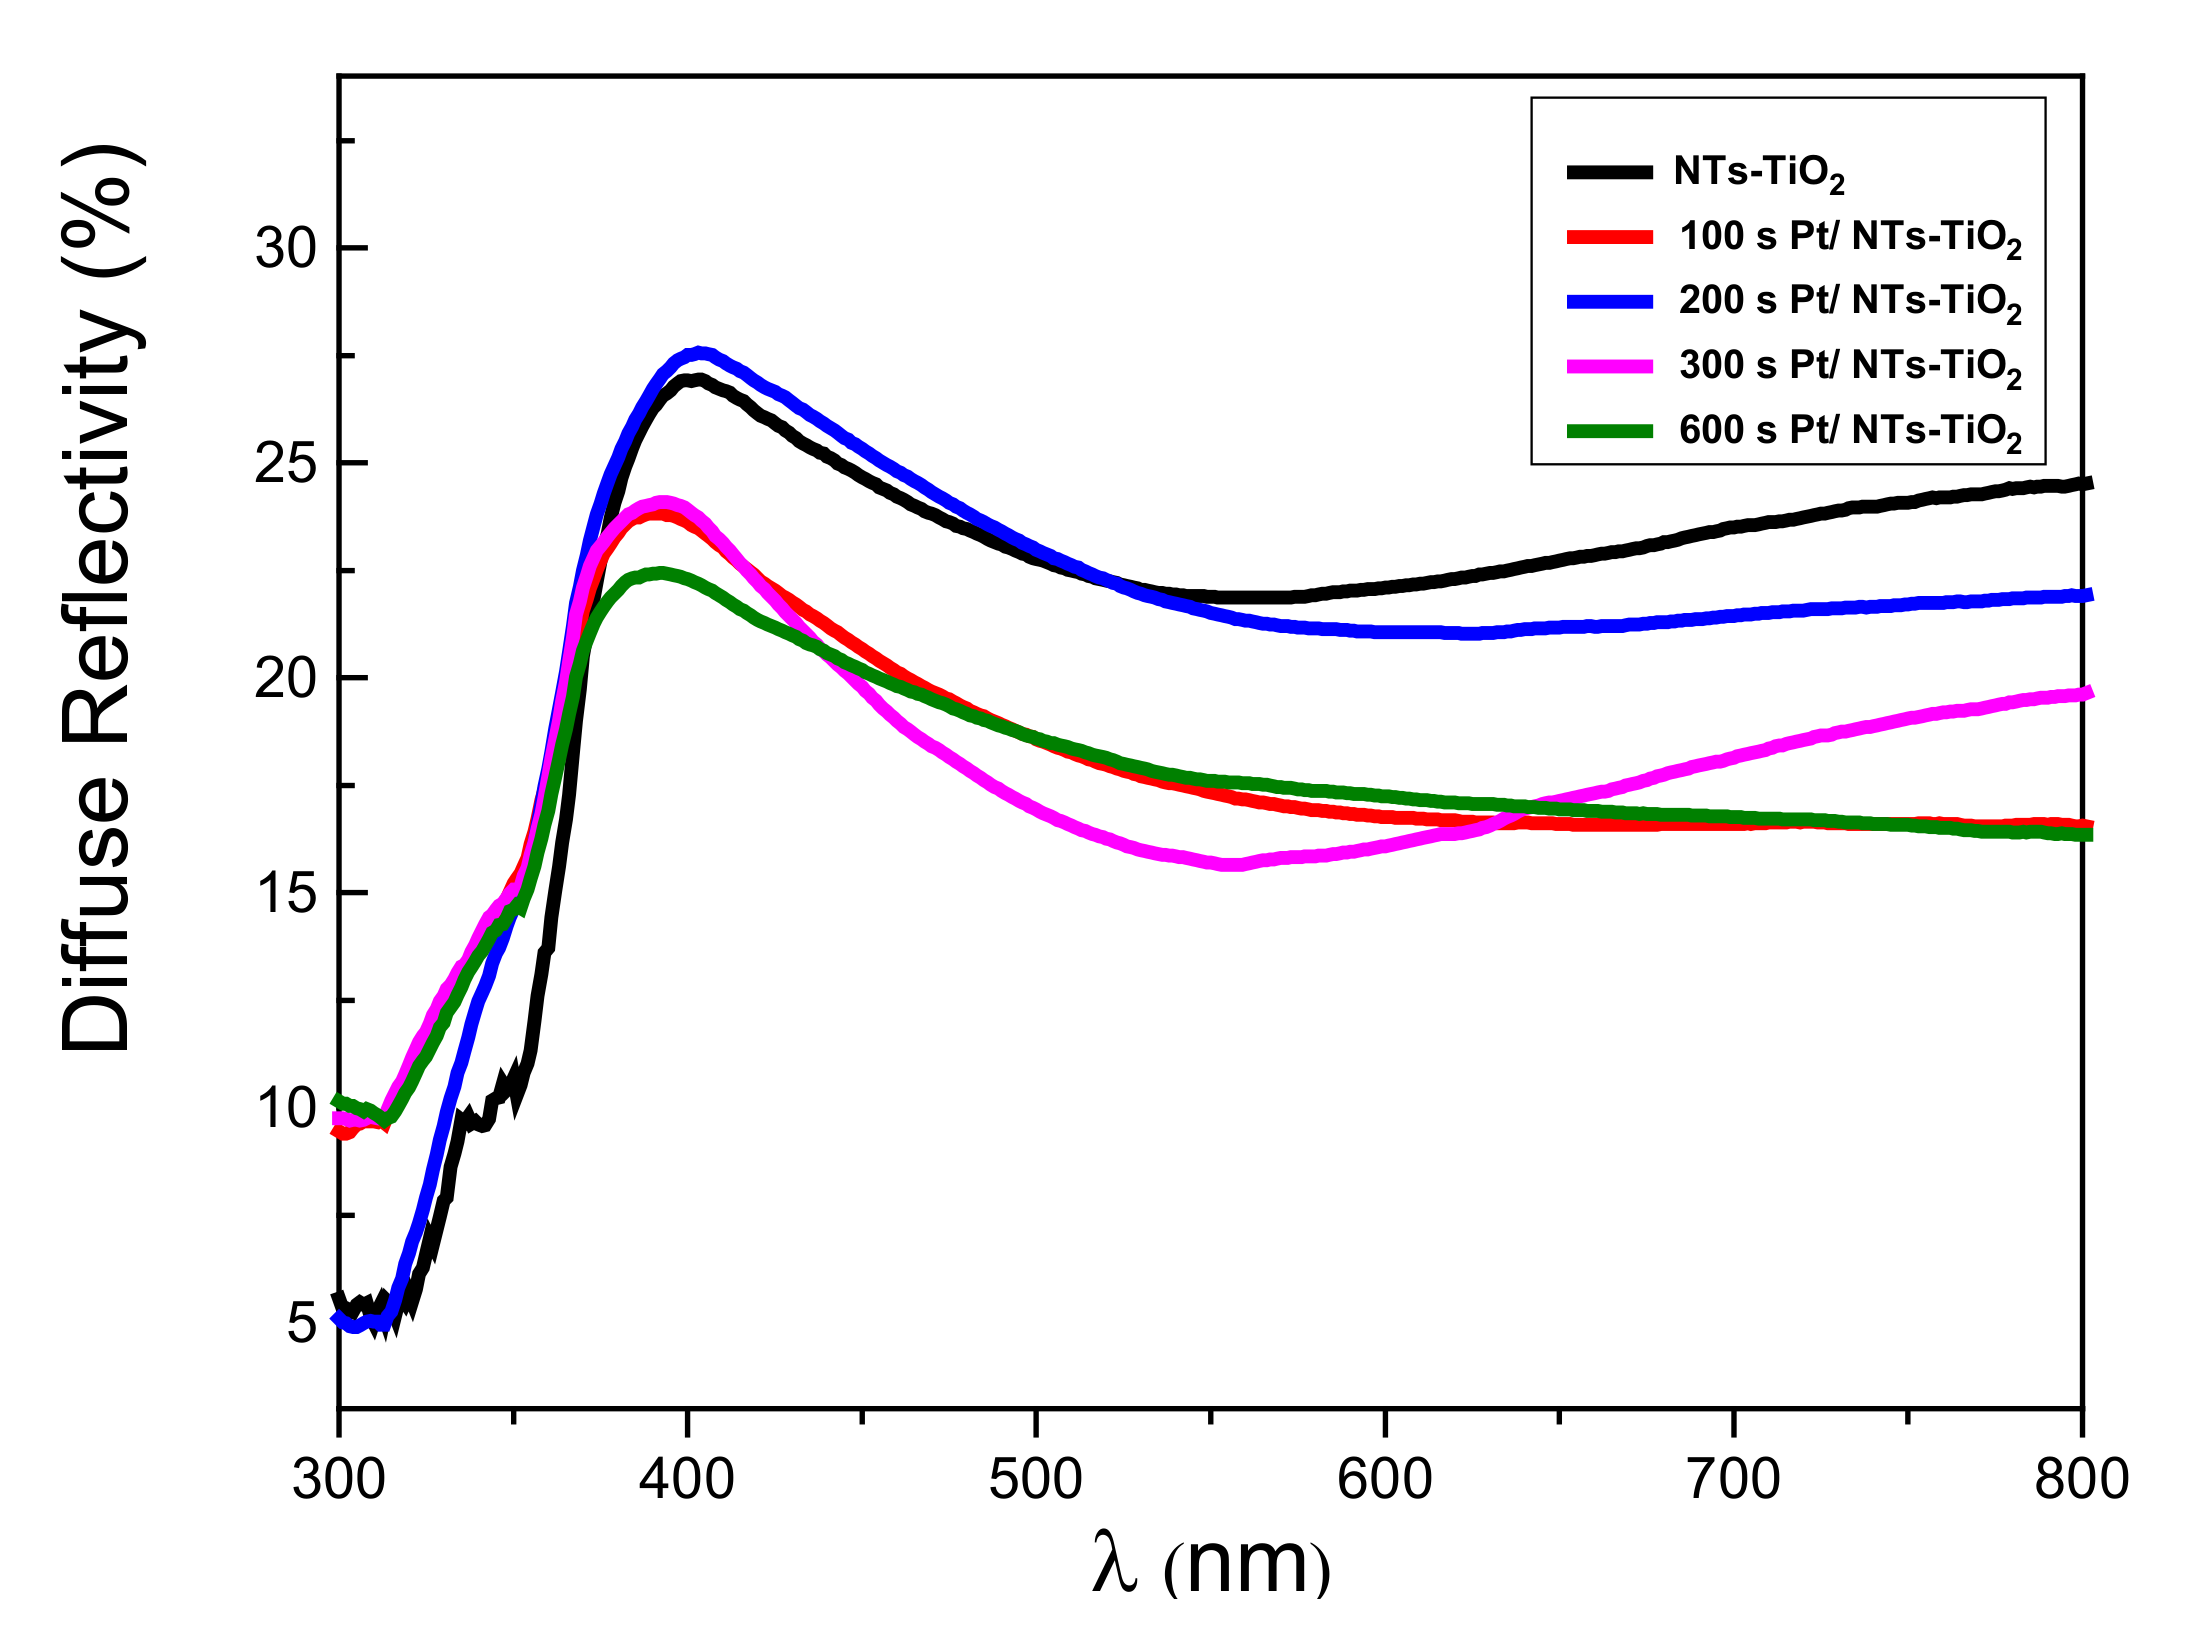
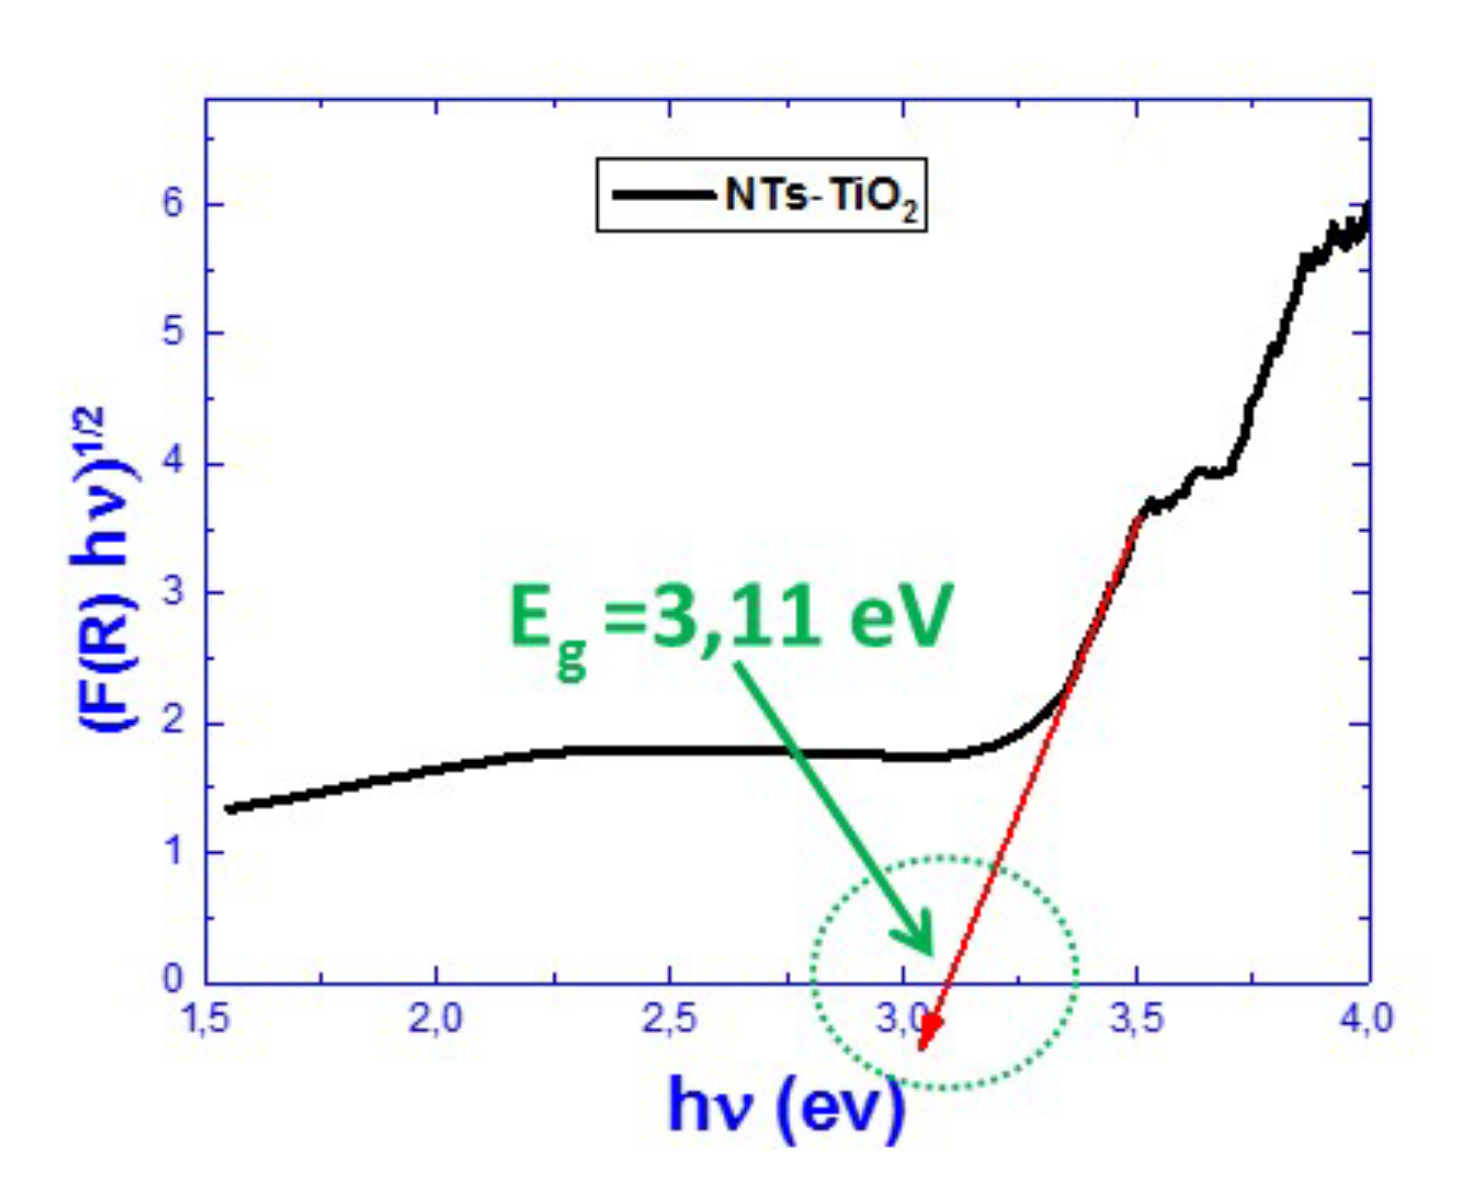
3.1.5. Reflectivity Properties Investigations

TiO2-NTs decorated with Pt-NPs at different electrodeposition times were characterized by UV–Vis spectroscopy in the diffuse reflection mode (Figure 6).
The exploitation of the curves of the diffuse reflectivity allowed us to verify the influence of the Pt-NPs on the band gap of the TiO2-NTs (Figure 7). For this purpose, we used the Kubelka–Munk method [40], which connects the absorption coefficient α to the diffuse reflection coefficient R, according to the following equation [40]:
α = ( 1 R ) 2   2 R
One may notice (in Table 1) a general decrease in the TiO2-NTs’ band gap energy values as the deposition time of Pt increased. This behavior broadens the absorption band of the TiO2-NTs for an efficient photocatalytic experiment in the visible range.
The decrease in the optical band-gap energy of TiO2 could be due to the increase in Pt-NP–induced defects that introduce energy levels in the band gap of TiO2.

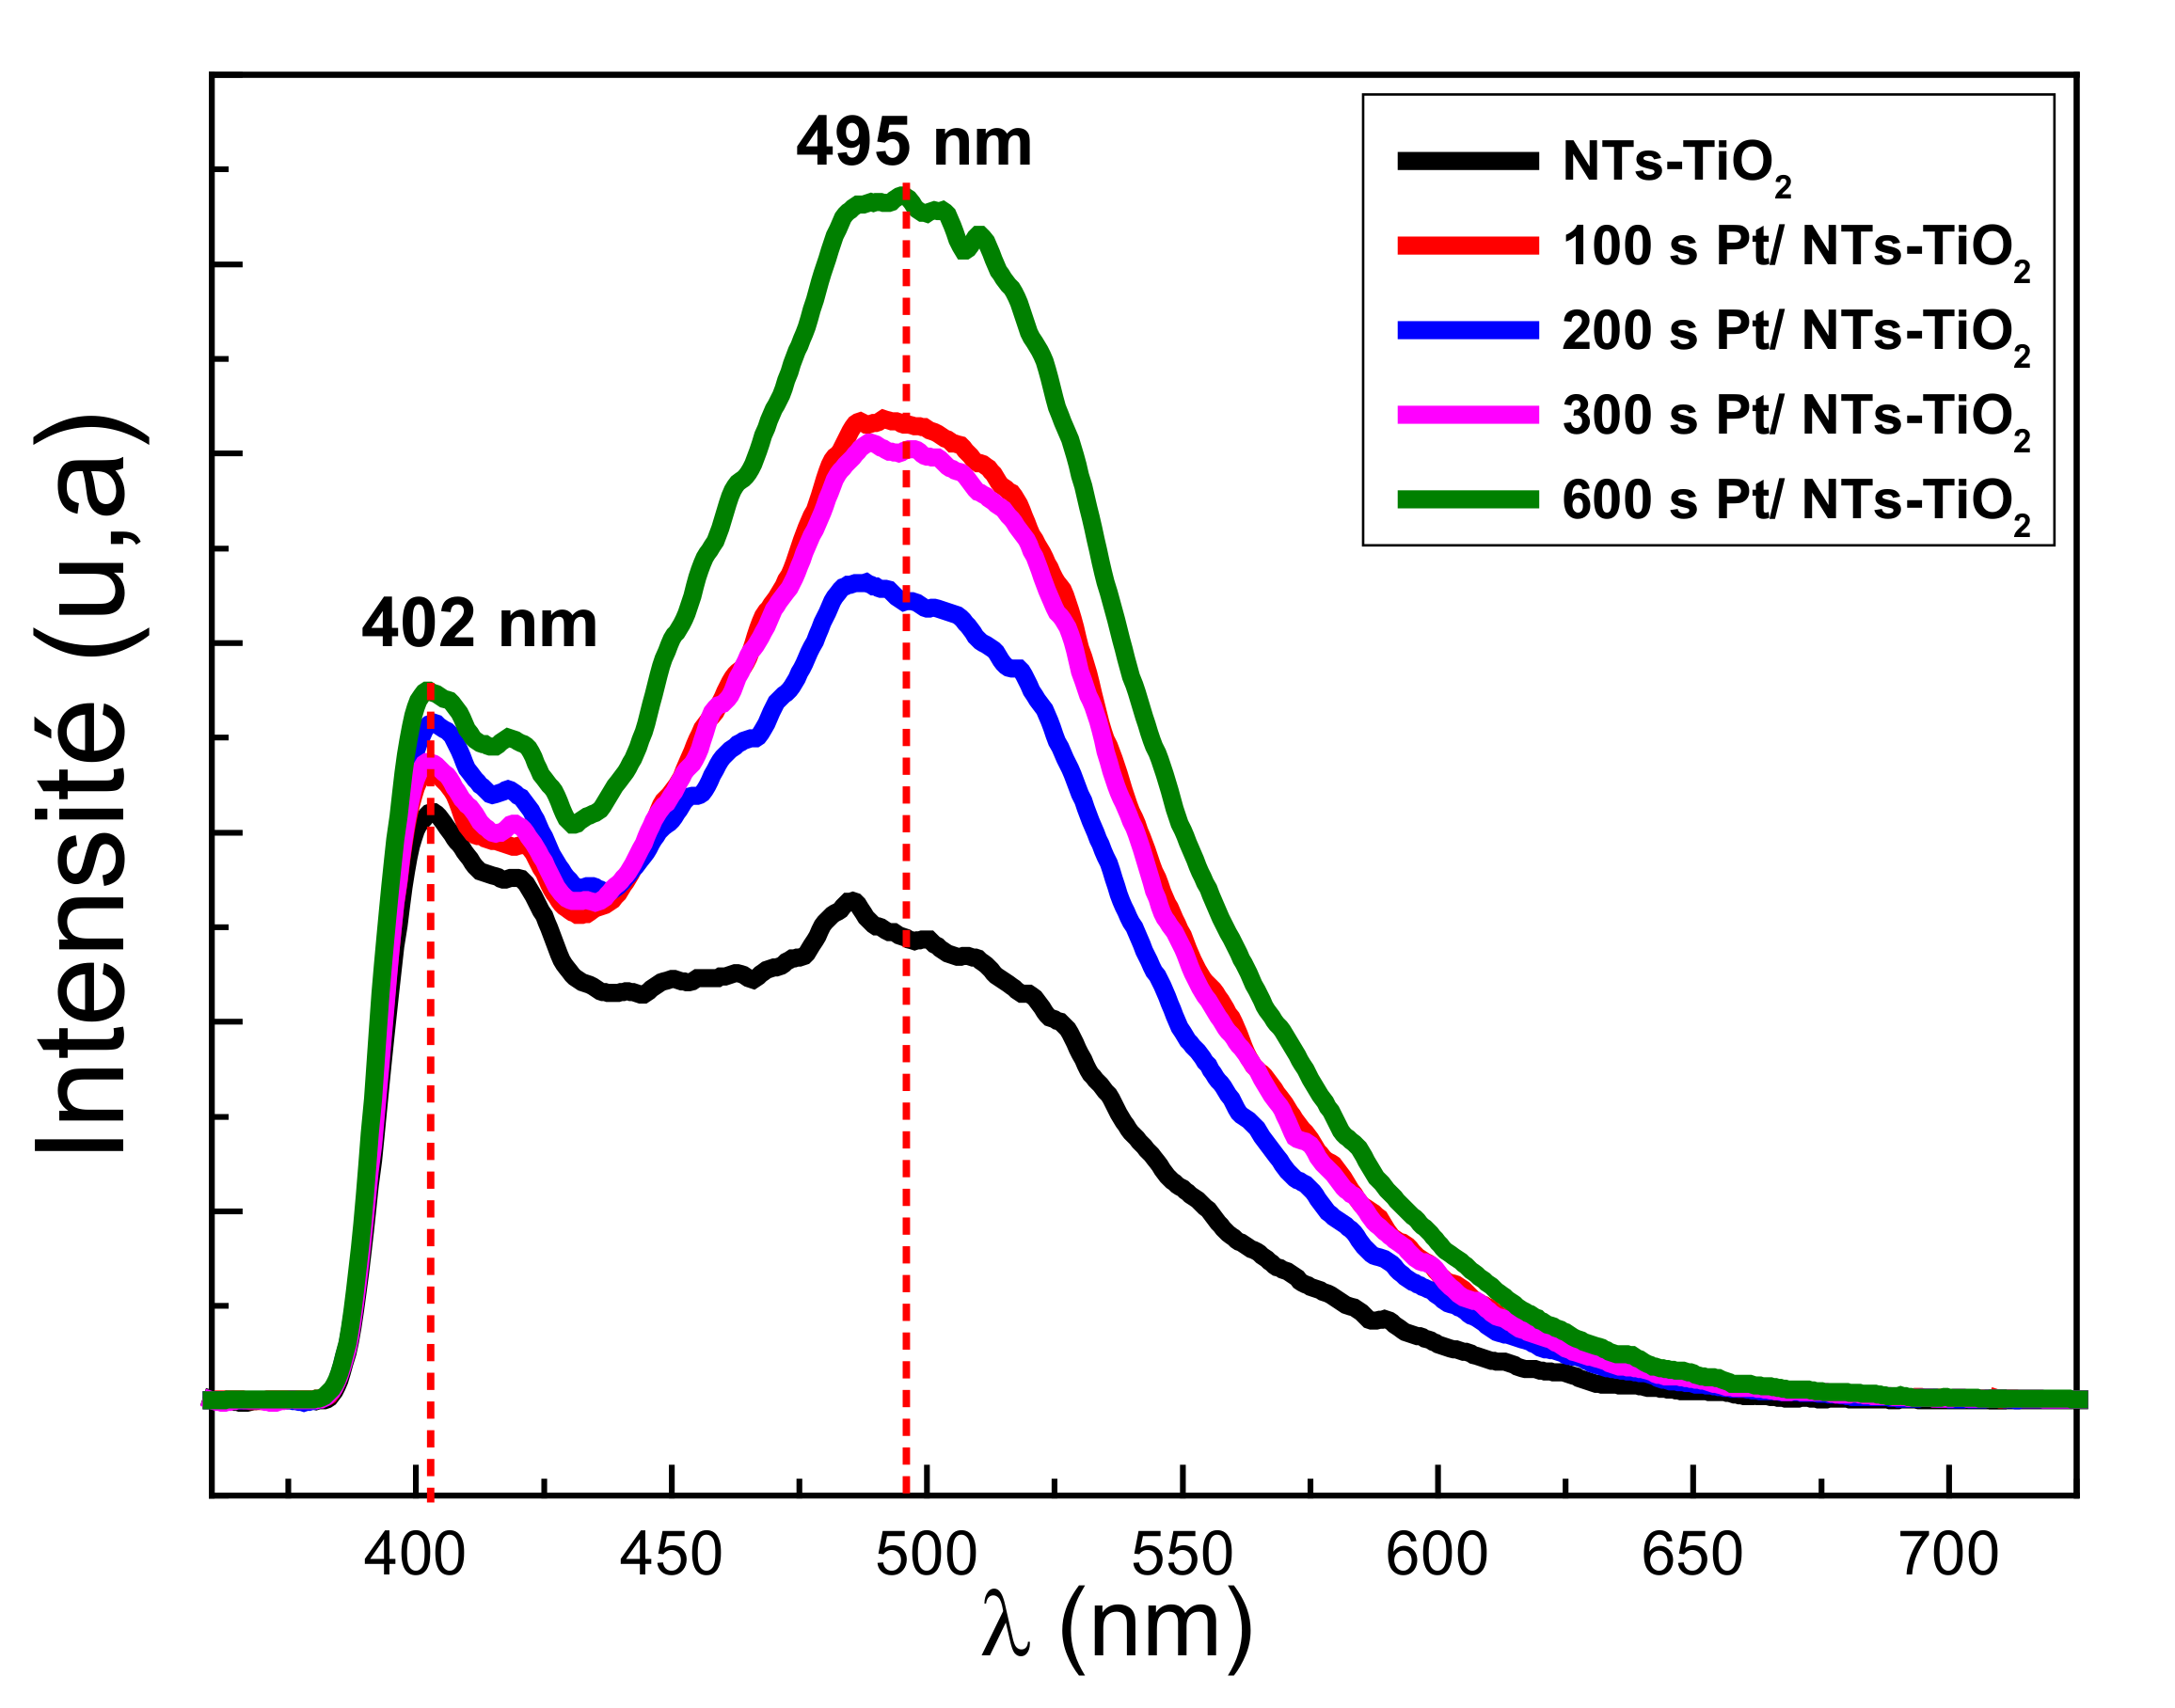
3.1.6. Photoluminescence Properties Investigations

Photoluminescence (PL) spectroscopy can provide information regarding the charge transfer and recombination of photogenerated charge carriers in TiO2-NTs [41]. Figure 8 shows the PL spectra of TiO2-NTs decorated with Pt-NPs at different times.
The peak localized at 402 nm corresponded to the electronic transition between the conduction and the valence bands of TiO2. The replica located around 495 nm represents a group of photoluminescence peaks attributed to oxygen vacancies present in TiO2 [42]. The decoration with Pt-NPs did not qualitatively change the form of the PL emission. The lowest PL intensity value amongst the Pt-NPs-decorated samples corresponded to those decorated with Pt-NPs for 200 s. For this electrodeposition, the Pt-NPs had a relatively small size (Figure 4). This Pt-NPs small size would have a work function higher than that of TiO2. In this case, the metal/SC (TiO2) contact was of a Schottky-type; thus, the electrons would be transferred from TiO2-NTs to Pt-NPs. This type of transfer minimizes the recombination rate of electron–hole pairs in TiO2 and would cause a low recombination rate and a low PL intensity [43].
The highest PL intensity value corresponded to TiO2-NTs decorated with Pt-NPs for 600 s, apparently due to the agglomeration of Pt-NPs. This agglomeration provides a work function lower than that of TiO2. In this situation, the metal/SC contact (TiO2) was ohmic, so there would be a transfer of electrons from the Pt-NPs to the TiO2-NTs, inducing an increase in the electron–hole recombination rate which, in turn, would increase the PL intensity (Figure 8).

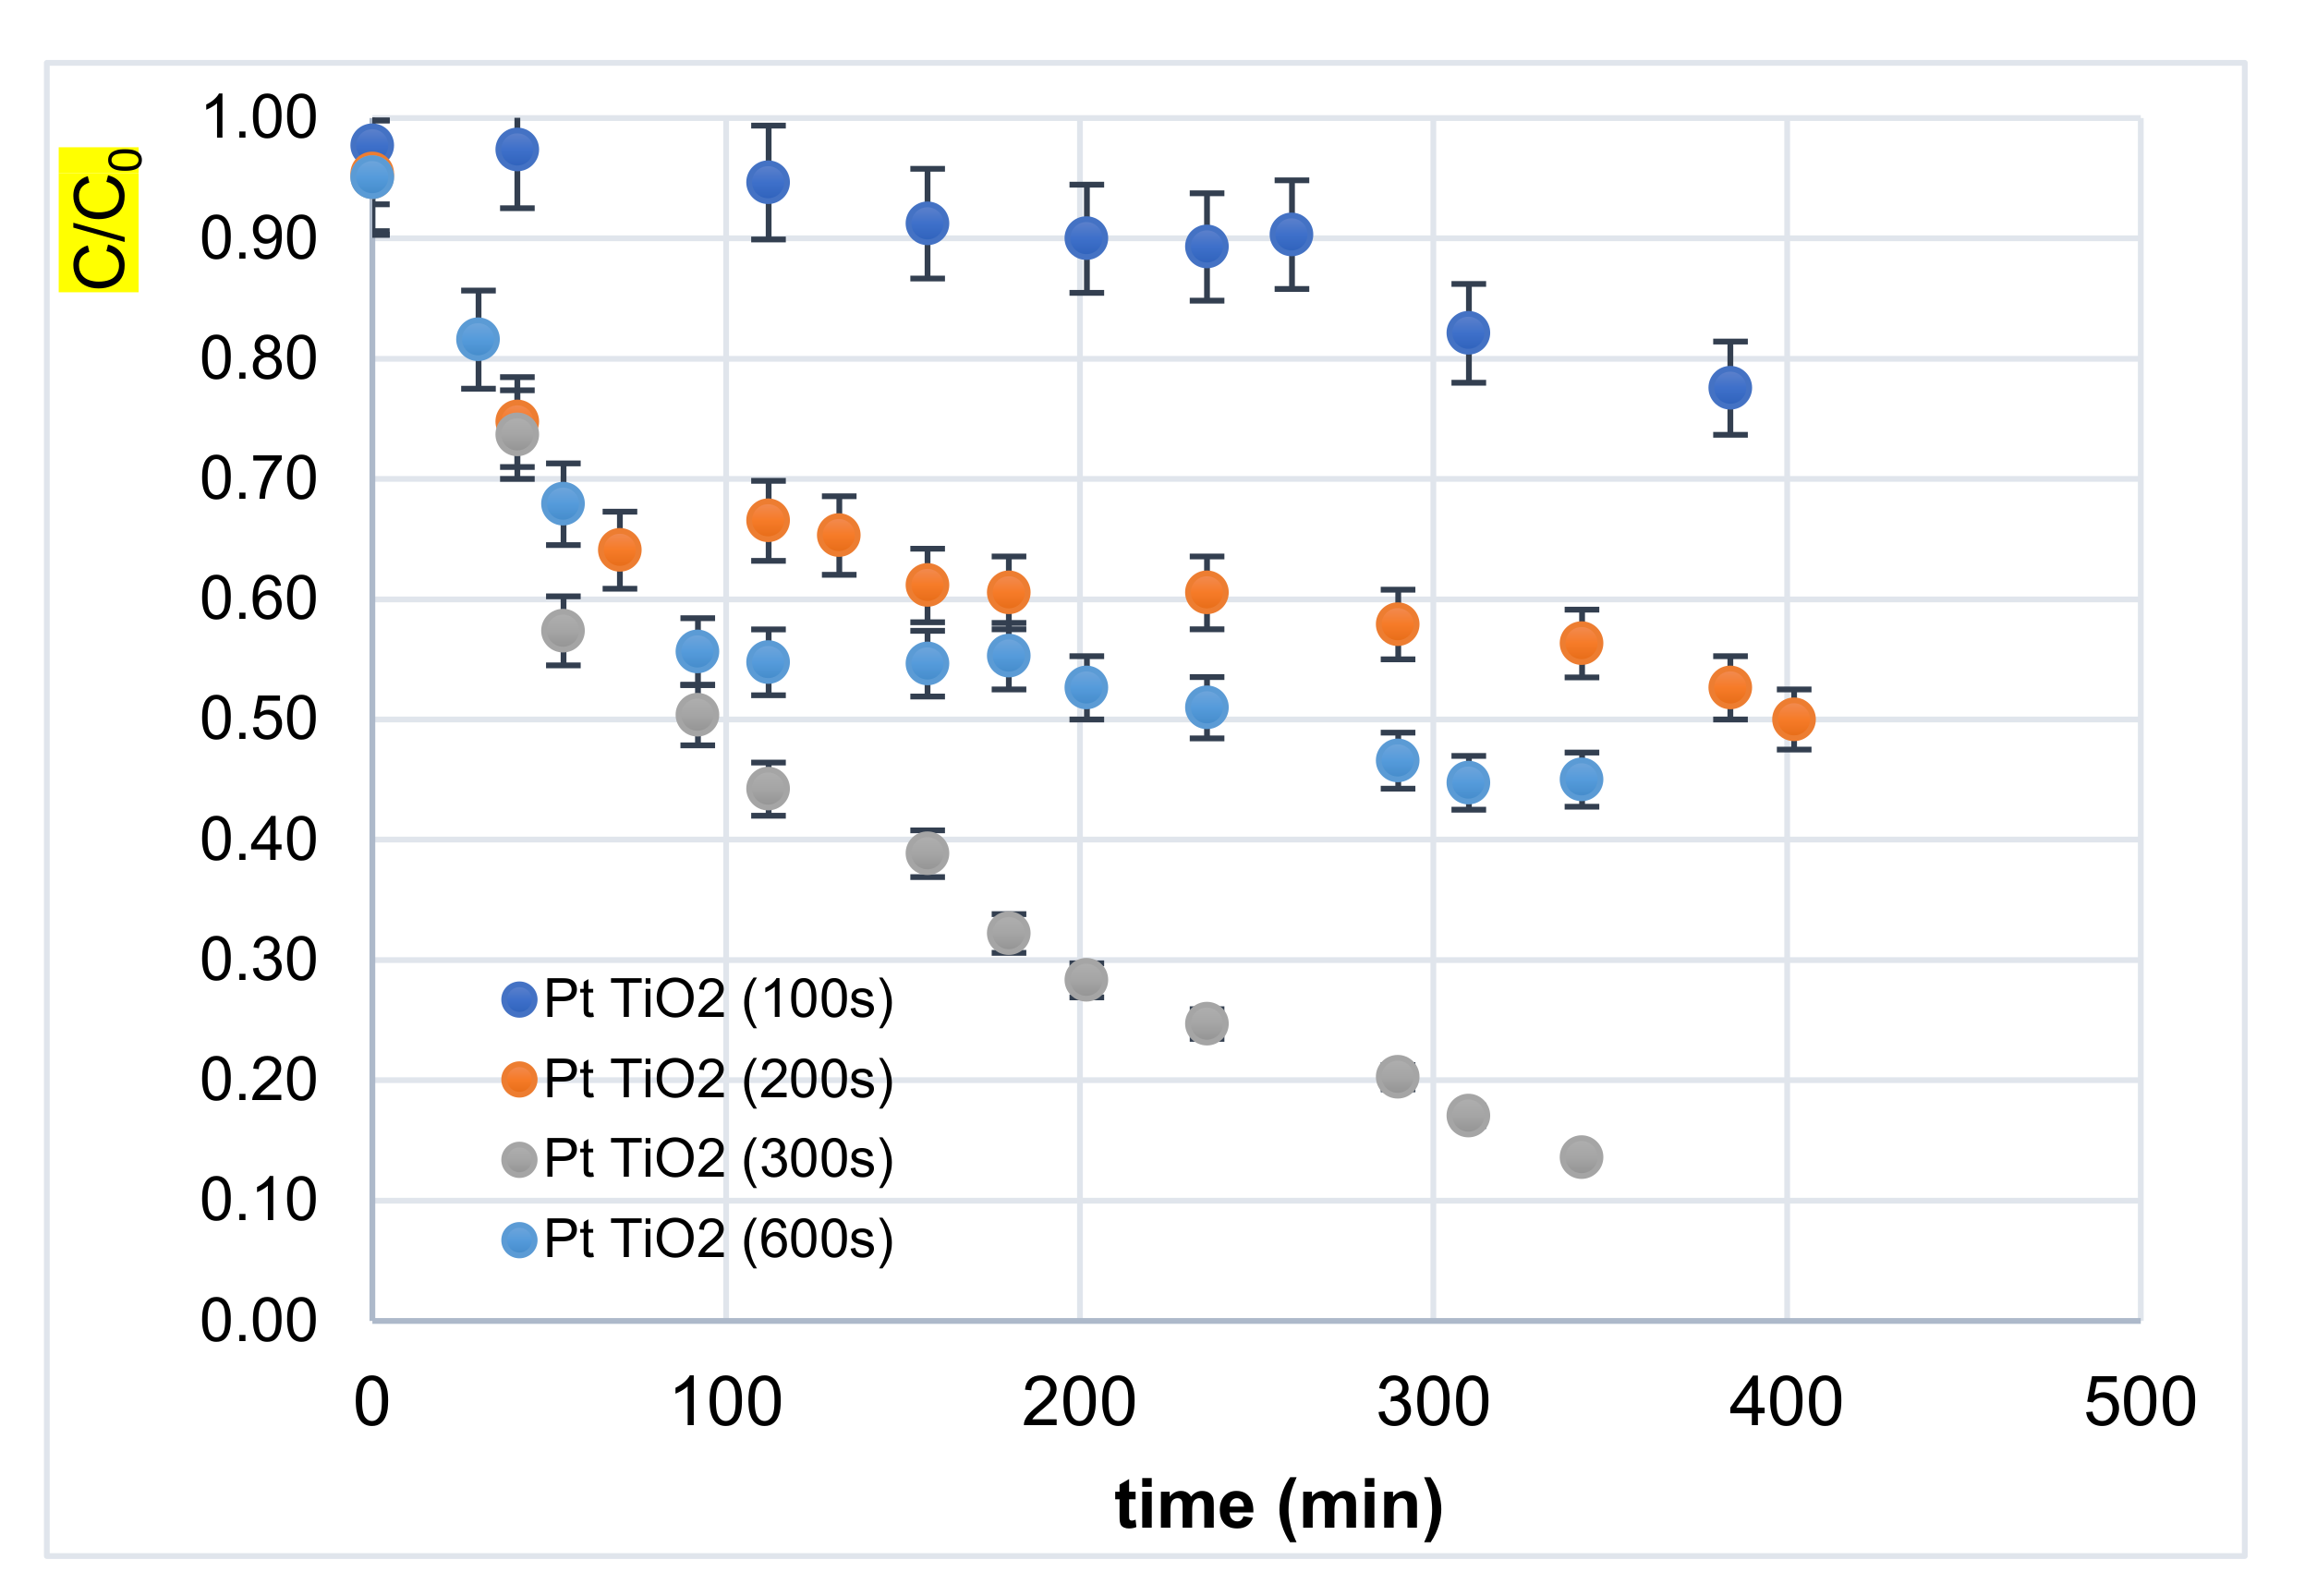
3.2. Catalyst Application for Pollution Treatment

3.2.1. Effect of Decoration Time

Figure 9 shows the variation of the normalized concentration (C/C0) as a function of the irradiation time at different Pt-NP decoration times. It appears that the catalyst with 300 s decoration exhibited better performance. This behavior could be due to the greater availability of photocatalytic sites [8,44] and probably to the plasmonic effects in Pt-NPs. In fact, light irradiation would have generated plasmons in the Pt-NPs that led to a transfer of hot electrons in the TiO2 conduction band and, thus, a separation of positive and negative plasmons. In such a situation, hot electrons (transferred to TiO2) would degrade the polluting agent via a chemical reduction, while Pt positive charges would serve to catalyze the oxidation process.
On the other hand, the results manifest that degradation follows a pseudo-first-order kinetics model, where degradation is proportional to the input concentration at low values. The number of molecules effectively participating in the reaction did not increase proportionally to the input concentration, thus leading to a decrease in the degradation efficiency, which may result from the limited adsorption capacity of the active sites at the catalyst surface. In fact, the results show that at a low input concentration, degradation followed pseudo-first order kinetics, where degradation was proportional to the input concentration. This finding can be explained by the fact that all the active sites are not occupied. Moreover, an increase in the concentration generates a higher surface coverage, implying a better rate of degradation [8,44].
The efficient photocatalytic performance (Figure 9) is mainly explained by plasmon-based charge separation which, in turn, leads to better photoactivity in the visible light domain.

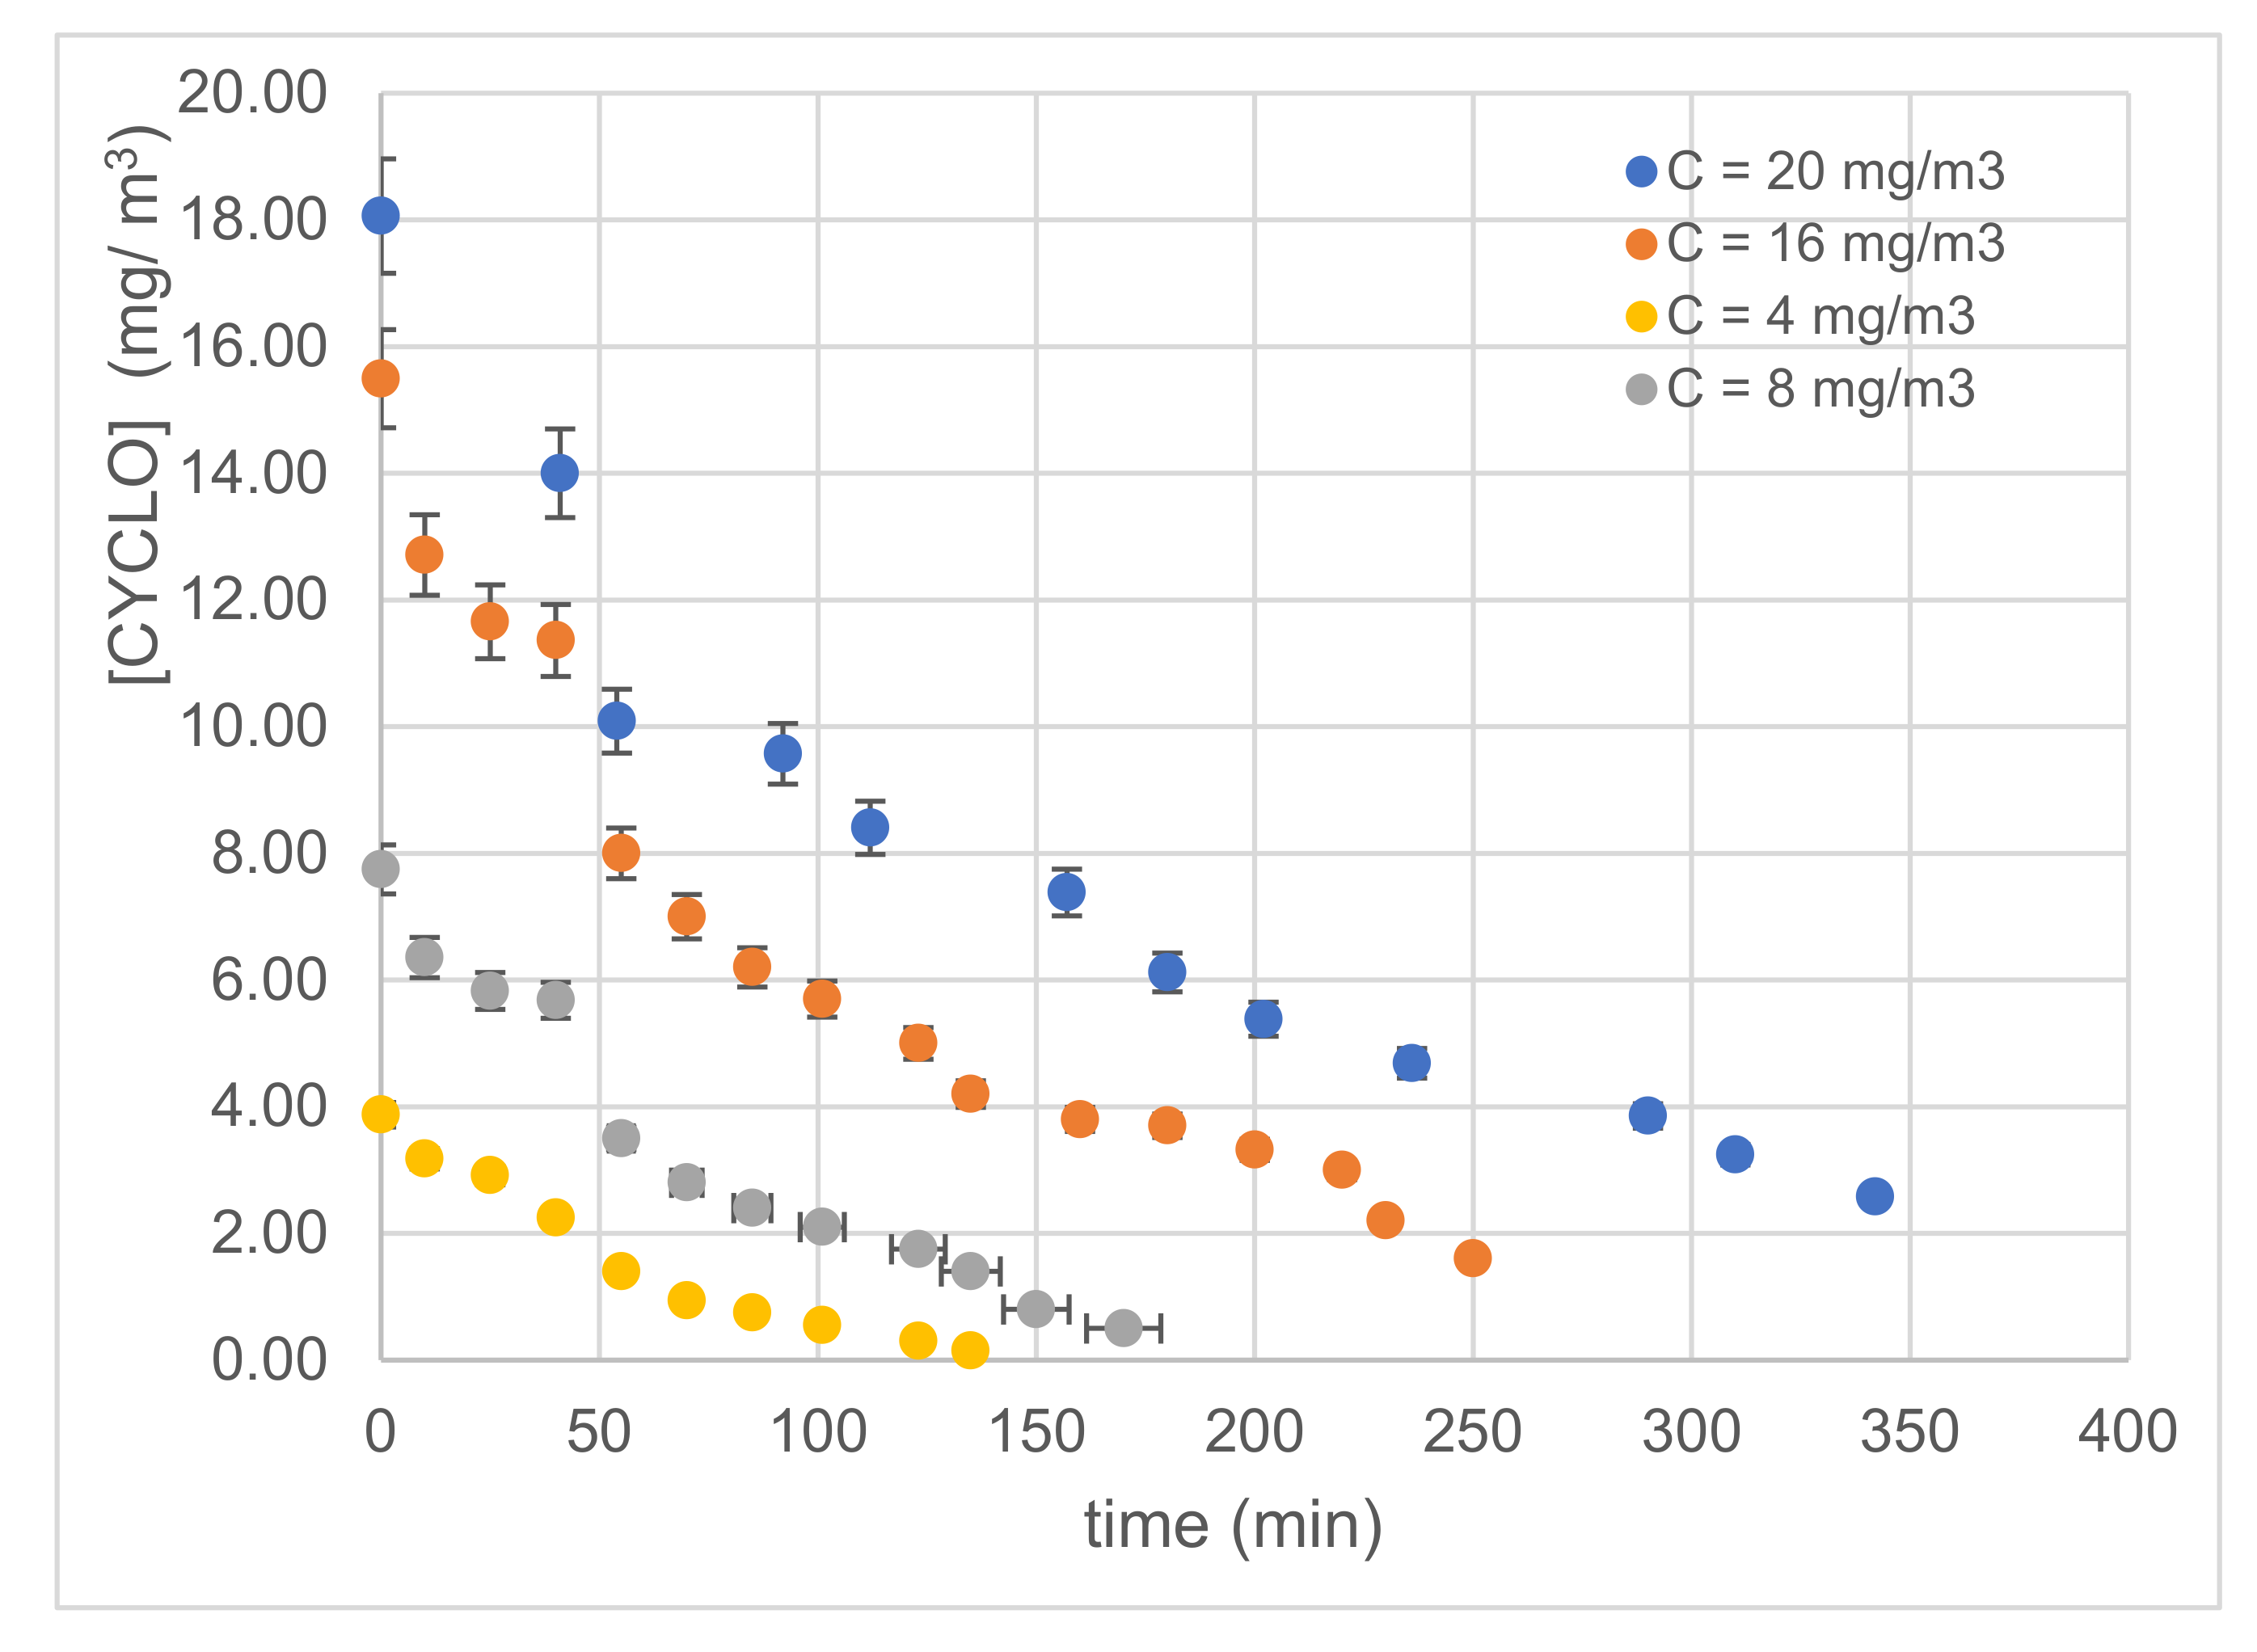
3.2.2. Effect of Inlet Concentration

Figure 10 displays the variations in cyclohexane concentration as a function of irradiation time at different input concentrations using the most efficient catalyst (i.e., 300 s). The total pollutant removal decreased as the cyclohexane concentration at the inlet increased (Figure 10); this behavior is owed to the greater availability of photocatalytic sites at a low initial concentration [7,8,33,44,45].
In order to describe the photocatalytic performance of Pt-NPs/TiO2-NTs-300 s, we used the Langmuir–Hinshelwood model (L–H) equation [7,8]:
r 0 = d CYCLO dt = k c K CYCLO 0 1 + K CYCLO 0
where r0 (mmol/gcat m3 s) is the initial photocatalytic degradation rate, [CYCLO]0 is the initial cyclohexane concentration (mmol/m3), K is the adsorption constant (m3/mg), and kc is the kinetic constant (mg.m−3 min) at maximum coverage of the experimental conditions.
The plot of 1/r0 versus 1/[CYCLO]0 allows for the determination of the kc and K values. The linearized (L–H) equation is [7,8]:
1 r 0 = 1 k c K × 1 CYCLO 0 + 1 k C
The kinetic and the adsorption constant of the L–H values are summarized in Table 2. The results show that the Pt-modified TiO2-NTs led to a faster VOC removal compared to other types of catalysts, such as TiO2-impregnated polyester (PES) [7] and Cu2O-modified TiO2-NTs [33], and had a kinetic constant of 0.85 mg.m−3min−1. Table 1 gives the kinetic and adsorption constants referring to the (L–H) model.

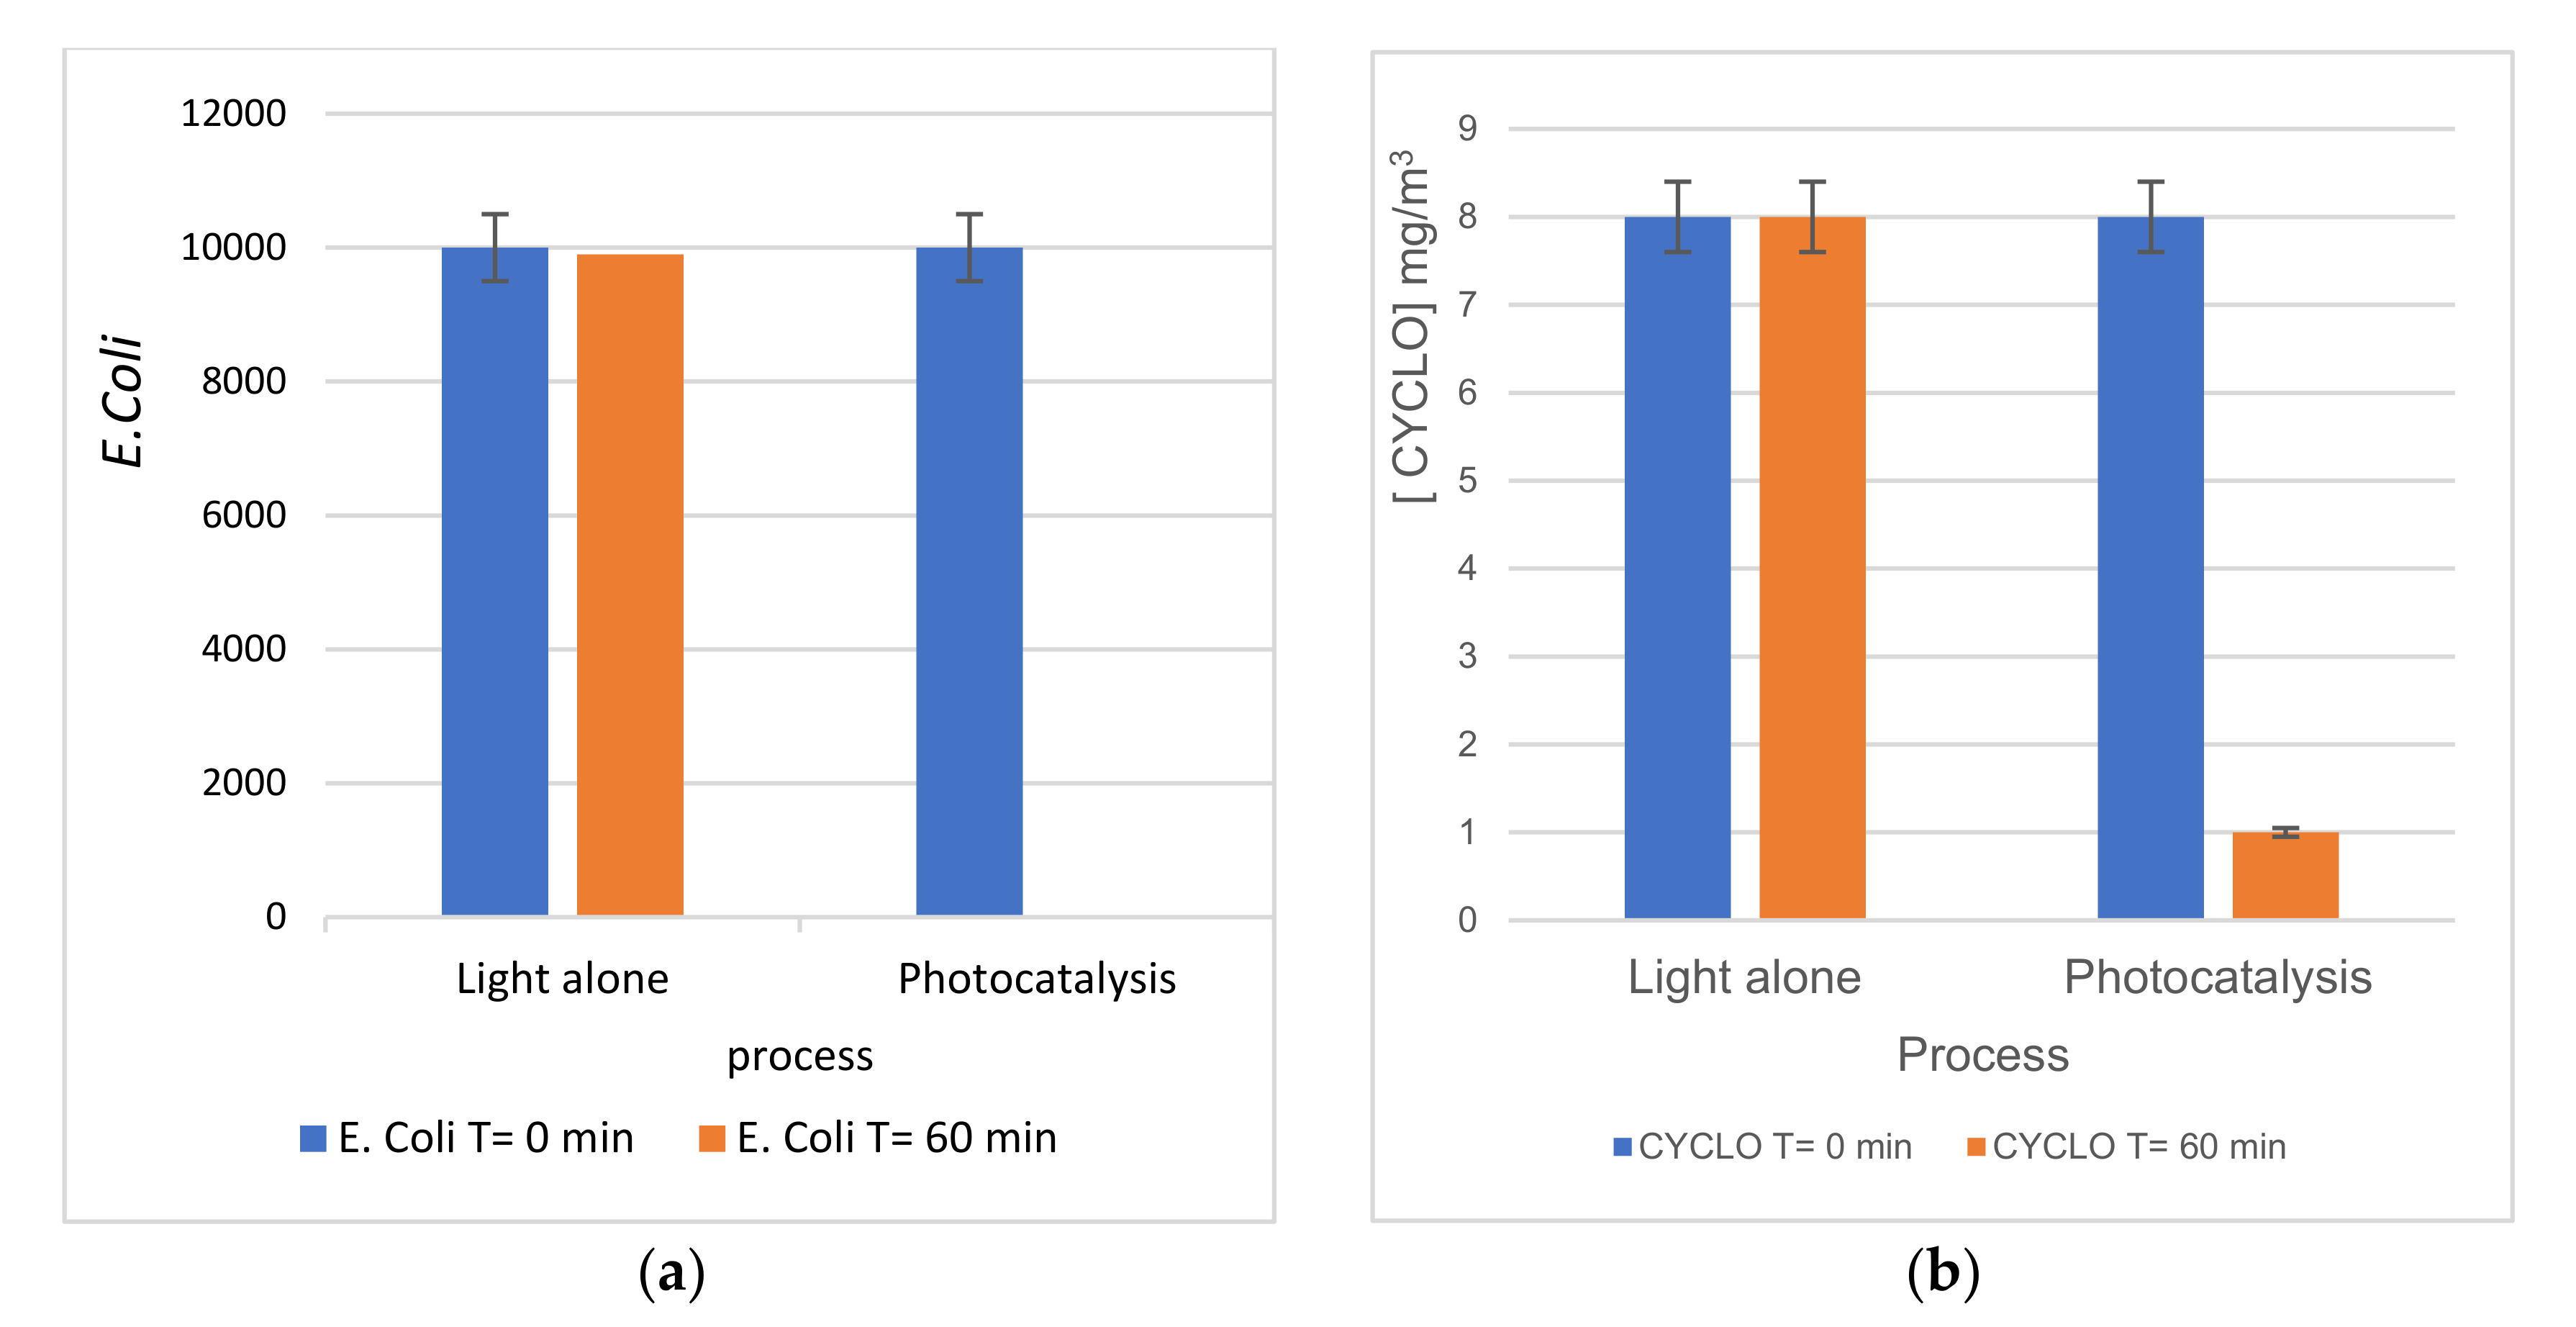
3.2.3. Simultaneous Oxidation of Cyclohexane and Bacteria

To investigate the antibacterial aspect in the simultaneous removal of E. coli and cyclohexane, several experiments were conducted with Pt-NPs/TiO2-NTs-300 s catalyst with an initial bacterial concentration of ~1.86 × 10³ (CFU/mL). Figure 11 shows the antibacterial activity of Pt-NPs/TiO2-NTs-300 s with and without cyclohexane under visible light. There was almost no notable effect of photolysis and VOC pollutants on the studied bacteria cells’ inactivation (Figure 11). Moreover, the results show that the Pt-NPs/TiO2-NTs-300 s sample catalyst had a complete bacterial inactivation rate with VOCs and 99.59% within 60 min of visible light irradiation.
Based on these results, Pt presents a high bacterial inactivation capability. Undoubtedly, visible light could improve the stimulation of electron transfer between Pt and bacterial cells, which leads to the formation of reactive oxygen species (ROS), resulting in microorganism inactivation [7,45,46,47]. In their previous investigations, Abidi et al. [33] indicated that the contact between some metals, such as copper species and microorganisms’ cells, led to the extraction of electrons from cells, which allows for protein denaturation. In addition, TiO2-NTs present an excellent antibacterial activity under UV irradiation due to the photogeneration of electron/hole pairs, resulting in ROS generation (OH, O2−•, etc.) [7,33,46].

4. Conclusions

The formation of Pt-NPs on TiO2-NTs was carried out using the electrodeposition technique. The catalytic characterization results prove that the presence of Pt-NPs increased the absorption of visible light (plasmonic effect) up to approximately 500 nm. The photocatalytic degradation of 20 mg/m3 of cyclohexane in a batch reactor made it possible to select the catalyst with an optimized electroplating time (Pt-NPs/TiO2-NTs-300 s). The L–H model was used to model the degradation kinetics.
The constants obtained in our present work were compared with other metallic NPs such as copper. The optimized catalyst was also used for the simultaneous treatment of cyclohexane and microorganisms. This attractive photocatalytic efficiency was due to the surface plasmon resonance in Pt-NPs and, consequently, to a high visible light absorption. Indeed, this catalytic configuration presents an interesting bacterial inactivation. In fact, visible irradiation enhances the stimulation of electron transfer between Pt and microorganism cells through the engendering of ROS, pointing to bacterial disinfection.

Author Contributions

Conceptualization, L.K.; methodology, L.K. and A.G.; validation, L.K.; writing—original draft preparation, A.G., L.K., A.A.A., I.L., A.H. and B.B.; editing, A.A.A. and L.K.; visualization, A.A.A. and B.B.; supervision, L.K. and A.H.; All authors have read and agreed to the published version of the manuscript.

Funding

This research received no external funding.

Institutional Review Board Statement

Not applicable.

Informed Consent Statement

Not applicable.

Data Availability Statement

Not applicable.

Acknowledgments

This research was supported by the Deanship of Scientific Research, Imam Mohammad Ibn Saud Islamic University, Saudi Arabia, (grant no. 20-13-12-022).

Conflicts of Interest

The authors declare that they have no conflicts of interest.

References

  1. Abidi, M.; Hajjaji, A.; Bouzaza, A.; Lamaa, L.; Peruchon, L.; Brochier, C.; Rtimi, S.; Wolbert, D.; Bessais, B.; Assadi, A.A. Modeling of indoor air treatment using an innovative photocatalytic luminous textile: Reactor compactness and mass transfer enhancement. Chem. Eng. J. 2022, 430, 132636. [Google Scholar]
  2. Costarramone, N.; Cantau, C.; Desauziers, V. Photocatalytic air purifiers for indoor air: European standard and pilot room experiments. Environ. Sci. Pollut. Res. 2017, 24, 12538–12546. [Google Scholar] [CrossRef]
  3. European Commission. Programme Pilote de Vérification des Technologies Environnementales de l ’UE Protocole Général de Verification; European Commission: Brussels, Belgium, 2016. [Google Scholar]
  4. World Health Organization (WHO). Environmental and Social Determinants of Health (PHE), Geneva. 2014. Available online: https://www.who.int/data/gho/data/themes/world-health-statistics (accessed on 17 November 2021).
  5. Laurence, G. Traitement de L’air Interieur par Photocatalyse—Évaluation de L’innocuité des Systèmes de Traitement de L’air; Rapport de Recherche -ADEME- 2017; Agence de la Transition Écologique: Montrouge, France, 2017. [Google Scholar]
  6. Saoud, W.A.; Assadi, A.A.; Kane, A.; Jung, A.V.; Le Cann, P.; Gerard, A.; Wolbert, D. Integrated process for the removal of indoor VOCs from food industry manufacturing: Elimination of Butane-2, 3-dione and Heptan-2-one by cold plasma-photocatalysis combination. J. Photochem. Photobiol. A Chem. 2020, 386, 112071. [Google Scholar] [CrossRef]
  7. Hajjaji, A.; Elabidi, M.; Trabelsi, K.; Assadi, A.A.; Bessais, B.; Rtimi, S. Bacterial adhesion and inactivation on Ag decorated TiO2-nanotubes under visible light: Effect of the nanotube’s geometry on the photocatalytic activity. Colloids Surf. B Biointerfaces 2018, 170, 92–98. [Google Scholar] [CrossRef]
  8. Elfalleh, W.; Assadi, A.A.; Bouzaza, A.; Wolbert, D.; Kiwi, J.; Rtimi, S. Innovative and stable TiO2 supported catalytic surfaces removing aldehydes under UV-light irradiation. J. Photochem. Photobiol. A Chem. 2017, 343, 96–102. [Google Scholar] [CrossRef]
  9. Anitha, V.C.; Goswami, A.; Sopha, H.; Nandan, D.; Gawande, M.B.; Cepe, K.; Macak, J.M. Pt nanoparticles decorated TiO2 nanotubes for the reduction of olefins. Appl. Mater. Today 2018, 10, 86–92. [Google Scholar]
  10. Pradhan, S.K.; Reucroft, P.J.; Yang, F.; Dozier, A. Growth of TiO2 nanorods by metalorganic chemical vapor deposition. J. Cryst. Growth 2003, 256, 83–88. [Google Scholar] [CrossRef]
  11. Pérez-Jiménez, L.E.; Solis-Cortazar, J.C.; Rojas-Blanco, L.; Perez-Hernandez, G.; Martinez, O.S.; Palomera, R.C.; Morales, E.R. Enhancement of optoelectronic properties of TiO2 films containing Pt nanoparticles. Results Phys. 2019, 12, 1680–1685. [Google Scholar] [CrossRef]
  12. Sun, Y.; Liu, E.D.; Zhu, L.; Wen, Y.; Tan, Q.W.; Feng, W. Influence of annealing temperature of TiO2 nanotubes via hydrothermal method on Ti foil for photocatalytic degradation. Digest J. Nanomater. Biostruct. 2019, 14, 463–470. [Google Scholar]
  13. Naduvath, J.; Bhargava, P.; Mallick, S. Multipodal formation of TiO2 nanotubes using anodization. In AIP Conference Proceedings; AIP Publishing LLC: Melville, NY, USA, 2019; p. 2082. [Google Scholar]
  14. Liang, Y.; Guan, Z.C.; Wang, H.P.; Du, R.G. Enhanced photoelectrochemical anticorrosion performance of WO3/TiO2 nanotube composite films formed by anodization and electrodeposition. Electrochem. Commun. 2017, 77, 120–123. [Google Scholar] [CrossRef]
  15. Macak, J.M.; Tsuchiya, H.; Schmuki, P. High-aspect-ratio TiO2 nanotubes by anodization of titanium. Angew. Chem. Int. Ed. 2005, 44, 2100–2102. [Google Scholar] [CrossRef]
  16. Lerch, S.; Reinhard, B.M. Effect of interstitial palladium on plasmon-driven charge transfer in nanoparticle dimers. Nat. Commun. 2018, 9, 1608. [Google Scholar] [CrossRef] [Green Version]
  17. Liu, J.; Zhang, L.; Zang, D.; Wu, H. A Competitive Reaction Strategy toward Binary Metal Sulfides for Tailoring Electromagnetic Wave Absorption. Adv. Funct. Mater. 2021, 31, 2105018. [Google Scholar] [CrossRef]
  18. Liu, J.; Zhang, L.; Wu, H.; Zang, D. Boosted electromagnetic wave absorption performance from vacancies, defects and interfaces engineering in Co (OH) F/Zn0. 76Co0. 24S/Co3S4 composite. Chem. Eng. J. 2021, 411, 128601. [Google Scholar] [CrossRef]
  19. Liu, J.; Wang, M.; Zhang, L.; Zang, D.; Liu, H.; Liotta, L.F.; Wu, H. Tunable sulfur vacancies and hetero-interfaces of FeS2-based composites for high-efficiency electromagnetic wave absorption. J. Colloid Interface Sci. 2021, 591, 148–160. [Google Scholar] [CrossRef]
  20. Liu, J.; Zhang, L.; Wu, H. Electromagnetic wave absorbing performance of carbons, carbides, oxides, ferrites and sulfides: Review and perspective. J. Phys. D Appl. Phys. 2021, 54, 203001. [Google Scholar] [CrossRef]
  21. Arkusz, K.; Paradowska, E.; Nycz, M.; Krasicka-Cydzik, E. Influence of Thermal Modification and Morphology of TiO2 nanotubes on their electrochemical properties for biosensors applications. J. Nanosci. Nanotechnol. 2018, 18, 3713–3721. [Google Scholar] [CrossRef]
  22. Kim, W.T.; Choi, W.Y. Interferometric Biosensor Using TiO2 Nanotube Arrays. Appl. Mech. Mater. Trans. Tech. Publ. 2017, 864, 212–217. [Google Scholar] [CrossRef]
  23. Schmuki, P.; Liu, N.; Altomare, M. TiO2 Nanotube Arrays: Photoelectrochemical and Photocatalytic Applications. In ECS Meeting Abstracts; IOP Publishing: Bristol, UK, 2019; Volume MA2019-01, p. 2061. [Google Scholar]
  24. Zghab, E.; Hamandi, M.; Dappozze, F.; Kochkar, H.; Zina, M.S.; Guillard, C.; Berhault, G. Influence of graphene and copper on the photocatalytic response of TiO2 nanotubes. Mater. Sci. Semicond. Process. 2020, 107, 104847. [Google Scholar] [CrossRef]
  25. Çırak, B.B.; Caglar, B.; Kılınç, T.; Karadeniz, S.M.; Erdoğan, Y.; Kılıç, S.; Çırak, Ç. Synthesis and characterization of ZnO nanorice decorated TiO2 nanotubes for enhanced photocatalytic activity. Mater. Res. Bullet. 2019, 109, 160–167. [Google Scholar] [CrossRef]
  26. Yang, X.; Chen, Z.; Zhou, D.; Zhao, W.; Qian, X.; Yang, Q.; Shen, C. Ultra-low Au–Pt Co-decorated TiO2 nanotube arrays: Construction and its improved visible-light-induced photocatalytic properties. Solar Energy Mater. Solar Cells 2019, 201, 110065. [Google Scholar] [CrossRef]
  27. Gogoi, D.; Namdeo, A.; Golder, A.K.; Peela, N.R. Ag-doped TiO2 photocatalysts with effective charge transfer for highly efficient hydrogen production through water splitting. Int. J. Hydrog. Energy 2020, 45, 2729–2744. [Google Scholar] [CrossRef]
  28. Photharin, S.; Tipparach, U. Preparation and microstructure of Ag-doped TiO2 nanotubes by anodization method. Int. J. Appl. Eng. Res. 2017, 12, 1350–1354. [Google Scholar]
  29. Gaidi, M.; Trabelsi, K.; Hajjaji, A.; Chourou, M.L.; Alhazaa, A.N.; Bessais, B.; El Khakani, M.A. Optimizing the photochemical conversion of UV–vis light of silver-nanoparticles decorated TiO2 nanotubes based photoanodes. Nanotechnology 2017, 29, 015703. [Google Scholar] [CrossRef]
  30. Trabelsi, K.; Hajjaji, A.; Gaidi, M.; Bessais, B.; El Khakani, M.A. Enhancing the photoelectrochemical response of TiO2 nanotubes through their nanodecoration by pulsed-laser-deposited Ag nanoparticles. J. Appl. Phys. 2017, 122, 064503. [Google Scholar] [CrossRef]
  31. Hajjaji, A.; Jemai, S.; Rebhi, A.; Trabelsi, K.; Gaidi, M.; Alhazaa, A.N.; Bessais, B. Enhancement of photocatalytic and photoelectrochemical properties of TiO2 nanotubes sensitized by SILAR-Deposited PbS nanoparticles. J. Mater. 2020, 6, 62–69. [Google Scholar] [CrossRef]
  32. Hajjaji, A.; Jemai, S.; Trabelsi, K.; Kouki, A.; Assaker, I.B.; Ka, I.; El Khakani, M.A. Study of TiO2 nanotubes decorated with PbS nanoparticles elaborated by pulsed laser deposition: Microstructural, optoelectronic and photoelectrochemical properties. J. Mater. Sci. Mater. Electron. 2019, 30, 20935–20946. [Google Scholar] [CrossRef]
  33. Abidi, M.; Assadi, A.A.; Bouzaza, A.; Hajjaji, A.; Bessais, B.; Rtimi, S. Photocatalytic indoor/outdoor air treatment and bacterial inactivation on CuxO/TiO2 prepared by HiPIMS on polyester cloth under low intensity visible light. Appl. Catal. B Environ. 2019, 259, 118074. [Google Scholar] [CrossRef]
  34. Khaliq, N.; Rasheed, M.A.; Cha, G.; Khan, M.; Karim, S.; Schmuki, P.; Ali, G. Development of non-enzymatic cholesterol bio-sensor based on TiO2 nanotubes decorated with Cu2O nanoparticles. Sens. Actuators B Chem. 2020, 302, 127200. [Google Scholar] [CrossRef]
  35. Liu, Y.; Su, D.; Zhang, Y.; Wang, L.; Yang, G.; Shen, F.; Zhang, X.; Zhang, S. Anodized TiO2 nanotubes coated with Pt nanoparticles for enhanced photoelectrocatalytic activity. J. Mater. Res. 2017, 32, 757–765. [Google Scholar] [CrossRef]
  36. Xiang, C.; She, Z.; Zou, Y.; Cheng, J.; Chu, H.; Qiu, S.; Xu, F. A room-temperature hydrogen sensor based on Pd nanoparticles doped TiO2 nanotubes. Ceram. Int. 2014, 40, 16343–16348. [Google Scholar] [CrossRef]
  37. Pearson, A.; Jani, H.; Kalantar-Zadeh, K.; Bhargava, S.K.; Bansal, V. Gold nanoparticle-decorated keggin ions/TiO2 photococatalyst for improved solar light photocatalysis. Langmuir 2011, 27, 6661–6667. [Google Scholar] [CrossRef]
  38. Huang, Y.; Sun, L.; Xie, K.; Lai, Y.; Liu, B.; Ren, B.; Lin, C. SERS study of Ag nanoparticles electrodeposited on patterned TiO2 nanotube films. J. Raman Spectrosc. 2011, 42, 986–991. [Google Scholar] [CrossRef]
  39. Li, W.; Sun, Z.; Dongliang, T.; Nevirkovets, I.P.; Dou, S.-X. Platinum dendritic nanoparticles with magnetic behavior. J. Appl. Phys. 2014, 116, 033911. [Google Scholar] [CrossRef] [Green Version]
  40. Yuwono, A.H.; Sofyan, N.; Kartini, I.; Ferdiansyah, A.; Pujianto, T.H. Nanocrystallinity Enhancement of TiO2 Nanotubes by Post-Hydrothermal Treatment. Adv. Mater. Res. 2011, 277, 90–99. [Google Scholar] [CrossRef]
  41. Essalhi, Z.; Hartiti, B.; Lfakir, A.; Siadat, M.; Thevenin, P. Optical properties of TiO2 Thin films prepared by Sol Gel method. J. Mater. Environ. Sci. 2016, 7, 1328–1333. [Google Scholar]
  42. Wang, X.; Blackford, M.; Prince, K.; Caruso, R.A. Preparation of Boron-Doped Porous Titania Networks Containing Gold Nanoparticles with Enhanced Visible-Light Photocatalytic Activity. ACS Appl. Mater. Interfaces 2012, 4, 476–482. [Google Scholar] [CrossRef] [PubMed]
  43. Feng, H.; Chen, L.; Yuan, L.; Cai, Q. Visible light-induced efficiently oxidative decomposition of p-Nitrophenol by CdTe/TiO2 nanotube arrays. Chem. Eng. J. 2013, 215, 591–599. [Google Scholar] [CrossRef]
  44. Palau, J.; Assadi, A.A.; Penya-Roja, J.M.; Bouzaza, A.; Wolbert, D.; Martínez-Soria, V. Isovaleraldehyde degradation using UV photocatalytic and dielectric barrier discharge reactors, and their combinations. J. Photochem. Photobiol. A Chem. 2015, 299, 110–117. [Google Scholar] [CrossRef] [Green Version]
  45. Maxime, G.; Amine, A.A.; Abdelkrim, B.; Dominique, W. Removal of gas-phase ammonia and hydrogen sulfide using photocatalysis, nonthermal plasma, and combined plasma and photocatalysis at pilot scale. Environ. Sci. Pollut. Res. 2014, 21, 13127–13137. [Google Scholar] [CrossRef]
  46. Saoud, W.A.; Kane, A.; le Cann, P.; Gerard, A.; Lamaa, L.; Peruchon, L.; Brochier, C.; Bouzaza, A.; Wolbert, D.; Assadi, A.A. Innovative photocatalytic reactor for the degradation of VOCs and microorganism under simulated indoor air conditions: Cu-Ag/TiO2-based optical fibers at a pilot scale. Chem. Eng. J. 2021, 411, 128622. [Google Scholar] [CrossRef]
  47. Assadi, A.A.; Bouzaza, A.; Soutrel, I.; Petit, P.; Medimagh, K.; Wolbert, D. A study of pollution removal in exhaust gases from animal quartering centers by combining photocatalysis with surface discharge plasma: From pilot to industrial scale. Chem. Eng. Process. Process Intensif. 2017, 111, 1–6. [Google Scholar] [CrossRef]
Figure 1. Image of the batch reactor used for the photocatalytic performance of the simultaneous removal of microorganisms and volatile organic compounds.
Materials 14 07341 g001
Figure 2. SEM surface images of TiO2-NTs decorated with Pt-NPs: (a) after 200 s and (b) after 300 s.
Materials 14 07341 g002
Figure 3. EDX spectrum of TiO2-NTs decorated with Pt-NPs: (a) 200 and (b) 600 s.
Materials 14 07341 g003
Figure 4. TEM images of TiO2-NTs decorated with Pt-NPs over (a) 200 and (b) 600 s.
Materials 14 07341 g004
Figure 5. X-ray diffraction patterns of pure TiO2-NTs decorated with Pt-NPs.
Materials 14 07341 g005
Figure 6. The diffuse reflectance spectrum of TiO2-NTs decorated with Pt-NPs.
Materials 14 07341 g006
Figure 7. Kubelka–Munk transform of the diffuse reflectivity spectrum of pure TiO2-NTs.
Materials 14 07341 g007
Figure 8. Photoluminescence spectra of TiO2-NTs decorated with Pt-NPs at different electrodeposition times.
Materials 14 07341 g008
Figure 9. Normalized concentration (C/C0) of CYCLO versus Pt-NP decoration time.
Materials 14 07341 g009
Figure 10. Variations in the concentration of CYCLO using Pt-NPs/TiO2-NTs-300 s at different inlet concentrations.
Materials 14 07341 g010
Figure 11. (a) E. coli inactivation rate in the presence of CYCLO using the Pt-NPs/TiO2-NTs-300 s catalyst. The initial concentration of E. coli was a ~1.1 × 10³ CFU/mL) (b) variation of the CYCLO concentration in the presence of E. Coli.
Materials 14 07341 g011
Table 1. Optical band gap energy of TiO2 NTs versus Pt deposition time.
SampleTiO2-NTs
Pure
100 s Pt/TiO2 NTs200 s Pt/TiO2 NTs300 s Pt/TiO2 NTs600 s Pt/TiO2 NTs
Band Gap (eV)3.112.852.912.912.85
Table 2. L–H constants (kc and K) on Cu2O-NPs/TiO2-NTs-250 s catalyst.
kc: Kinetic Constant of L–H (mg.m−3. min−1)K: Adsorption Constant of L–H (m3. mg−1)
0.0645.27
Publisher’s Note: MDPI stays neutral with regard to jurisdictional claims in published maps and institutional affiliations.

