Abstract
The high strain rate deformation behavior and microstructure evolution of in situ TiB2 particle reinforced Al-Zn-Mg-Cu composite were investigated by means of Taylor impact. The dynamic tests were performed at three different impact velocities. Under three different velocities, no obvious shear failure occurred in the composite, indicating a good impact resistance. Compared to the quasi-static compression test, the dynamic yield strength increased obviously with the rise of velocity, even more than 1 GPa. The dislocation multiplication, phonon drag effect and ceramic reinforcement increased the flow stress of composite. Fine, equiaxed grain structure developed after impact, resulting from grain fragmentation or dynamic recrystallization. Finite element simulation of Taylor impact was qualitatively in agreement with the experiments, which was useful to elucidate the formation of equiaxed grain structure.
1. Introduction
Particulate-reinforced aluminum matrix composites (PRAMCs) have attracted attention due to their high strength, elastic modulus, hardness and good wear resistance compared with aluminum alloys [1,2]. At present, there are two main methods to fabricate PRAMCs: adding particles into the matrix (ex situ) and in situ growth [3,4,5,6]. The in situ method is to select the suitable glume (molecule or aggregate of molecules) and synthesize the reinforcing phase in situ by means of the chemical reaction between matrix and glume at appropriate temperature. In contrast to ex situ synthesized composites, in situ synthesized particulate-reinforced aluminum matrix composites, in particular, have the advantages of fine particle size and strong interface bonding, thus they have prospective uses in aerospace, the automobile industry and precision instruments. Several approaches are used to synthesize in situ TiB2/aluminum composites. Among these approaches, the salt-melt reaction technique is simple and economical [3], and it can produce particles with the correct stoichiometry [7]. In certain critical circumstances, the materials will likely undergo high-speed dynamic impacts, such as bird strikes, car collisions, et cetera, thus it is particularly important to study the deformation behavior of composites under high strain rate.
At present, intensive studies have focused on the mechanical behavior [8,9,10,11,12], microstructure evolution [13,14,15,16] and failure behavior [17,18,19] of alloys and composites under high strain rate by means of medium and high strain rate tension, Hopkinson bar, Taylor impact and finite element simulation [20,21,22,23,24]. Acosta et al. [20] developed a reliable method for obtaining the material constitutive parameters. The method was to transform the equivalent plastic strain in Taylor impact into Vickers hardness, and compare it with the results of nano-indentation of AISI 1010. Kumagai [23] assumed that the force on the undeformed volume of the projectile depended on the strain of the deformed volume, and developed the simple equation proposed by Hawkyard to predict the shapes of projectiles after Taylor impact tests more accurately. Chen et al. [12] fabricated 316 L stainless steel by cold metal transfer wire and arc additive manufacturing (CMT-WAAM) process and carried out the impact test. The as-built 316 L dynamically exhibits ~50% higher yield strength and twice the elastic modulus than in the quasi-static condition. Savage [16] studied the texture evolution of WE43 magnesium-rare earth alloy by Taylor impact. The material exhibited homogeneous and isotropic response over the strain rates, and the peak texture components after the impact had their c-axes closely aligned with the impact direction. Zhu et al. [10] found that the dynamic deformation behavior of high-volume fraction (up to 60%) PRAMCs was affected by strain rate hardening and adiabatic heating softening mechanism, which eventually led to a mixture of brittle cracking of reinforcing phase and ductile fracture of matrix alloy in the composite. Zhou et al. [25] studied the microstructure evolution of nano-twinned steel during ballistic impact by nano-indentation, scanning electron microscope (SEM), transmission electron microscope (TEM) and other techniques and they found that high strain rate promoted dislocation multiplication (the activation of dislocation source leading to the increase of dislocation density) and phonon drag effect of dislocation movement (induced by interactions between mobile dislocation and lattice vibration), remarkably increasing the hardness in the severe deformation zone. Obvious recrystallization occurred in the severe deformation zone due to temporarily to the significant temperature rise. In summary, previous studies mainly focused on the verification and modification of constitutive models in the process of high-speed impact. The evolution of microstructure and hard ceramic particles such as TiB2 in the deformation process were still inadequate.
The main purpose of this paper is to study the mechanical behavior and microstructural evolution of TiB2/7055Al matrix composites under high strain rate by Taylor impact test, and establish the internal relationship between the mechanical properties and microstructure evolution of the composite. The finite element simulation method is introduced to provide insights into the microstructure evolution of the composite.
2. Material and Experiment
The material used for this study was 6 wt % TiB2 particle reinforced Al-Zn-Mg-Cu composite fabricated by in situ mixed salt method as described in [26]. With an atomic ratio in accordance with Ti/2B, the mixed salts of K2TiF6 (CAS number: 16919-27-0) and KBF4 (CAS number: 14075-53-7) were introduced into a stirred Al melt during the synthesis. The exothermal reactions between the introduced salts and the molten Al are as follows:
The as-casted composites were processed by a novel two-pass accumulative orthogonal extrusion process (AOEP) [27]. Figure 1 shows the AOEP process. Firstly, the in situ casted composites were unidirectionally extruded at 723 K with an extrusion ratio of 10:1. The extruded composites were then sliced into small blocks from the center of extruded square plates with the longest side parallel to the extrusion direction. Two small blocks were polished and subsequently put together to form a square block. Several square blocks were stacked to form a square column. This stacked square column was orthogonally extruded to a plate at 723 K. After AOEP, the composites were subjected to solid solution at 748 K for 1 h, quenched in water, firstly aged at 383 K for 8 h and secondly aged at 438 K for 3 h.

Figure 1.
Schematic of accumulative orthogonal extrusion process (AOEP). ED: extrusion direction.
Quasi-static compression testing was carried out at a strain rate of 1 mm/min. The compression equipment was equipped with a 100 kN load cell sensor (SANS TESTING MACHINE CO., LTD, Shenzhen, China). Six specimens with a diameter of 5 mm and a height of 5 mm were cut from the extruded bars by wire electrical discharging machining and then mechanically grinded by 2500 grit silicon carbide paper.
The specimens for Taylor impact testing were flat cylindrical projectiles with a diameter of 8 mm and a length of 24 mm (aspect ratio 3:1). The impact velocity was 159.4, 190.4 and 221.7 m/s, measured from the high-speed camera (Photron, Tokyo, Japan), respectively. Figure 2 is the schematic of the commonly used Taylor impact equipment, which can reach a strain rate up to 105 s−1, to study the dynamic deformation behavior and microstructure evolution at high strain rate.

Figure 2.
Schematic of a Taylor impact equipment.
3. Result and Discussion
3.1. Microstructure of the AOEPed Samples
In as-cast composites, the particles tended to be pushed by the solid-liquid interface front and agglomerate at the grain boundary, as shown in Figure 3a [26]. Figure 3b,c shows the SEM images after two-pass of extrusion. The results indicated that the agglomeration of the particles was well dispersed. The particles were mainly aligned along the extrusion direction (ED), forming particle bands. Figure 3d–g shows that some ternary phases consisting of Al, Cu and Mg were also distributed along the extrusion direction around the TiB2 particles.
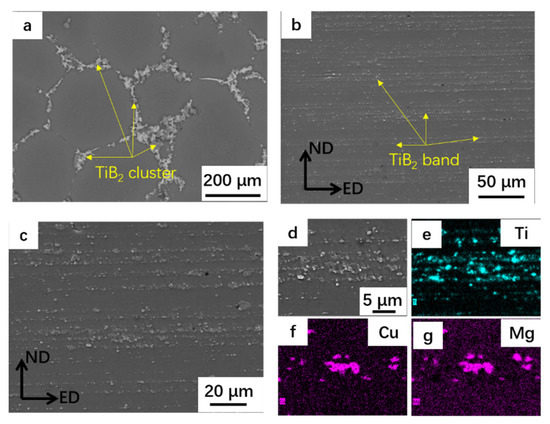
Figure 3.
Scanning electron microscope (SEM) micrographs of composite:(a) as-cast composites; (b) AOEPed composites; (c,d) are the magnification images; and (e–g) are the corresponding energy dispersive X-ray spectrometer (EDX) mappings of Ti, Cu and Mg in (d). ED: extrusion direction; ND: normal direction.
Figure 4a–c respectively shows the EBSD (electron backscattered diffraction) maps colored by IPF (inverse pole figure) with axis parallel to the extrusion direction, the relevant misorientations and aspect ratios of grains in the AOEP samples. Coarse columnar grains lay parallel to ED and fine grains co-existed in the AOEPed composite, respectively. After AOEP, low angle grain boundary dominated, as shown in Figure 4b.
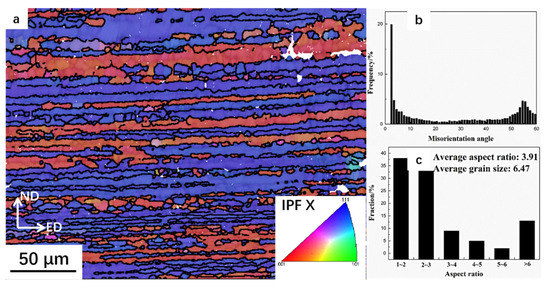
Figure 4.
(a) Electron backscattered diffraction (EBSD) maps of the specimens after AOEP colored by inverse pole figure (IPF) with axis parallel to the extrusion direction; (b) the misorientation angle distribution and (c) aspect ratio and average grain size.
3.2. Quasi-Static Compression Test
Six specimens were tested for quasi-static compression. Figure 5 shows one representative quasi-static compressive stress–strain curve of the composite. The stress–strain curve was marked by three distinctive regions. In the plastic region, the material exhibited high and uniform work hardening rate, the flow stress increased uniformly with the increase of strain. The stress–strain curves exhibited no obvious yield plateau. We therefore took as the yield strength of the composite, yielding a static yield strength of 673 MPa. When the load exceeded a critical value, the flow stress increased rapidly with strain due to the intense opposition between two sides of the specimen, as shown in the specimens after compression in Figure 5b.
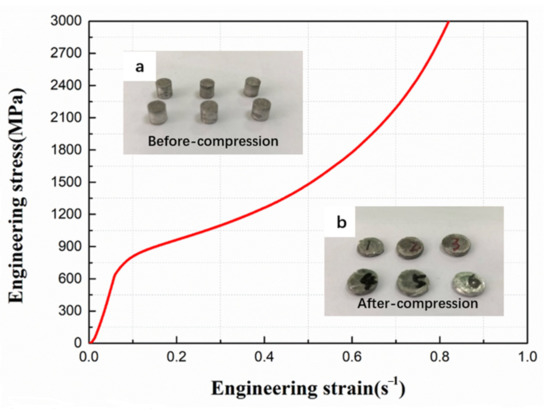
Figure 5.
Representative stress–strain curves of AOEP specimens at a strain rate of 1 × 10⁻⁴ s−1. The inset figure is the specimens before and after quasi-static compression for (a) and (b), respectively.
3.3. Taylor Impact Test
Taylor testing can be used to calculate the yield strength of materials at high strain rate (up to 105 s −1). Figure 6 is the schematic of the Taylor impact specimen before and after impact, from which the dynamic yield strength of the material can be estimated [28], with Equation (1):
where σs is the dynamic yield strength; is the material density; V is the impact velocity; L0, L1 and L2 are initial length, final length and unstrained length, respectively.
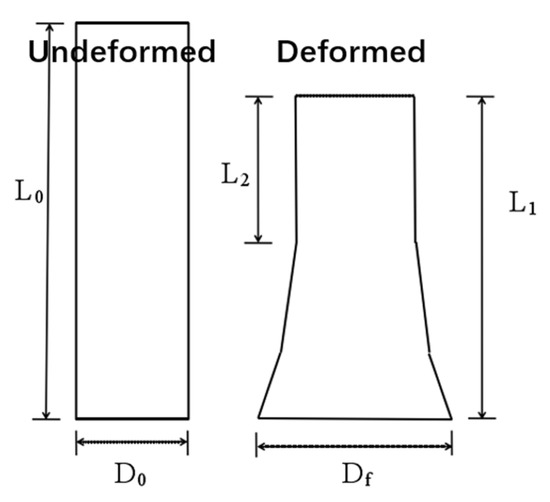
Figure 6.
Schematic of the Taylor impact specimen before and after impact.
The average strain and strain-rate can be calculated using Equations (2) and (3), respectively [29]:
Wilkins et al. proposed a simplified model to estimate the dynamic yield strength of materials [30]:
Other authors introduced a parameter to further modify the model, where the value could be regarded as a constant value to be 0.12:
Figure 7a,b shows the macroscopic morphology and silhouettes of the composite at different impact velocities, respectively. After deformation, the shape of the specimens typically assumed mushroom shapes, without noticeable shear fracture, indicating good impact resistance. With the increase of impact velocity, the specimen height L1 decreased and the final diameter Df increased.
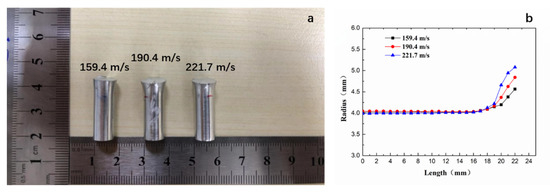
Figure 7.
(a,b) the shape and the silhouettes of the specimens at different impact velocities.
The experimental dynamic yield stresses were calculated using the contour of the specimens in Table 1. Figure 8 shows the dynamic yield stress after different impact velocities by Equations (1), (4) and (5), respectively.

Table 1.
The size of the Taylor impact specimens at different velocities.
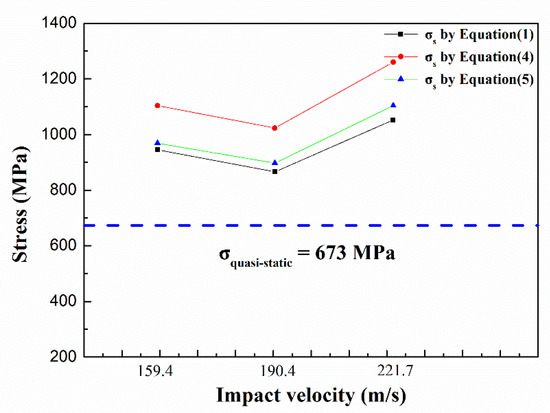
Figure 8.
Dynamic yield stress calculated by three equations. The column in black was calculated by Equation (1), the column in red was calculated by Equation (4) and the column in green was calculated by Equation (5). The blue dotted line represented the quasi-static yield strength.
It can be seen from Figure 7 that the strain rate had a remarkable influence on flow stress. The dynamic yield strength (>800 MPa) of the material was significantly higher than the quasi-static yield strength (673 MPa). An abnormal case in which the yield strength at 190.4 m/s was higher than the yield strength at 159.4 m/s occurred. Further investigations are needed to test and verify the strain rate sensitivity and the mechanism. After all, the sampling of the velocities was inadequate to clarify the dependence of strength on the strain rate in the present study. However, the yield strength of the material was obviously enhanced at high speed, even more than 1 GPa.
The traditional constitutive model was used to understand the increasing yield stress of the composite.
First, the flow stress can be decomposed as [31]:
where σ0 is the friction stress due to the solid solution and σf is the stress induced by forest dislocations. Forest dislocations refer to the entangled dislocations which hinder the movement of the mobile dislocations.
Additionally, σf can be described by [32]:
where α is a constant value related to the interaction strength between dislocations, G is the shear modulus, b is the Burgers vector and is the total dislocation density, containing mobile dislocations and forest dislocation.
During the deformation, the applied strain rate should be equal to the strain rate inside, which is linked to the mobile dislocation density and the velocity of the mobile dislocation, as in Equation (8):
where is the mobile dislocation density and is the velocity of mobile dislocation.
In order to match the strain rate inside the material with the applied strain rate, the dislocation density and the dislocation velocity will change significantly. At relatively low strain rate, the mobile dislocation density will increase with the applied strain rate, giving rise to the total dislocation density. This will make increase according to Equation (7), resulting in the increase of flow stress. When the strain rate is higher, the density of the mobile dislocations will be saturated and their speeds are increased accordingly, making the interactions among dislocations, particles, grain boundaries and precipitates more frequent. The flow stress will rise as a result. When the strain rate exceeds 103 s−1, the velocity of the mobile dislocation is sufficiently high, phonon drag effect induced by the interaction between lattice vibration and the mobile dislocations plays an important role in the increase of yield strength, which is neglected at low strain rate [33]. All the factors mentioned above account for the increase in the dynamic yield strength. Due to the high stacking fault energy of the Al alloy, deformation by twinning was unlikely and not observed in the experimental results.
The effect of TiB2 particle on the flow stress cannot be ignored at all strain rates. Due to the introduction of particles into the composites, the following two factors probably lead to the increase of strength. Firstly, the misfit strain induced by the incoherency of atomic arrangement at the interface increased the density of dislocations; secondly, at high strain rates, particles could significantly hinder the movement of dislocations, resulting in the increase of dislocation resistance.
3.4. Grain Structure Variation during Impacting
Figure 9 shows the polarization microscopy of grain structure of the material after different impact velocities. Figure 9(a-1,b-1,c-1,d-1) were composed of several polarized images to show the entire microstructure distribution of the specimen, respectively. Figure 9a shows the microstructure before deformation. Corresponding to the SEM and EBSD results, the projectile showed typical extrusion grain structure. When the specimen was impacted at v = 159.4 m/s, the grain did not seem to change seriously. At the end of the specimen, the grains were distorted, evidently in contrast to the initial specimens. When the velocity reached 190.4 m/s, the grain structure changed significantly. It mainly contained two areas: extrusion texture grains at the bottom and sides of the specimen and equiaxed grains at the end and the center of the specimen. The closer the area to the head and the center, the smaller the grain size was. Two reasons that may account for the formation of the equiaxed grains: (i) Dynamic impact results in an increase in the material energy, which increases the driving force of recrystallization (especially rotational dynamic recrystallization because of such a short time interval) [34]. (ii) The local area of the composite underwent an extremely high deformation in such a short time, so the primary grains were sheared and broken to adapt to macro-deformation.
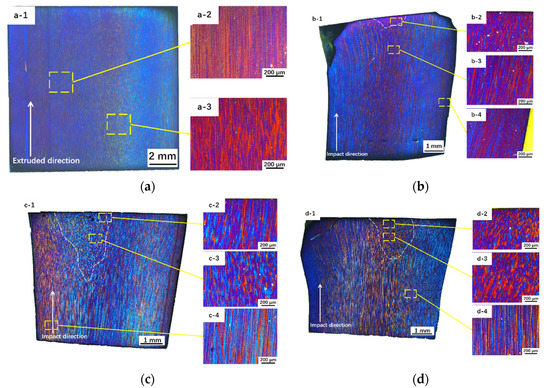
Figure 9.
Polarized metallographic structure of the specimens after impact at different velocities: (a) AOEP, (a-2) and (a-3) are enlarged pictures of (a-1), which show the typical elongation grains along the extrusion direction; (b) v = 159.4 m/s; (c) v = 190.4 m/s; and (d) v = 221.7 m/s; After impact, the specimen mainly contains two regions: severe deformation region and small deformation zone. (b-2,b-3,b-4) are the enlarged pictures of the severe deformation region, the boundary and the small deformation zone in (b-1), respectively. (c) and (d) are the same as (b).
3.5. Particle Variation during Impacting
Figure 10 shows the particle distribution of the specimens before and after impact. It is observed that the dynamic impact has little effect on particle distribution. The distribution band of particles deviated from the direction of extrusion and impact. In contrast to precipitates such as the phase which will be decomposed by the dislocation cutting and redissolving in the Al-Cu alloy [35], and brittle fracture of ex situ particles [10], the in situ TiB2 particles in this study did not show any obvious brittle fracturing under dynamic loading, due to the high modulus of the ceramics particles and small size thanks to the in situ synthetization. Meanwhile, the TiB2 particle had a good coherency with the Al matrix and a clean interface, preventing cracks from debonding at the interface.
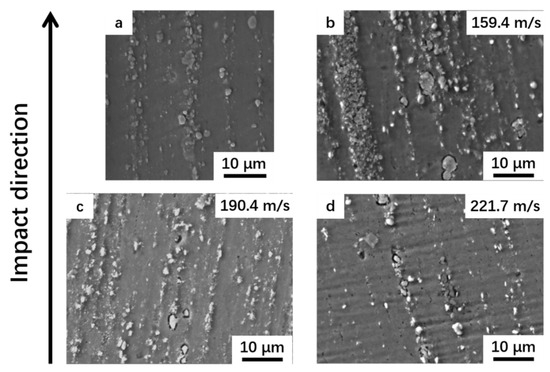
Figure 10.
SEM micrographs of specimens (a) before impact; and after impact at different velocities: (b) v = 159.4 m/s; (c) v = 190.4 m/s and (d) v = 221.7 m/s.
3.6. Taylor Impact Test Finite Element Model
The finite element simulations of the Taylor impact process at different impact speeds were carried out by ABAQUS/Explicit software. The constitutive model was a Johnson–Cook model (JC model) of aluminum alloy [36]. The JC model was a phenomenological constitutive model which considered the strength as a function of strain, strain rate and temperature.
The Johnson–Cook equation is as follows:
where and are strain hardening coefficients, is strain rate sensitivity and is the thermal softening coefficient.
At room temperature, , the equation can be simplified as:
The main parameters used in the finite element models are shown in Table 2. E is the elastic modulus and is the Poisson’s ratio. Parameters of the JC model were calculated by fitting the compression stress–strain curve of the composite.

Table 2.
Parameter used in Taylor impact finite element model.
The simulation results of Taylor impact were qualitatively in agreement with the experimental results. As shown in Figure 11. The results of finite element simulation show that the deformation of the specimen is mainly concentrated in the head of the projectile, and the most severe deformation occurred at the center of the head. However, no obvious plastic deformation occurred in the unstrained region. The strain distribution in simulation was consistent with the microstructure evolution shown in Figure 9, in which the microstructure evolution (formation of equiaxed grain) mainly occurred at the head of the specimens and the rest remained unchanged. The large strain at the head may account for the microstructure evolution. Meanwhile, as shown in Table 3, the height of the specimens after impact decreased with the increase of the impact velocity, which showed a similar trend as the experiment results in Table 1. The above two aspects confirmed the reliability of our simulation results. However, the results of finite element simulation showed a discrepancy with the experiment quantitatively. The height of deformed specimen in simulation is slightly lower than that of the experiment, which may be caused by two factors: (i) The contact between the anvil and the specimen was not ideally flat, resulting in deviation axisymmetric deformation, and hence, overestimation of the measured specimen length; (ii) JC model was relatively simple, and the effect of particles on material strength enhancement was not considered in the model, so the simulation results were lower than the real value. Future work will focus on matching the results between simulation and experiment by changing the parameters in the constitutive model, so as to obtain the real constitutive model parameters of the composite.
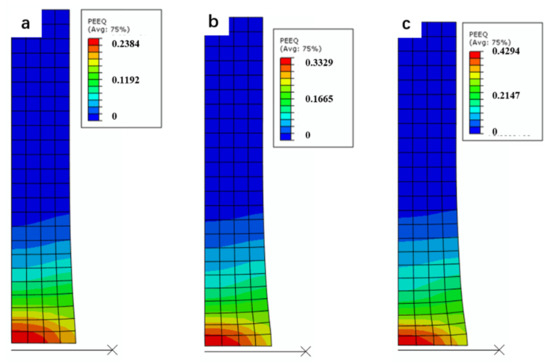
Figure 11.
Effective plastic strain contour plot at different velocities: (a) v = 159.4 m/s; (b) v = 190.4 m/s and (c) v = 221.7 m/s.

Table 3.
The main results from Taylor impact finite element model.
4. Conclusions
In this study, in situ TiB2 particle reinforced aluminum matrix composites were prepared, and the aggregation of particles in the composites was dispersed by a two-pass AOEP process. The quasi-static compression tests and Taylor impact tests were carried out to study the mechanical behavior and microstructure evolution of the composite. Based on ABAQUS/Explicit software, the JC equation was used as the constitutive model to simulate the impact process. The main conclusions were as follows:
- The dynamic yield strength of the composite was significantly higher than that of the quasi-static compression, and there was no shear fracture in the composite. This was mainly due to the phonon drag effect at high strain rate, more frequent interaction among dislocations, particles, grain boundaries, et cetera, and the increased hindrance to dislocation motion.
- After impact, the grain structure in the head of the specimen changed obviously, from the original typical extruded grain structure (mixed structure of large grains and small grains) to the nearly equiaxed grain structure, due to the severe deformation at the head, resulting in grain breakage or rotational dynamic recrystallization during high strain rate deformation.
- SEM images show that the particle distribution of the composites did not change significantly after impact, still mainly forming particle bands. The direction of the band changed. There was no brittle fracture of TiB2 particles and debonding of the interface with the matrix, showing better impact resistance of the composite offered by the TiB2 particles.
- The finite element results show that the simulation results by JC model were in agreement with the experimental results. During Taylor impact, the deformation was mainly concentrated in the head, especially in the center. With the increase of impact velocity, the degree of local plastic deformation increased significantly (from 0.238 to 0.429), which led to the microstructural transformation.
Future research will be focused on: the strain rate sensitivity of the composite; further analysis on fine, equiaxed grain structure after impact by means of TKD (transmission Kikuchi diffraction) and TEM (transmission electron microscopy) equipment; and refinement of the constitutive model for composites.
Author Contributions
Conceptualization, F.Z. and Z.C.; methodology, Y.W. and X.H.; software, H.L.; validation, H.L. and Z.Y.; formal analysis, P.R.; investigation, F.Z.; resources, X.H.; data curation, H.L.; writing—original draft preparation, H.L. and Z.Y.; writing—review and editing, F.Z. and Z.C.; project administration, Z.C. and H.W.; funding acquisition, Z.C. and H.W. All authors have read and agreed to the published version of the manuscript.
Funding
This research was funded by Aviation Science Foundation of China: 20174157008 and National Natural Science Foundation of China: 51971137.
Institutional Review Board Statement
Not applicable.
Informed Consent Statement
Not applicable.
Data Availability Statement
Data available in a publicly accessible repository.
Conflicts of Interest
The authors declare no conflict of interest.
References
- Natarajan, S.; Narayanasamy, R.; Kumaresh Babu, S.; Dinesh, G.; Anil Kumar, B.; Sivaprasad, K. Sliding wear behaviour of Al 6063/TiB2 in situ composites at elevated temperatures. Mater. Des. 2009, 30, 2521–2531. [Google Scholar] [CrossRef]
- Yue, N.L.; Lu, L.; Lai, M.O. Application of thermodynamic calculation in the in-situ process of Al/TiB2. Compos. Struct. 1999, 47, 691–694. [Google Scholar] [CrossRef]
- Ramesh, C.S.; Ahamed, A.; Channabasappa, B.H.; Keshavamurthy, R. Development of Al 6063–TiB2 in situ composites. Mater. Des. 2010, 31, 2230–2236. [Google Scholar] [CrossRef]
- Emamy, M.; Mahta, M.; Rasizadeh, J. Formation of TiB2 particles during dissolution of TiAl3 in Al–TiB2 metal matrix composite using an in situ technique. Compos. Sci. Technol. 2006, 66, 1063–1066. [Google Scholar] [CrossRef]
- Tjong, S.C.; Ma, Z.Y. Microstructural and mechanical characteristics of in situ metal matrix composites. Mater. Sci. Eng. R Rep. 2000, 29, 49–113. [Google Scholar] [CrossRef]
- Kumar, S.; Sarma, V.S.; Murty, B.S. Influence of in situ formed TiB2 particles on the abrasive wear behaviour of Al–4Cu alloy. Mater. Sci. Eng. A 2007, 465, 160–164. [Google Scholar] [CrossRef]
- Jenix Rino, J.; Balasivanandha Prabu, S.; Paskaramoorthy, R. Comparison of thermal and mechanical properties of Al-5wt.%TiB2 and Al-5wt.%ZrB2 composites processed through salt-melt reaction route. Mater. Today Proc. 2017, 4, 8739–8750. [Google Scholar] [CrossRef]
- Tan, Z.H.; Pang, B.J.; Qin, D.T.; Shi, J.Y.; Gai, B.Z. The compressive properties of 2024Al matrix composites reinforced with high content SiC particles at various strain rates. Mater. Sci. Eng. A 2008, 489, 302–309. [Google Scholar] [CrossRef]
- Zaiemyekeh, Z.; Liaghat, G.H.; Ahmadi, H.; Khan, M.K.; Razmkhah, O. Effect of strain rate on deformation behavior of aluminum matrix composites with Al2O3 nanoparticles. Mater. Sci. Eng. A 2019, 753, 276–284. [Google Scholar] [CrossRef]
- Zhu, D.; Wu, G.; Chen, G.; Zhang, Q. Dynamic deformation behavior of a high reinforcement content TiB2/Al composite at high strain rates. Mater. Sci. Eng. A 2008, 487, 536–540. [Google Scholar] [CrossRef]
- Song, K.; Geng, Y.; Ban, Y.; Zhang, Y.; Li, Z.; Mi, X.; Cao, J.; Zhou, Y.; Zhang, X. Effects of strain rates on dynamic deformation behavior of Cu-20Ag alloy. J. Mater. Sci. Technol. 2021, 79, 75–87. [Google Scholar] [CrossRef]
- Chen, J.; Wei, H.; Zhang, X.; Peng, Y.; Kong, J.; Wang, K. Flow behavior and microstructure evolution during dynamic deformation of 316 L stainless steel fabricated by wire and arc additive manufacturing. Mater Des. 2021, 198, 109325. [Google Scholar] [CrossRef]
- Hörnqvist, M.; Mortazavi, N.; Halvarsson, M.; Ruggiero, A.; Iannitti, G.; Bonora, N. Deformation and texture evolution of OFHC copper during dynamic tensile extrusion. Acta Mater. 2015, 89, 163–180. [Google Scholar] [CrossRef]
- Mishra, A.; Martin, M.; Thadhani, N.N.; Kad, B.K.; Kenik, E.A.; Meyers, M.A. High-strain-rate response of ultra-fine-grained copper. Acta Mater. 2008, 56, 2770–2783. [Google Scholar] [CrossRef]
- Zhang, W.; Chen, X.; Zhuo, B.; Li, P.; He, L. Effect of strain rate and temperature on dynamic mechanical behavior and microstructure evolution of ultra-high strength aluminum alloy. Mater. Sci. Eng. A 2018, 730, 336–344. [Google Scholar] [CrossRef]
- Savage, D.J.; McWilliams, B.A.; Vogel, S.D.; Trujillo, C.P.; Beyerlein, I.J.; Knezevic, M. Mechanical behavior and texture evolution of WE43 magnesium-rare earth alloy in Split-Hopkinson Pressure Bar and Taylor Impact Cylinder Testing. Int. J. Impact Eng. 2020, 143, 103589. [Google Scholar] [CrossRef]
- Chichili, D.R.; Ramesh, K.T. Dynamic failure mechanisms in a 6061-T6 Al/Al2O3 metal—matrix composite. Int. J. Solids Struct. 1995, 32, 2609–2626. [Google Scholar] [CrossRef]
- Vogt, R.; Zhang, Z.; Huskins, E.; Ahn, B.; Nutt, S.; Ramesh, K.T.; Lavernia, E.J.; Schoenung, J.M. High strain rate deformation and resultant damage mechanisms in ultrafine-grained aluminum matrix composites. Mater. Sci. Eng. A 2010, 527, 5990–5996. [Google Scholar] [CrossRef]
- Chu, M.Y.; Jiao, Z.M.; Wu, R.F.; Wang, Z.H.; Yang, H.J.; Wang, Y.S.; Qiao, J.W. Quasi-static and dynamic deformation behaviors of an in-situ Ti-based metallic glass matrix composite. J. Alloys Compd. 2015, 640, 305–310. [Google Scholar] [CrossRef]
- Acosta, C.A.; Hernandez, C.; Maranon, A. Casas-Rodriguez, Validation of material constitutive parameters for the AISI 1010 steel from Taylor impact tests. Mater. Des. 2016, 110, 324–331. [Google Scholar] [CrossRef]
- Hernandez, C.; Maranon, A. Determination of constitutive parameters from a Taylor test using inverse analysis. Strain 2017, 53, e12249. [Google Scholar] [CrossRef]
- Konokman, H.E.; Çoruh, M.M.; Kayran, A. Computational and experimental study of high-speed impact of metallic Taylor cylinders. Acta Mech. 2011, 220, 61–85. [Google Scholar] [CrossRef]
- Kumagai, T.; Sakai, S.; Hata, H.; Yamada, H. A modified ‘Hawkyard’s method to predict the deformation of projectiles in Taylor impact tests. Int. J. Impact Eng. 2020, 138, 103468. [Google Scholar] [CrossRef]
- Sen, S.; Banerjee, B.; Shaw, A. Taylor impact test revisited: Determination of plasticity parameters for metals at high strain rate. Int. J. Solids Struct. 2020, 194, 357–374. [Google Scholar] [CrossRef]
- Zhou, P.; Liang, Z.Y.; Huang, M.X. Microstructural evolution of a nanotwinned steel under extremely high-strain-rate deformation. Acta Mater. 2018, 149, 407–415. [Google Scholar] [CrossRef]
- Ma, S.M.; Zhang, P.; Ji, G.; Chen, Z.; Sun, G.A.; Zhong, S.Y.; Ji, Z.; Wang, H.W. Microstructure and mechanical properties of friction stir processed Al–Mg–Si alloys dispersion-strengthened by nanosized TiB2 particles. J. Alloys Compd. 2014, 616, 128–136. [Google Scholar] [CrossRef]
- Liu, J.; Chen, Z.; Zhang, F.; Ji, G.; Wang, M.; Ma, Y.; Ji, V.; Zhong, S.; Wu, Y.; Wang, H. Simultaneously increasing strength and ductility of nanoparticles reinforced Al composites via accumulative orthogonal extrusion process. Mater. Res. Lett. 2018, 6, 406–412. [Google Scholar] [CrossRef]
- Taylor, G.I. The use of flat-ended projectiles for determining dynamic yield stress I. Theoretical considerations. Proc. R. Soc. A 1948, 194, 289–299. [Google Scholar]
- Bae, K.O.; Shin, H.S.; Huh, H.; Park, L.J.; Kim, H.W. Evaluation of Dynamic Deformation Properties of Metallic Materials with Different Crystal Structures Using Taylor Impact Test. Appl. Mech. Mater. 2014, 566, 146–151. [Google Scholar] [CrossRef]
- Wilkins, M.L.; Guinan, M.W. Impact of cylinders on a rigid boundary. J. Appl. Phys. 1973, 44, 1200–1206. [Google Scholar] [CrossRef]
- Liang, Z.Y.; Wang, W.; Huang, W.; Huang, M.X. Strain rate sensitivity and evolution of dislocations and twins in a twinning-induced plasticity steel. Acta Mater. 2015, 8, 170–179. [Google Scholar] [CrossRef]
- Scott, C.; Remy, B.; Collet, J.-L.; Cael, A.; Bao, C.; Danoix, F.; Malard, B.; Curfs, C. Precipitation strengthening in high manganese austenitic TWIP steels. Int. J. Mater. Res. 2011, 102, 538–549. [Google Scholar] [CrossRef]
- Meyers, M.A. Plastic Deformation in Shock Waves. Dyn. Behav. Mater. 1994, 382–447. [Google Scholar] [CrossRef]
- Nicolaÿ, A.; Fiorucci, G.; Franchet, J.M.; Cormier, J.; Bozzolo, N. Influence of strain rate on subsolvus dynamic and post-dynamic recrystallization kinetics of Inconel 718. Acta Mater. 2019, 174, 406–417. [Google Scholar] [CrossRef]
- Da-xiang, S.; Xin-ming, Z.; Ling-ying, Y.; Gang, G.; Hai-chun, J.; Xing-hui, G. Evolution of θ′ precipitate in aluminum alloy 2519A impacted by split Hopkinson bar. Mater. Sci. Eng. A 2015, 620, 241–245. [Google Scholar] [CrossRef]
- Johnson, G.; Cook, W.H. A Constitutive Model And Data For Metals Subjected To Large Strains, High Strain Rates And High Temperatures. In Proceedings of the 7th International Symposium on Ballistics, The Hague, The Netherlands, 19–21 April 1983. [Google Scholar]
Publisher’s Note: MDPI stays neutral with regard to jurisdictional claims in published maps and institutional affiliations. |
© 2021 by the authors. Licensee MDPI, Basel, Switzerland. This article is an open access article distributed under the terms and conditions of the Creative Commons Attribution (CC BY) license (http://creativecommons.org/licenses/by/4.0/).