1. Introduction
The development of society has led to a continuous improvement of the construction techniques to create voluminous buildings [
1,
2]. Concrete is certainly one of the most important building materials in the modern era [
3,
4].
Since ancient times, the use of binders and similar materials characterized the history of man’s settlements, but only with Romans concrete was used as a modern connotation [
5,
6]. In fact, Romans used stone scraps called
caementum mixed with lime and a
pulvis puteolana (pozzolanic powder) which constituted the binder of the mixture [
7,
8].
Nowadays, concrete indicates a conglomerate formed by cement, aggregates (gravel or crushed stone, sand) and water which, hardening, gives rise to a real artificial stone [
9]. In modern concrete, the addition of artificial and natural fibers or additives to improve its mechanical and workability characteristics is also fundamental [
10,
11].
The apparently simple composition of the concrete underestimates the problems of degradation that can arise in the short and long term due to the presence of macro and micro pollutants or to reactivity with the aggregates [
12,
13]. After about a century of using concrete in the engineering field, there is a need to know every single detail of the fundamental constituent, especially chemical and petrographic, in order to avoid the risk of creating poor mixtures, as, after a more or less short period from installation, they may lose some of their physical-mechanical and/or structural-compositional properties [
14].
The Council Directive 89/106/EEC declares that construction products must possess characteristics that impose important requirements of mechanical strength and stability, safety in case of fire, energy saving, protection against noise, hygiene and safety in use [
15]. On May 2004, the CE marking for aggregates came into force, or the certification of the performance characteristics of each product. The fundamental characteristics that the aggregates must have are: size and shape of the particles; resistance to fragmentation/crushing; resistance to sanding/abrasion; chemical composition; presence or absence of dangerous substances; frost durability; and durability against alkali–silica reaction [
16].
In addition, the UNI EN 12620:2013 deals with the correct qualitative characterization of the aggregates that must be used in the packaging of concrete [
17].
For all these reasons, a correct assessment of the medium- and long-term effects is necessary to verify the suitability of the materials both at the delivery of the work and after periods of exposure to the mechanical stresses imposed by anthropogenic activities [
18] and to the chemical-physical variations that may be imposed on the environment [
19].
This study aimed to characterize the lithic component of the concrete with specific laboratory tests aimed at highlighting its strengths and defects in the best possible way. Furthermore, we wanted to petrographically and mechanically compare mixtures of concrete made with aggregates of different types and different genesis: e.g., natural conglomerates with a high form factor with a smooth surface, originated from quarries in different regions; and artificial breccia obtained by crushing natural conglomerates and characterized by irregular morphology and high surface roughness.
The aggregates used in the construction field come from the processing of natural deposits geologically called conglomerates, consolidated sedimentary deposits consisting of a preponderant content of more or less rounded pebbles and gravels [
20,
21]. The alluvial conglomerates available for the Italian aggregate market have a strong lithological diversity as most are made up of well-rounded river pebbles or conglomerates whose composition substantially reflects the type of outcrops in the catchment basin [
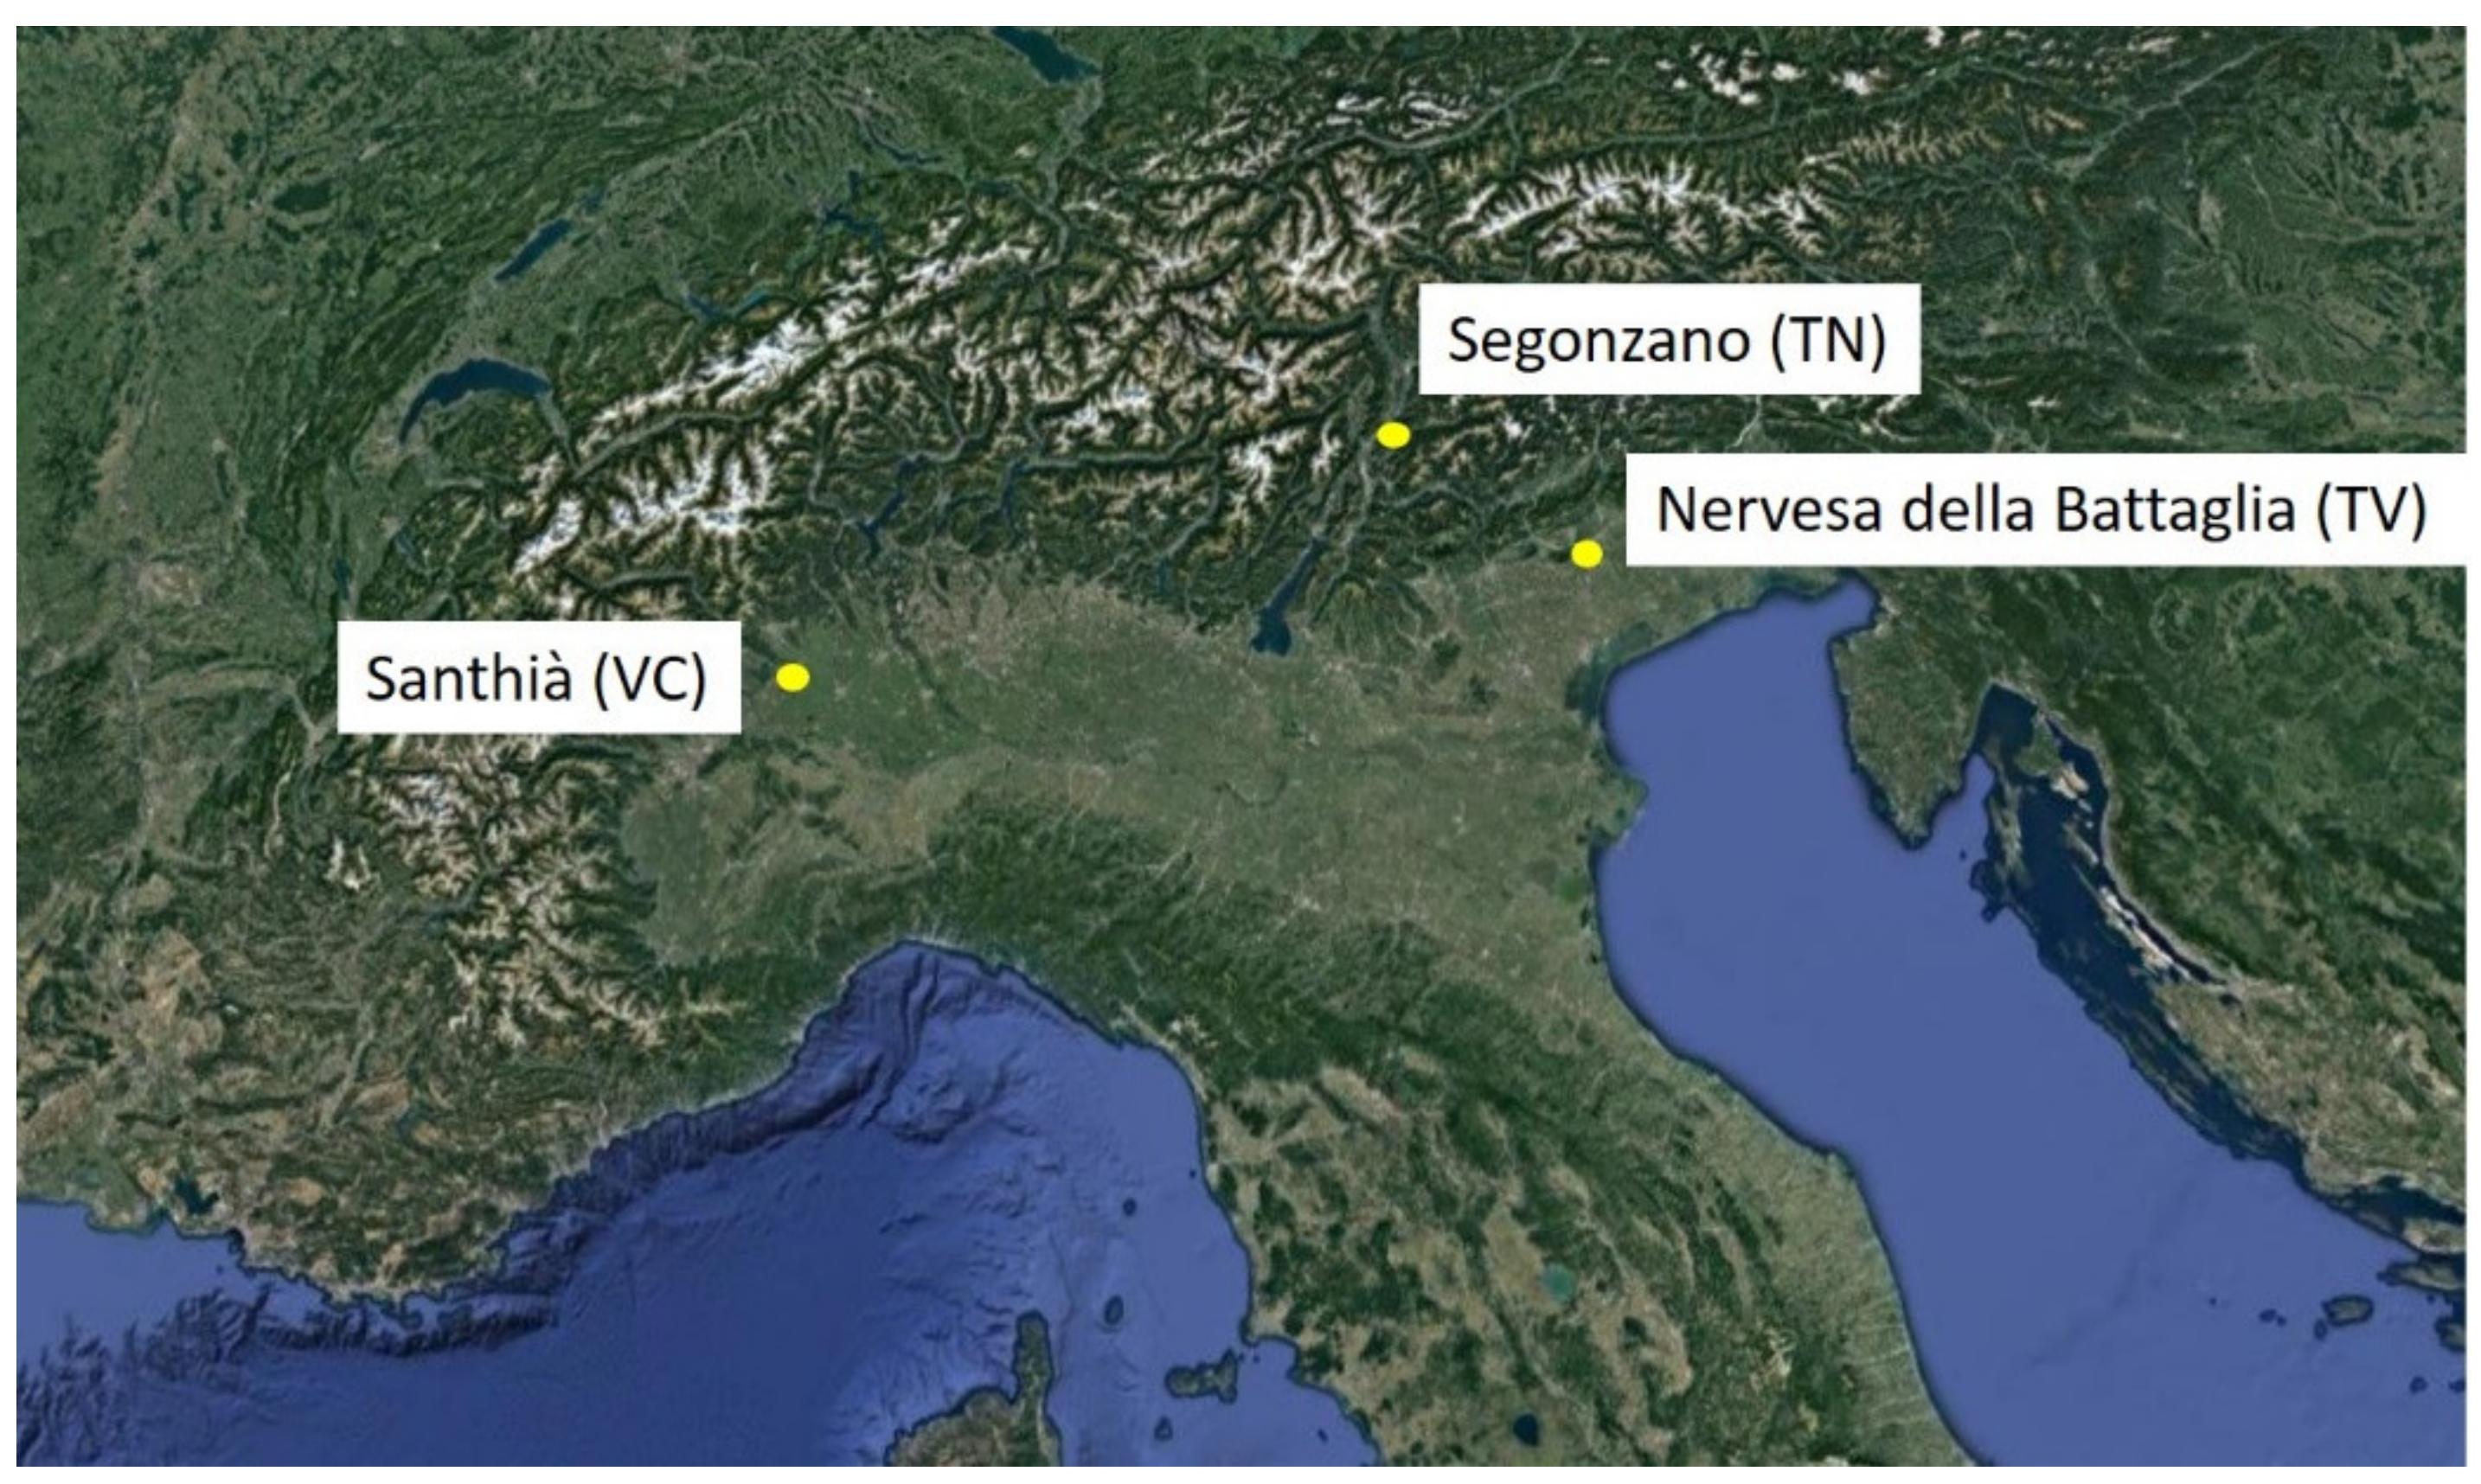
22]. The aggregates used for this research work came from quarries in different geographical areas of northern Italy: Nervesa della Battaglia (Treviso), Santhià (Vercelli) and Segonzano (Trento), which, respectively, produce concrete with aggregates from calcareous, metamorphic and artificial aggregates of porphyry. The studied conglomerates respond to mixes actually existing and used in the construction sector and in which the inert aggregates are selected to provide a good skeleton to the mixture, thus trying to achieve the best possible mechanical characteristics with the imposed water/cement ratio (w/c).
The suitability of the different types of aggregates was determined using the main laboratory tests, physical-mechanical and thermal, which the UNI EN standard normally requires from producers of aggregates [
23,
24,
25,
26,
27]. For the characterization of each lithological group, petrographic investigations that are also required by the UNI EN standards were carried out [
28]. Finally, thanks to the use of a stereomicroscope, the possible relationships that aggregates of different shapes (rounded or artificially crushed) and cement paste are able to offer were observed. Finally, physical-mechanical characteristics of the mixtures made with aggregates deriving from conglomerates of different origins were determined through mechanical resistance tests.
2. Materials and Methods
2.1. Samples Description
Three different types of aggregates were compared: (a) conglomerate of carbonate sedimentary rocks from Nervesa della Battaglia (Treviso, Italy); (b) conglomerate of silicate and carbonate metamorphic rocks from Santhià (Vercelli, Italy); and (c) artificial porphyry aggregates from waste processing in the extraction of slabs and blocks for ornaments from Segonzano (Trento, Italy).
Figure 1 shows the three different sampling sites of the analyzed material, all located in the northern part of Italy.
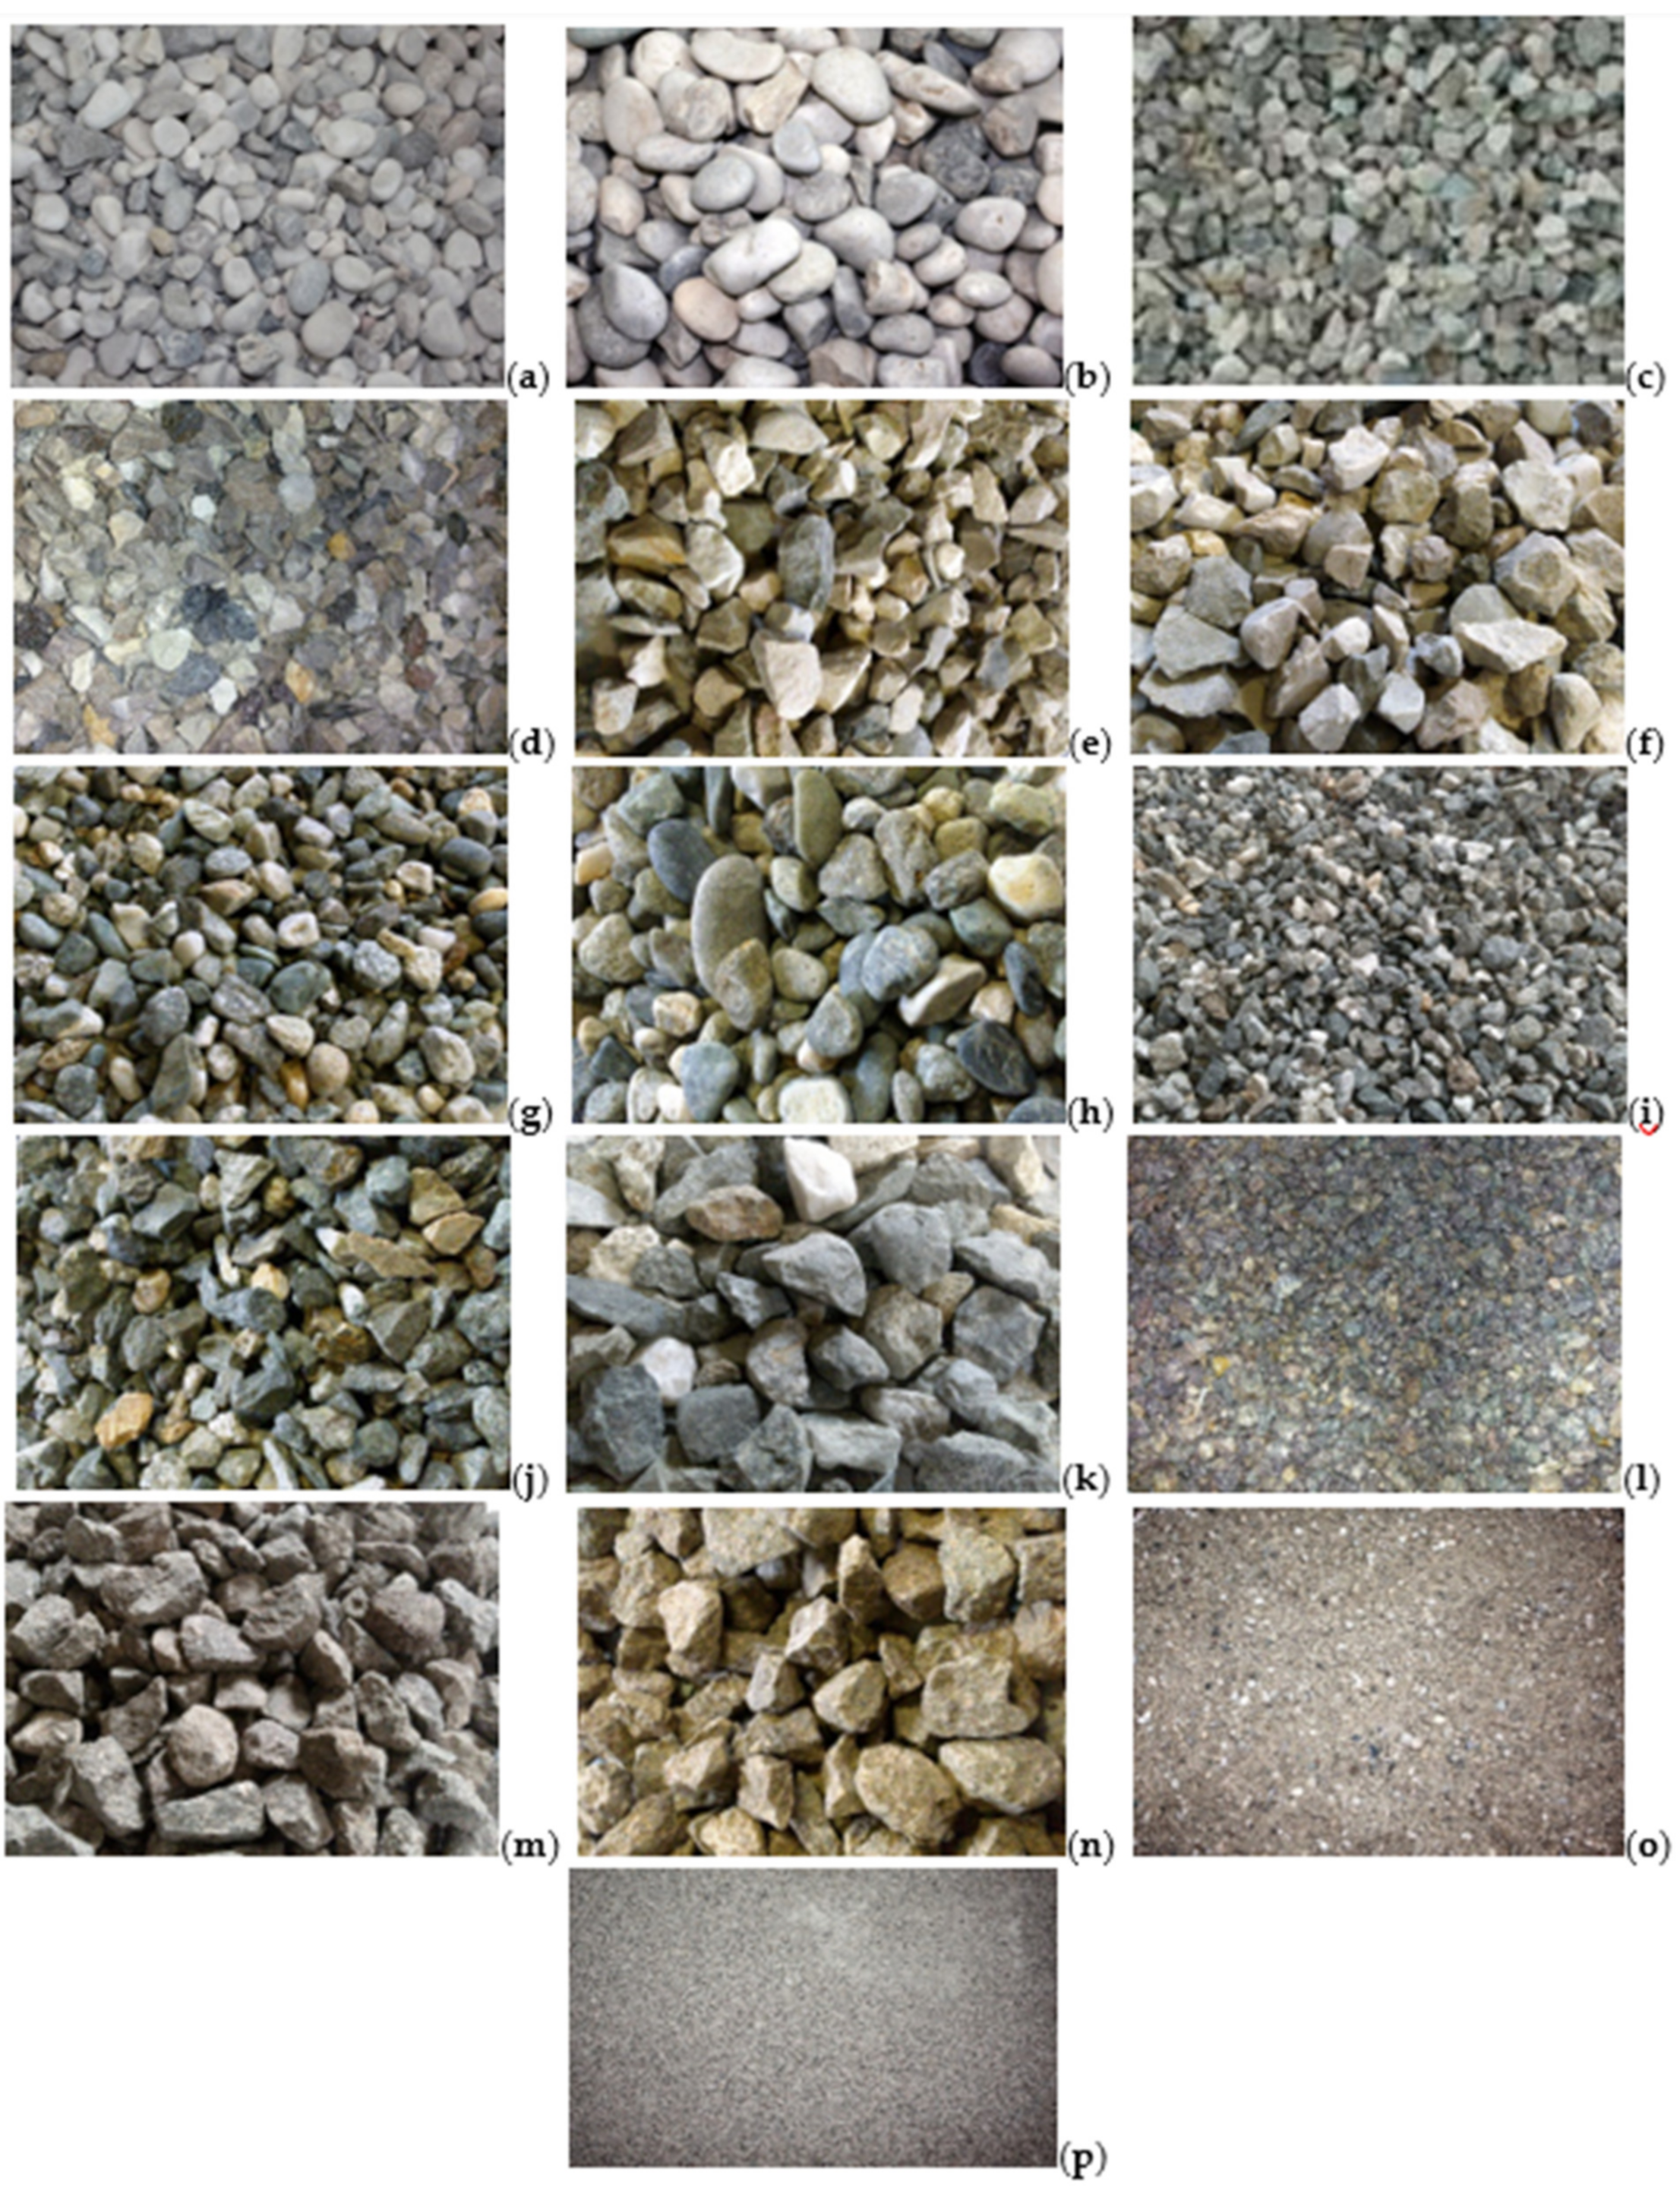
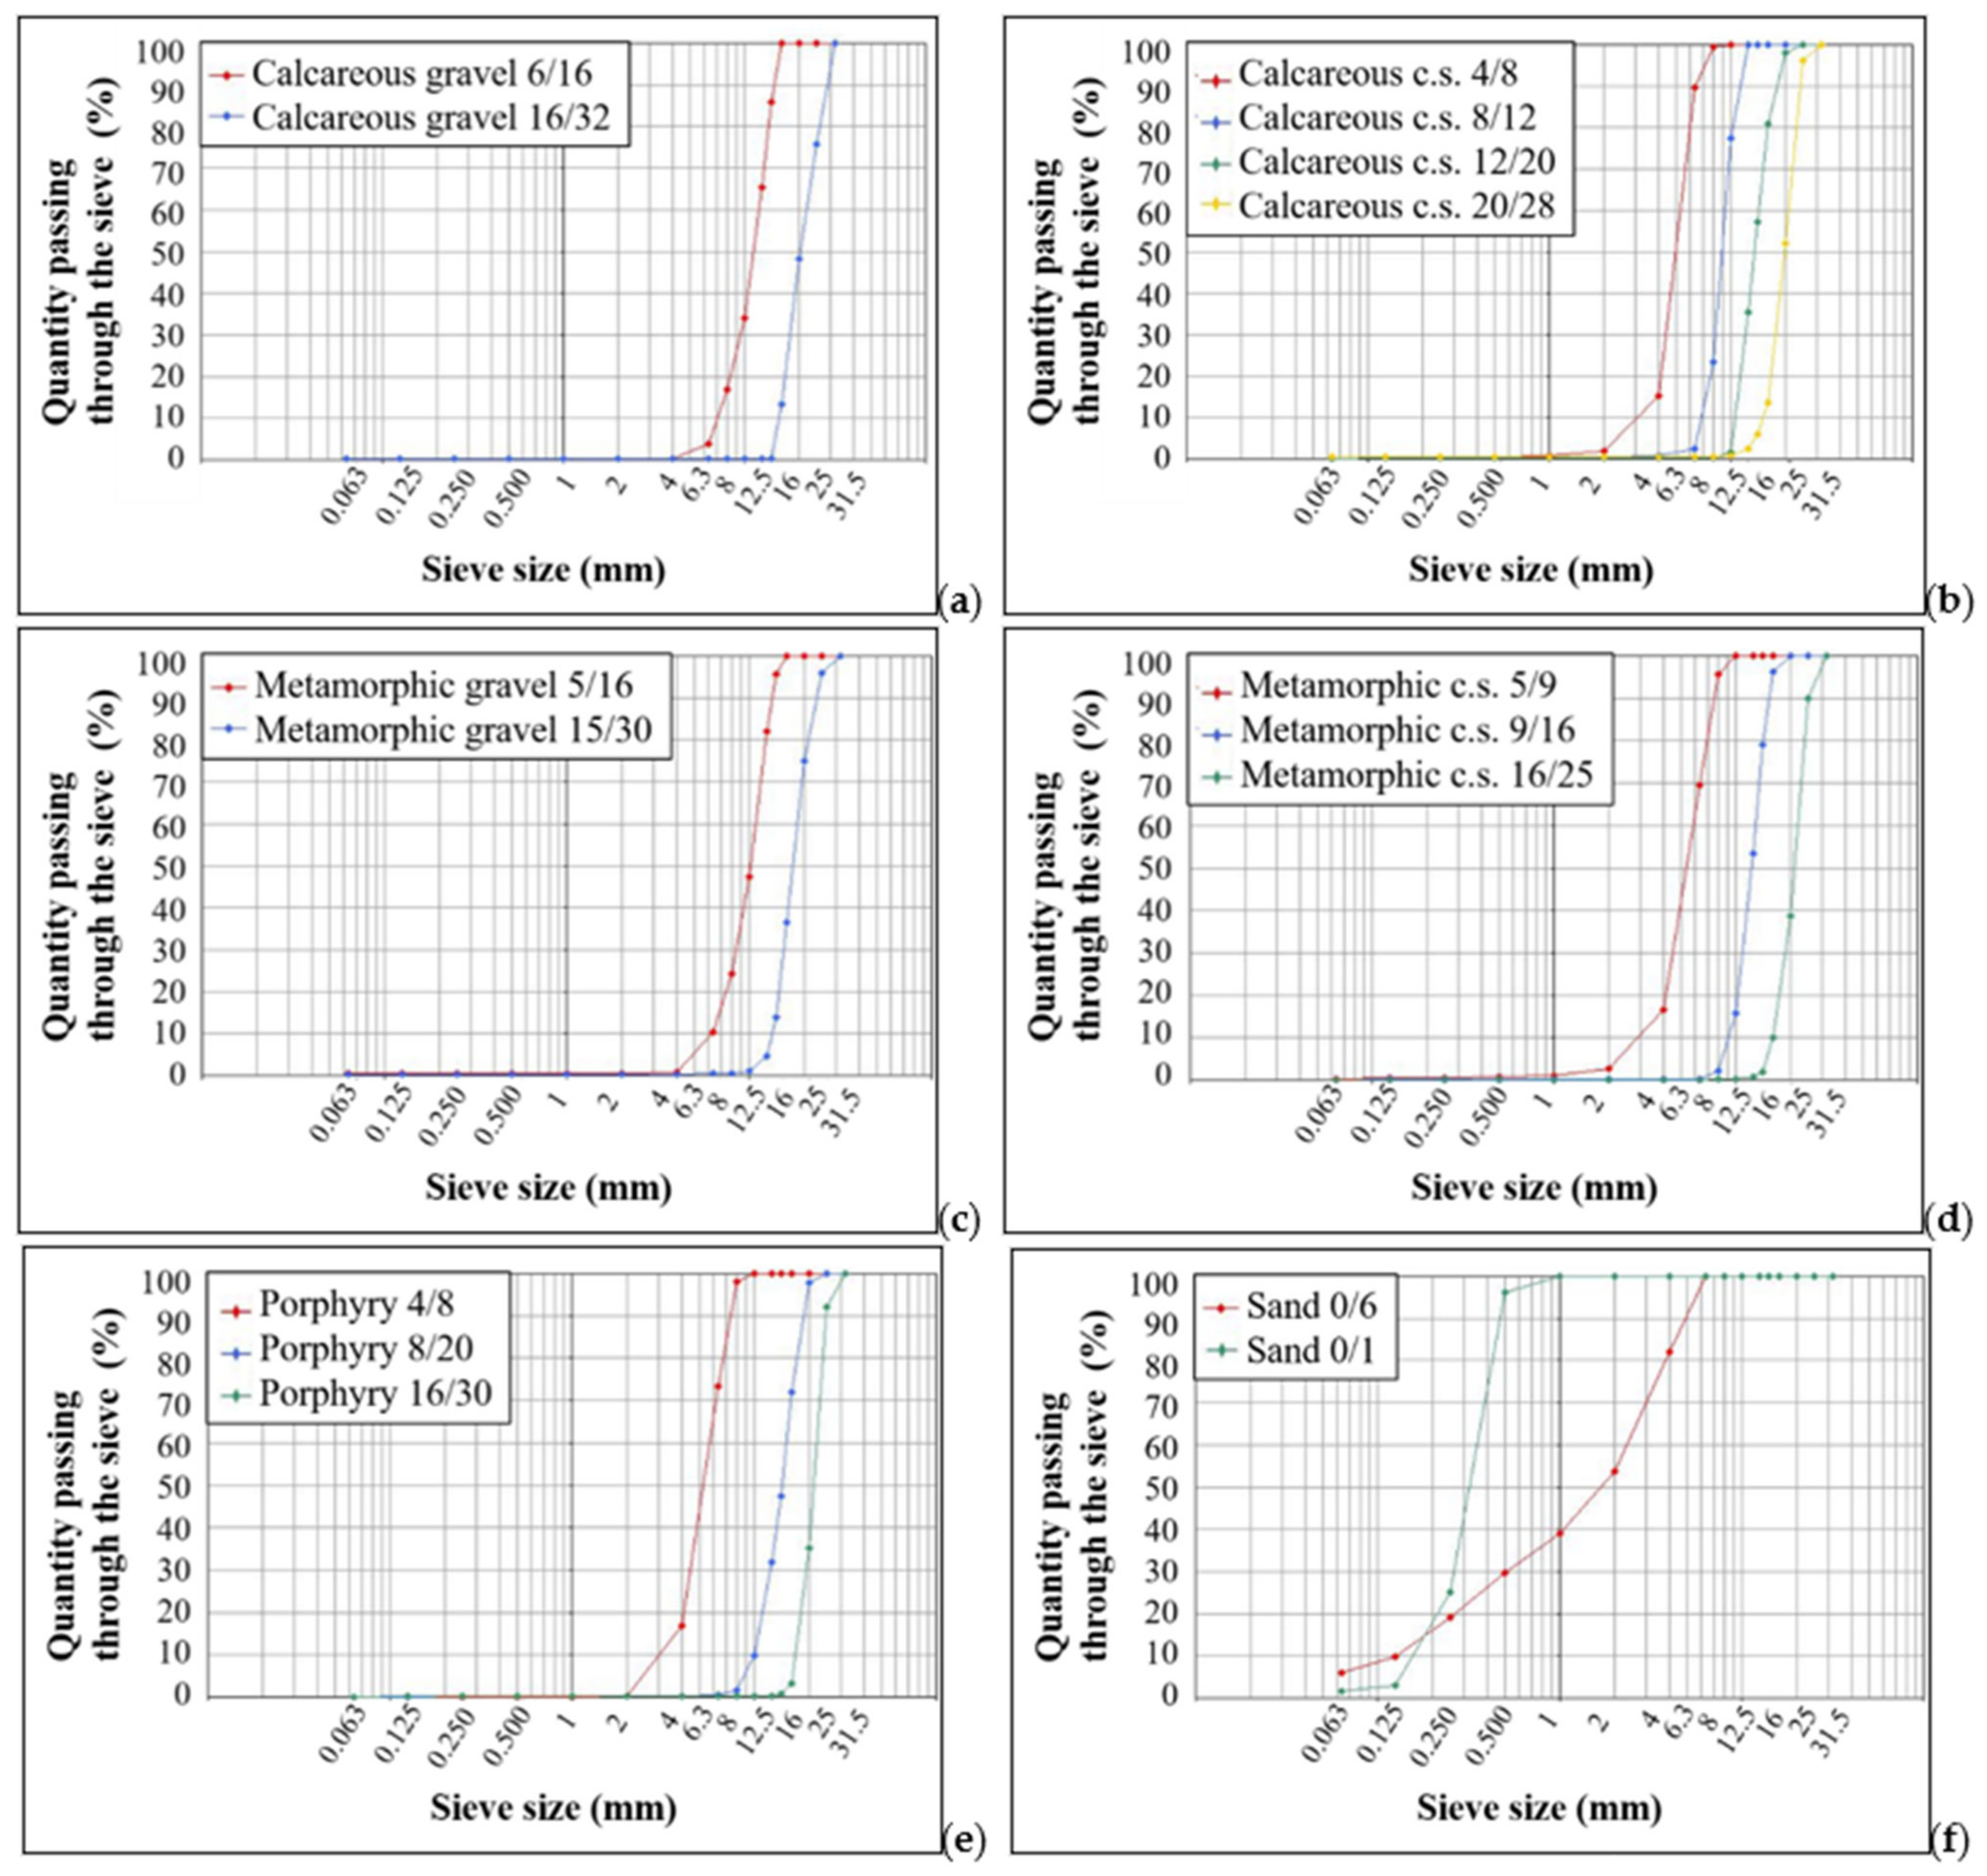
Figure 2 shows the photos of the aggregates used. The calcareous aggregates came from the processing and selection of Quaternary alluvial conglomerate gravels deposited in the Veneto–Friuli plain by fluvioglacial landform currents originating from the melting of the Piave Glacier (Würm) [
29]. Samples of natural and inert gravels coming from the crushing of the calcareous gravels were selected in different sizes: calcareous gravel 6/16 (
Figure 2a); calcareous gravel 16/32 (
Figure 2b); calcareous crushed stone 4/8 (
Figure 2c); calcareous crushed stone 8/12 (
Figure 2d); calcareous crushed stone 12/20 (
Figure 2e); and calcareous crushed stone 20/28 (
Figure 2f).
The metamorphic aggregates, on the other hand, came from the selection of alluvial conglomerate gravels of the Vercelli plain originating by the fluvioglacial activity between the Riss and Würm glaciations (moraine amphitheater of Ivrea) [
30]. Samples of natural and inert gravels coming from the crushing of metamorphic gravels were selected in the following sizes: metamorphic gravel 5/16 (
Figure 2g); metamorphic gravel 15/30 (
Figure 2h); metamorphic crushed stone 5/9 (
Figure 2i); metamorphic crushed stone 9/16 (
Figure 2j); and metamorphic crushed stone 16/25 (
Figure 2k).
Finally, the porphyry aggregates were obtained from the processing of rhyolitic ignimbritic deposits of the Atesina porphyritic platform that originated following the Permian volcanic activity [
31]. The crushed aggregates analyzed were selected in the following sizes: porphyry 4/8 (
Figure 2l); porphyry 8/20 (
Figure 2m); and porphyry 16/30 (
Figure 2n).
In addition, two different calcareous sand samples were used, characterized by different sizes 0/6 and 0/1, as shown in
Figure 2o,p, respectively.
For each of these three types of aggregates, concrete mixtures were made both with aggregates from the original conglomerates and with materials obtained from their crushing.
The preparation of a single type of mixture with the use of the same water/cement ratio (w/c) but with different aggregates highlights possible strengths and weaknesses of some lithologies rather than others. The description of the mixtures was better described in
Section 2.3.
For the fine fraction, a medium-coarse sand with calcareous gravel and a medium-fine sand (nomenclature according to Wentworth dimensional classification [
32]) were used, both collected in the mining area of Nervesa della Battaglia (Treviso, Italy).
2.2. Laboratory Tests
First of all, specific analyses were carried out on the individual aggregates to evaluate all their characteristics in order to then be able to establish the parameters necessary to create the concrete mixes. All the analyses were carried out at the Laboratory of the Department of Physics and Earth Sciences of the University of Ferrara (Italy).
The analyses performed on the individual aggregates were: particle size analyses [
33,
34,
35,
36,
37], determination of the physical-mechanical properties [
23,
24,
25,
26], description of the thermal and degradability properties of the material and petrographic analyses [
27,
28].
Petrographic analysis is important to identify the presence or not of minerals responsible for the alkali–silica reaction [
38,
39]. It is generally associated with the presence of alkali (sodium and potassium) in the cement and of amorphous or poorly crystalline silica in some aggregates. Amorphous silica is present where minerals, such as opal or microcrystalline quartz, are observed and also by the presence of volcanic glass and siliceous fragments of fossils, such as remains of radiolarians, diatoms and spicules of sponges [
40]. These constituents can interact with the alkaline elements of the cement to form a sort of frozen alkaline silicate capable of swelling in a humid environment [
41]. The optical stereomicroscope Optika SZ6745TR (Ponteranica, Bergamo, Italy) equipped with Moticam 2500 5.0 M pixel webcam was used for reflected light observation on thin section. The Motic Images Plus 2.0 ML software (Motic Instruments Inc., Richmond, Canada) was used to analyze the observation obtained [
42]. Observation on thin sections was conducted using transmitted light polarized microscopy (BX51 Olympus, Tokyo, Japan).
2.3. Mixture Creation
The analyses of the single aggregates made it possible to identify the characteristics of the analyzed material. Thanks to this, it was possible to obtain five mixtures on which the compressive strength tests and petrographic analyses were carried out.
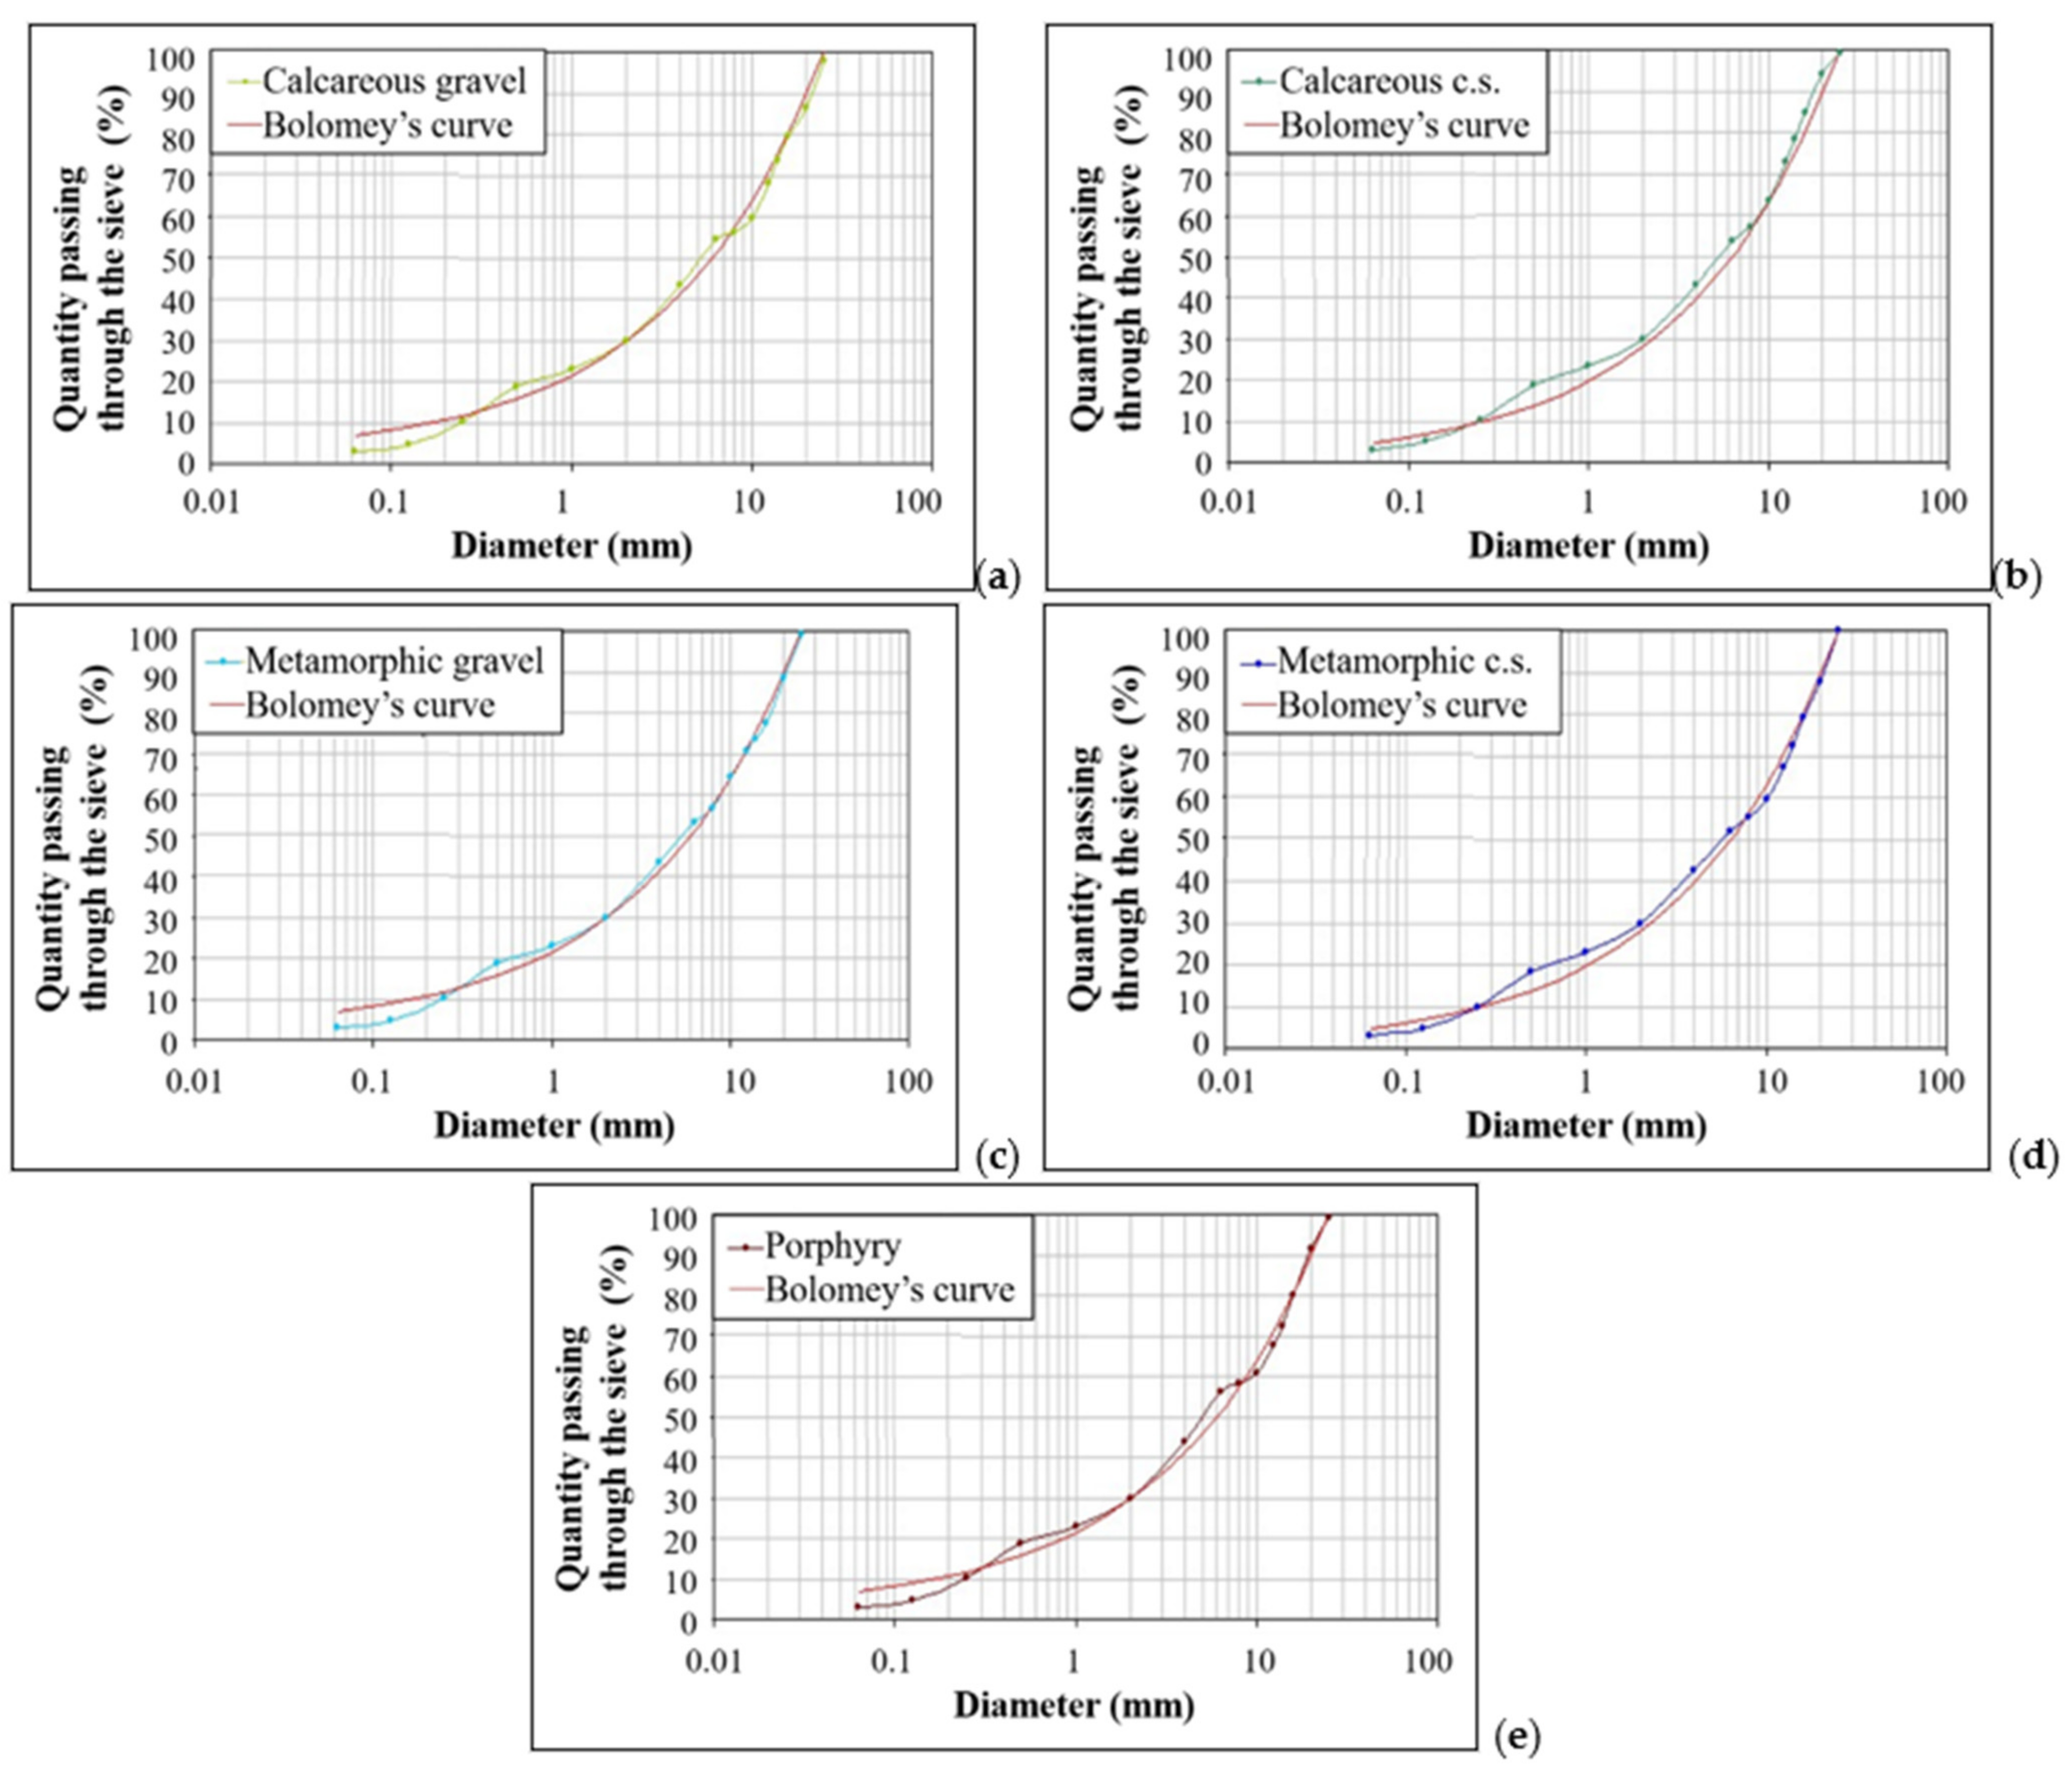
To prepare the concrete, the compressive strength class had to first be chosen from which the minimum w/c ratio to use was deduced. Then the optimal particle size curve was determined, obtained using a predetermined theoretical curve as a reference (Bolomey’s curve) [
43,
44].
Five mixtures were obtained using the constant parameters set out above and the formulation of an ordinary type of concrete: XC2 mixture with resistance class C25/30 [
45], minimum w/c ratio of 0.60 and minimum cement content of 300 Kg/m
3 (values indicated in the UNI EN 11104:2016 [
46]). Another important step was to calculate the liters of water necessary to maintain the desired w/c ratio, knowing the minimum quantity of cement provided by the UNI EN 206-1:2006 [
47] (or UNI EN 11104:2016 for the application in Italy of the UNI EN 206-1:2006). The quantities by weight of the aggregates were determined starting from the respective volumetric quantities deducted from the percentages of each fraction in the granulometric curve, and, knowing the bulk density of each fraction used, the quantity by weight per unit volume was obtained.
In compliance with the formulation of an ordinary concrete such as those packaged in concrete mixing plants, it was decided to add a plasticizing additive equal to an amount of 0.8% on the weight of the cement in order to obtain an increase in the consistency class with relative improvement in the workability characteristics.
The same quantities of the two different types of sand samples were used for all the mixtures to ensure the same type of fine-fraction constant, thus varying only the granular material. This arrangement was necessary to establish an initial starting point for the correct comparison of the mechanical results deduced from the subsequent simple compression test.
Two different quantities of cement and water were used for the mixtures with crushed aggregates and with rounded aggregates of the gravel. The quantity of water was increased or decreased by 10 kg/m3, respectively, for crushed aggregate or rounded gravel aggregate. This was because the flow between the crushed aggregates was less than that between the rounded aggregates due to their different geometric shape: multi-sided and polyhedral for the former and smoother for the latter. The increase in friction between the polyhedral aggregates would lead to a decrease in the degree of sliding on each other and therefore to a consequent decrease in workability and in the relative consistency of the slump classification. These different quantities of water were therefore related to two different quantities of cement in order to obtain a constant w/c ratio for all set at 0.58.
Table 1,
Table 2,
Table 3,
Table 4 and
Table 5 summarize the dosages by weight of the various components (aggregates, water, cement and additive) referred to a volume of 1 m
3 of concrete and equivalent to 1000 L.
To mix the components, a laboratory concrete mixer was used which made it possible to obtain mixtures of 50 L each, a quantity necessary for the formation of a fair number of cubes for each type of mixture.
For each mixture obtained, the workability measurement was immediately carried out through the
Abrams cone lowering test (UNI EN 12350-2:2019), which consists of the measurement of the fall of a fresh concrete cone suitably formed inside a conical mold with standardized dimensions [
48]. The concrete cone was settled into the mold as much as plastic, and therefore the mixture was workable. The measure determined from the highest point of the collapsed mixture to the maximum possible height of the cone, given by the metal mold, will fall within one of the concrete slump classes (S) [
47]. A consistency class of S4 was obtained for all the mixtures, characterized by a lowering of the cone between 160 and 210 mm, and which therefore confers a fair fluidity particularly useful in conditions of strong reinforcement of the work. This consistency was mainly attributable to the use of the fluidifying additive, which allowed for an increase in the workability of the mixture in place of the reduced introduction of water into the mixture. This aspect had a positive effect on the quantity of cement to be used; in fact, to keep the w/c ratio unchanged, the decrease in water led to a corresponding decrease in cement, with positive implications from a practical (less heat of hydration) and economic point of view.
4. Discussion
The final comparison of the data obtained made it possible to identify some mixtures of aggregates that could provide good physical-mechanical and lithological characteristics to concrete.
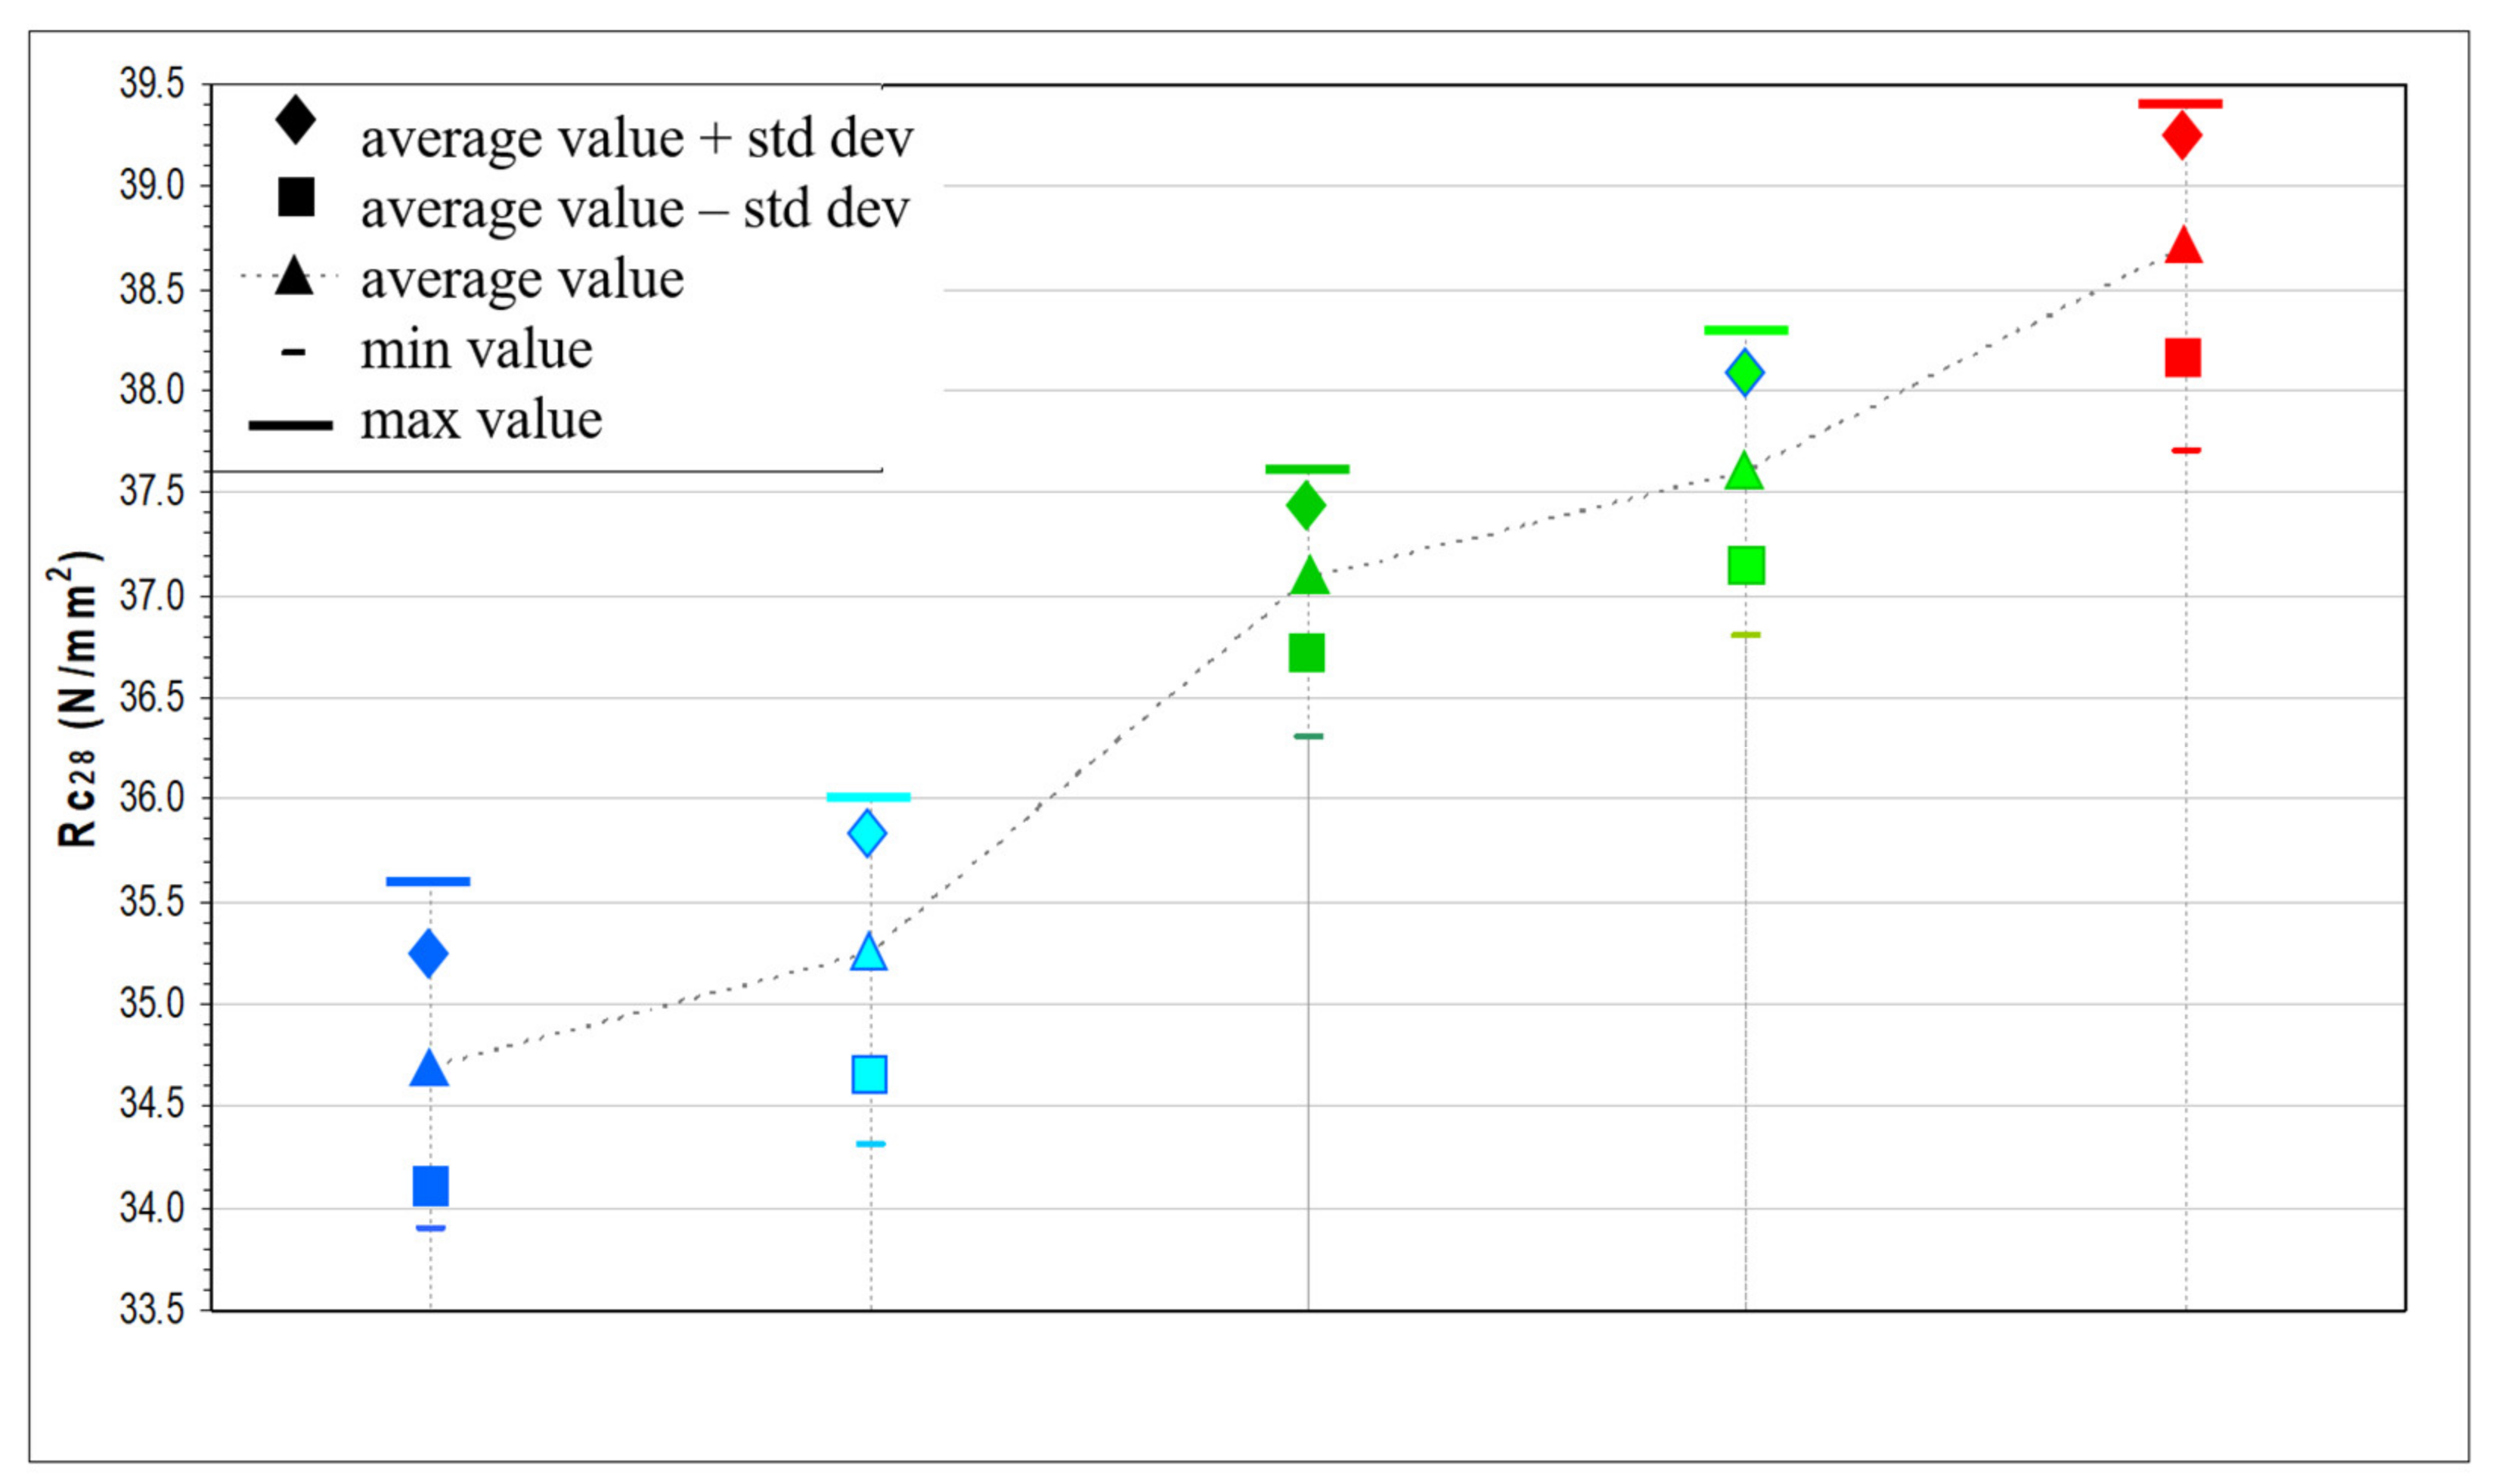
The analysis of the average compressive strengths reported in
Table 16 and represented in
Figure 8 allowed us to highlight some important aspects. There is a growth trend in values passing from calcareous lithologies to metamorphic and porphyry. These values have small differences, of about 4 N/mm
2, between calcareous and porphyry, but which are still significant since all the mixtures were prepared with the same parameters (same percentage of sand, same cement, same w/c ratio, etc.).
A possible correlation between compressive strength results and the Los Angeles values was therefore analyzed. The Los Angeles test is a mechanical test that could provide information on the intimate resistance of the aggregates subjected to crushing [
73]. As can be seen in
Table 11, calcareous aggregates present a lower resistance value than metamorphic and porphyry (remember that lower resistance coincides with higher LA values). However, it is a low difference but which allows a first consideration on the quality of the three lithologies compared. With the same w/c ratio and maturation conditions of the sample cubes, the compressive strengths confirm the best mechanical response in the porphyry aggregate with respect to the other two lithologies [
74].
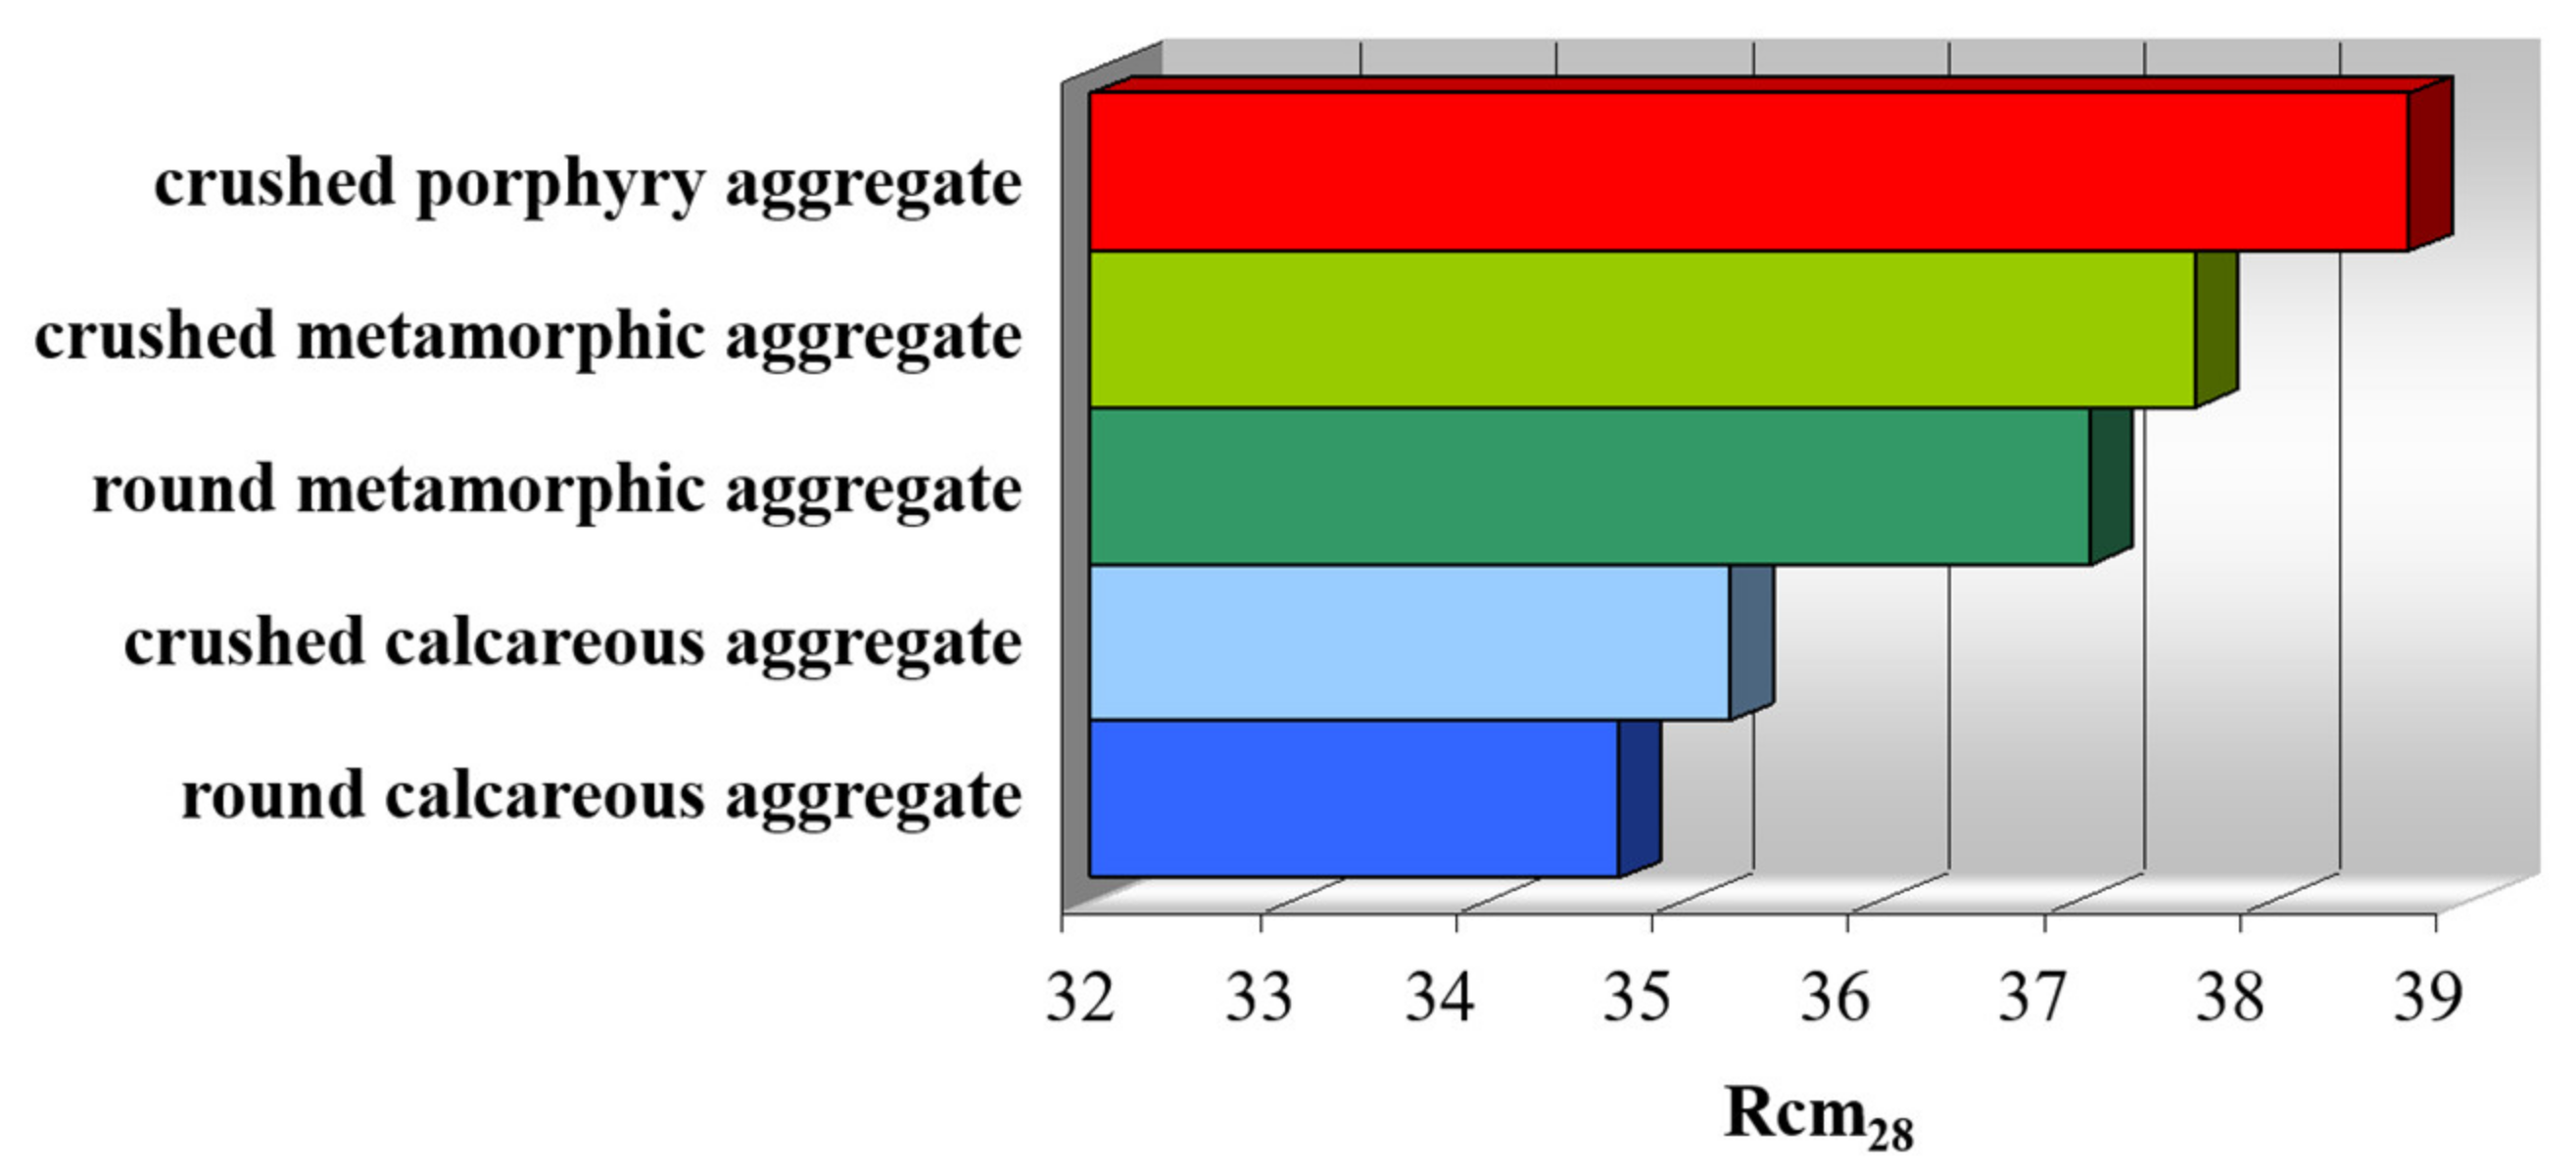
The graph in
Figure 8 shows that crushed aggregates in two lithologies have resistance values Rcm
28 higher than the corresponding rounded aggregates [
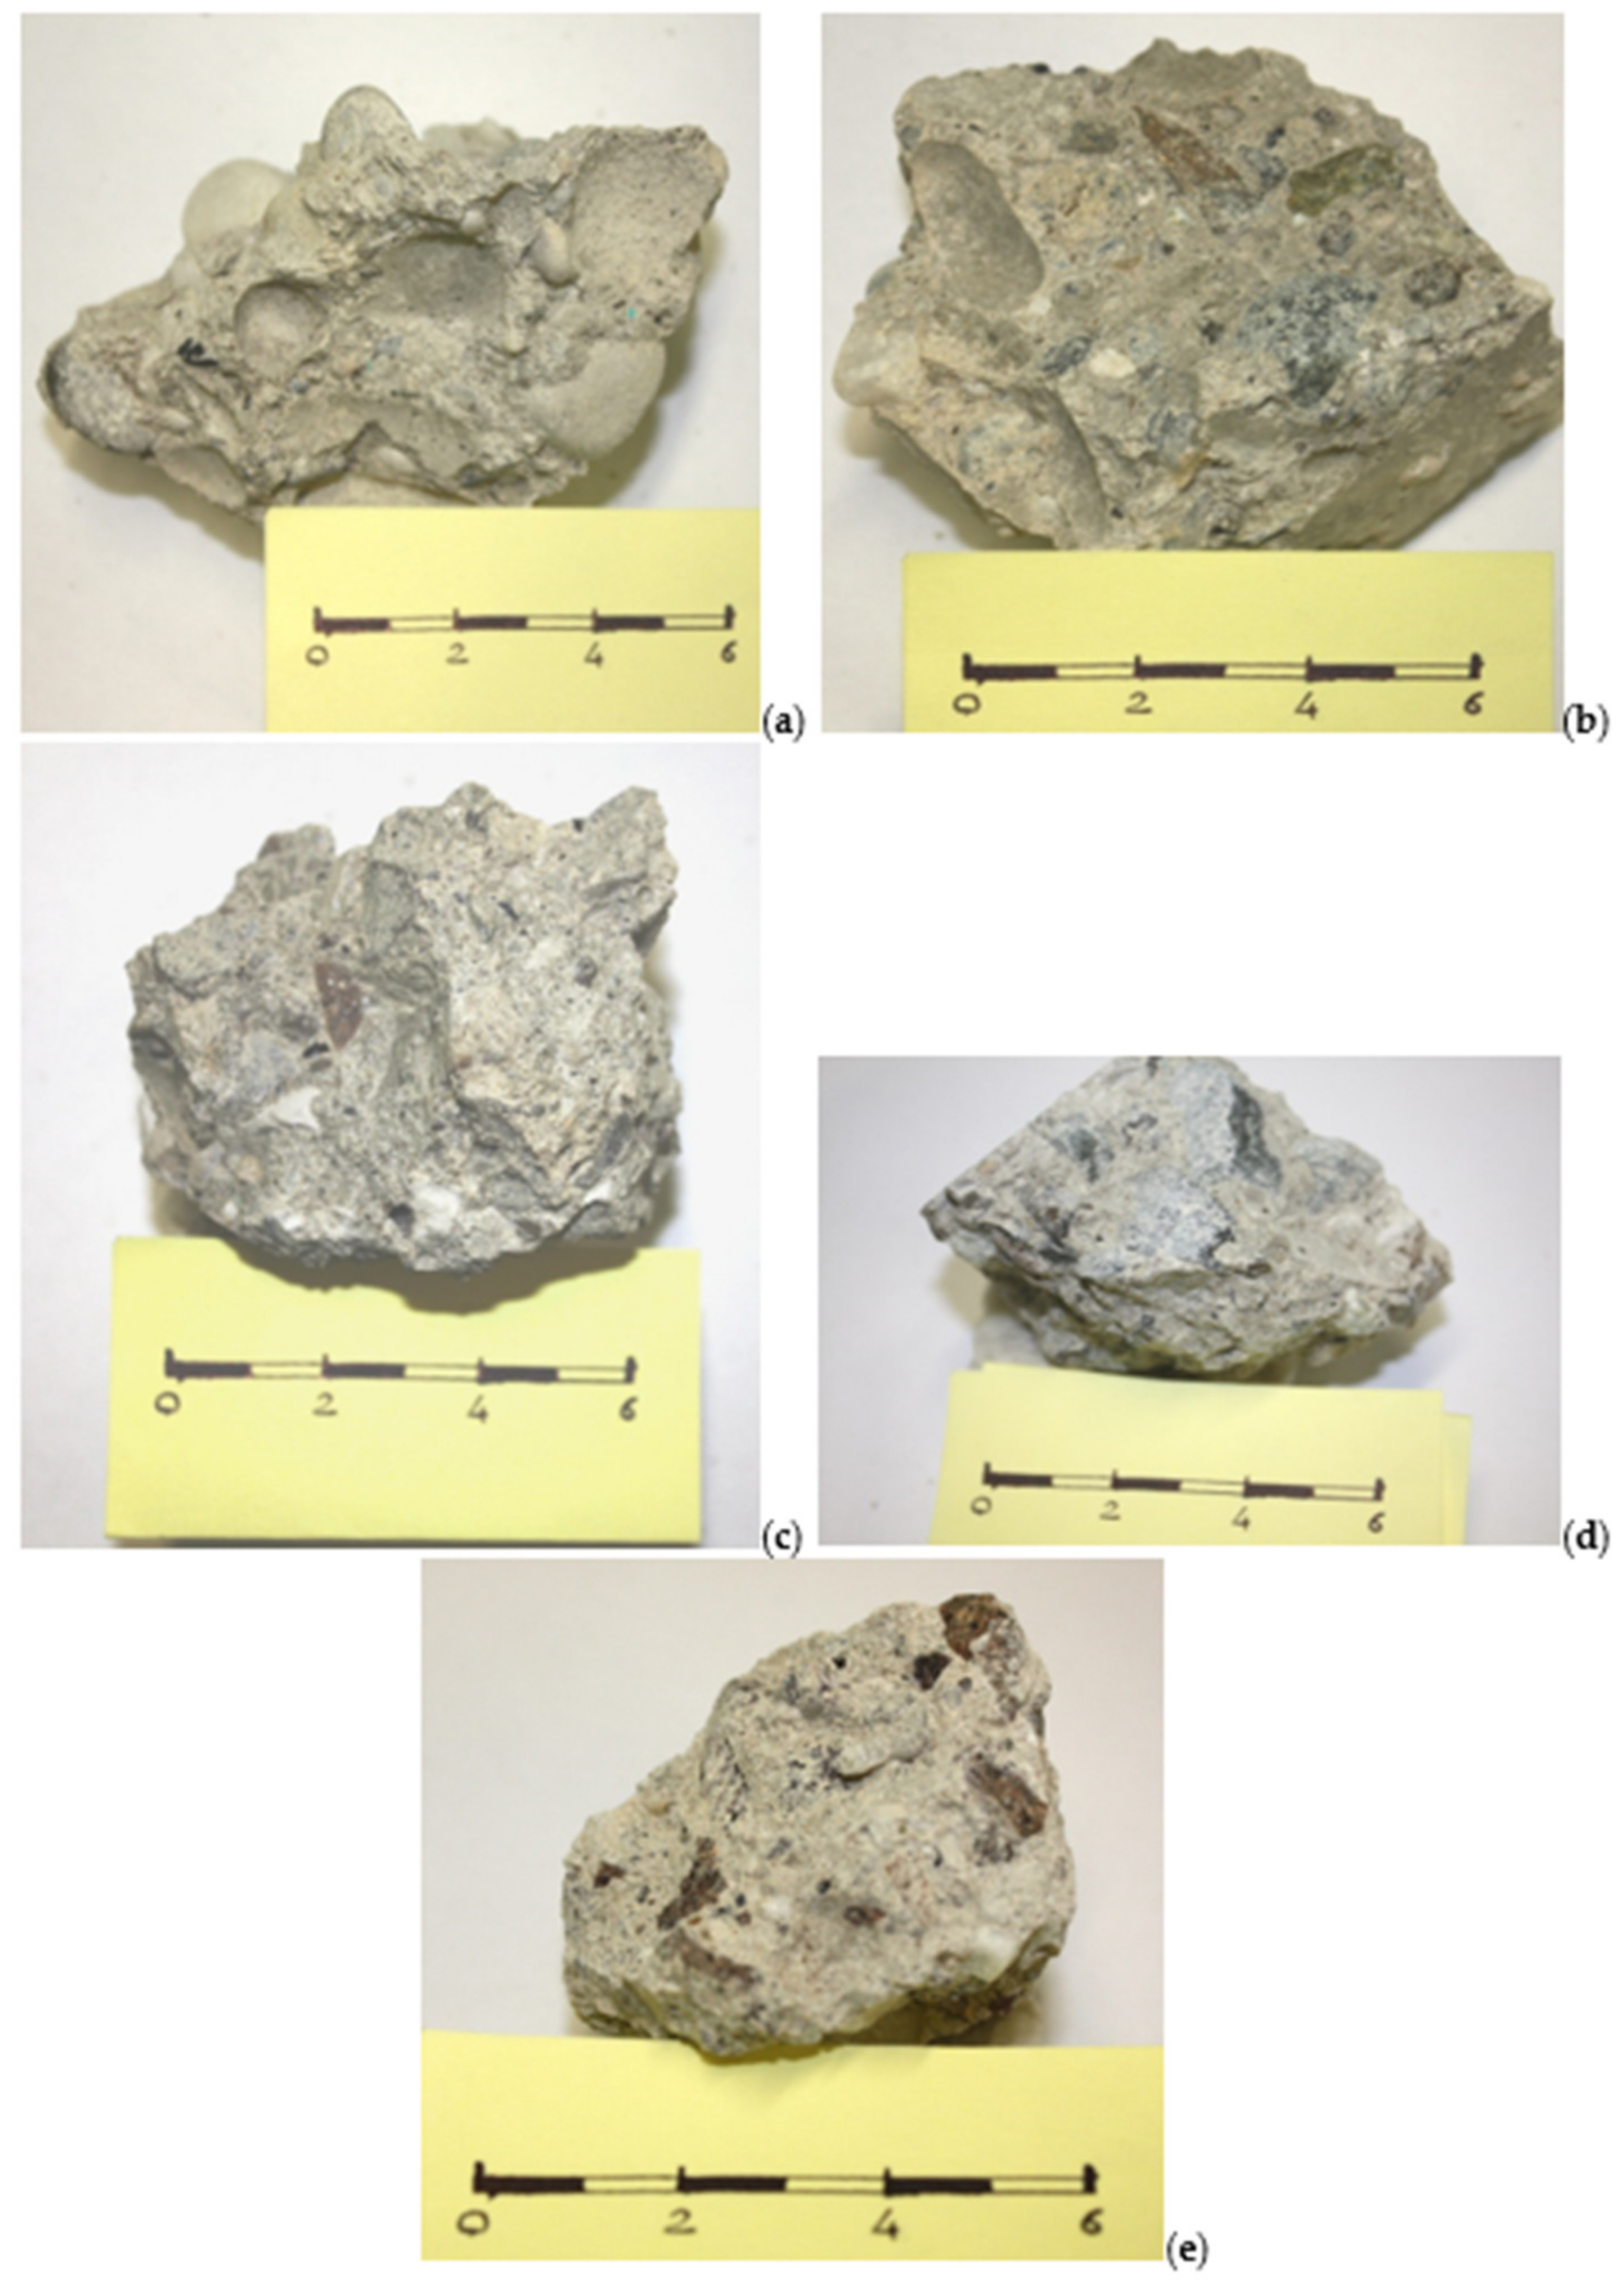
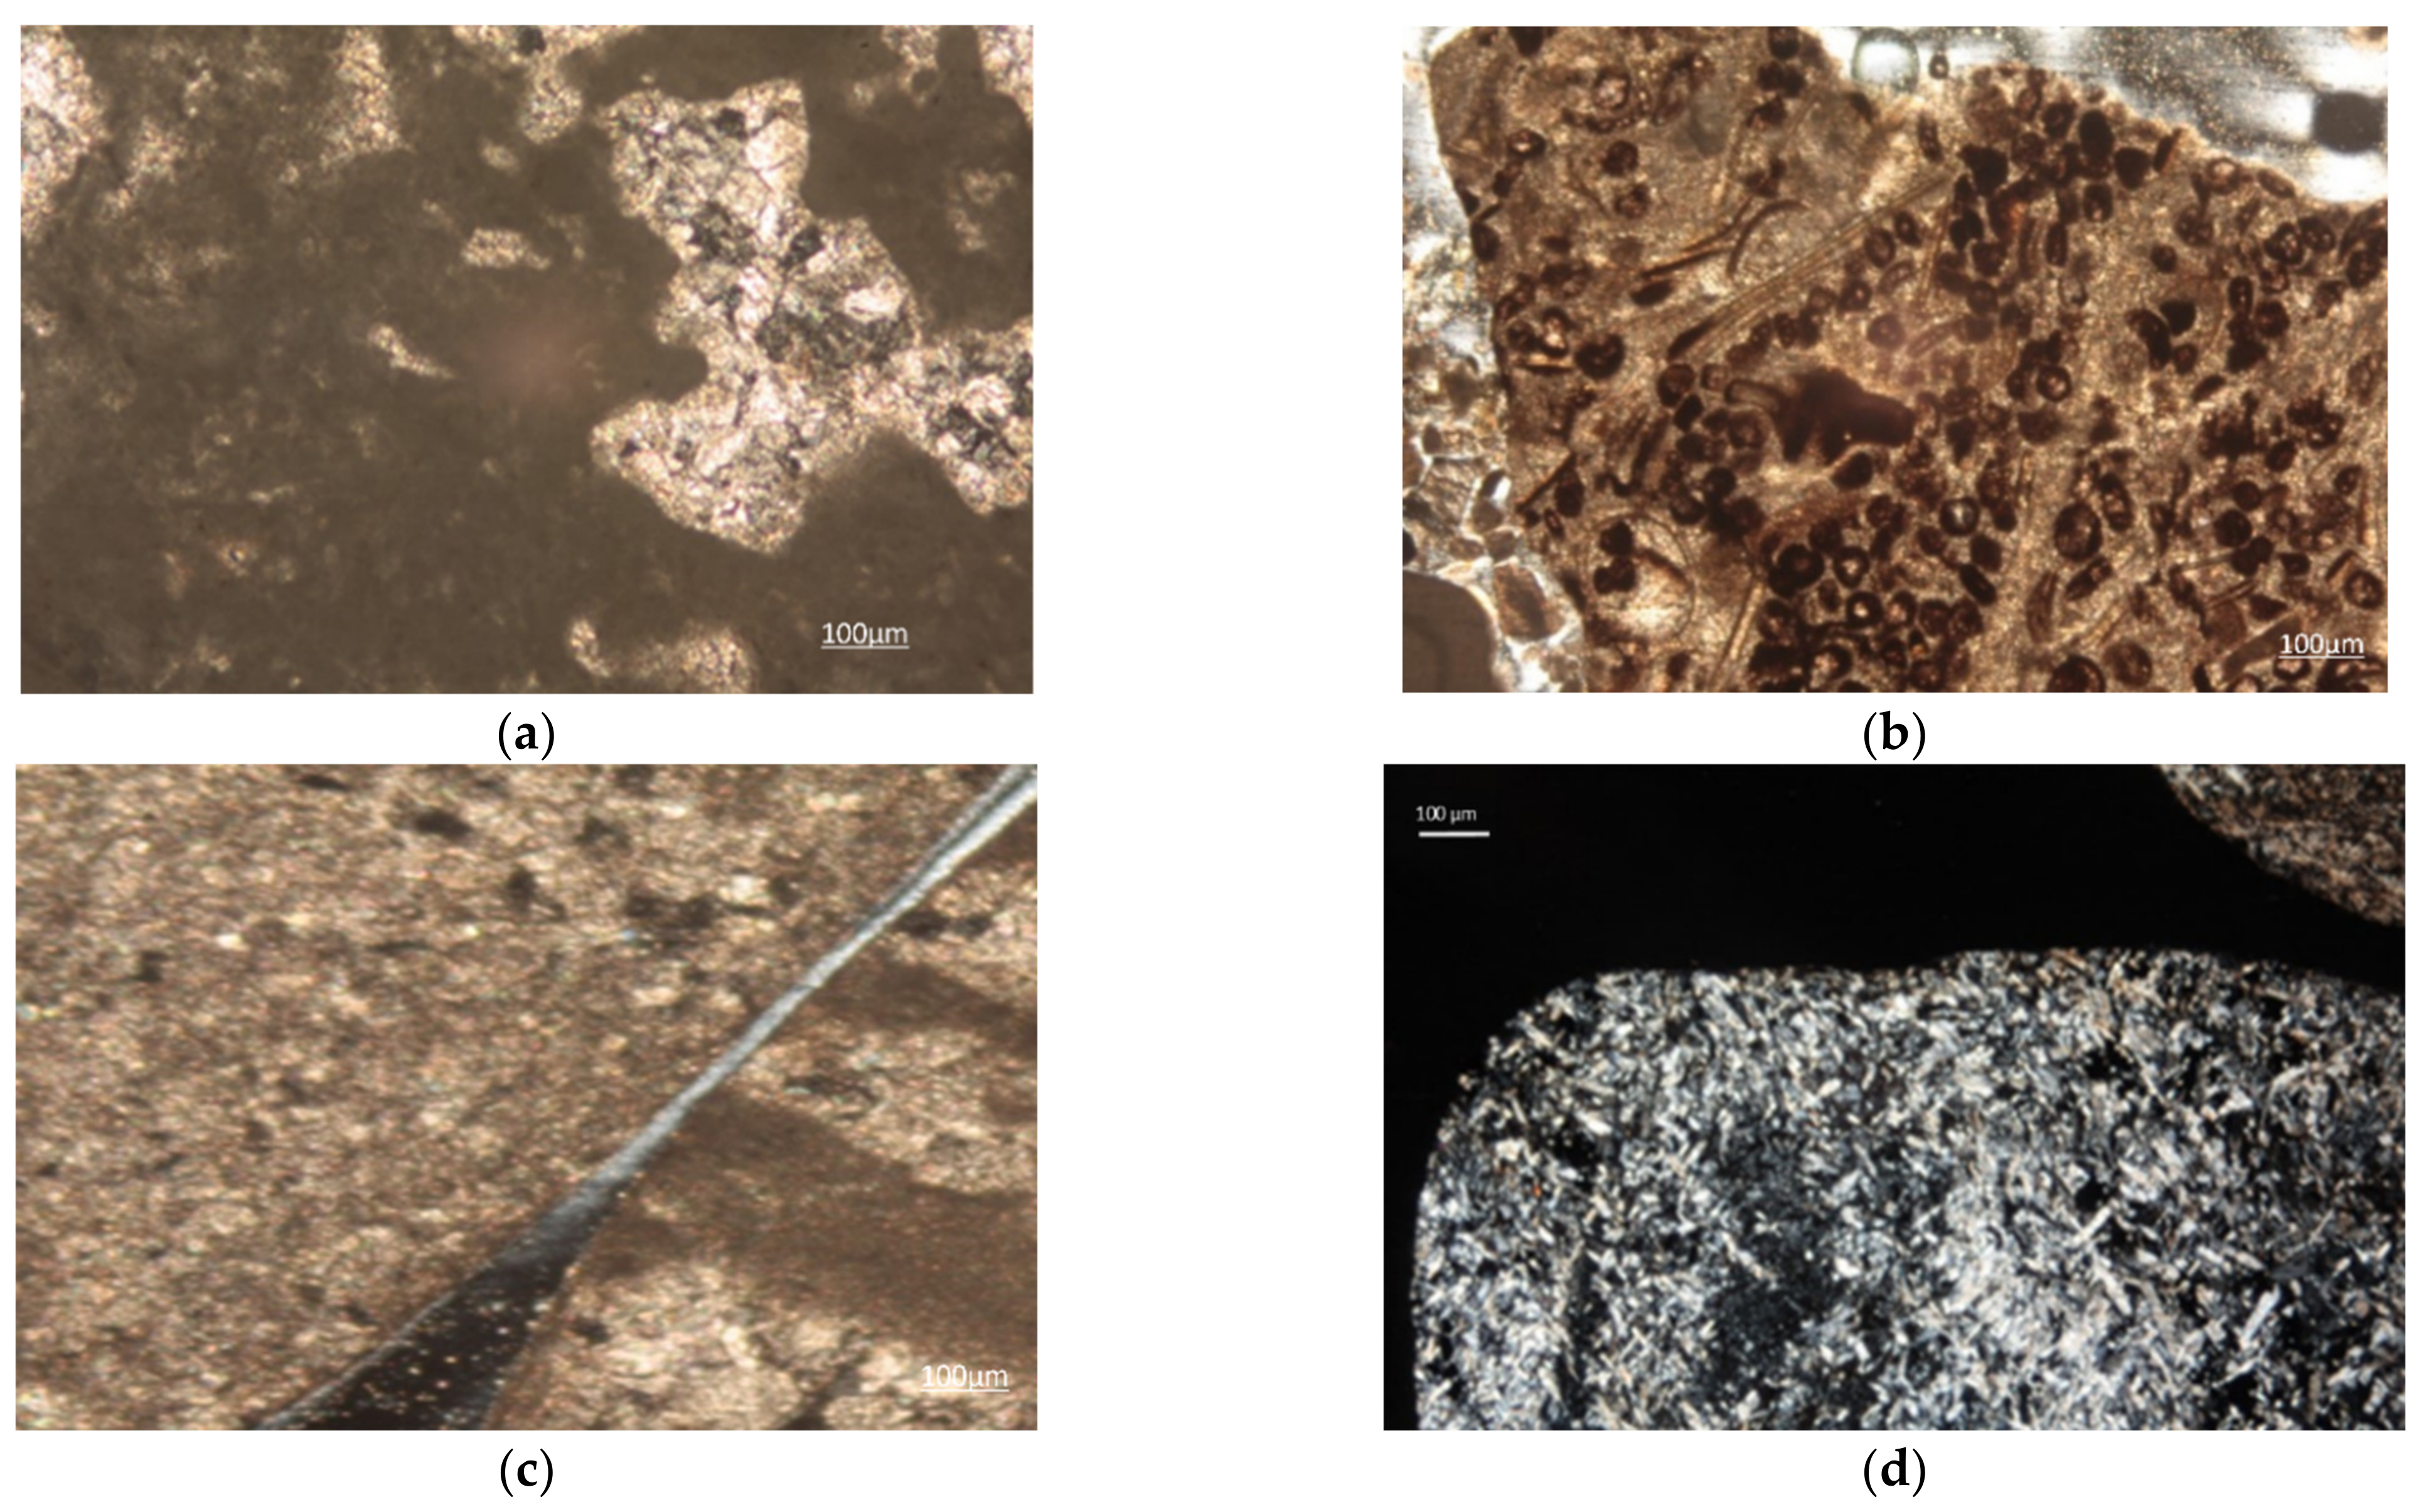
75]. In this case, it is necessary to remember the macroscopic and microscopic observations of the concrete mixtures investigated (
Figure 6 and
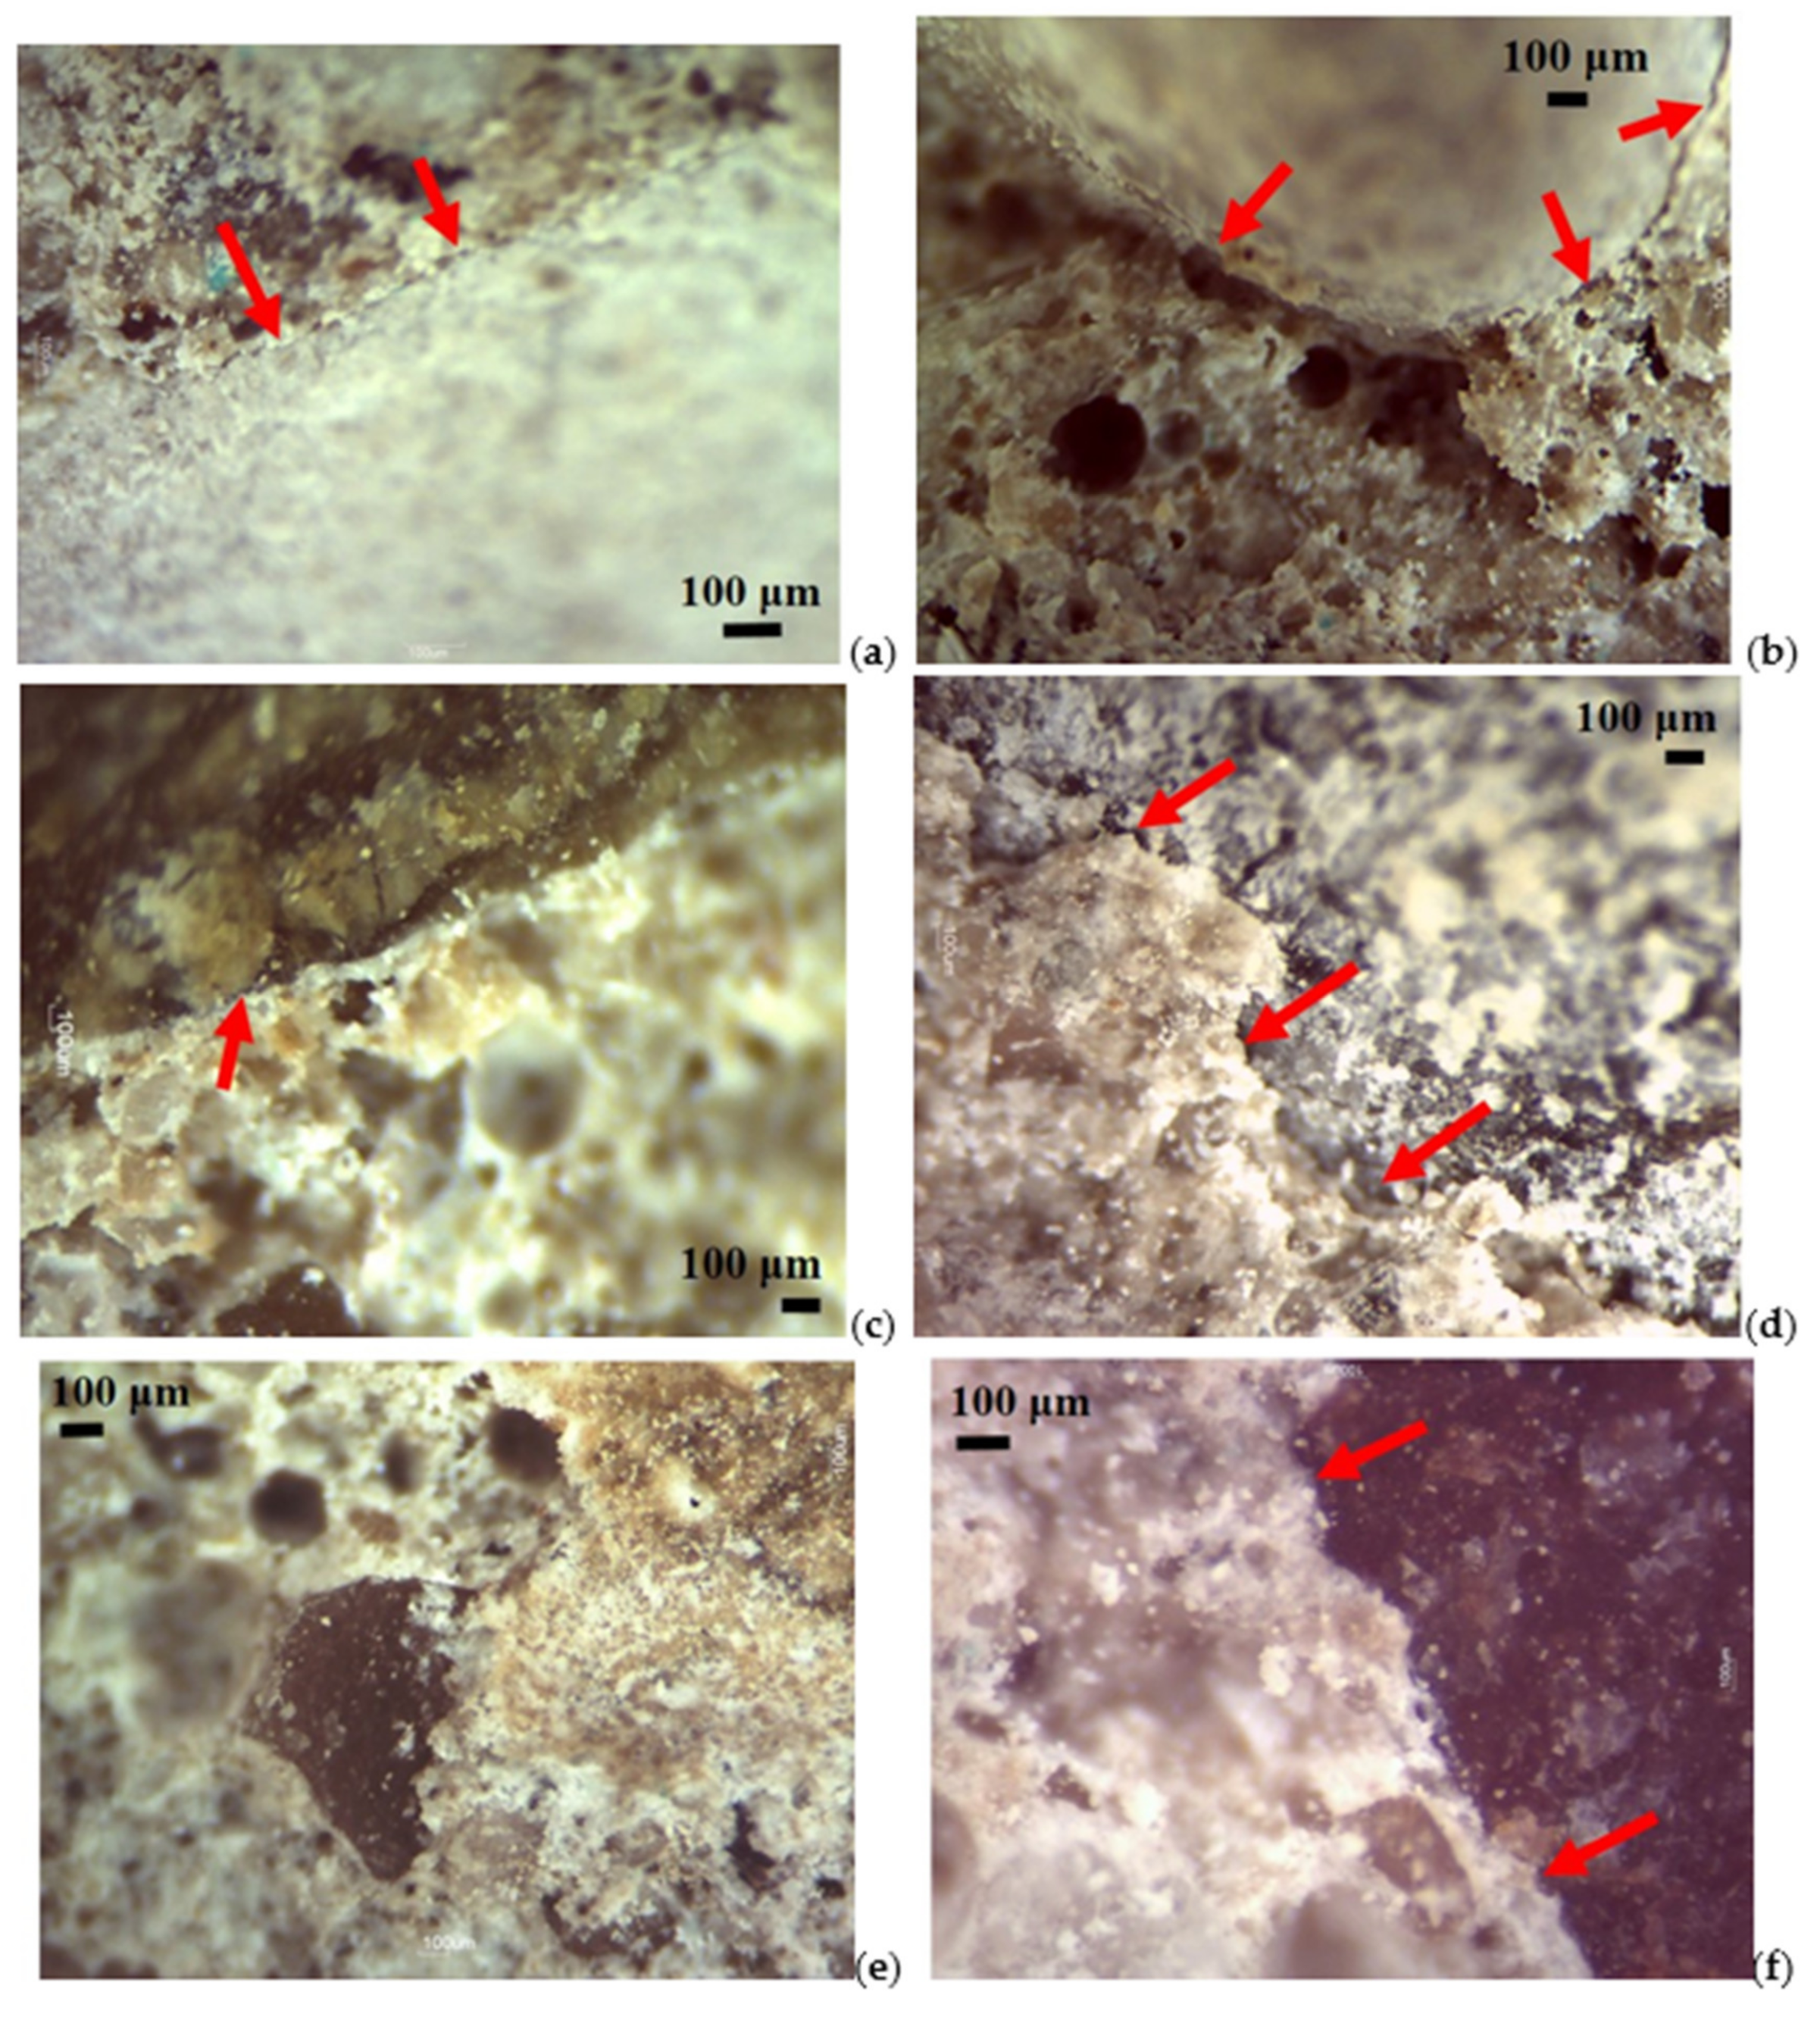
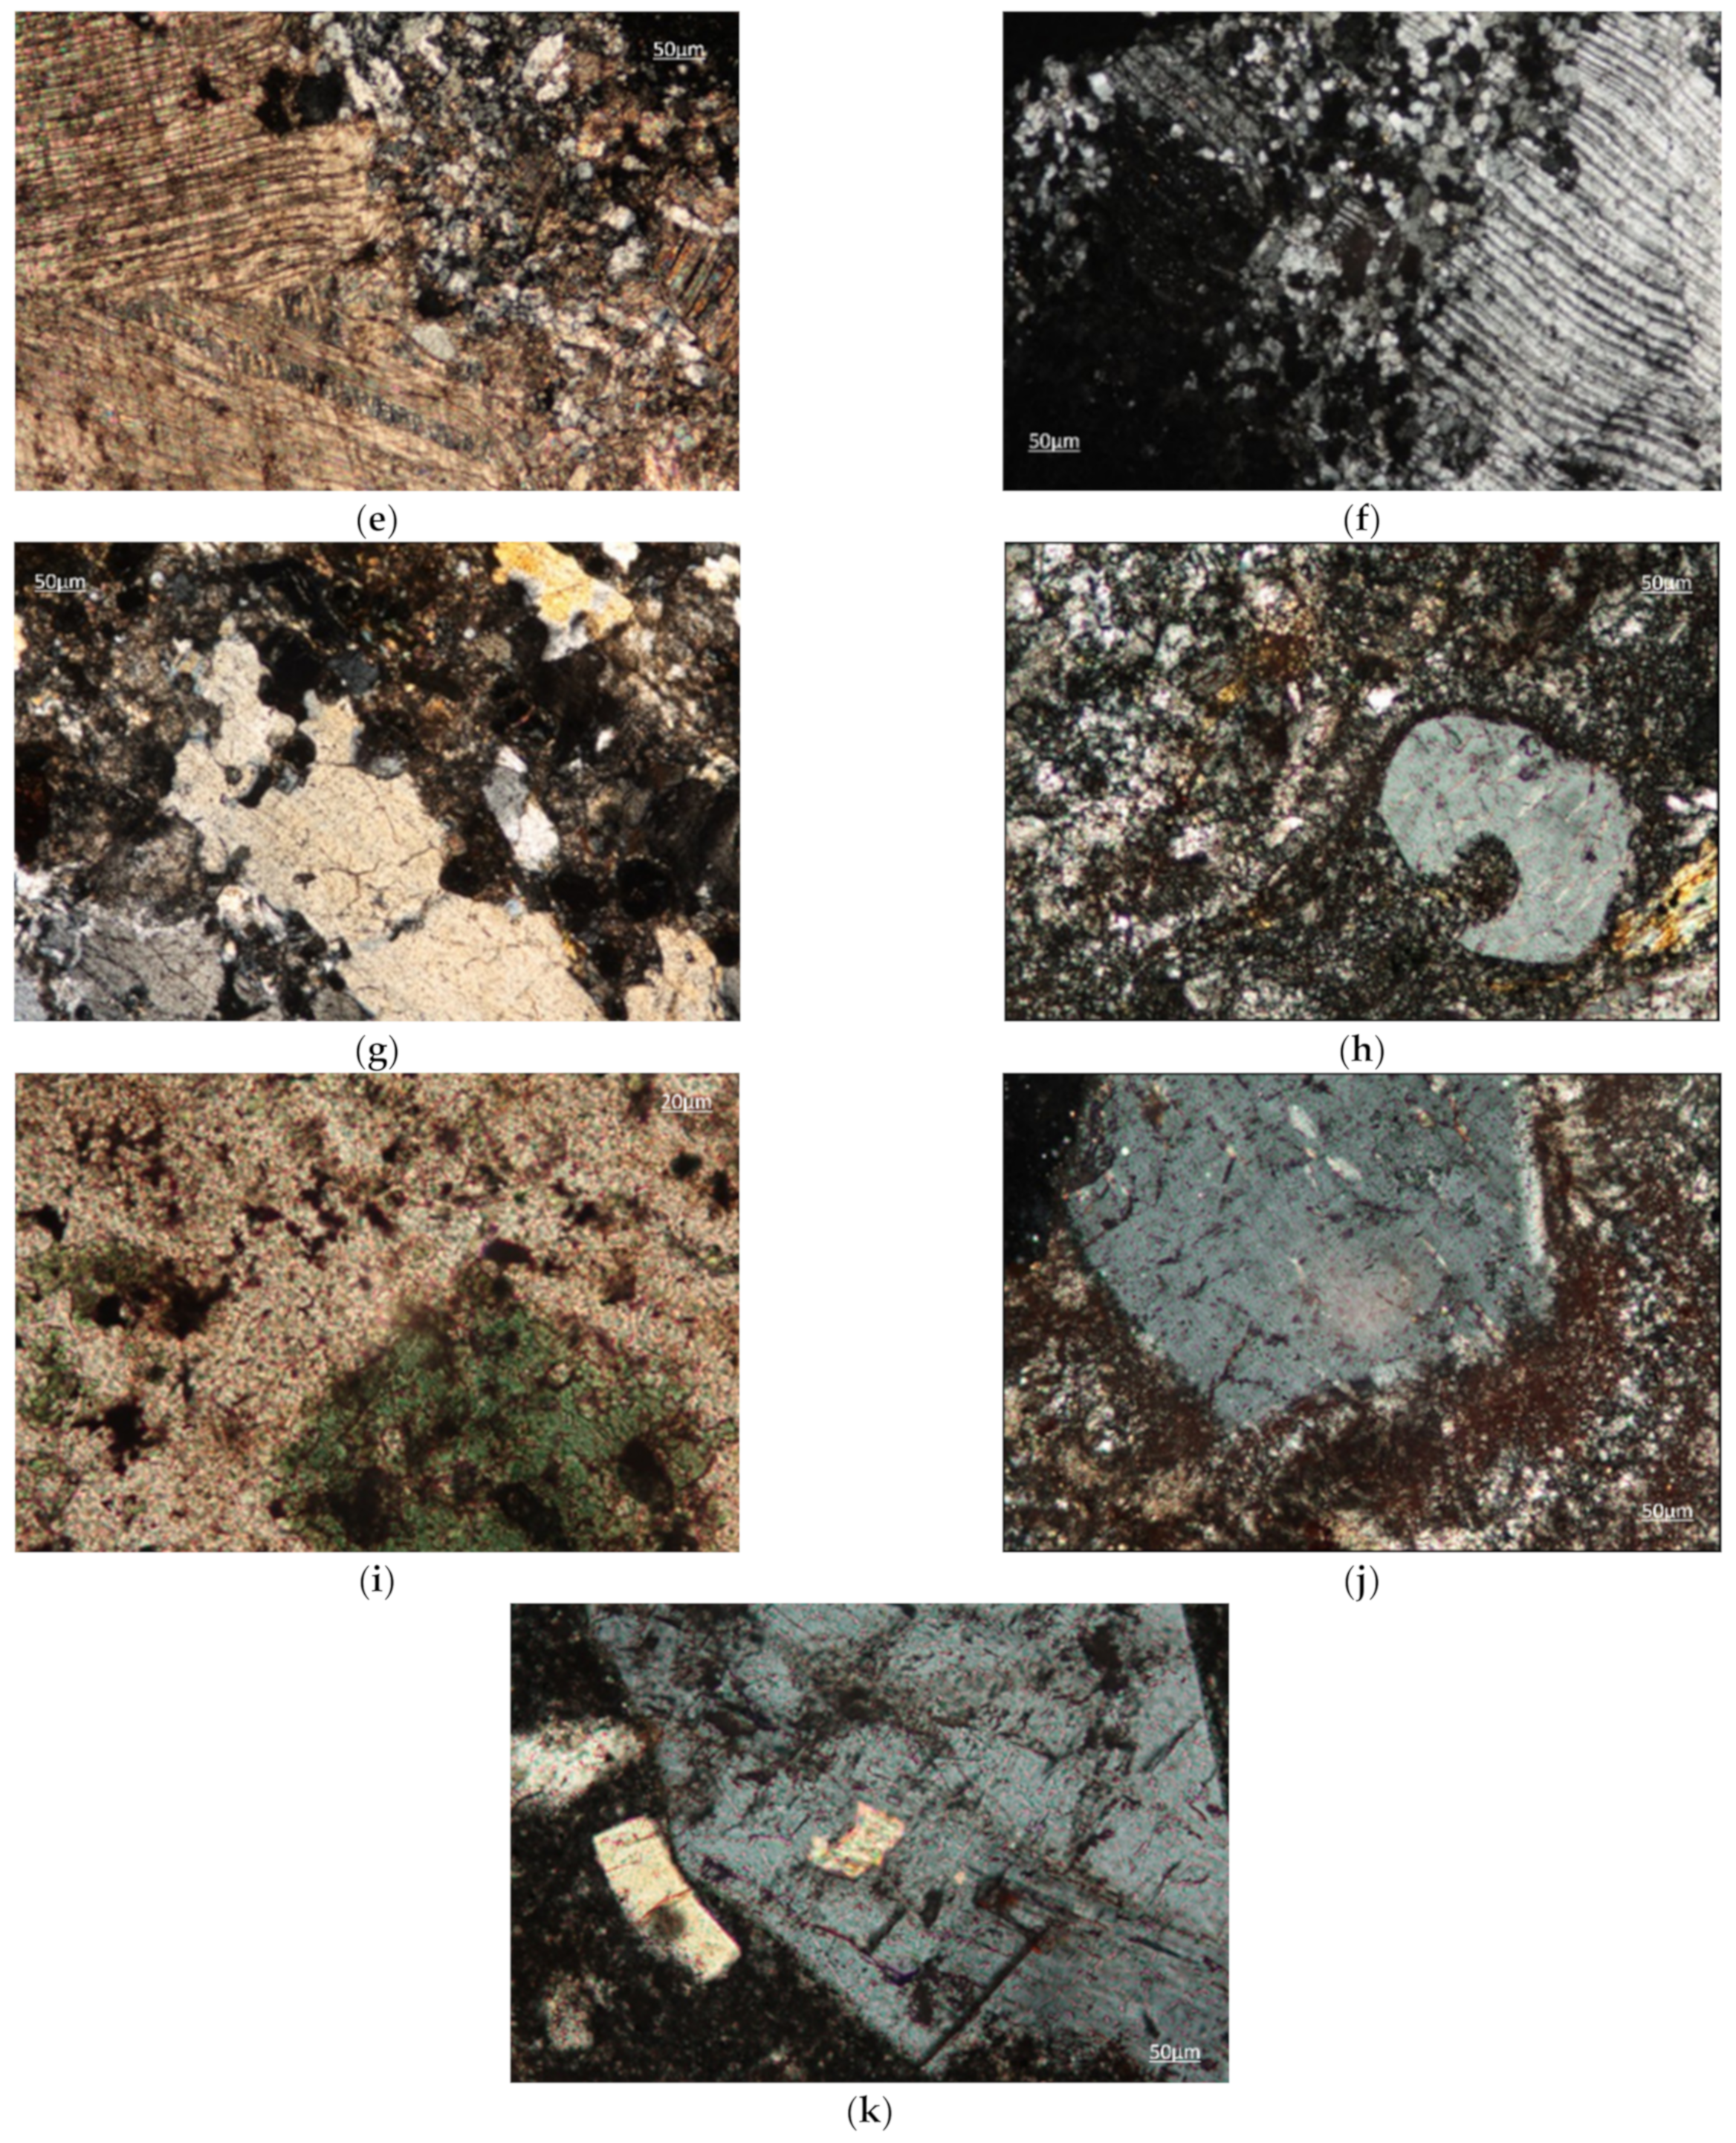
Figure 7): rounded aggregates have extremely simple contact edges with the cement paste, that is, continuous and free of irregular patterns with asperities and recesses that are instead observed along the surfaces of the crushed aggregates. These edges, probably resulting from the crushing process produced by compression and from the mineralogical structure of each type of rock, contribute to increasing the surface exposed and made available to the cement paste to attach itself to the clasts. As observed from the analysis on the thin section by a stereomicroscope (
Figure 7), the fractures follow an irregular trend as the size of the minerals within the types of rocks analyzed is greater [
76], with conchoidal fractures and smooth in microcrystalline calcareous samples and very rough fractures in porphyry.
To support this, the VL values proposed in
Table 13 can be considered. With this test, it is possible to obtain important information on the macro and micro roughness of the aggregates [
77]. It depends on the internal texture of the type of rock, and this can certainly be reflected in the observed resistance values [
78]. From the comparison of the rounded types, lower VL values of the respective crushed aggregates are observed, and thus it could be concluded that the abrasion produced by external agents must have produced smooth surfaces with no surface imperfections [
79]. Clearly, in nature, this depends on the intensity of the external agents of the environment [
80] and on the persistence of the abrasive action on the aggregates [
81]. Aggregates with a rougher and irregular surface will offer greater resistance and therefore a greater VL [
82]. Considering the stereomicroscope observations (
Figure 7), it could be hypothesized that the increase in resistance of the crushed aggregates is due to the greater availability of specific surface made available which could create a greater interpenetration between the aggregate and cement paste able to withstand greater resistances.
Table 17 reports the main data obtained summarizing the average, maximum and minimum Rcm
28 values for each type of mixture. In addition, the range of variability is observed, that is, the numerical interval within which all the data obtained are found, between the maximum and minimum resistance values. As can be seen, there is a greater range of variability for mixtures made with calcareous lithologies (both rounded gravels and crushed stones) and for porphyry while lower values for mixtures made with metamorphic aggregates. In any case, all the ranges of variability are restricted probably due to the fact that the samples have comparable mechanical strengths. However, it is important to consider that the presence of a range of variability is physiological and probably caused by the package of the cubes [
83].
The standard deviation represents the average distance of the data from their mean value. This statistical data confirm the goodness of the average obtained. It is possible to obtain two equal averages from different concentrated data: the best data distribution is the one with the smallest standard deviation, which means that the values are not so different from their average. The standard deviation values shown in
Table 17 confirm that the data obtained are concentrated around the average of the compressive strength value obtained.
Another parameter to determine the correct distribution of the data is the variation coefficient, expressed as a percentage ratio between the standard deviation and the average of the measurements. Low coefficient-of-variation values indicate that the concrete cubes were packaged with accuracy [
84]. Low coefficients of variation are therefore observed for porphyry and metamorphic samples, while slightly higher for mixtures with calcareous aggregates (
Table 17).
The graph in
Figure 9 shows the trend of the average compressive strength values for each mixture with the respective ranges of variability. From the comparison of the intervals provided by the values of average resistance plus standard deviation and average resistance minus standard deviation, ranges of comparable amplitude are observed especially for mixtures with porphyry aggregates and with metamorphic gravels and metamorphic crushed stones, while for the calcareous aggregates, slightly wider ranges are observed.
From all this information, it can be said that the resistance data obtained are well concentrated around the representative average value for each concrete mixture and also confirm the optimal packaging of the samples [
85].
5. Conclusions
This research work was focused on the petrographical and physical-mechanical characterization of three natural aggregates, lithologically very different from each other.
Experimental research presented included testing of petrographic properties of natural aggregates and demonstrating the relevance of their characterization in the concrete mixture.
The morphology of the aggregate clasts is important in conferring mechanical strength to the concrete, and consequently, the type and shape of the chosen lithology become a fundamental factor. This research work showed that mixtures with crushed aggregates have higher mechanical strength than mixtures with round aggregates. Unfortunately, however, the vast majority of Italian concrete mixing plants use rounded aggregates since most of the aggregate quarries are made up of alluvial sedimentary deposits characterized by gravels. In addition, the costs for crushing the extracted rounded alluvial material would be minor and not very advantageous.
The physical-mechanical data indicated good results of the porphyry aggregate with respect to the other lithologies. Furthermore, it seems that better mechanical characteristics can be obtained by the crushed aggregates thanks to their rough surface. These conclusions are valid for the w/c ratio used, for the lithologies compared and for the maturation of the concrete cubes for 28 days. Despite this, the porphyry aggregate consists of a vitreous silicate component that over time can probably degrade the durability of the concrete through chemical reactions such as alkali–silica, which are particularly harmful.
As concerns the compressive strength values of each mixture, it was observed that all the breaking values exceeded the minimum resistance limit of 30 N/mm2 imposed by the UNI EN 11104:2016. Furthermore, a substantial growth trend was observed, passing from calcareous to metamorphic and porphyritic lithology.
To better characterized this, further analyses are needed especially of blends packaged with different w/c ratios. It is, in fact, possible to foresee that this difference is no longer observable for high-performance concrete mixtures, with low w/c ratios and high mechanical strengths, since the cement present in considerable quantities could reduce the effects due to the petrographic composition and the form factor of the aggregates used for the mixture. In addition, it is necessary to observe the trend of the data also for maturation of the concrete cube for more than 28 days imposed by the legislation to verify that the alkali–silica reactions cannot arise with the vitreous paste of the porphyry aggregates.
Another important aspect is the necessary use of higher water contents, with the same consistency class, with a crushed aggregate compared to a rounded aggregate. This increase in water is necessary by the lower smoothness of the crushed surfaces which, being rougher, make the concrete more viscous. It is therefore deduced that crushed aggregates offer greater resistance to flow than those with rounded aggregates. This would not be a problem if there was not a consequent increase in the cement content needed to maintain the required w/c ratio, but this would mean an increase in the final cost of the mixture, largely due to the cost of this component. This would produce an uneconomical and unsaleable concrete. It should also be remembered that a concrete that is easily workable is preferred, a characteristic guaranteed by the right w/c ratio and, in addition to the additives, by the use of an alluvial aggregate with smooth surfaces. The minimum limits in the dosages of cement and w/c ratios imposed by the UNI EN standards for the packaging of a specific type of concrete, however, ensure the achievement of the mechanical resistances, and therefore it is not necessary to use aggregates with characteristics such as the surface macro roughness of the porphyry.
Ultimately it is always necessary to find the right way to relate experimental deductions deriving from studies such as the one proposed and the real practical needs imposed by the world of work, with a focus on the economic factor of the entire production process.


