
Microstructure and Wear Properties of Laser Cladding WC/Ni-Based Composite Layer on Al–Si Alloy


Abstract
:1. Introduction
2. Materials and Methods
2.1. Experiment Materials
2.2. Experiment Equipment and Methods
3. Results and Discussion
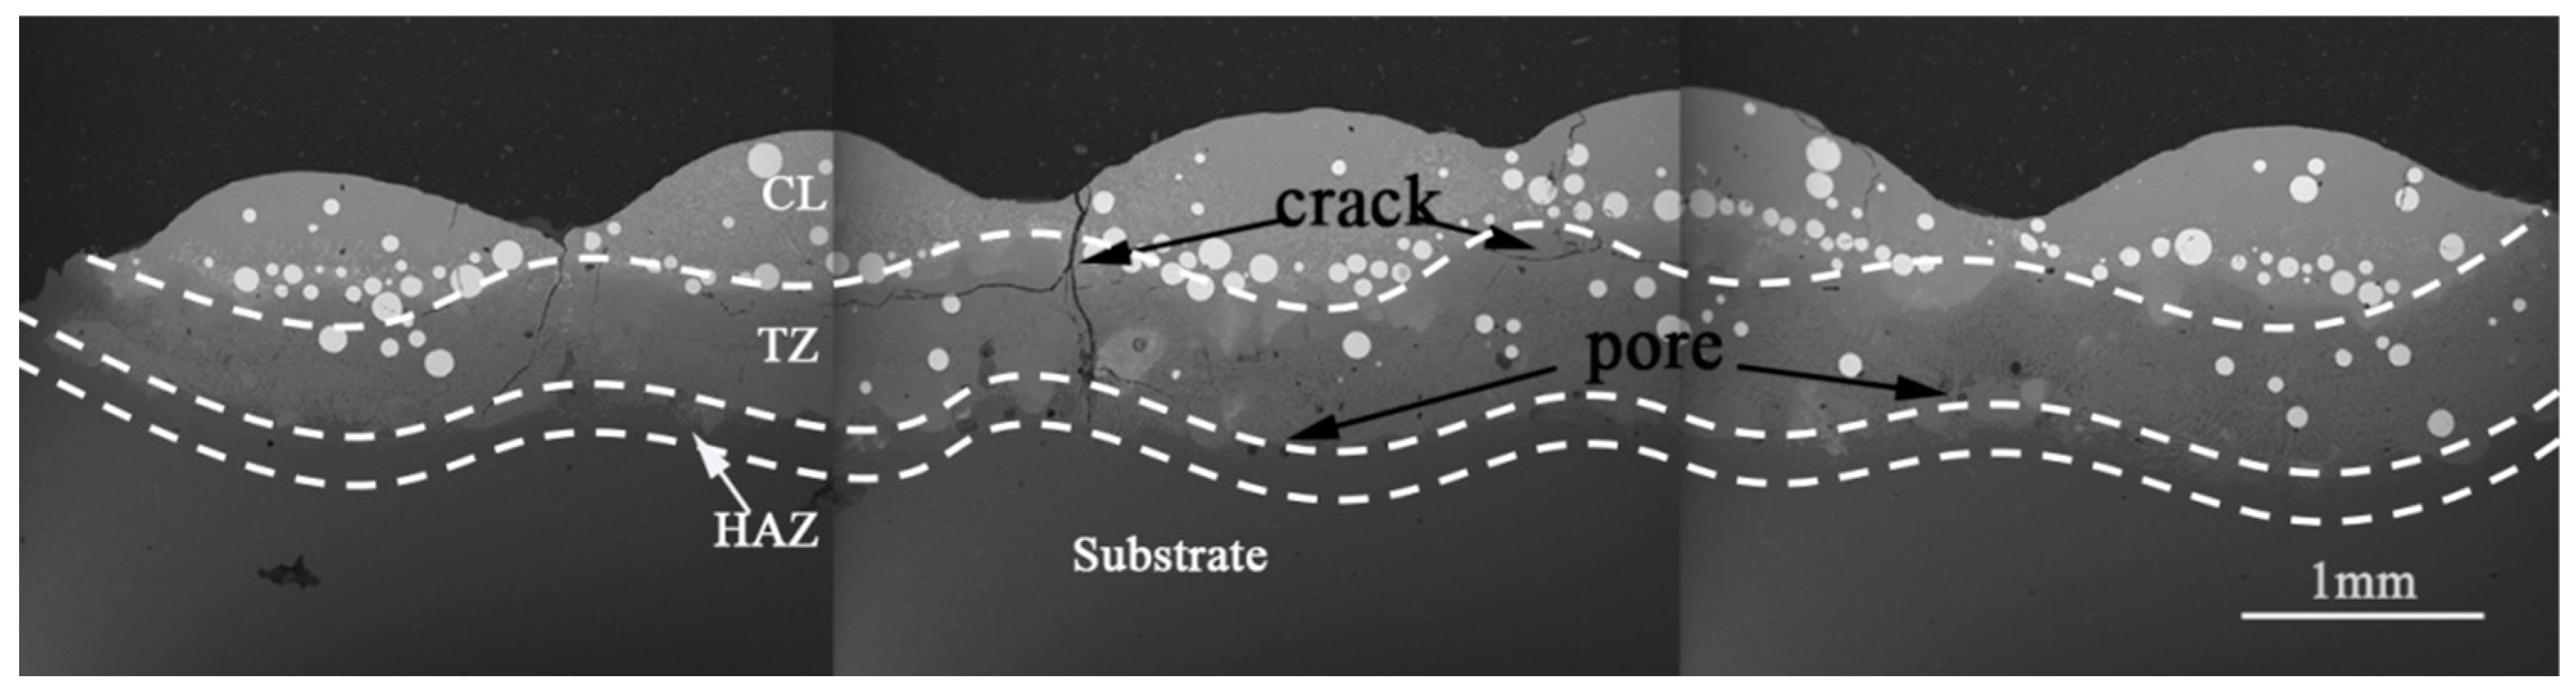
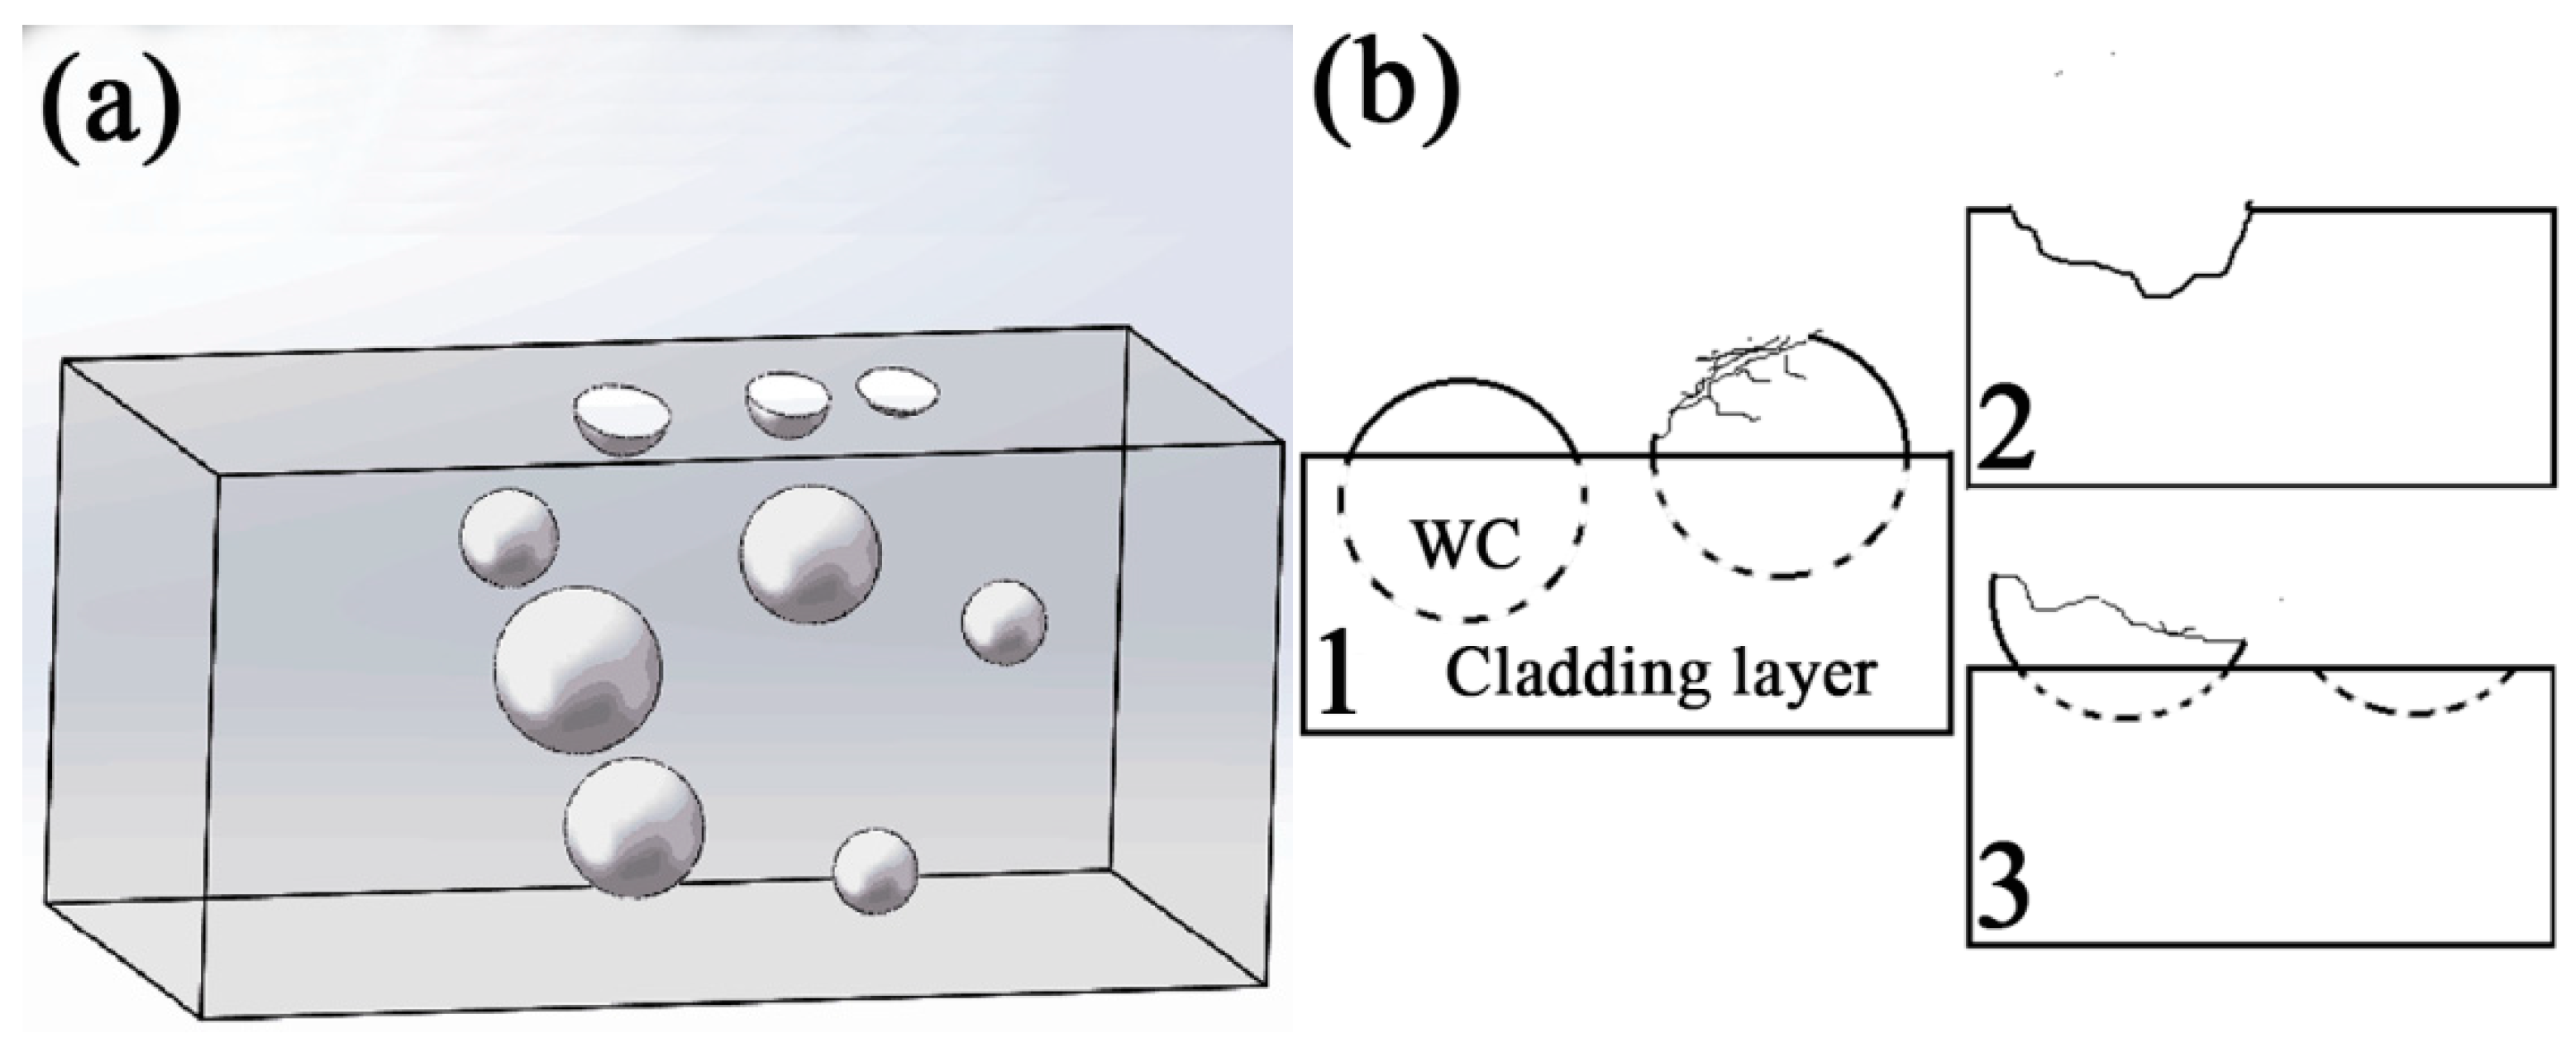
3.1. Microstructure of Multi-Track WC/Ni Layer
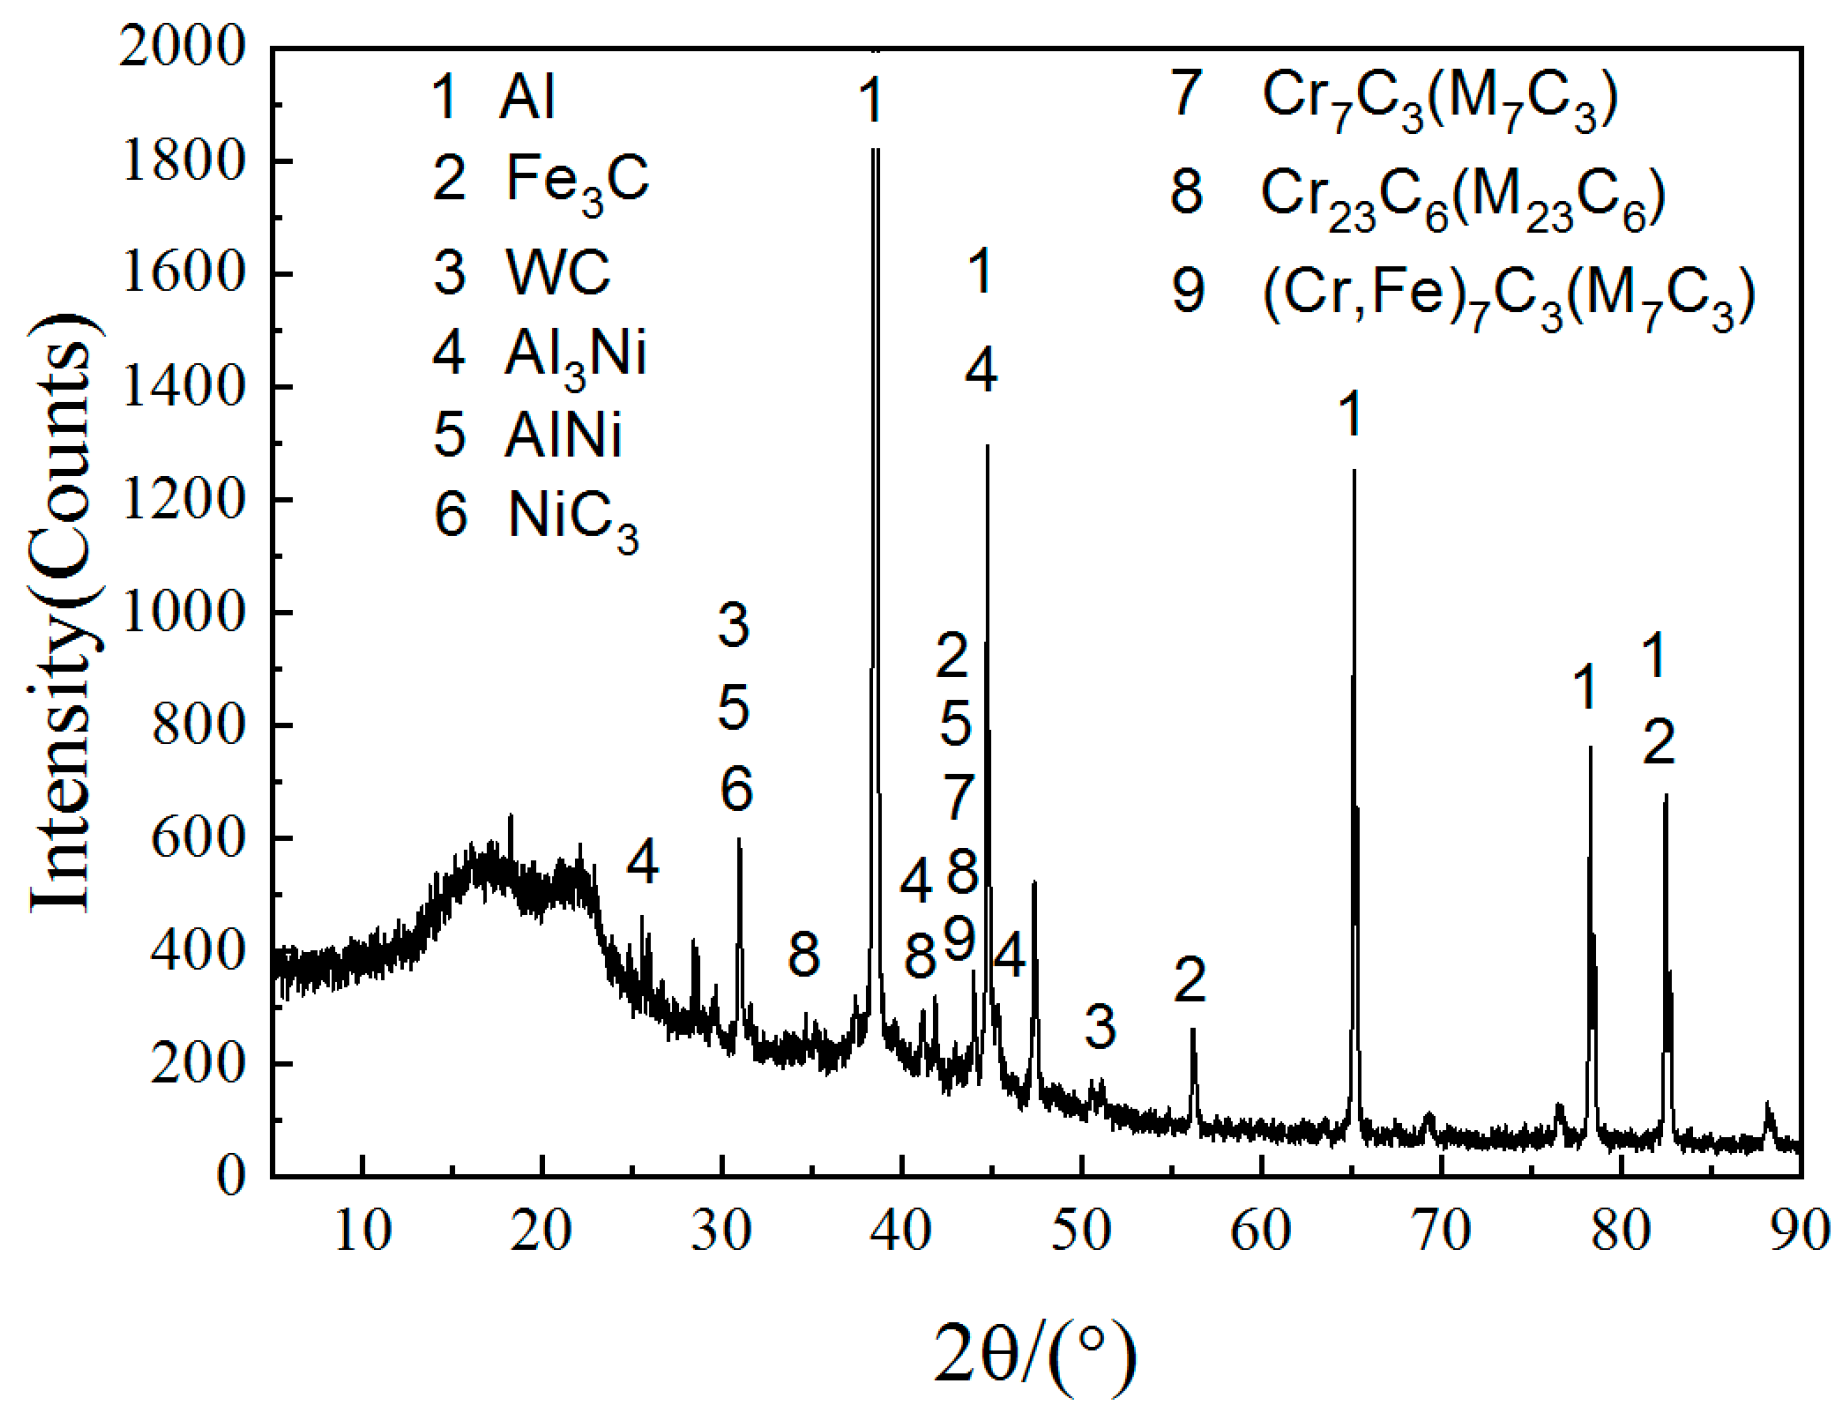
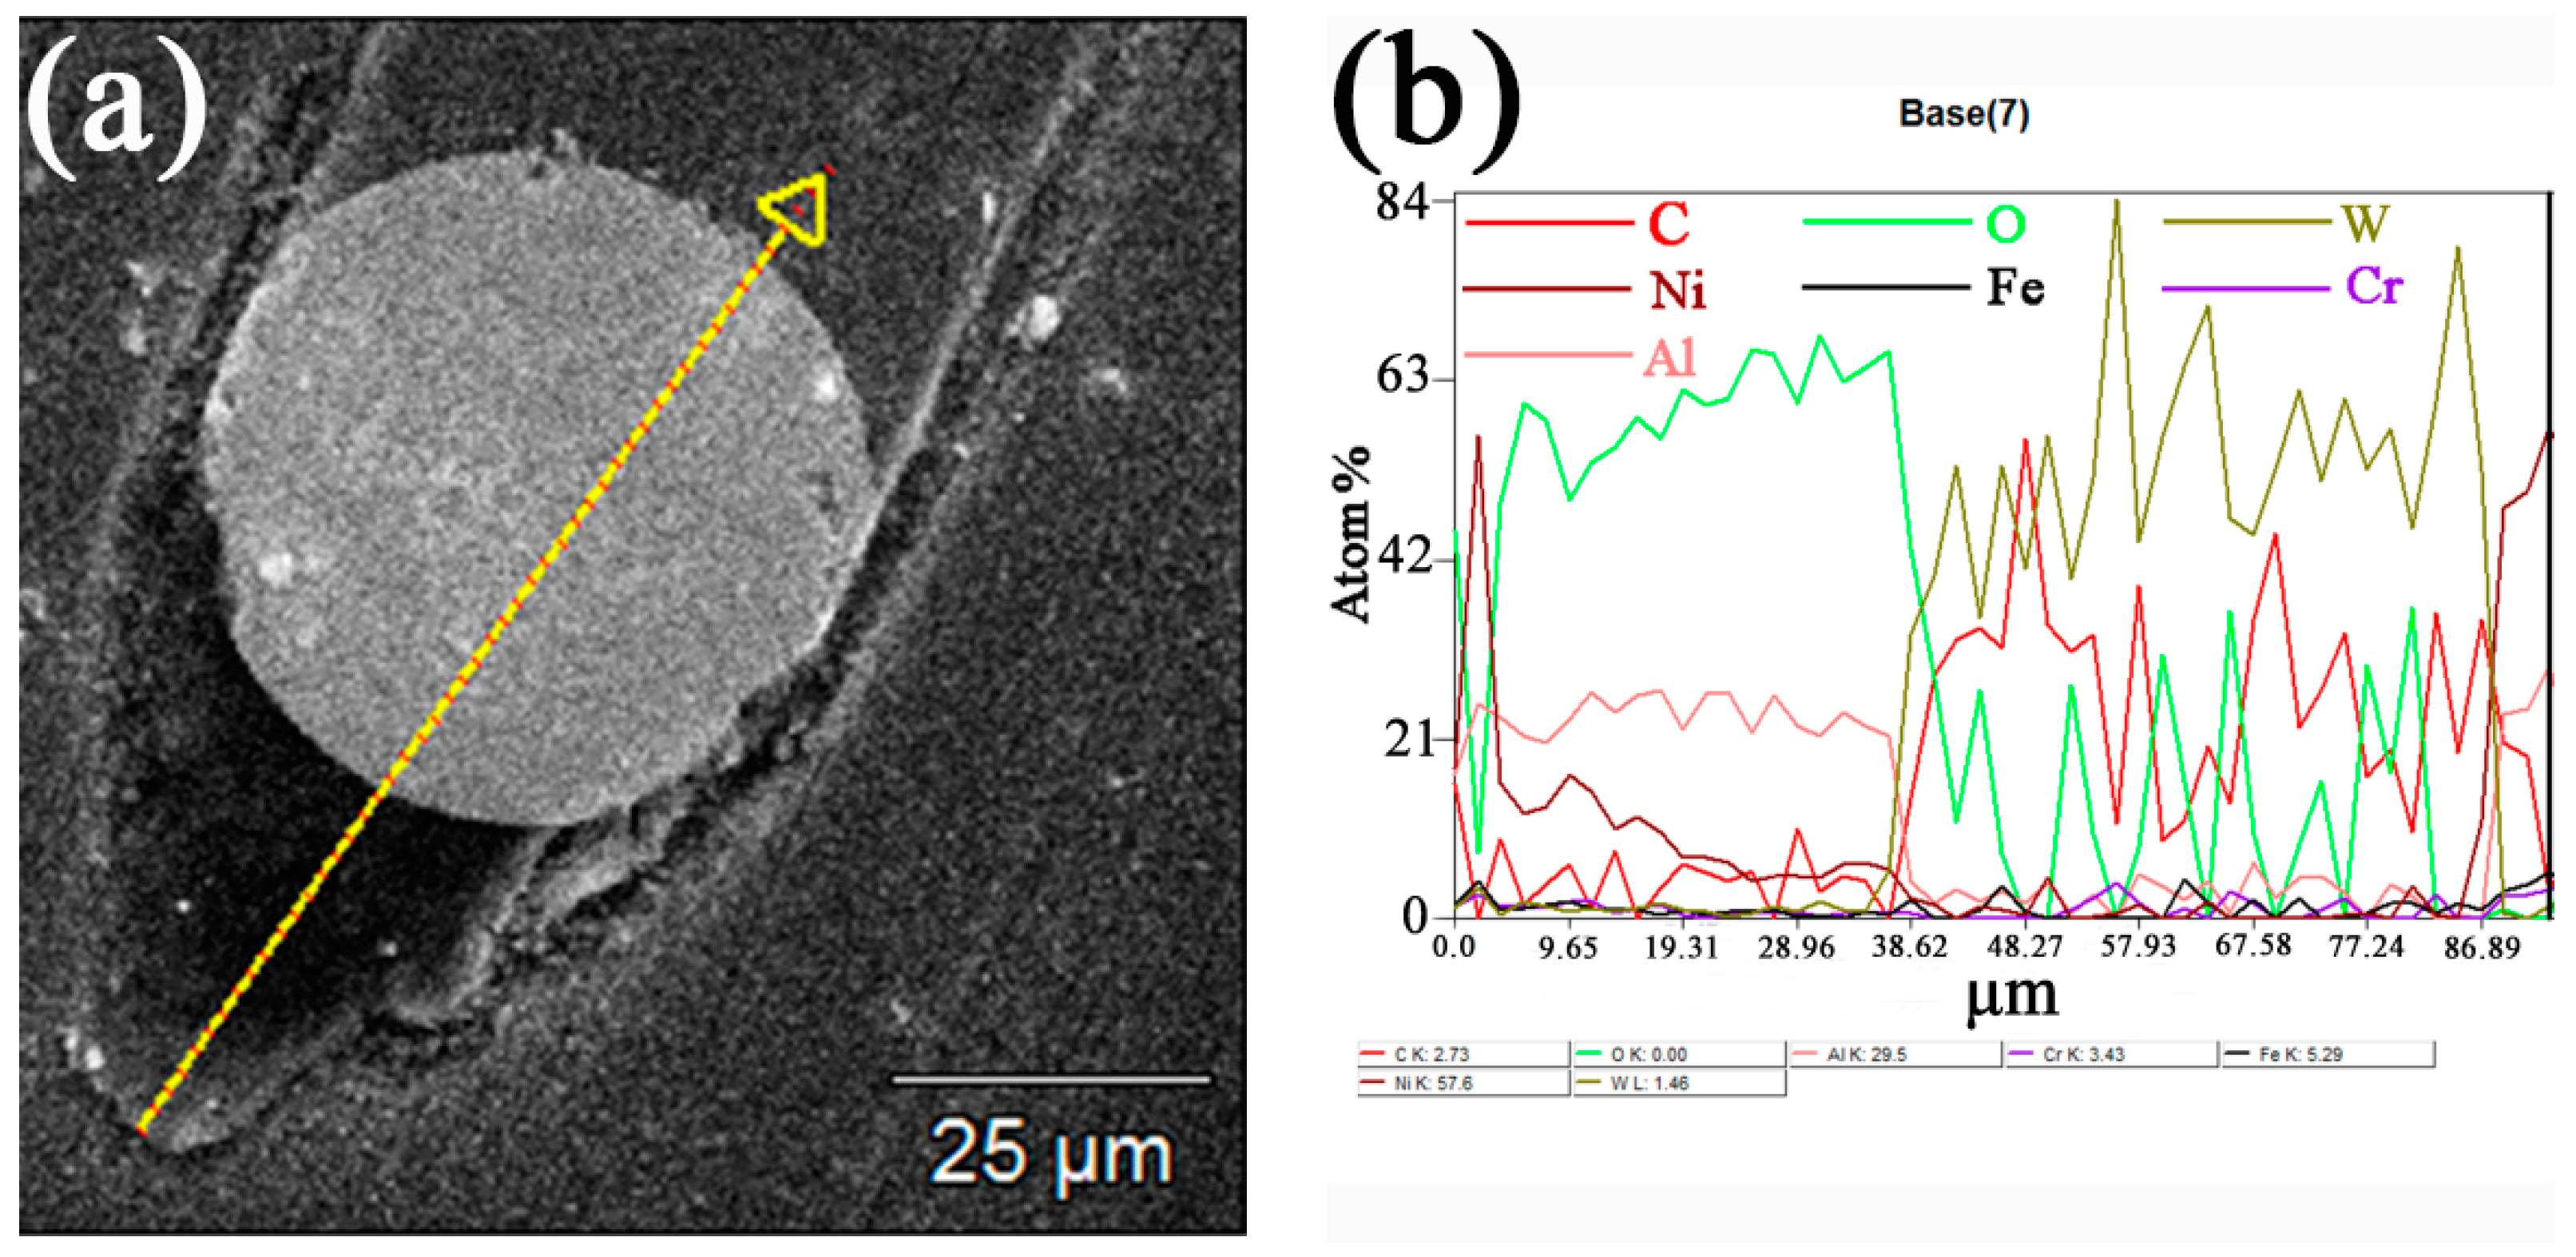
3.2. Composition Analysis of the Layer
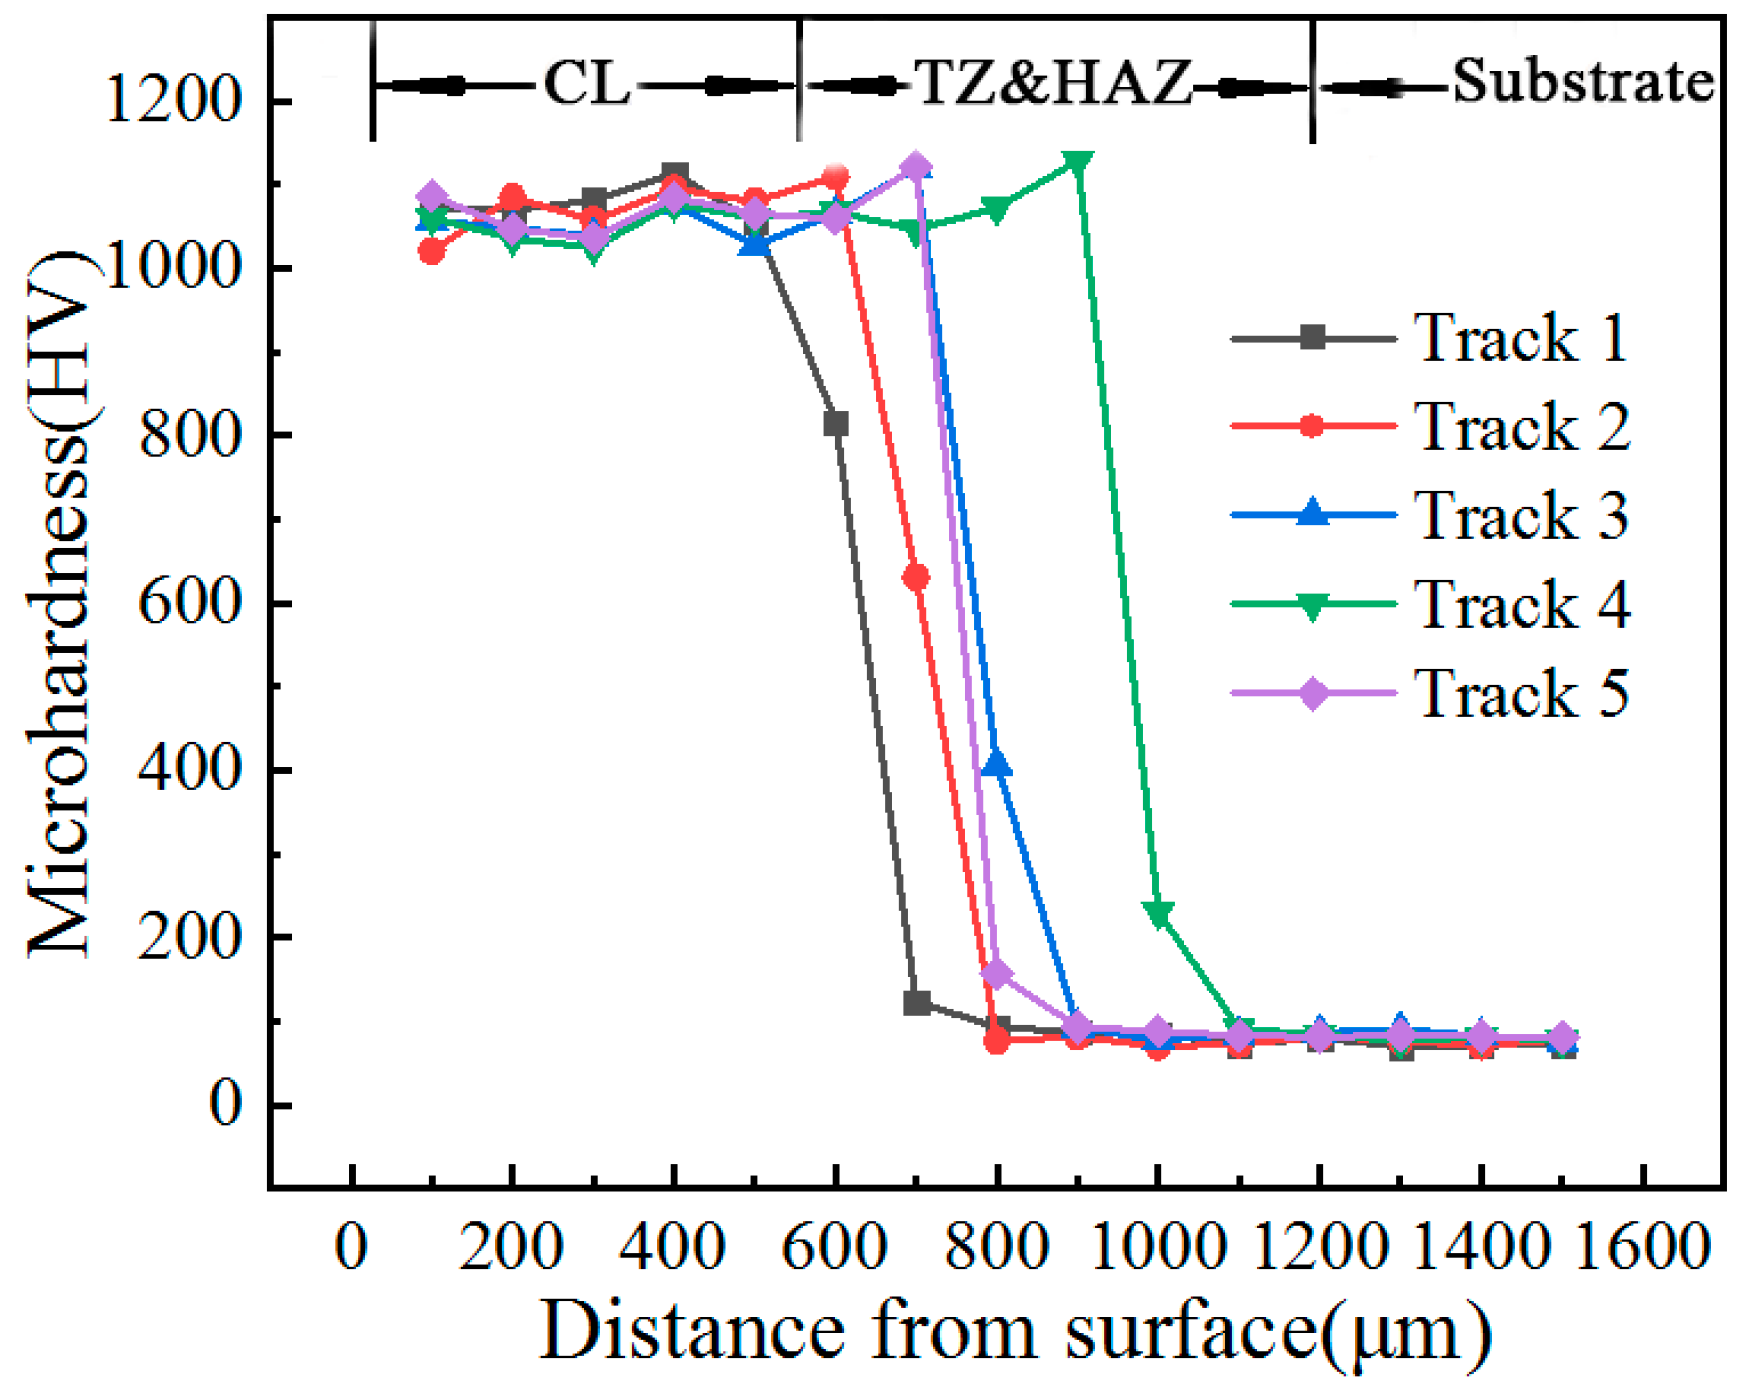
3.3. Microhardness Analysis
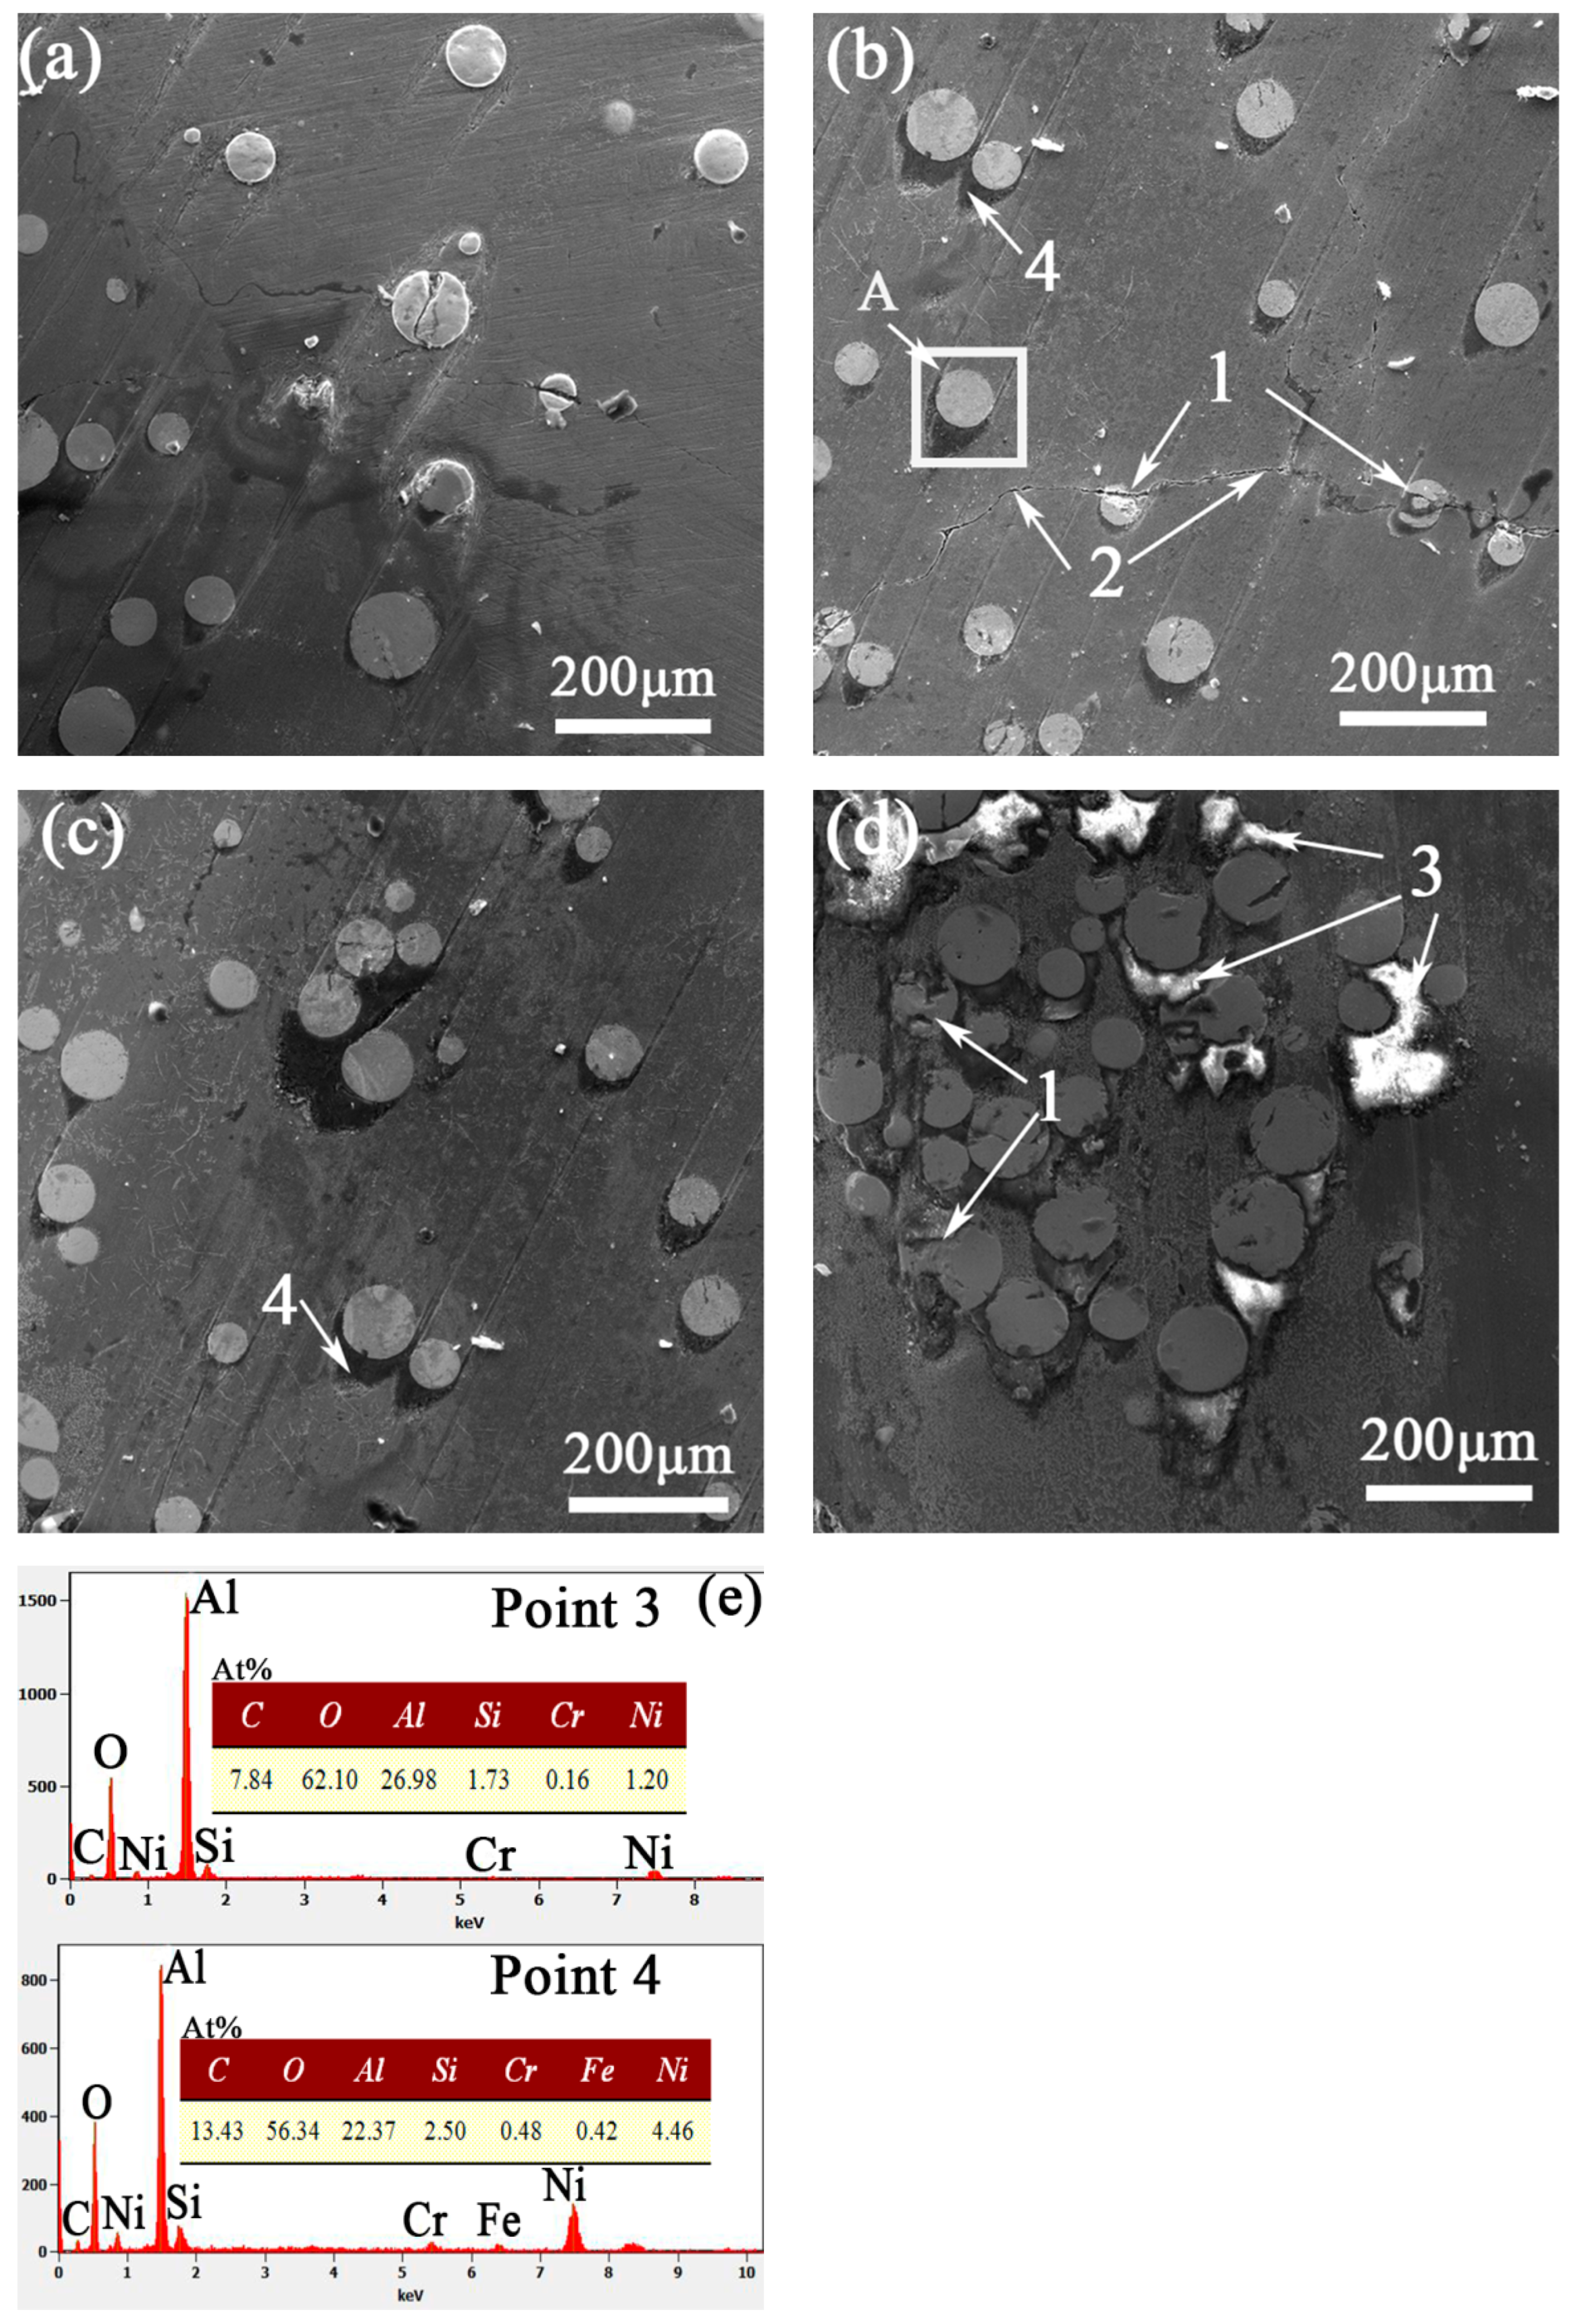
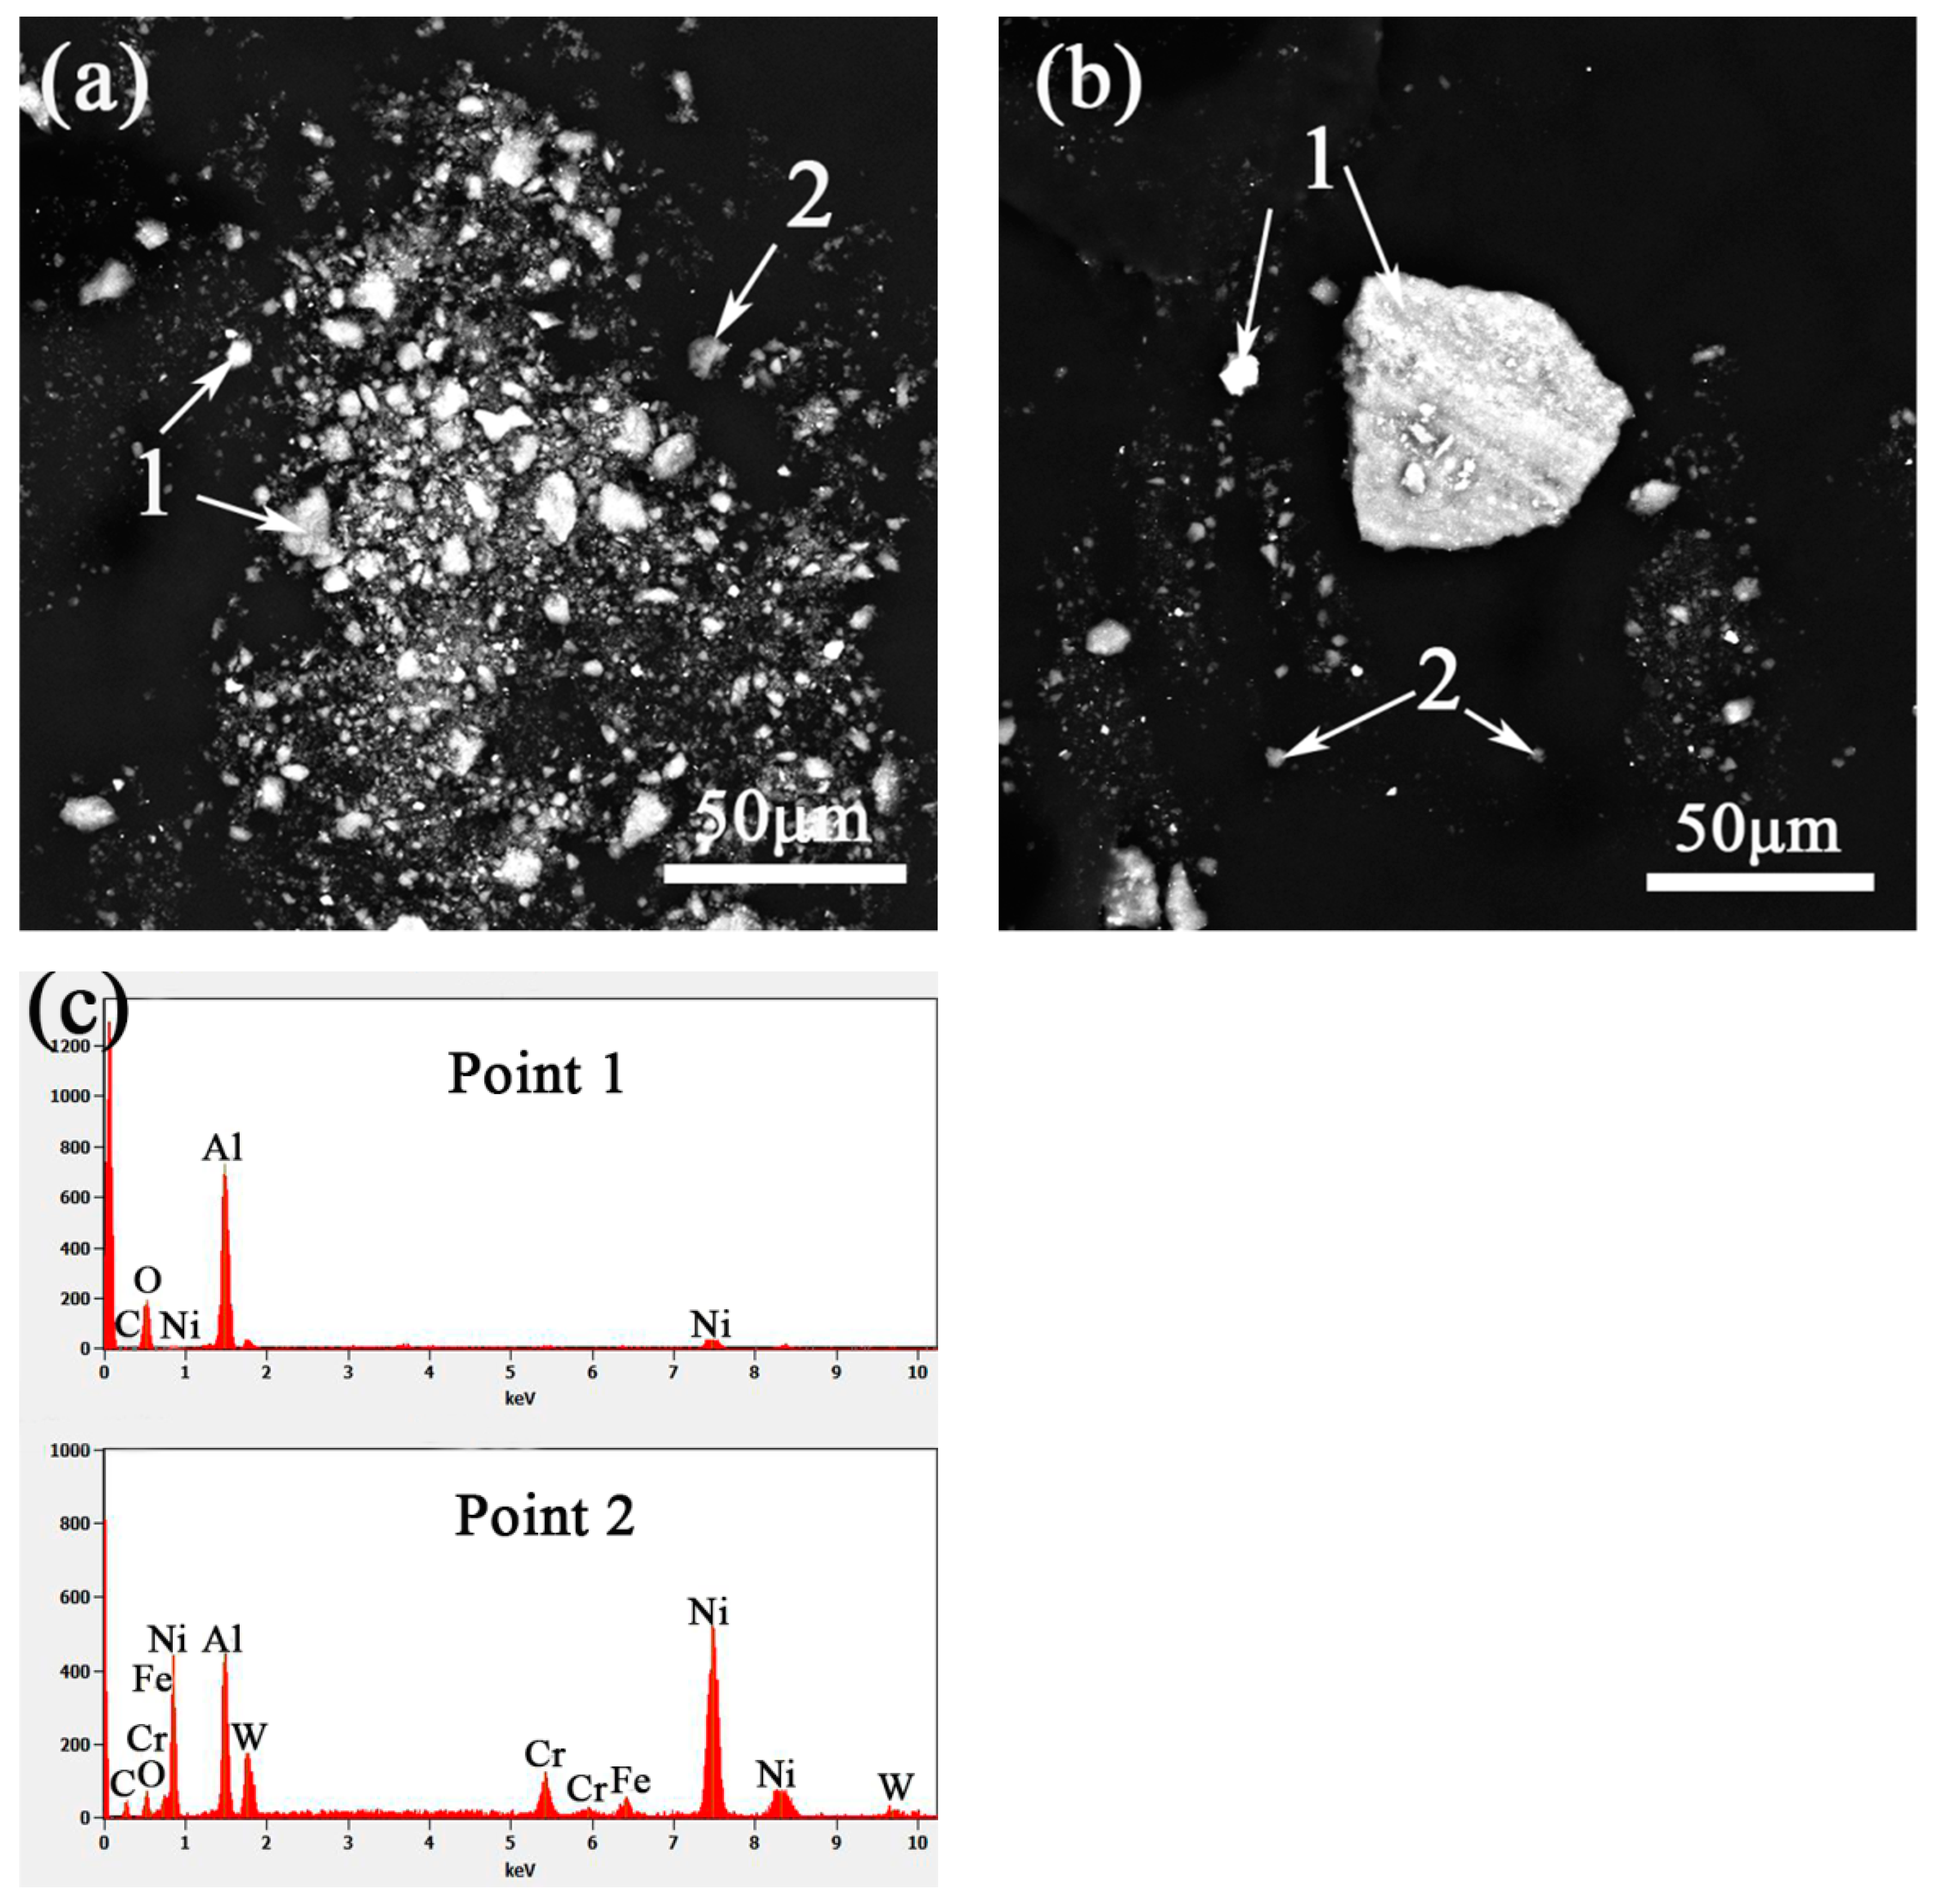
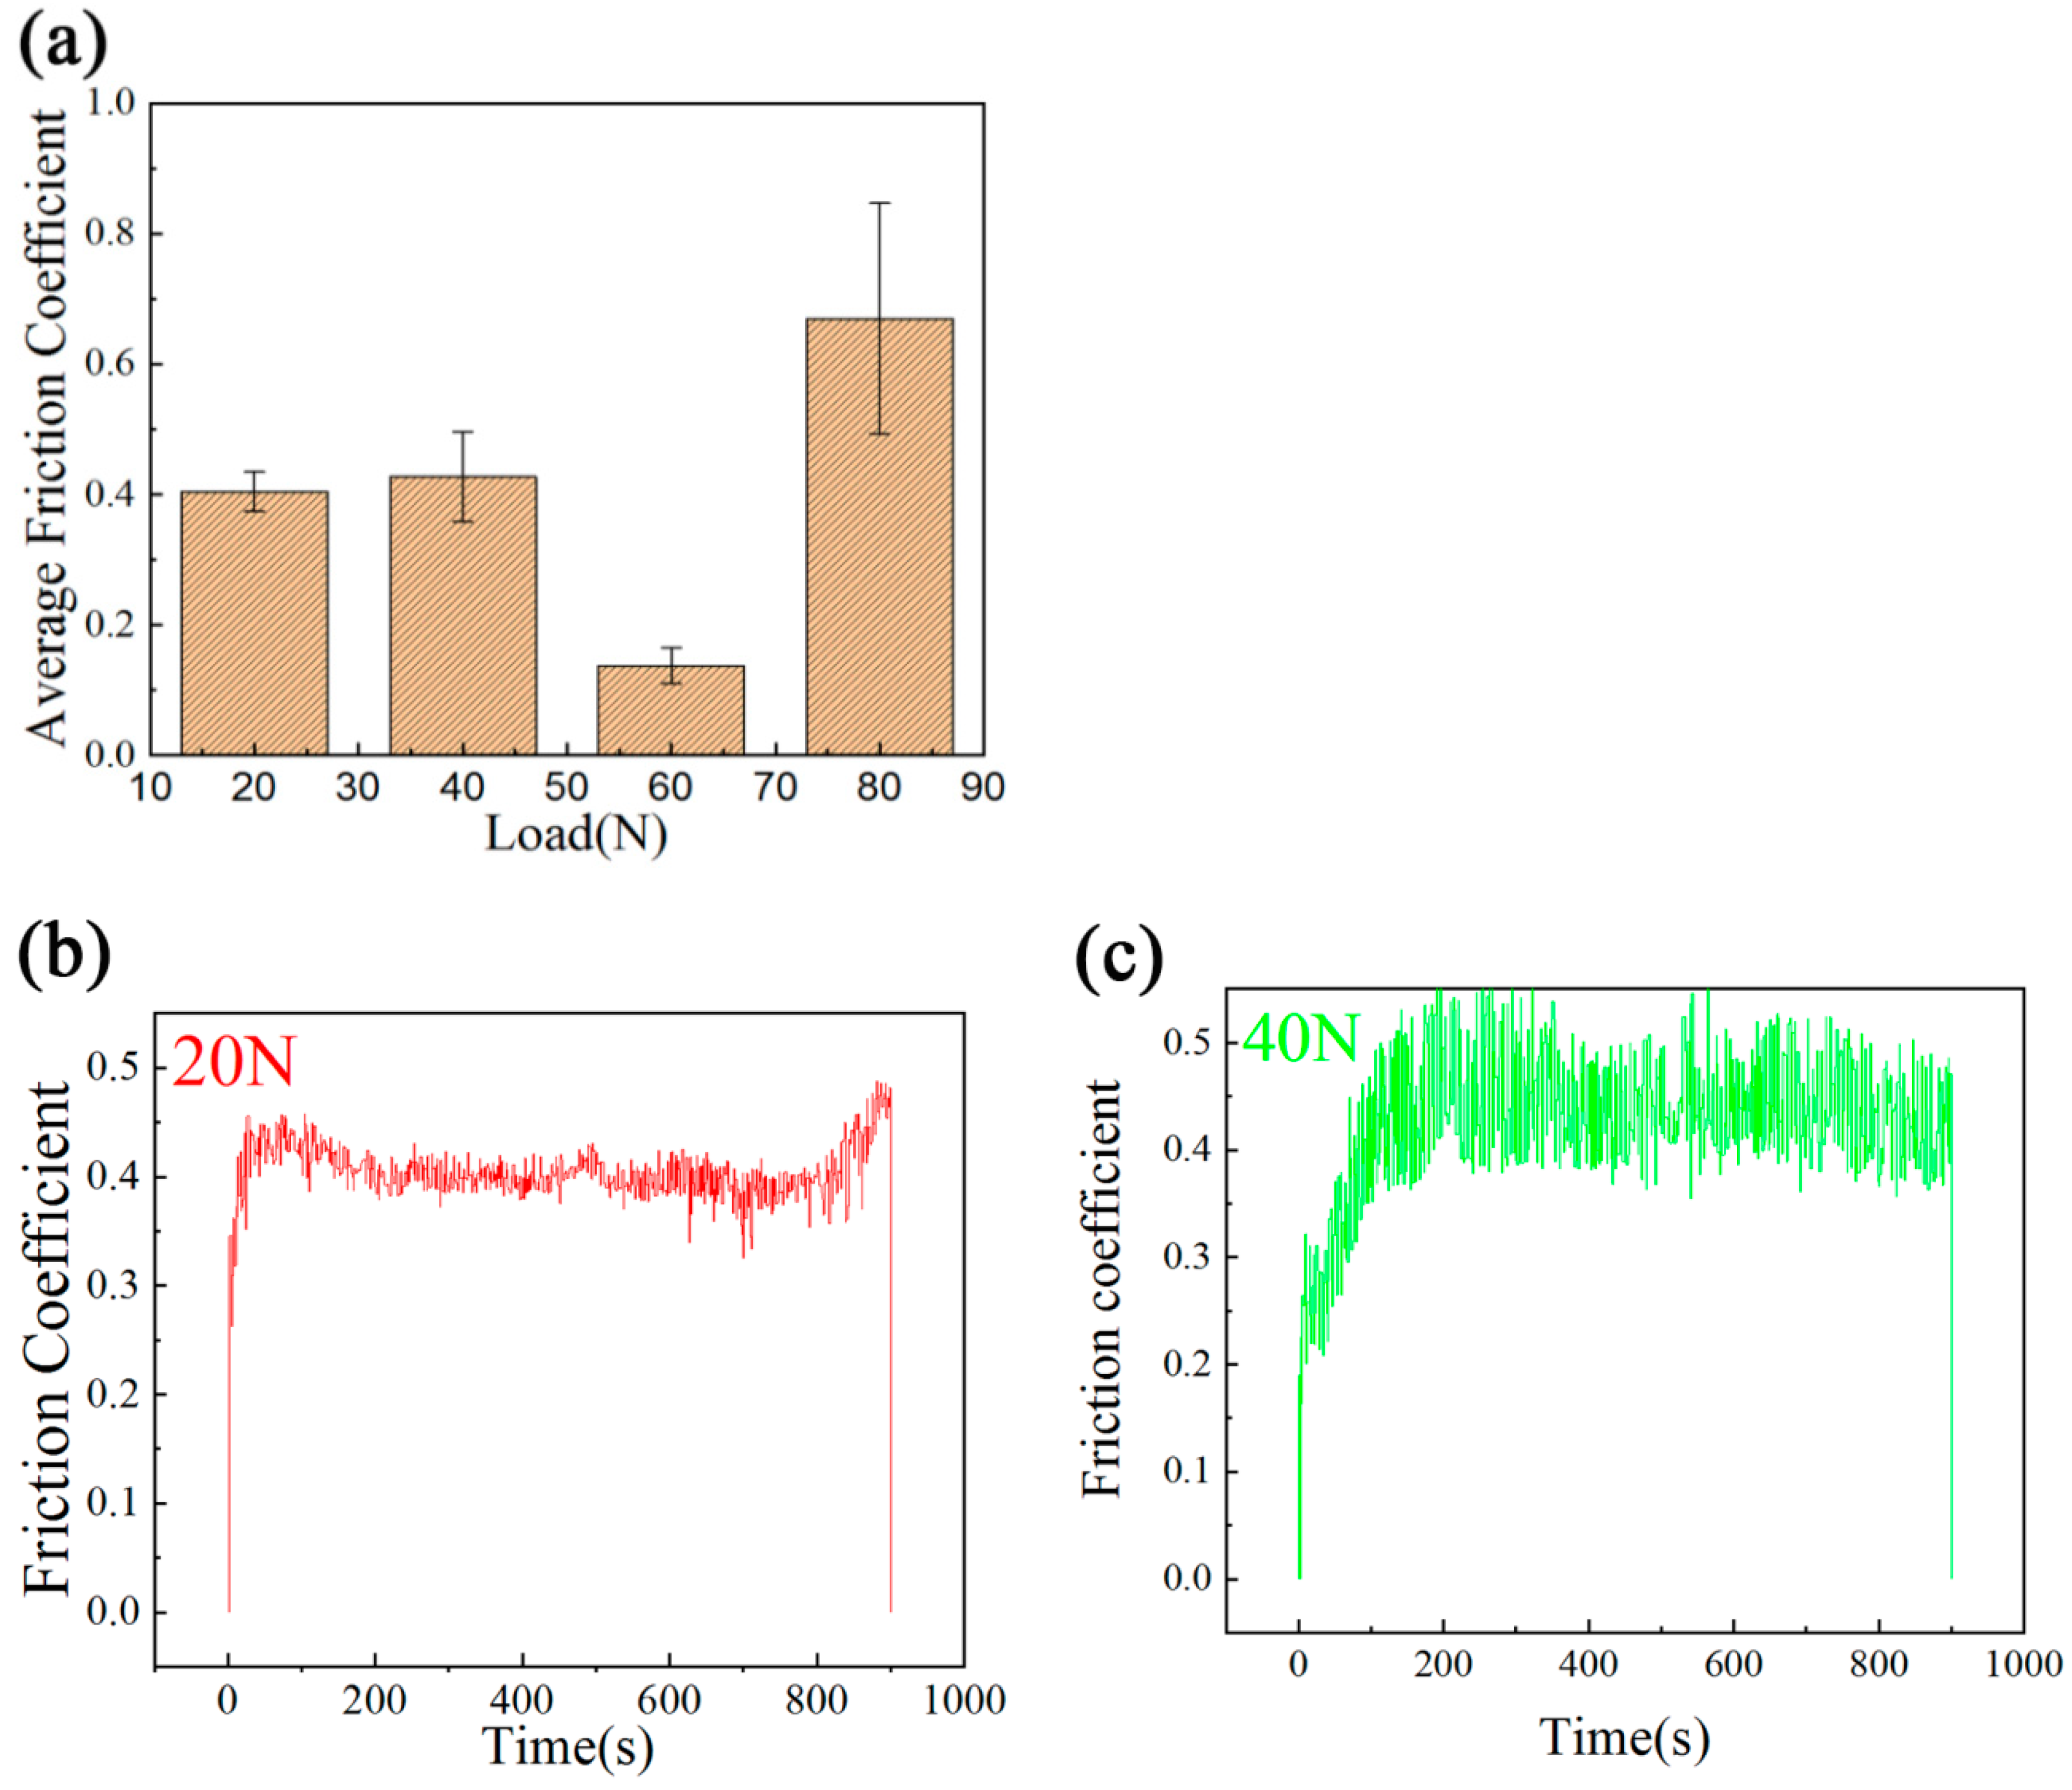
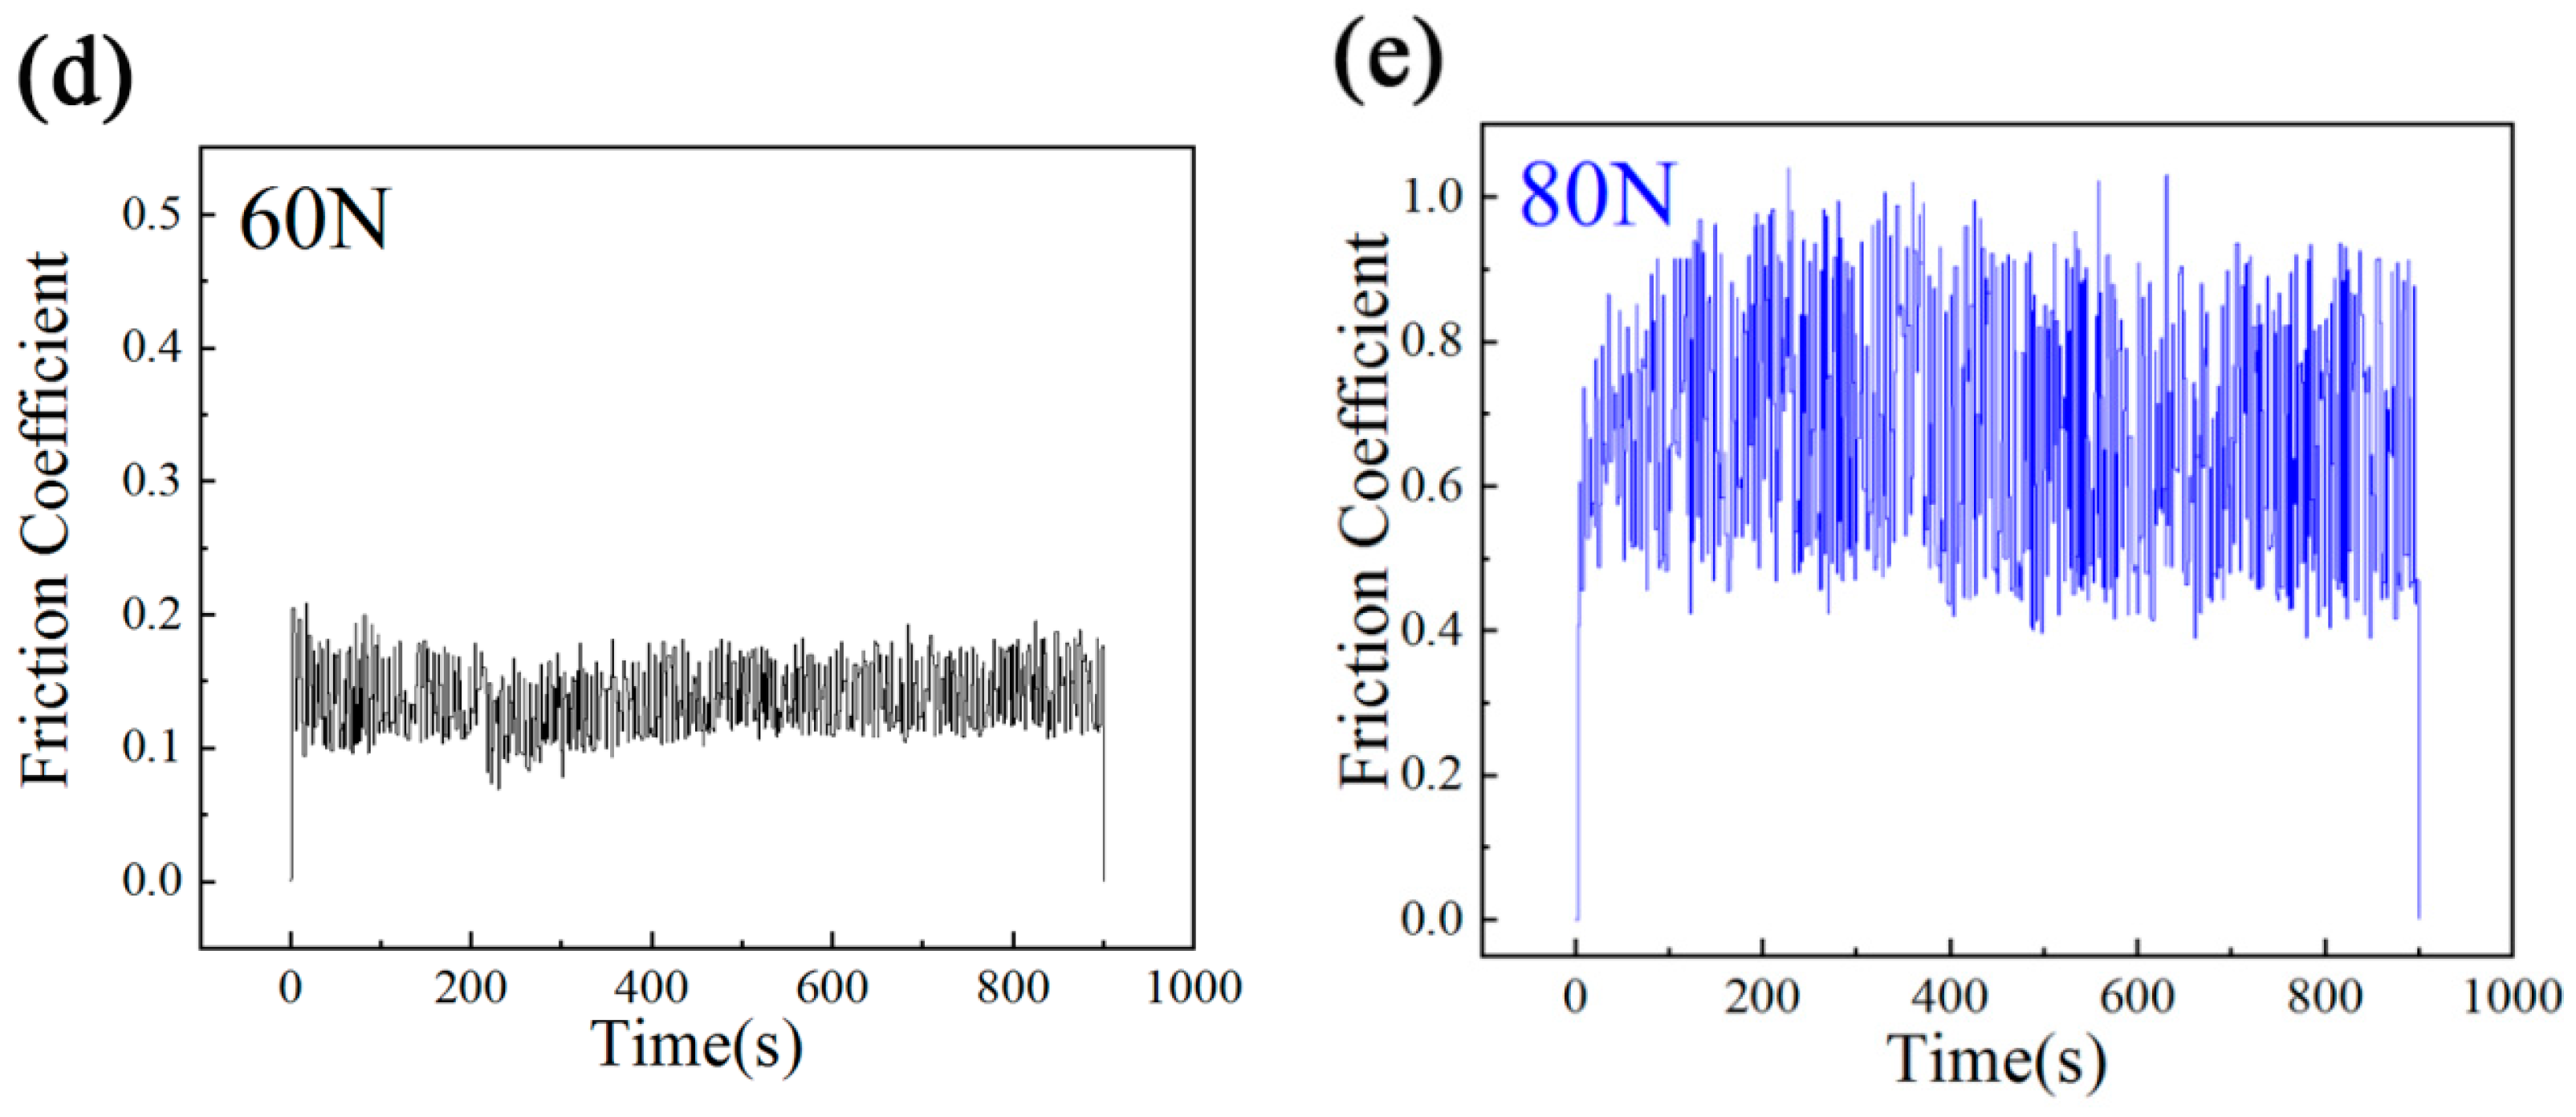
3.4. Wear Test
4. Conclusions
Author Contributions
Funding
Institutional Review Board Statement
Informed Consent Statement
Data Availability Statement
Acknowledgments
Conflicts of Interest
References
- Qingjie, W.; Hong, Y.; Yuan, L.; Zhi, H. Effect of Sr Modification on Microstructures and Mechanical Properties of Al3Ti/ADC12 Composites. Rare Met. Mater. Eng. 2018, 47, 742–747. [Google Scholar] [CrossRef]
- Xiaoquan, W.; Hong, Y.; Yong, X.; Baobiao, Y.; Zhi, H.; Yonghui, S. Microstructure and Wear Properties of Ni-based Composite Coatings on Aluminum Alloy Prepared by Laser Cladding. Rare Met. Mater. Eng. 2020, 49, 2574–2582. [Google Scholar]
- Liu, H.; Sun, S.; Zhang, T.; Zhang, G.; Yang, H.; Hao, J. Effect of Si addition on microstructure and wear behavior of AlCoCrFeNi high-entropy alloy coatings prepared by laser cladding. Surf. Coat. Technol. 2020, 405, 126522. [Google Scholar] [CrossRef]
- Ansari, M.; Sohi, M.H.; Soltani, R.; Torkamany, M.J. Effect of pulsed Nd:YAG laser re-melting on chromium surface alloyed AA6061-T6 aluminum. Int. J. Adv. Manuf. Technol. 2016, 83, 1–7. [Google Scholar] [CrossRef]
- Anandkumar, R.; Almeida, A.; Colaço, R.; Vilar, R.; Ocelik, V.; De Hosson, J.T.M. Microstructure and wear studies of laser clad Al-Si/SiC (p), composite coatings. Surf. Coat. Technol. 2007, 201, 9497–9505. [Google Scholar] [CrossRef] [Green Version]
- Guangyao, Z.; Chenglei, W.; Yuan, G. Mechanism of rare earth CeO2 on the Ni-based laser cladding layer of 6063 Al surface. Rare Met. Mater. Eng. 2016, 45, 1002–1006. [Google Scholar]
- Hashemi, N.; Mertens, A.; Montrieux, H.M.; Tchuindjang, J.T.; Dedry, O.; Carrus, R.; Lecomte-Beckers, J. Oxidative wear behaviour of laser clad High Speed Steel thick deposits Influence of sliding speed carbide type and morphology. Surf. Coat. Technol. 2017, 315, 519–529. [Google Scholar] [CrossRef]
- Torres, H.; Slawik, S.; Gachot, C.; Prakash, B.; Ripoll, M.R. Microstructural design of self-lubricating laser claddings for use in high temperature sliding applications. Surf. Coat. Technol. 2018, 337, 24–34. [Google Scholar] [CrossRef]
- Yang, C.; Cheng, X.; Tang, H.; Tian, X.; Liu, D. Influence of microstructures and wear behaviors of the microalloyed coatings on TC11 alloy surface using laser cladding technique. Surf. Coat. Technol. 2018, 337, 97–103. [Google Scholar] [CrossRef]
- Wu, X.Q.; Yan, H.; Xin, Y. Study on Microstructure and properties of laser cladding Al-Ti-C coating on aluminum alloy surface. J. Nanoelectron. Optoelectron. 2018, 13, 1258–1264. [Google Scholar] [CrossRef]
- Grohol, C.M.; Shin, Y.C.; Frank, A. Laser cladding of aluminum alloy 6061 via off-axis powder injection. Surf. Coat. Technol. 2021, 415, 127099. [Google Scholar] [CrossRef]
- Wu, C.L.; Zhang, S.; Zhang, C.H.; Zhang, H.; Dong, S.Y. Phase evolution and properties in laser surface alloying of FeCoCrAlCuNix, high-entropy alloy on copper substrate. Surf. Coat. Technol. 2017, 315, 368–376. [Google Scholar] [CrossRef]
- Shu, D.; Li, Z.; Yao, C.; Li, D.; Dai, Z. In situ synthesised WC reinforced nickel coating by laser cladding. Surf. Coat. Technol. 2017, 34, 276–282. [Google Scholar] [CrossRef]
- Jue, J.; Gu, D.; Chang, K.; Dai, D. Microstructure evolution and mechanical properties of Al-Al2O3 composites fabricated by selective laser melting. Powder Technol. 2017, 310, 80–91. [Google Scholar] [CrossRef]
- Xu, G.; Kutsuna, M.; Liu, Z.; Yamada, K. Comparison between diode laser and TIG cladding of Co-based alloys on the SUS403 stainless steel. Surf. Coat. Technol. 2006, 201, 1138–1144. [Google Scholar] [CrossRef]
- Dariusz, B.; Aneta, B.; Peter, J. Laser cladding process of Fe/WC metal matrix composite coatings on low carbon steel using Yb: YAG disk laser. Opt. Laser Technol. 2021, 136, 106784. [Google Scholar]
- Gao, W.; Zhao, S.; Liu, F.; Wang, Y.; Zhou, C.; Lin, X. Effect of defocus manner on laser cladding of Fe-based alloy powder. Surf. Coat. Technol. 2014, 248, 54–62. [Google Scholar] [CrossRef]
- Zhu, L.; Yang, Z.; Xin, B.; Wang, S.; Meng, G.; Ning, J.; Xue, P. Microstructure and mechanical properties of parts formed by ultrasonic vibration-assisted laser cladding of Inconel 718. Surf. Coat. Technol. 2021, 410, 126964. [Google Scholar] [CrossRef]
- Wang, F.; Mao, H.; Zhang, D.; Zhao, X. The crack control during laser cladding by adding the stainless steel net in the coating. Appl. Surf. Sci. 2009, 255, 8846–8854. [Google Scholar] [CrossRef]
- Wang, K.M.; Fu, H.G.; Lei, Y.P.; Yang, Y.W.; Li, Q.T.; Su, Z.Q. Microstructure and property of Ni60A/WC composite coating fabricated by fiber laser cladding. Mater. Werkst. 2016, 46, 1177–1184. [Google Scholar] [CrossRef]
- Ma, Q.; Li, Y.; Wang, J. Effects of Ti addition on microstructure homogenization and wear resistance of wide-band laser clad Ni60/WC composite coatings. Int. J. Refract. Met. Hard Mater. 2017, 64, 225–233. [Google Scholar]
- Li, B.; Zhu, H.; Qiu, C.; Gong, X. Laser cladding and in-situ nitriding of martensitic stainless steel coating with striking performance. Mater. Lett. 2020, 259, 126829.1–126829.4. [Google Scholar] [CrossRef]
- Chen, W.; Chen, H.; Wang, Y.; Li, C.; Wang, X. Characteristics of Ni–Cr–Fe laser clad layers on EA4T steel. Int. J. Mod. Phys. B 2017, 31, 1744031. [Google Scholar] [CrossRef]
- Shatynski, S.R. The thermochemistry of transition metal carbides. Oxid. Met. 1979, 13, 105–118. [Google Scholar] [CrossRef]
- Gustafson, P. A thermodynamical evaluation of the C-Cr-Fe-W system. Metall. Trans. A 1998, 19, 2547–2554. [Google Scholar] [CrossRef]
- Shi, B.; Li, T.; Wang, D.; Zhang, X.; Zhang, H. Investigation on crack behavior of Ni60A alloy coating produced by coaxial laser cladding. J. Mater. Sci. 2021, 56, 13323–13336. [Google Scholar] [CrossRef]
- Xiao, Q.; Sun, W.L.; Yang, K.X.; Xing, X.F.; Chen, Z.H.; Zhou, H.N.; Lu, J. Wear mechanisms and micro-evaluation on WC particles investigation of WC-Fe composite coatings fabricated by laser cladding. Surf. Coat. Technol. 2021, 420, 127341. [Google Scholar] [CrossRef]


| Elements | Cr | Fe | Si | B | C | Ni |
|---|---|---|---|---|---|---|
| Contents | 18.0 | 8.0 | 4.0 | 3.2 | 0.6 | bal |
| Rotating Speed (m/s) | Load (N) | Time (s) | |
|---|---|---|---|
| Sample 1 | 0.188 | 20 | 900 |
| Sample 2 | 0.188 | 40 | 900 |
| Sample 3 | 0.188 | 60 | 900 |
| Sample 4 | 0.188 | 80 | 900 |
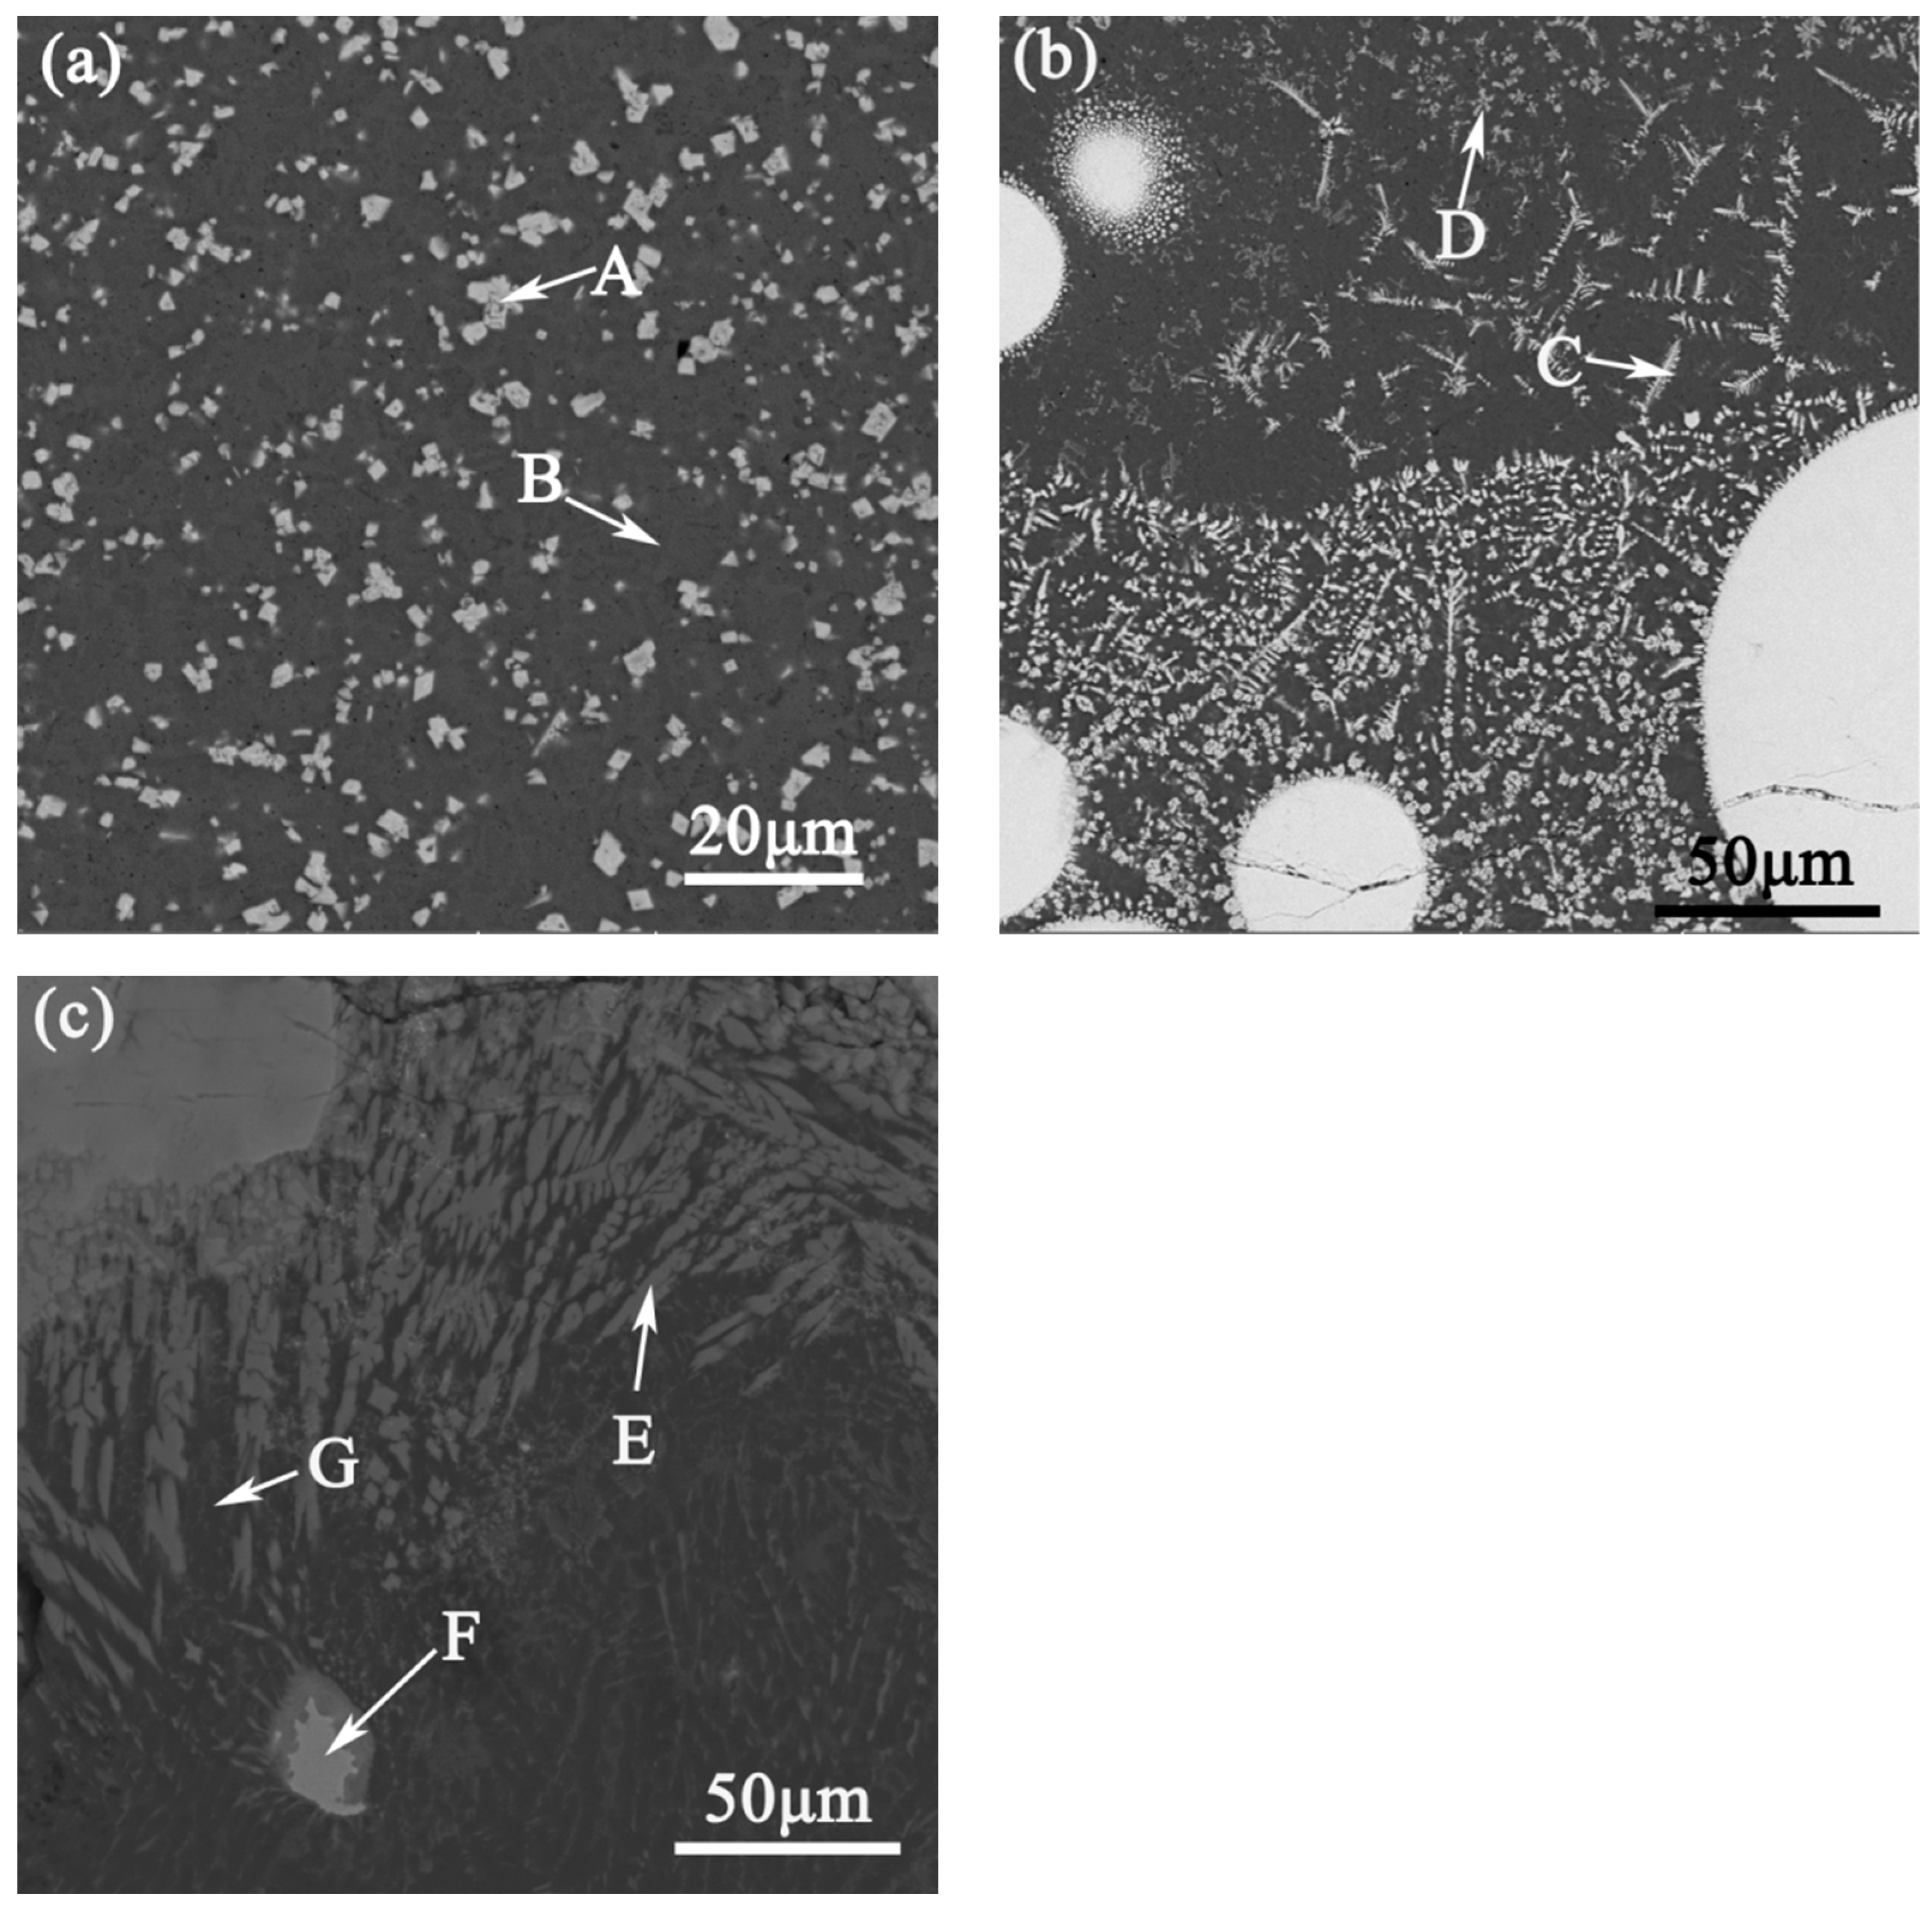
| Zone | Morphology | Composition (at.%) | |||||||
|---|---|---|---|---|---|---|---|---|---|
| C | Al | Si | Cr | Fe | Ni | W | |||
| Top of layer | A | Grain | 28.81 | 4.79 | – | 12.12 | 3.78 | 30.92 | 19.57 |
| B | Matrix | 19.08 | 7.78 | 7.91 | 1.96 | 5.13 | 58.14 | – | |
| Middle of layer | C | Fish-bone | 38.98 | 10.14 | – | 11.43 | 2.52 | 23.48 | 18.18 |
| D | Flower-like | 36.74 | 10.14 | – | 14.75 | 2.04 | 15.83 | 20.50 | |
| Bottom of layer | E | Columnar | 15.87 | 68.49 | 2.62 | 0.25 | 0.46 | 12.31 | – |
| F | Blocky | 35.78 | 1.10 | 5.02 | 4.85 | 2.11 | 51.15 | – | |
| G | Matrix | 17.23 | 65.38 | 14.41 | – | 0.21 | 2.59 | – | |
Publisher’s Note: MDPI stays neutral with regard to jurisdictional claims in published maps and institutional affiliations. |
© 2021 by the authors. Licensee MDPI, Basel, Switzerland. This article is an open access article distributed under the terms and conditions of the Creative Commons Attribution (CC BY) license (https://creativecommons.org/licenses/by/4.0/).
Share and Cite
Wu, X.; Zhang, D.; Hu, Z. Microstructure and Wear Properties of Laser Cladding WC/Ni-Based Composite Layer on Al–Si Alloy. Materials 2021, 14, 5288. https://doi.org/10.3390/ma14185288
Wu X, Zhang D, Hu Z. Microstructure and Wear Properties of Laser Cladding WC/Ni-Based Composite Layer on Al–Si Alloy. Materials. 2021; 14(18):5288. https://doi.org/10.3390/ma14185288
Chicago/Turabian StyleWu, Xiaoquan, Daoda Zhang, and Zhi Hu. 2021. "Microstructure and Wear Properties of Laser Cladding WC/Ni-Based Composite Layer on Al–Si Alloy" Materials 14, no. 18: 5288. https://doi.org/10.3390/ma14185288
APA StyleWu, X., Zhang, D., & Hu, Z. (2021). Microstructure and Wear Properties of Laser Cladding WC/Ni-Based Composite Layer on Al–Si Alloy. Materials, 14(18), 5288. https://doi.org/10.3390/ma14185288