Article

Synthesis and Na+ Ion Conductivity of Stoichiometric Na3Zr2Si2PO12 by Liquid-Phase Sintering with NaPO3 Glass

Department of Materials Science and Technology, Nagaoka University of Technology, Niigata 940-2188, Japan
*
Author to whom correspondence should be addressed.
Materials 2021, 14(14), 3790; https://doi.org/10.3390/ma14143790
Submission received: 31 May 2021 / Revised: 1 July 2021 / Accepted: 1 July 2021 / Published: 6 July 2021
(This article belongs to the Special Issue Oxide-Based All-Solid-State Lithium-Ion Batteries)

Abstract

:
Sodium super ionic conductor (NASICON)-type Na3Zr2Si2PO12 (NZSP) with the advantages of the high ionic conductivity, stability and safety is one of the most famous solid-state electrolytes. NZSP, however, requires the high sintering temperature about 1200 °C and long sintering time in the conventional solid-state reaction (SSR) method. In this study, the liquid-phase sintering (LPS) method was applied to synthesize NZSP with the use of NaPO3 glass with a low glass transition temperature of 292 °C. The formation of NZSP was confirmed by X-ray diffraction analyses in the samples obtained by the LPS method for the mixture of Na2ZrSi2O7, ZrO2, and NaPO3 glass. The sample sintered at 1000 °C for 10 h exhibited a higher Na+ ion conductivity of 1.81 mS/cm at 100 °C and a lower activation energy of 0.18 eV compared with the samples prepared by the SSR method. It is proposed that a new LPE method is effective for the synthesis of NZSP and the NaPO3 glass has a great contribution to the Na+ diffusion at the grain boundaries.

1. Introduction

All-solid-state batteries (ASSBs) have received much attention because of their high safety performance compared with the conventional lithium-ion batteries (LIBs) using liquid electrolytes [1,2,3,4]. ASSBs have been also expected to have high capacities, because cathode, solid electrolyte, anode, and collecting electrode can be integrated in ASSBs and high-density loadings are allowed. Recently, all-solid-state sodium batteries (Na-ASSBs) including no rare metals such as Li and Co have been proposed as prototypes [5,6,7,8,9]. Sodium has an energy density per weight lower than that of lithium, but this disadvantage would be largely improved in ASSBs. Yamauchi et al. [8,9] proposed a new prototype Na-ASSBs, in which Na2FeP2O7 glass-ceramics and β-alumina solid solutions are used as cathode active materials and solid electrolytes, respectively. Na2FeP2O7 glass and its derivative glass-ceramics exhibit viscous flows during the crystallization process and can be adhered to solid electrolytes at a low temperature of 500 °C without any external pressurization [10,11,12,13,14,15]. The battery’s internal resistance was successfully reduced by optimizing the crystallization process of Na2FeP2O7 glass, and the battery operation at −20 °C was demonstrated [9].
Solid electrolytes constituting ASSBs can be roughly classified into sulfides and oxides. The low Young’s modulus of sulfide solid electrolytes allows them to deform plastically only under pressure at room temperature, consequently suppressing the resistance against Na+ ion conductivity at grain boundaries [16]. Na3Zr2Si2PO12 (NZSP) reported first by Goodenough et al. [17] is a well-known oxide ionic conductor with a high Na+ ion conductivity of 0.2 S/cm at 300 °C. The synthesis of well-densified NZSP by classical solid-state reaction requires a long sintering process at 1250 °C to improve ionic conductivity at room temperature [18,19]. Heat treatment at high temperature is essential if ZrO2 is used as a raw material. A sol-gel method is also possible to synthesize NZSP by fast sintering at 1000 °C from fine xerogels as precursor, but there are issues with economical commercial production. [20] For the use of NZSP as solid electrolytes in ASSBs, the internal resistance against Na+ ion conductivity must be largely improved and overcome through the design of the morphology and grain boundary of NZSP. Generally, it is obvious that plastic deformation cannot be expected in oxide with high Young’s moduli.
Glasses exhibit viscous flow at temperatures above the glass transition temperature and have open structure being an advantage for ion diffusion. Glasses have been, therefore, used as sintering aids and sealants for the production of functional ceramics and devices such as fuel cells and bio-active ceramics [21,22,23,24,25,26]. Okamoto et al. [27] applied Na2O-Nb2O5-P2O5 glasses as sintering additives to NZSP and found that the composite obtained by the heat treatment at 900 °C for 10 min exhibits the electrical conductivity (σ) of σ = 1.2 × 10⁻⁴ Scm−1 at 25 °C. There have been several reports on the synthesis of NZSP using sintering additives [28,29,30,31,32]. The addition of sintering additives to NZSP means, however, that the chemical composition of the composite obtained deviates from the stoichiometric composition of NZSP.
In this study, we propose using a NaPO3 glass (50Na2O-50P2O5) as one component of raw materials for the synthesis of stoichiometric NZSP. Since the NaPO3 glass has a low glass transition temperature, it is expected that a liquid phase is created during the reaction of raw materials [33,34,35,36,37,38], i.e., the liquid-phase sintering (LPS). In other words, the formation of NZSP would be expected to occur at lower temperatures and in shorter times in the use of glass as a raw material compared with the SSR method using crystalline compounds as raw materials. This paper describes the synthesis of Na3Zr2Si2PO12 materials with the stoichiometric composition by sintering of the mixture of raw materials with the molar ratio of Na2ZrSi2O7:ZrO2:NaPO3 glass = 1:1:1 and their microstructure and Na+ ion conductivity. There has been no report on the synthesis of NZSP using NaPO3 glass.

2. Materials and Methods

The NaPO3 glass was prepared by the melt-quenching method. The raw material sodium dihydrogen phosphate (98.0% NaH2PO4, Nakarai Tesque Co. (Kyoto, Japan) was weighted in a platinum crucible and then pre-sintered at 500 °C for 8 h at the heating rate of 1 °C/min. The pre-sintered sample was melted at 1000 °C for 30 min in air, and the melt was quenched using a steel plate. Na2ZrSi2O7-ZrO2 composite was prepare by the SSR method. Sodium carbonate (Na2CO3), silicon dioxide (SiO2), and zirconium oxide (ZrO2) were weighted and mixed with 10 mL acetone in the condition of 15 min × 4 cycles in 700 rpm with a 10 min waiting time using a wet ball-milling (FRITSCH P-7). The mixture obtained by milling was dried at 120 °C for 12 h, and the calcination of the mixture was conducted at 900 °C for 4 h.
The calcined Na2ZrSi2O7-ZrO2 composite powder and NaPO3 glass were grounded manually to keep the particle size less or equal 32 µm by a sieve, and their powders were mixed mechanically for 30 min. The mixed powders were pressed into pellets with a diameter of 13 mm at a pressure of around 100 MPa. The pellets were placed on a platinum plate and sintered at 1000, 1100, and 1200 °C for 3, 5, 7, and 10 h. The temperature elevation rate to reach the target temperature was set to 10 K/min. In this article, the samples obtained using the above processing is designated as LPS-NZSP. For comparison, NZSP materials were also prepared by the conventional SSR method, in which sodium carbonate Na2CO3, sodium dihydrogen phosphate NaH2PO4, silicon dioxide SiO2, and zirconium oxide ZrO2 were used directly. The conditions of mixing by a wet ball-milling, drying, calcination, grounding, pressing, and sintering were the same as those in the synthesis of LPS-NZSP materials. The samples obtained by the SSR method is designated as SSR-NZSP.
The glass transition temperature Tg, crystallization onset temperature Tx, and crystallization peak temperature Tp of NaPO3 glass prepared in this study were determined from differential thermal analysis (DTA, Thermoplus TG-8120, RIGAKU Corp., Akishima, Tokyo, Japan). Bulk densities were calculated from the measured weight, thickness and diameter of the sintered pellets. The crystalline phases in the samples obtained by different sintering temperatures, and times were identified by X-ray diffraction (XRD) analysis (Rigaku Ultima IV X-ray diffractometer) with Cu-Kα radiation (λ = 0.154056 nm), in which the scanning speed was 5 °C/min and the diffraction angle was 2θ = 10–70°. The Rietveld analysis (PROFEX) [39] was also performed to get information on the identification and quantification of the crystalline phases in the sintered samples. The microstructure of the cross-section of the sintered samples was examined from scanning electron microscope (SEM, KEYENECE VE-8800, Osaka, Japan) observations. X-ray photoelectron spectroscopy (XPS) (ULVAC-PHI PHI5000 Versa Probe II spectrometer, Chigasaki, Kanagawa, Japan) measurements were carried out to determine the intensity of Na, Zr, Si, P, and O elements in the sintered samples, in which the samples were assembled in an Ar-filled glove box to avoid oxidation and contamination and the surface (the thickness of 0.1 mm) of the samples was polished by diamond wheel to remove contamination by carbon dioxide in the air.
Electrical conductivities, i.e., Na+ ion conductivities, of the sintered samples in the temperature range of 100–200 °C were measured by an alternating current (AC) impedance method using an impedance analyzer (HIOKI IM3570, Ueda, Nagano, Japan) in the frequency range of 4–5 MHz. Gold was sputtered onto both sides of the sintered samples (the thickness for 10 nm and the diameter of 6.0 mm φ) as electrodes. Activation energies for Na+ ion conductivity of the sintered samples were evaluated from the temperature dependence of electrical conductivity.

3. Results and Discussion

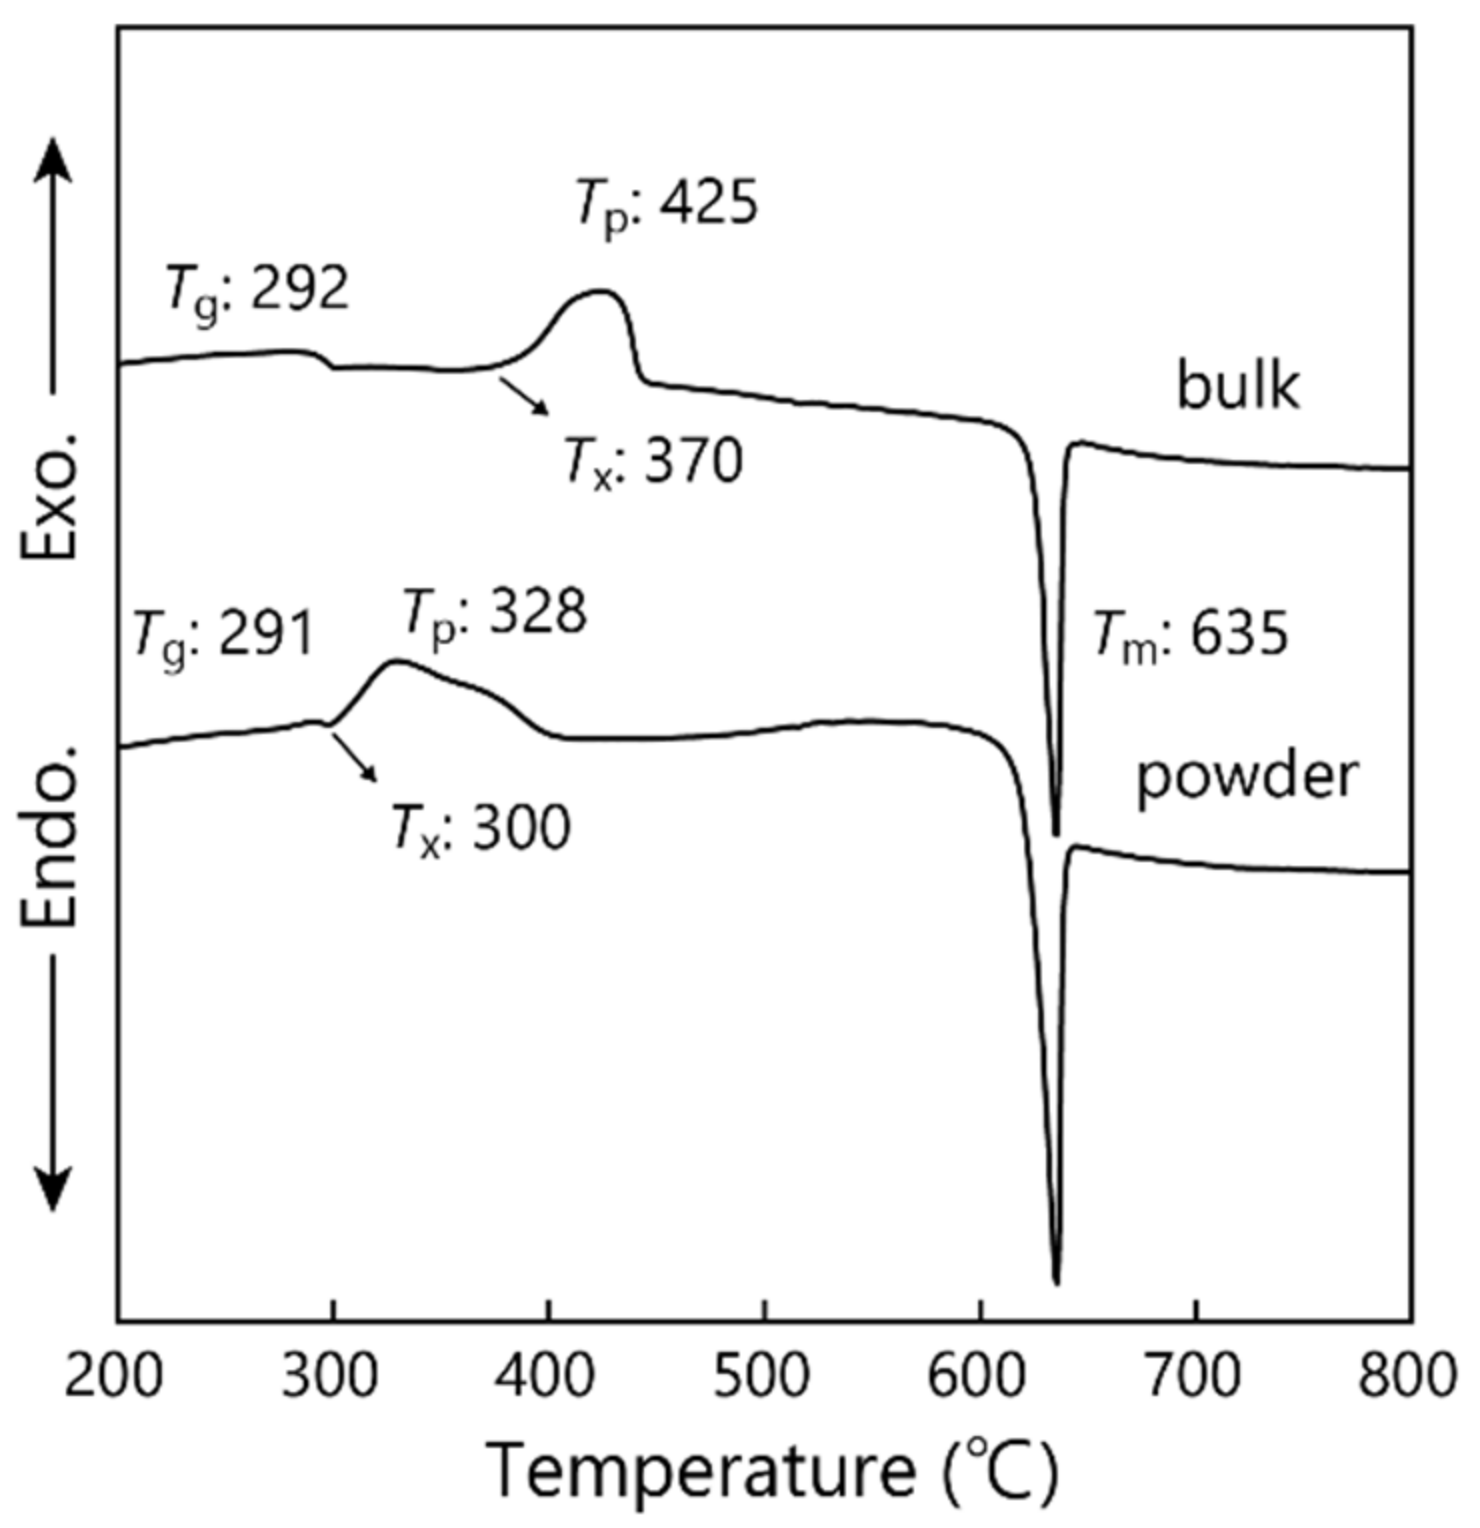
3.1. Thermal Properties of NaPO3 Glass

The DTA curves for the bulk and powder samples of NaPO3 glass at a heating rate of 10 K/min are shown in Figure 1. In the bulk sample, an endothermic dip due to the glass transition and an exothermic peak due to the crystallization are observed, indicating the values of Tg = 292 °C, Tx = 425 °C, and Tp = 425 °C for NaPO3 glass. A sharp endothermic peak with a strong intensity due to the melting is observed at 635 °C. On the other hand, the powder sample has the value of Tp = 328 °C, which is much lower than that in the bulk sample. This result suggests that NaPO3 glass prefers the surface crystallization.
In the present study, the mixture of Na2ZrSi2O7-ZrO2 composite powder and NaPO3 glass is sintered at 1000, 1100, and 1200 °C to synthesize NZSP. The DTA results shown in Figure 1 indicate that the crystallized NaPO3 glass become a liquid phase at temperatures higher than 650 °C, i.e., it is expected that Na2ZrSi2O7-ZrO2 composite powders are surrounded by a liquid phase with the chemical composition of NaPO3 and consequently reactions among the components of Na2ZrSi2O7, ZrO2, and NaPO3 at temperatures of 1000–1200 °C are largely enhanced. In this sense, the use a NaPO3 glass for the synthesis of stoichiometric NZSP would be regarded as the liquid-phase sintering method.

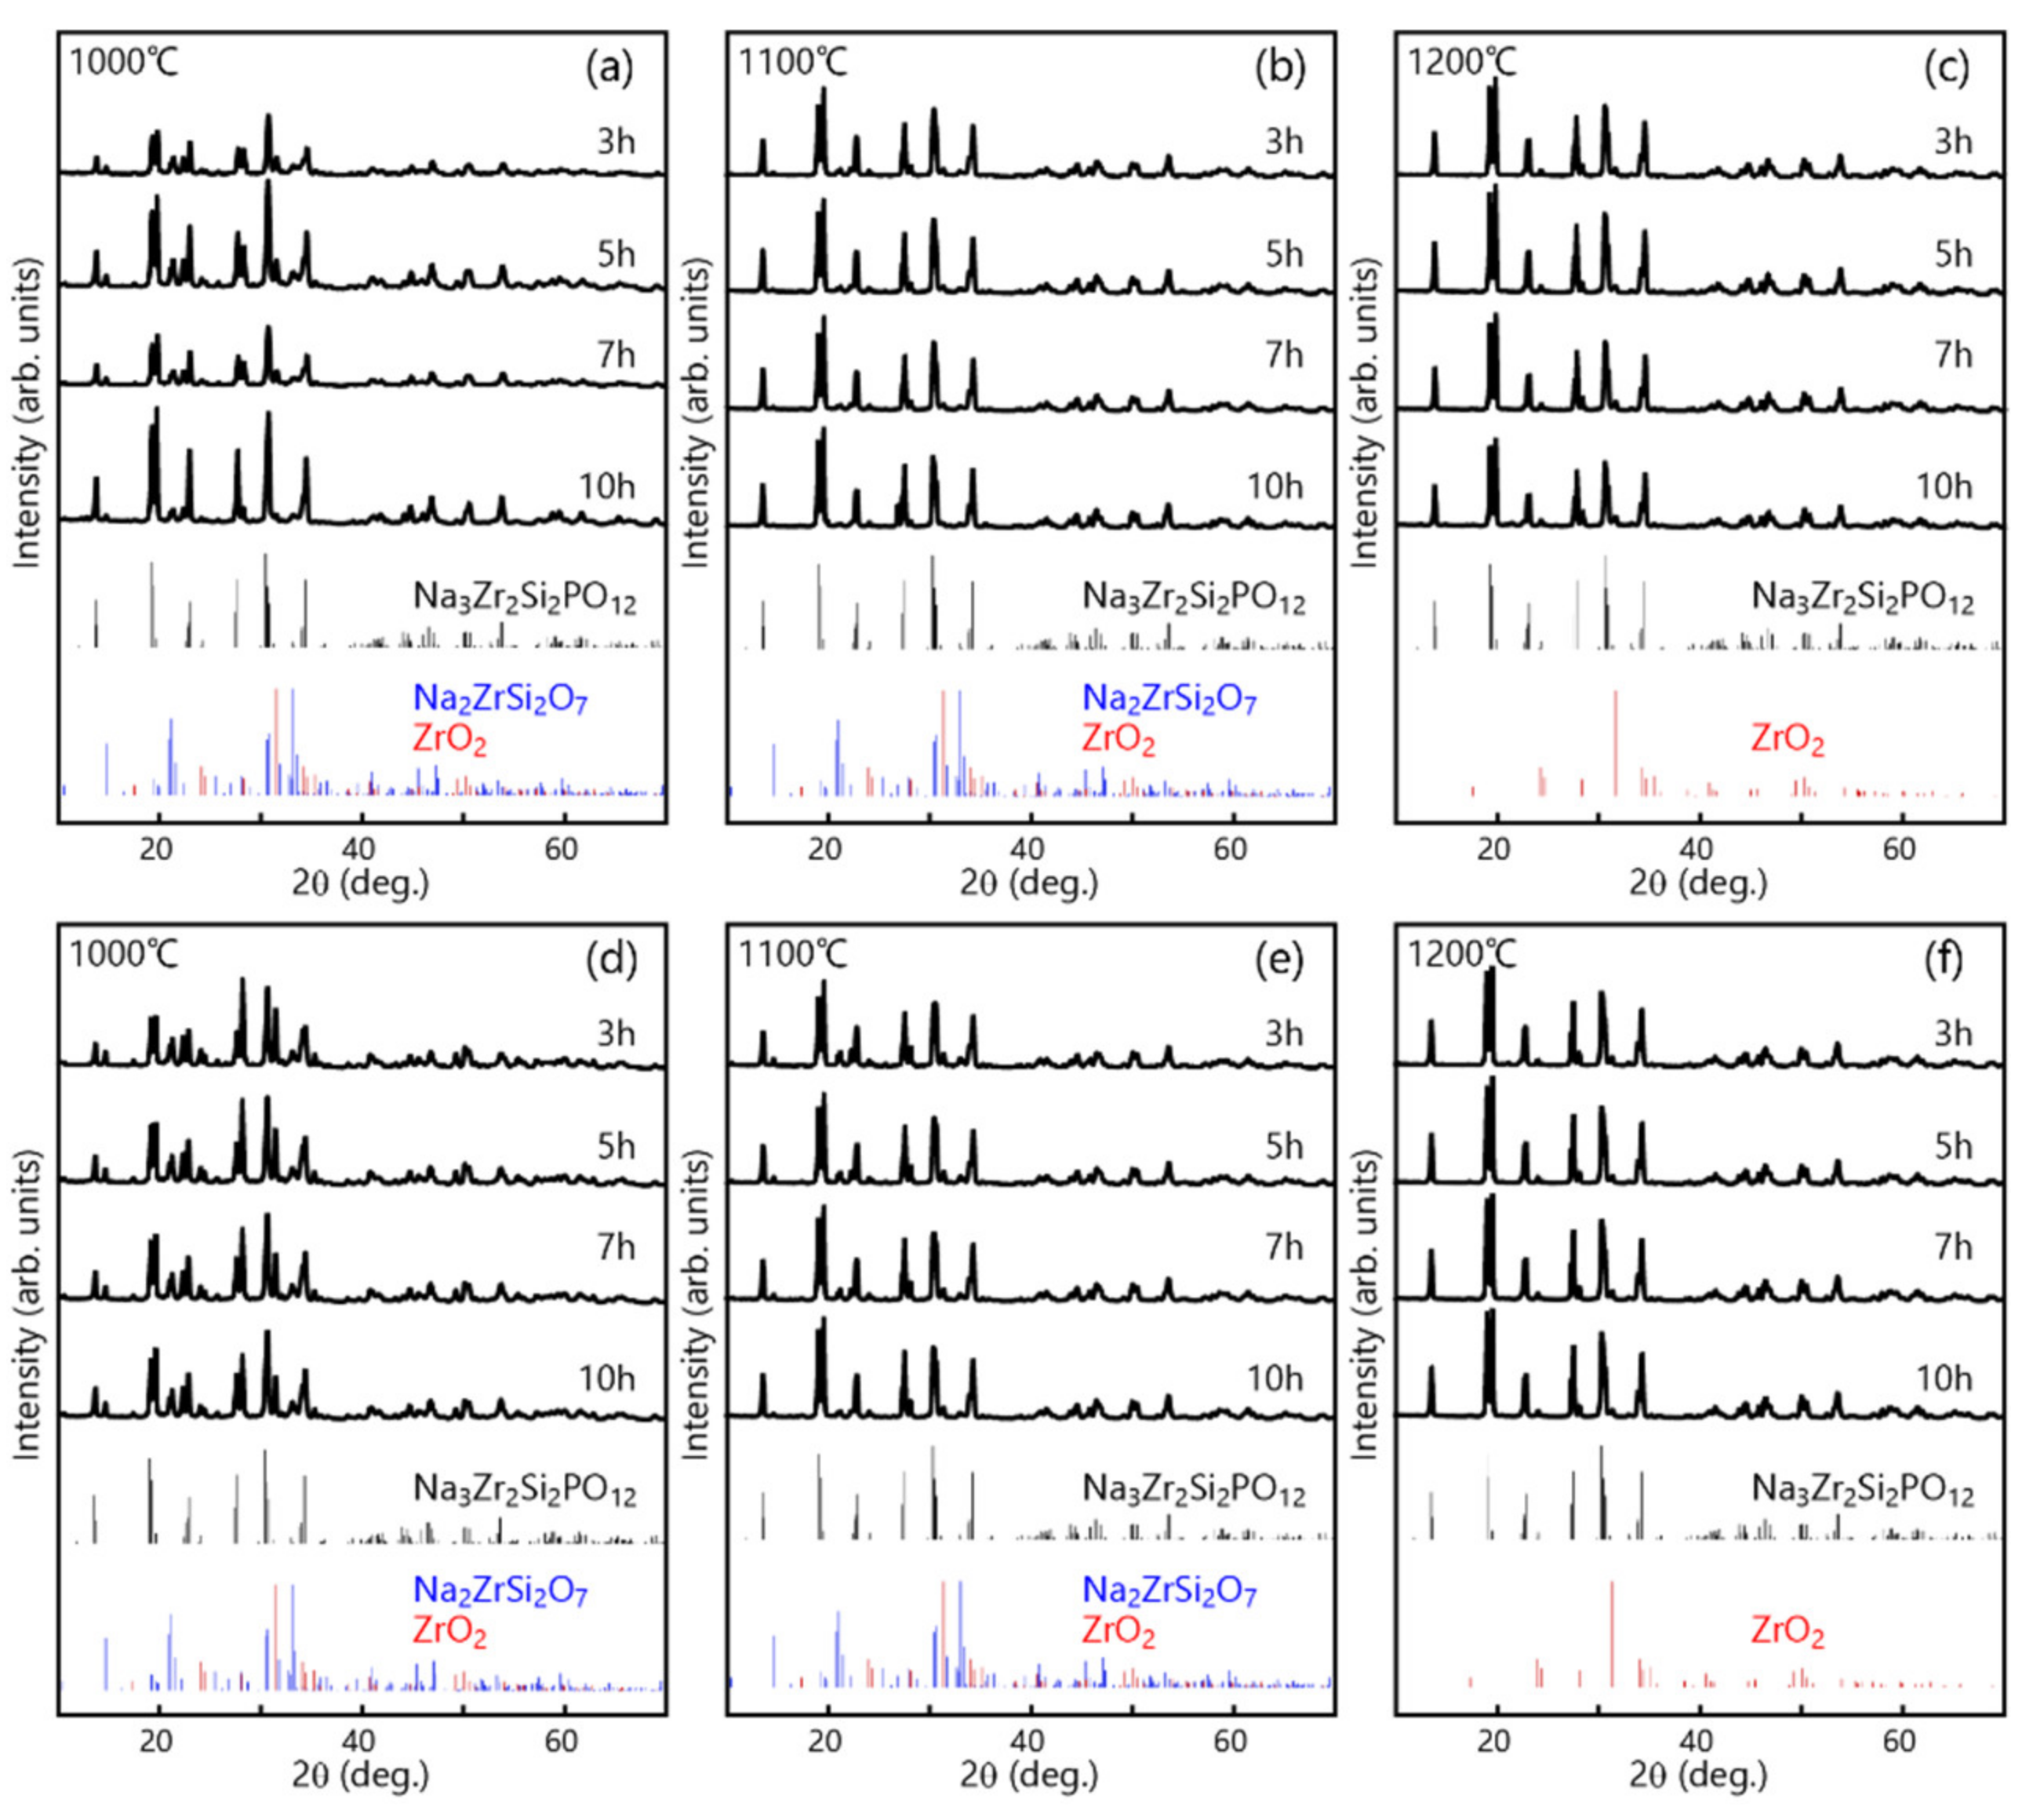
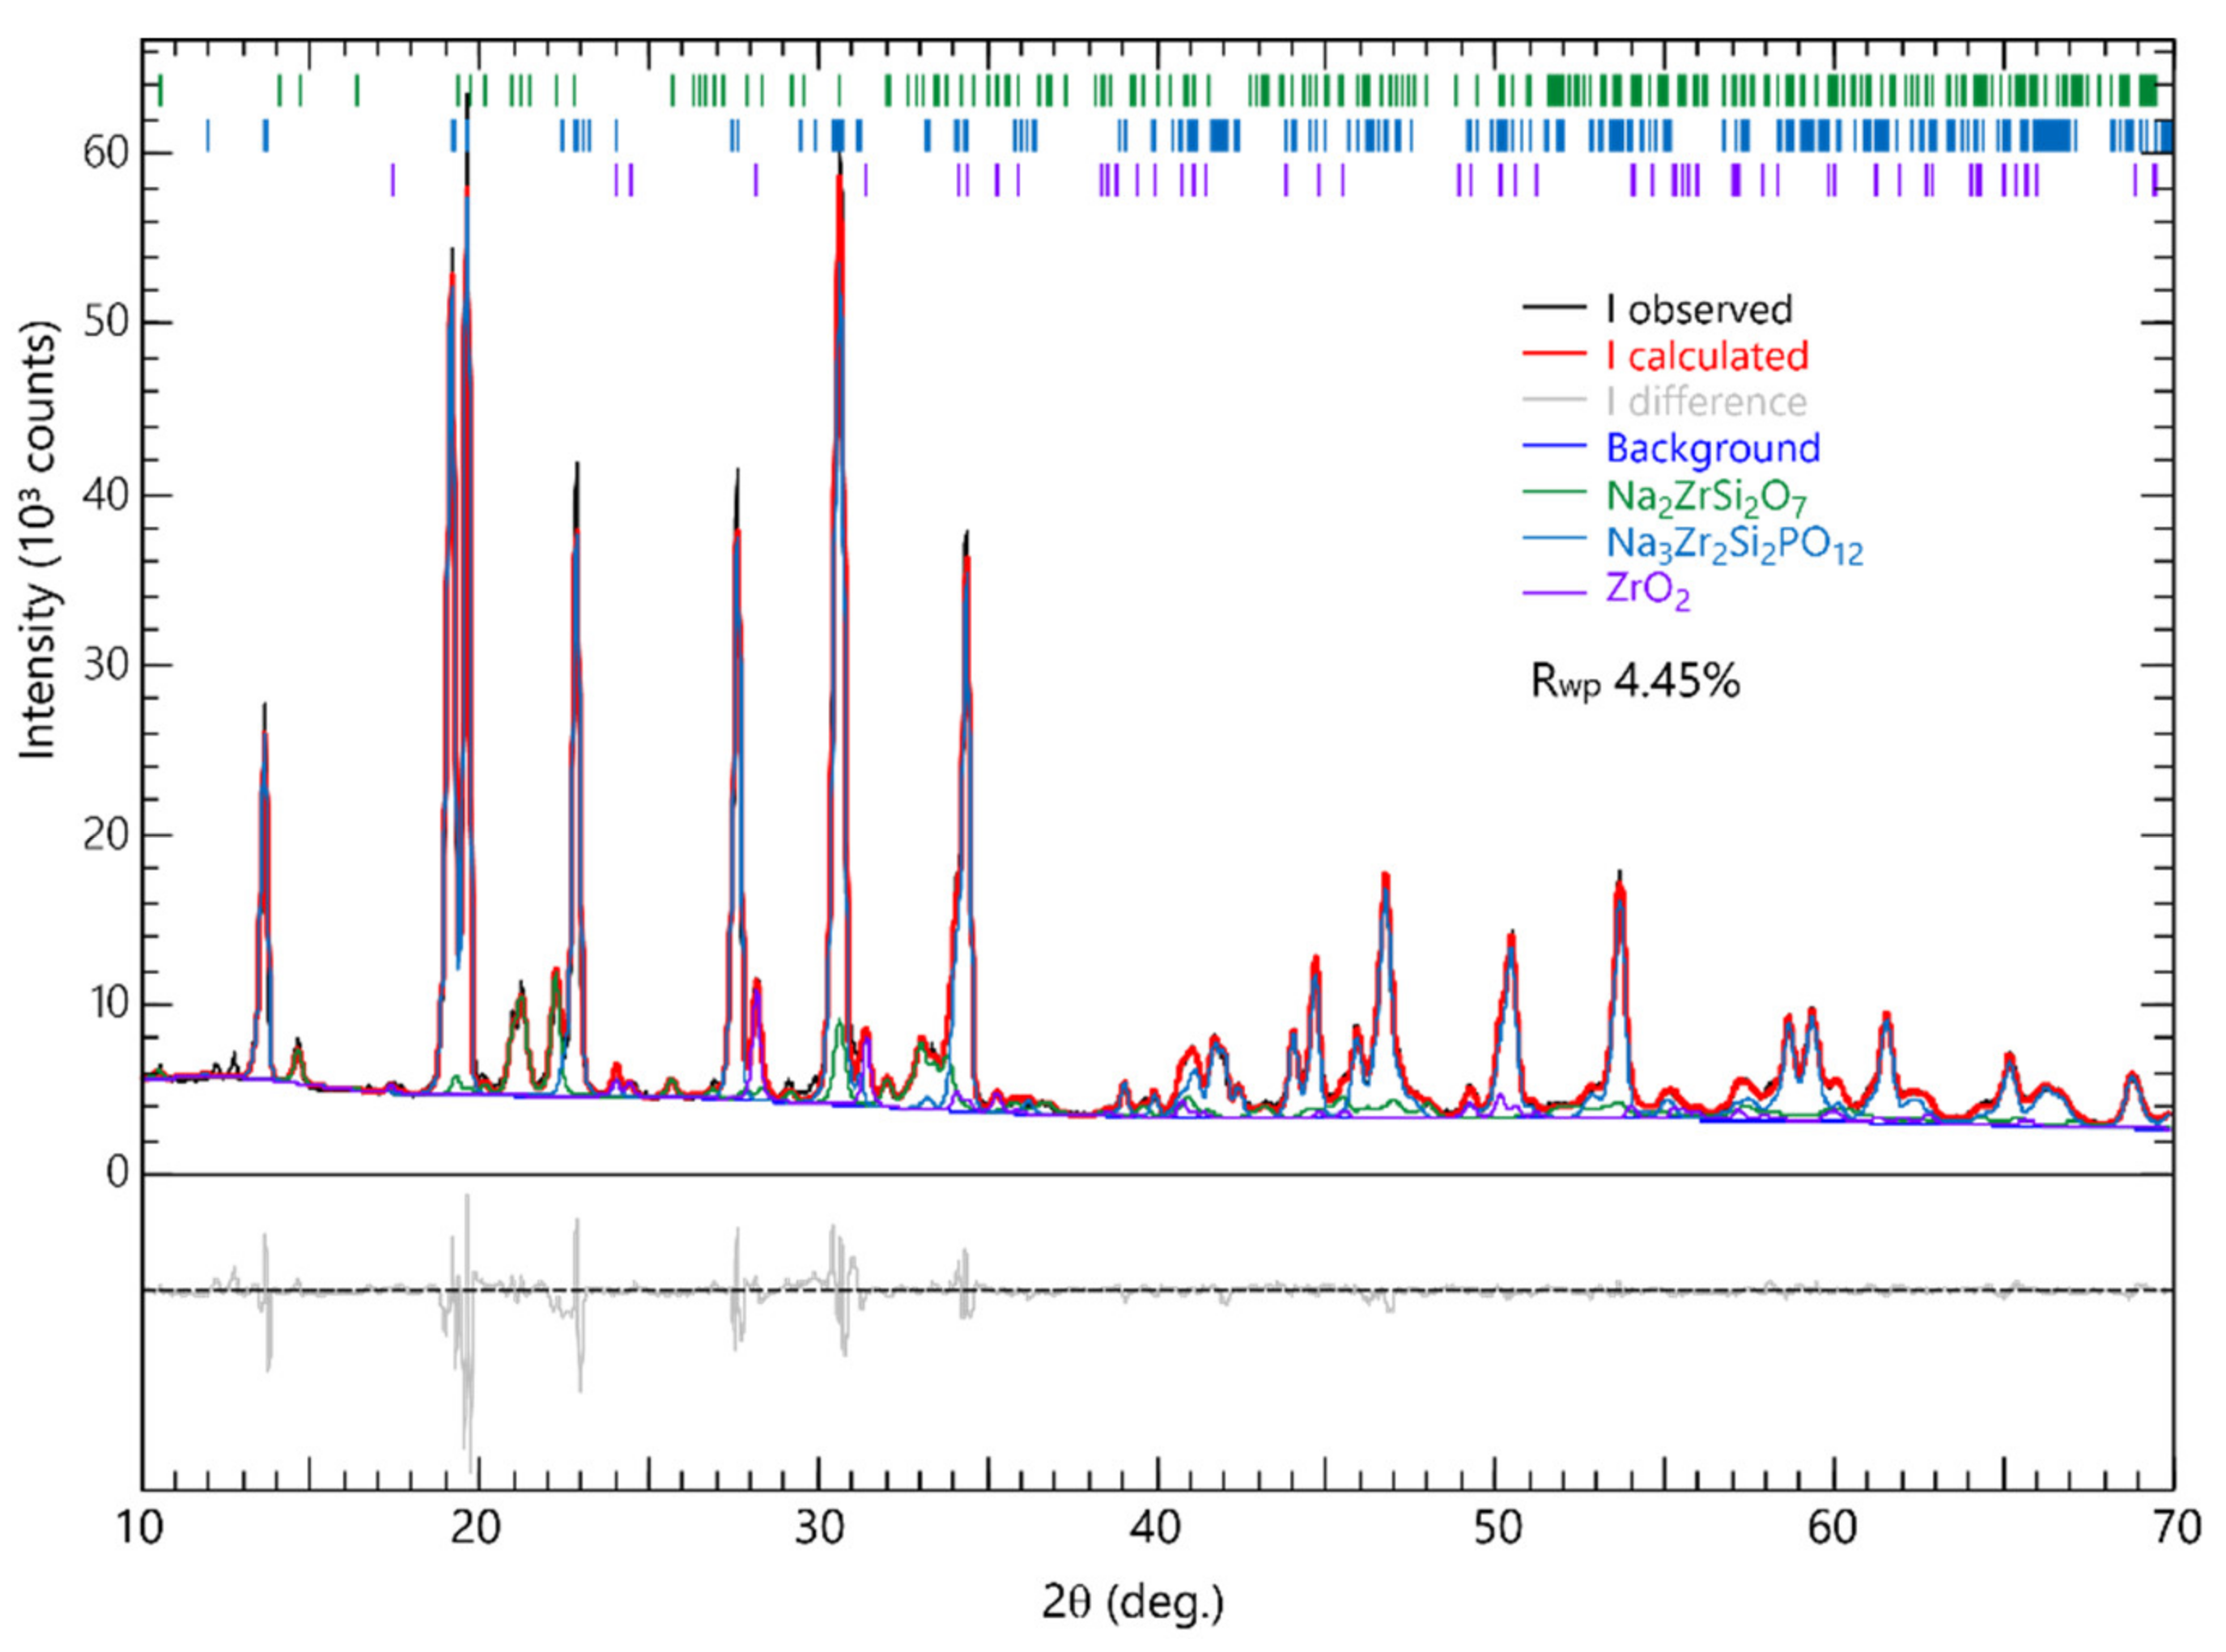
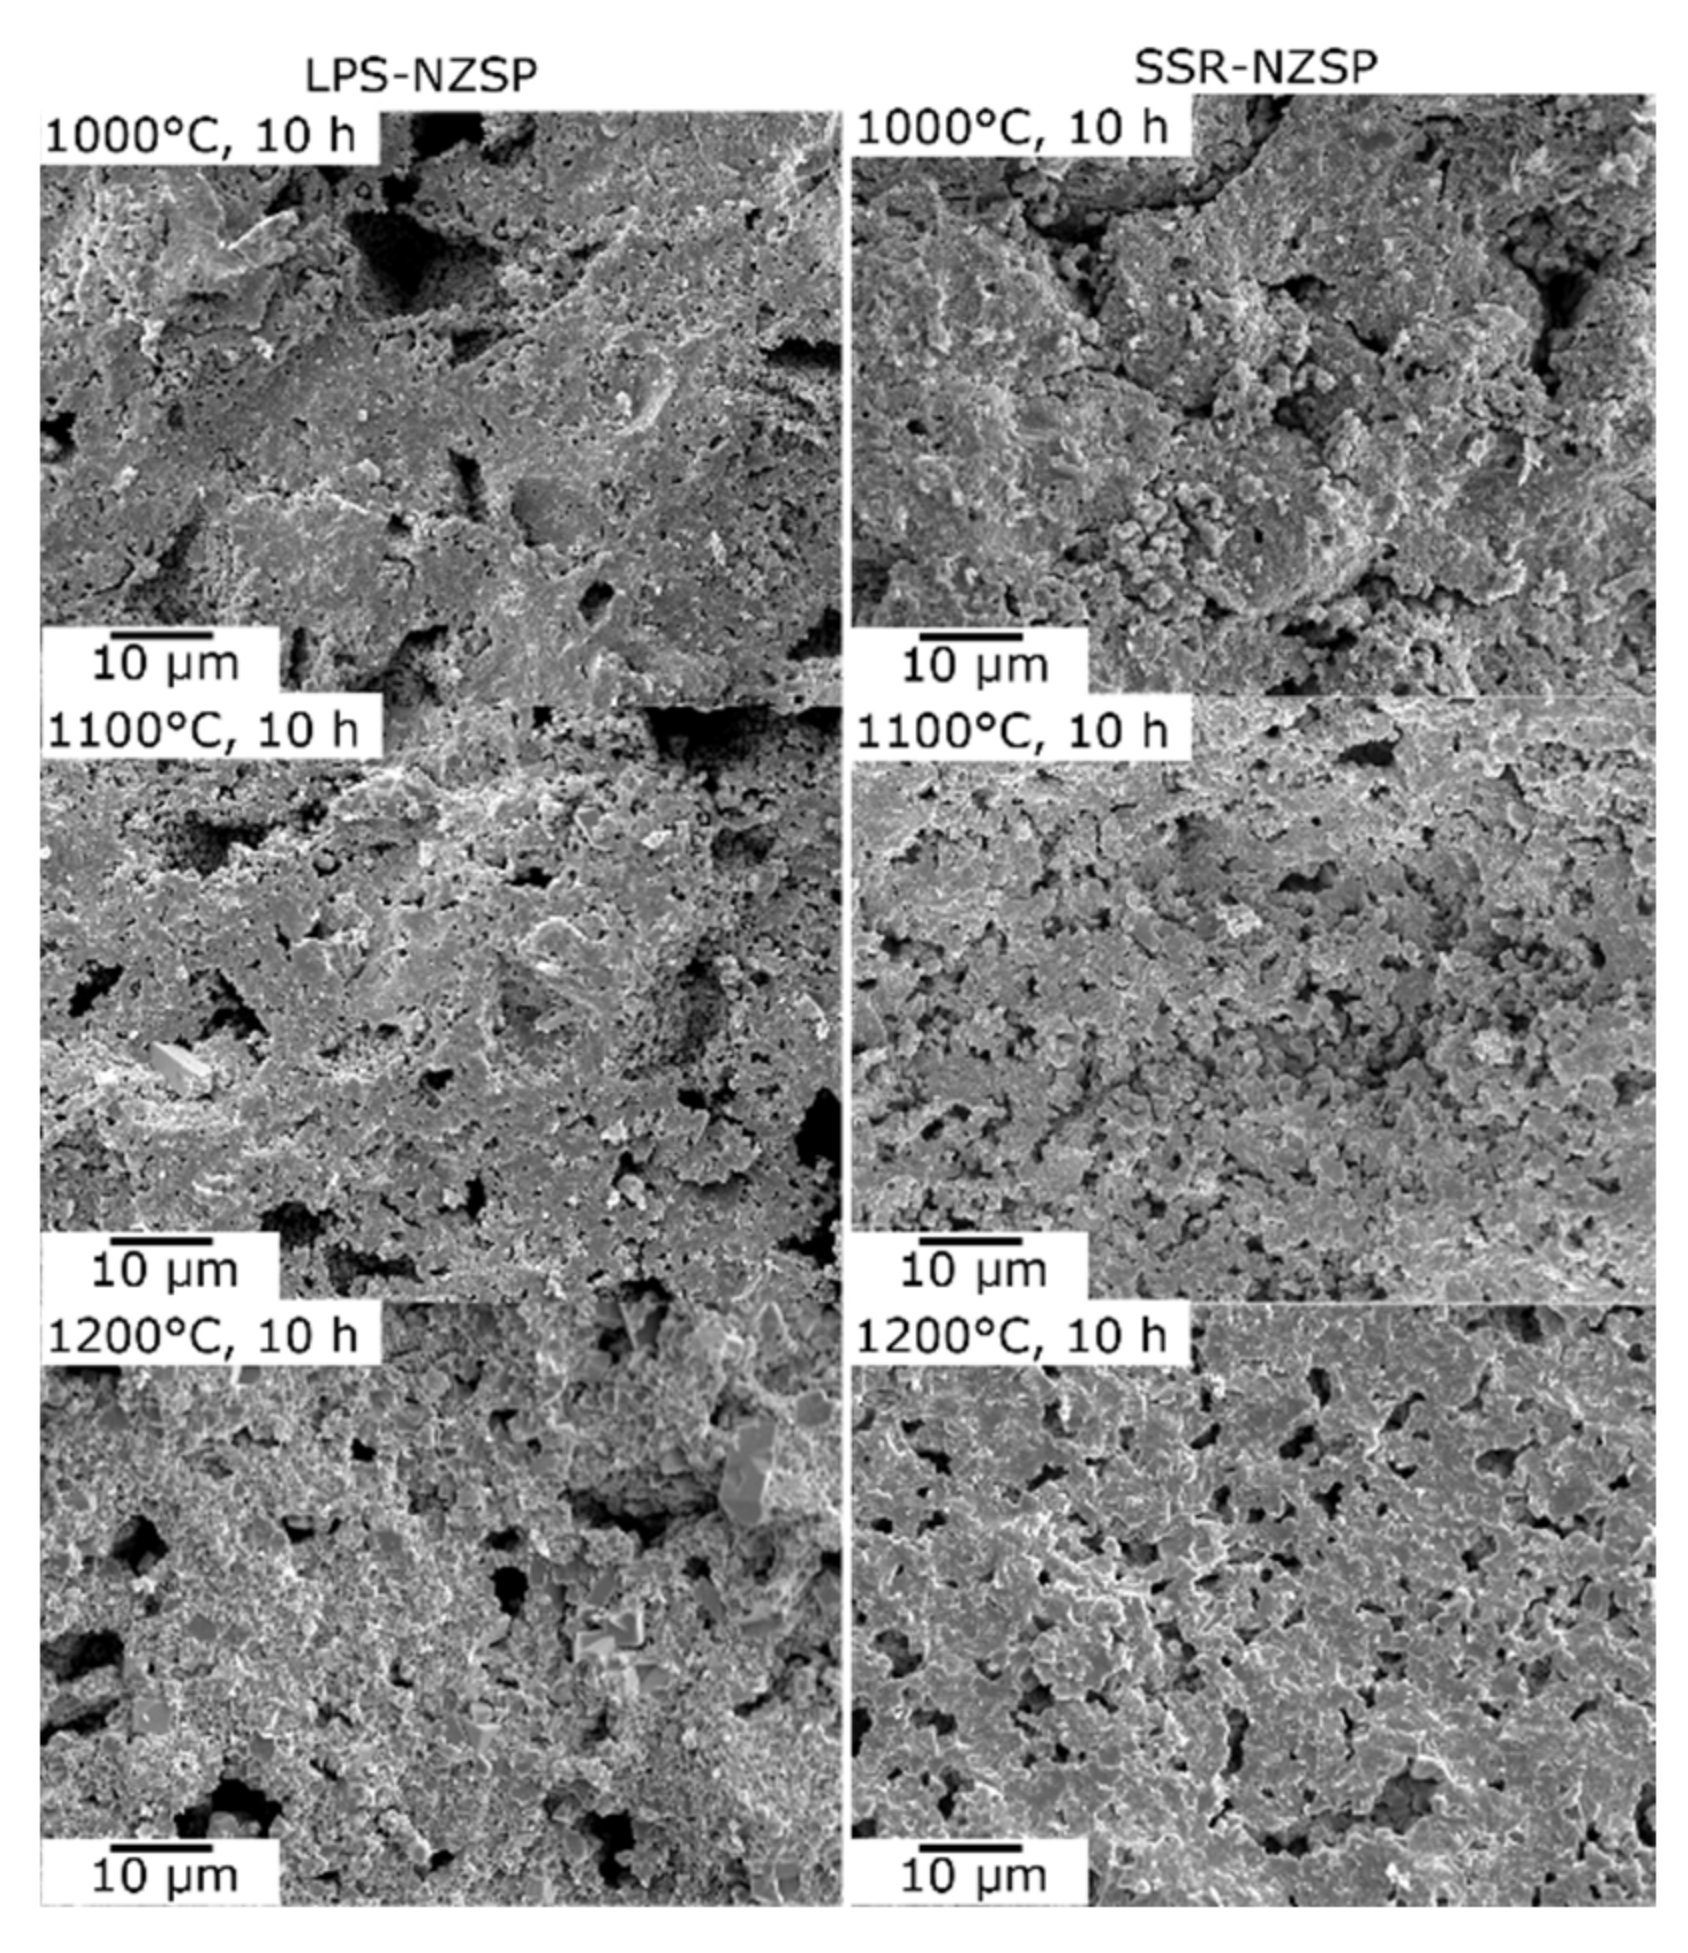
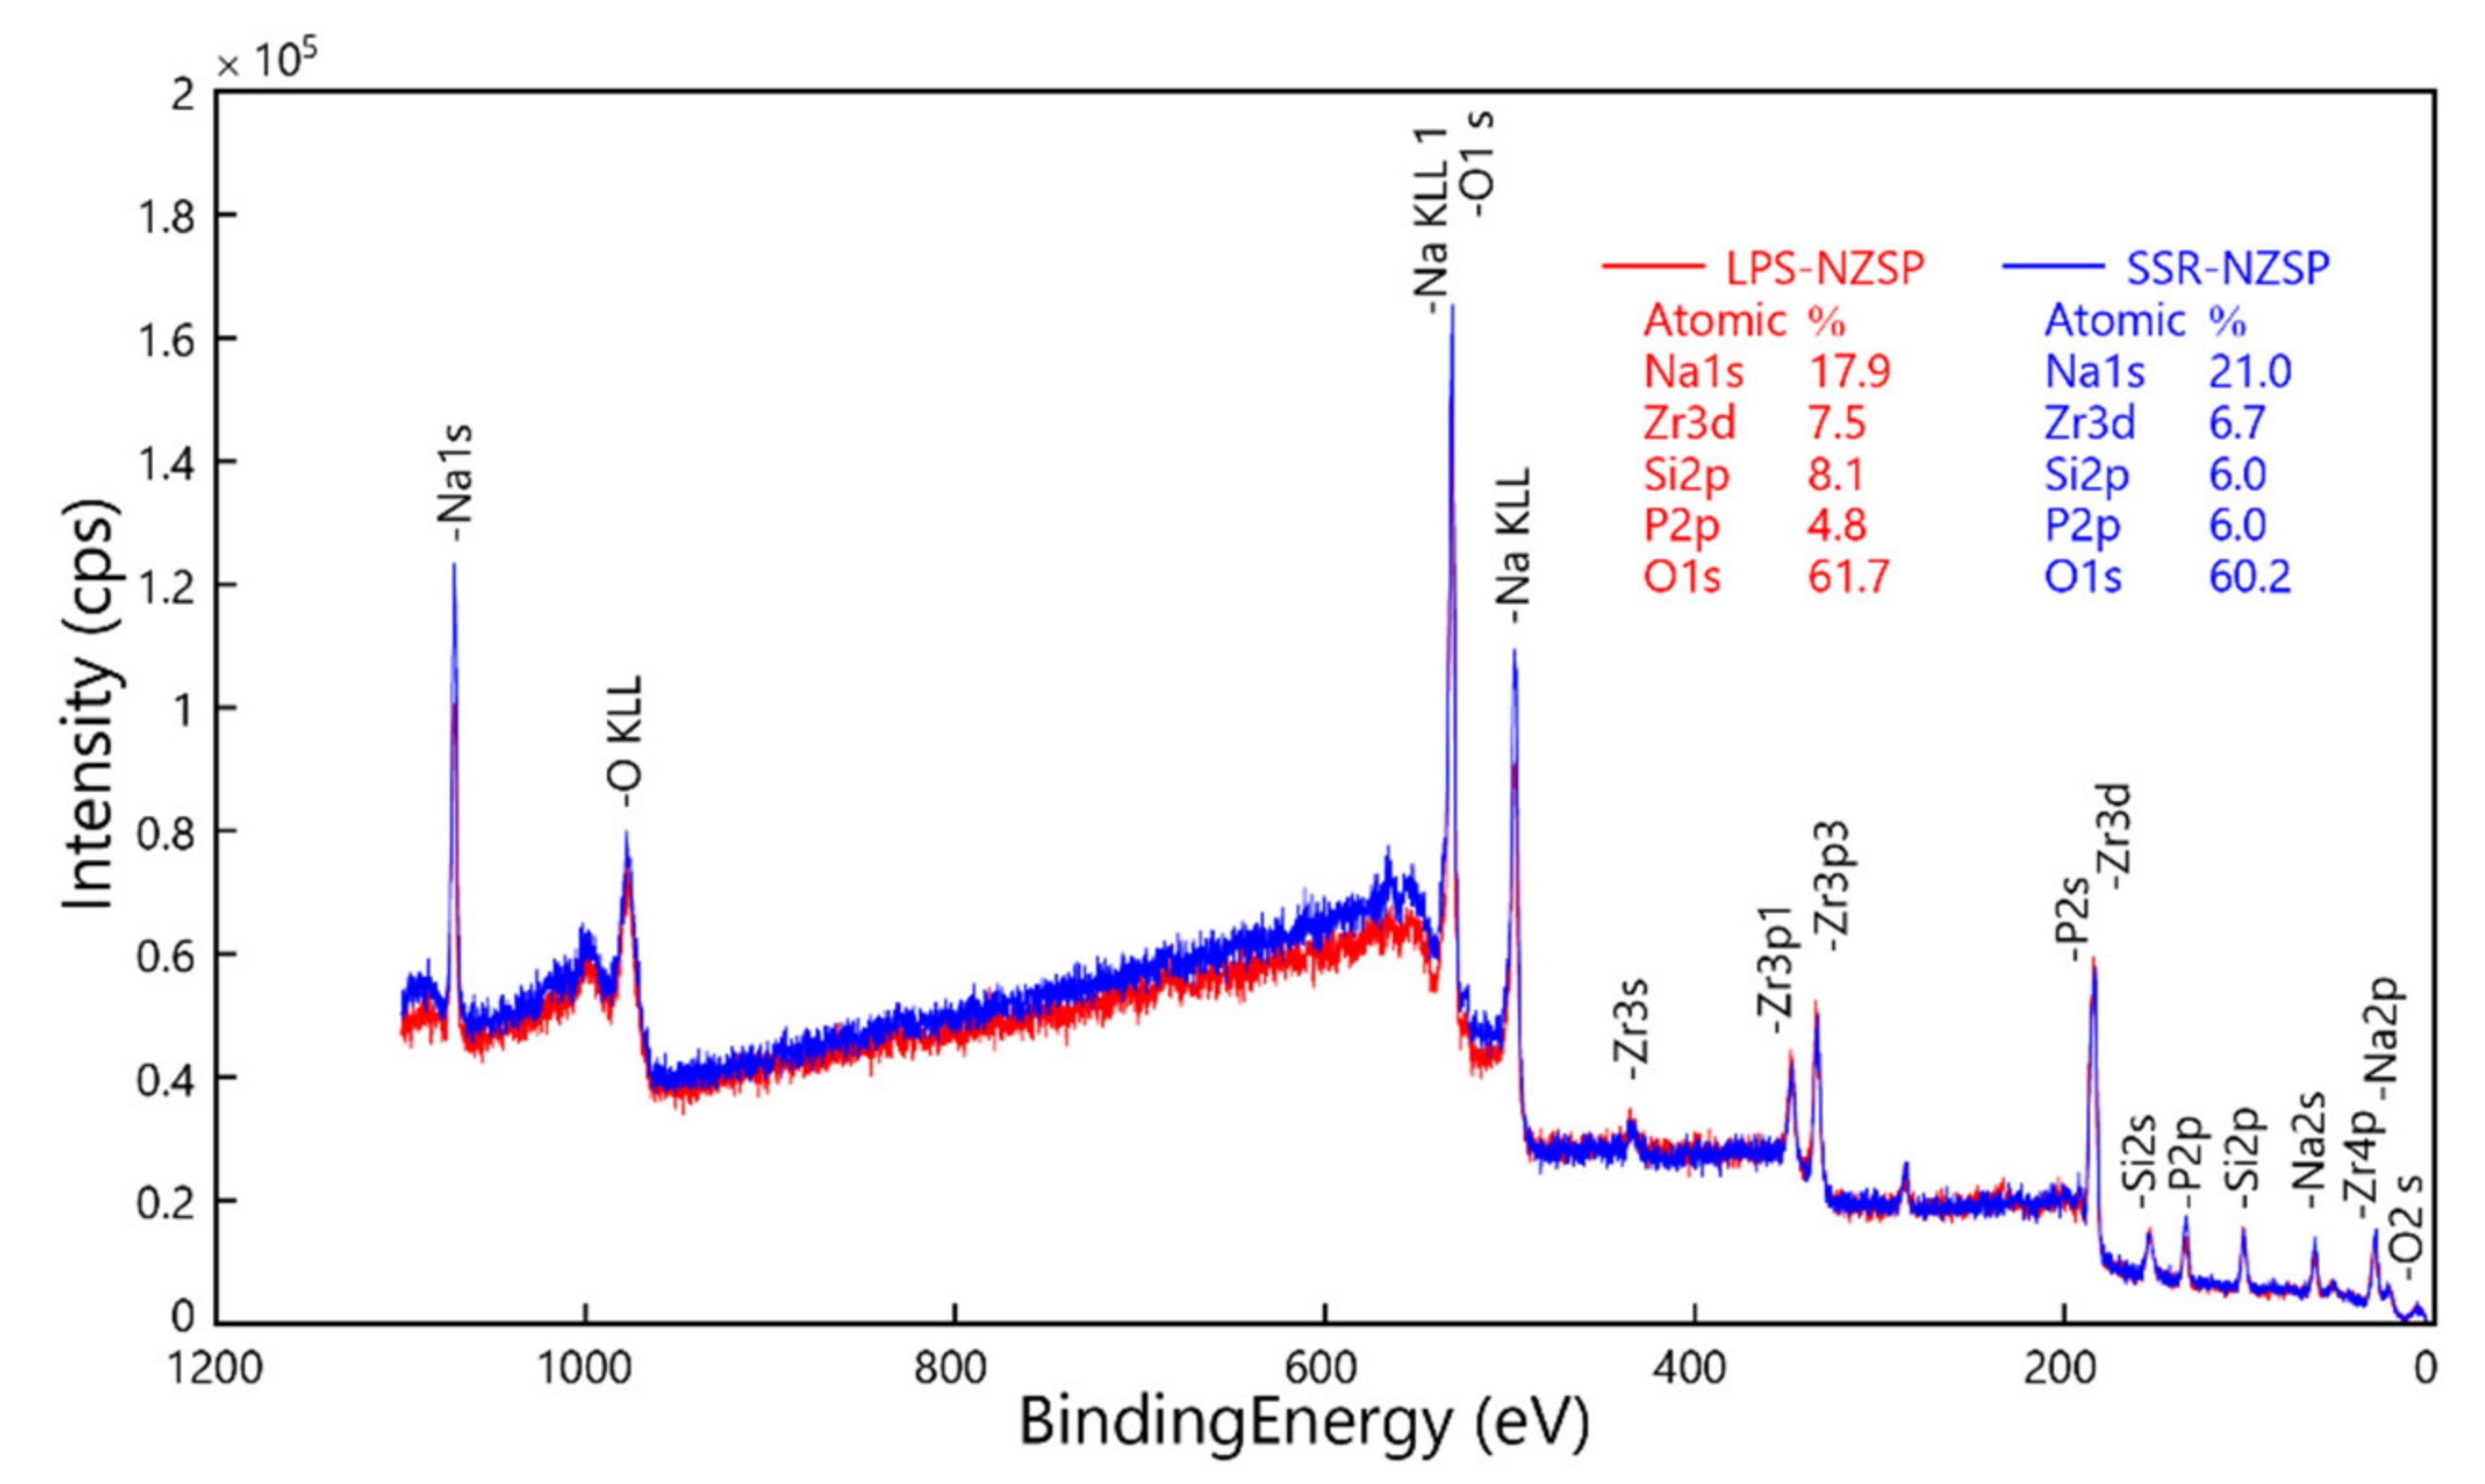
3.2. Formation and Microstructure of Na3Zr2Si2PO12

The XRD patterns at room temperature for the LPS-NZSP samples obtained by sintering at different temperatures (1000, 1100, and 1200 °C) and times (3–10 h) are shown in Figure 2. It is seen that the intensity of the peaks corresponding to the crystalline NZSP (Na3Zr2Si2PO12) phase increases with increasing temperature and time. The samples sintered at 1000 °C and 1200 °C for 10 h consist of mainly NZSP, although the presence of Na2ZrSi2O7 and ZrO2 phases is still detected. The results shown in Figure 2 indicate that reactions among Na2ZrSi2O7, ZrO2, and NaPO3 glass leading to the formation of NZSP is taking place effectively. Figure 2d–f shows the XRD patterns of the SSR-NZSP. Under each sintering condition, NZSP was crystallized as the main phase. However, ZrO2 impurities were also obtained from every case. Both the samples sintered at 1000 °C and 1100 °C showed that the raw material Na2ZrSi2O7 still remained, suggesting that the solid-state reaction proceeded incompletely. When the sintering temperature rose to 1200 °C, the crystallization peak of Na2ZrSi2O7 disappeared, indicating that the solid phases had reacted completely. Therefore, 1200 °C was considered to be the optimum temperature for the solid-state reaction.
The refined XRD pattern of the LPS-NZSP calcined at 1000 °C for 10 h shows in Figure 3. The content of the NZSP, Na2ZrSi2O7, and ZrO2 were analyzed by PROFEX and the result shows in Figure 4. The fitting was successfully converged with Rwp = 4.45%. We also listed the refined lattice parameters of LPS-NZSP in Table 1. The crystallite size were all above 100 nm, so there does not seem to be any significant change in crystallinity. With the calcination temperature increased, the content of the NZSP increased simultaneously, and the content of ZrO2 decreased Correspondingly. Notablely, the LPS-NZSP calcined at 1000 °C for 10 h showed the content of ZrO2 (6%) was on a sharp decrease, and the content of NZSP (74%) increased rapidly. Compared to the SSR-NZSP calcined at 1000 °C for 10 h with the content of ZrO2 (15%) and NZSP (57%), LPS-NZSP preferred a superiority. It indicated that NaPO3 glass as the additive did work on promoting the solid-state reaction at a lower temperature. Moreover, the decrease of the ZrO2 will be hoped to increase the ionic conductivity.
Figure 5 shows the change curves of bulk density and relative density of the calcined LPS-NZSP. For the same calcination time (3, 5, and 7 h), the bulk density and relative density decreased with the calcination temperature increasing. However, 10 h showed a converse trend that the bulk density and relative density increased with the calcination temperature increasing. It can be inferred that the form of the porosity is owing to the proceed of liquid-phase sintering. In a short sintering time, the liquid-phase sintering with a higher sinter temperature proceed faster and it will be more porosity to lead to the bulk densities decrease. However, in an enough sintering time, the higher sinter temperature will synthesize a denser pellet body. Therefore, the NaPO3 glass as the liquid phase is conducive to form a denser body at a lower temperature and shorter time.
The LPS-NZSP calcined for 10 h exhibited a lower activation energy was considered that NaPO3 glass reduced the grain boundary resistance. Therefore, the SEM cross-section observation of 10 h sintered body was contrasted and shown in Figure 6. From the result of the comparison, the pores of the LPS-NZSP were clearly bigger than that of the SSR-LPS. It can be owing to the escape of the moisture in the sintering process. Despite the hygroscopicity of NaPO3 glass reduced the bulk density of the composite electrolytes, the amount of the pores and the porosity also decreased clearly. Moreover, it can be observed that the grain was welded to grain compactly in the microstructure of the LPS-NZSP. This can be attributed to the softened NaPO3 glass flowed through the grain boundary to fill in the gap, reduced the grain boundary and promoted the solid-state reaction.
XPS was employed to analysis the content proportion of the elements Na, Zr, Si, P, O. The Na 1s, Zr 3d, Si 2p, P 2p and O 1s XPS spectra collected from the pellet samples of the samples. Figure 7 shows the comparison of survey XPS spectra of the samples sintered at 1000 °C for 10 h. We can observe that the sodium content proportion of the SSR-NZSP is higher than that of the LPS-NZSP. However, calculated from the ratio of Na/Si, both NZSPs exhibited that the Na is excess. It indicated that a part of Na existed in the ceramics surrounded the NZSP crystal. This will be propitious to the conductivity of sodium ion. In addition, calculated from the ratio of Si/P, we can find that the value of the SSR-NZSP was smaller than that of the LPS-NZSP. It means that more excess phosphate existed in the SSR-NZSP and this obviously will block the conduction of Na ion. From this perspective, in the sintering condition of 1000 °C for 10 h, the activation energy of the LPS-NZSP is lower than that of the SSR-NZSP will be explained.

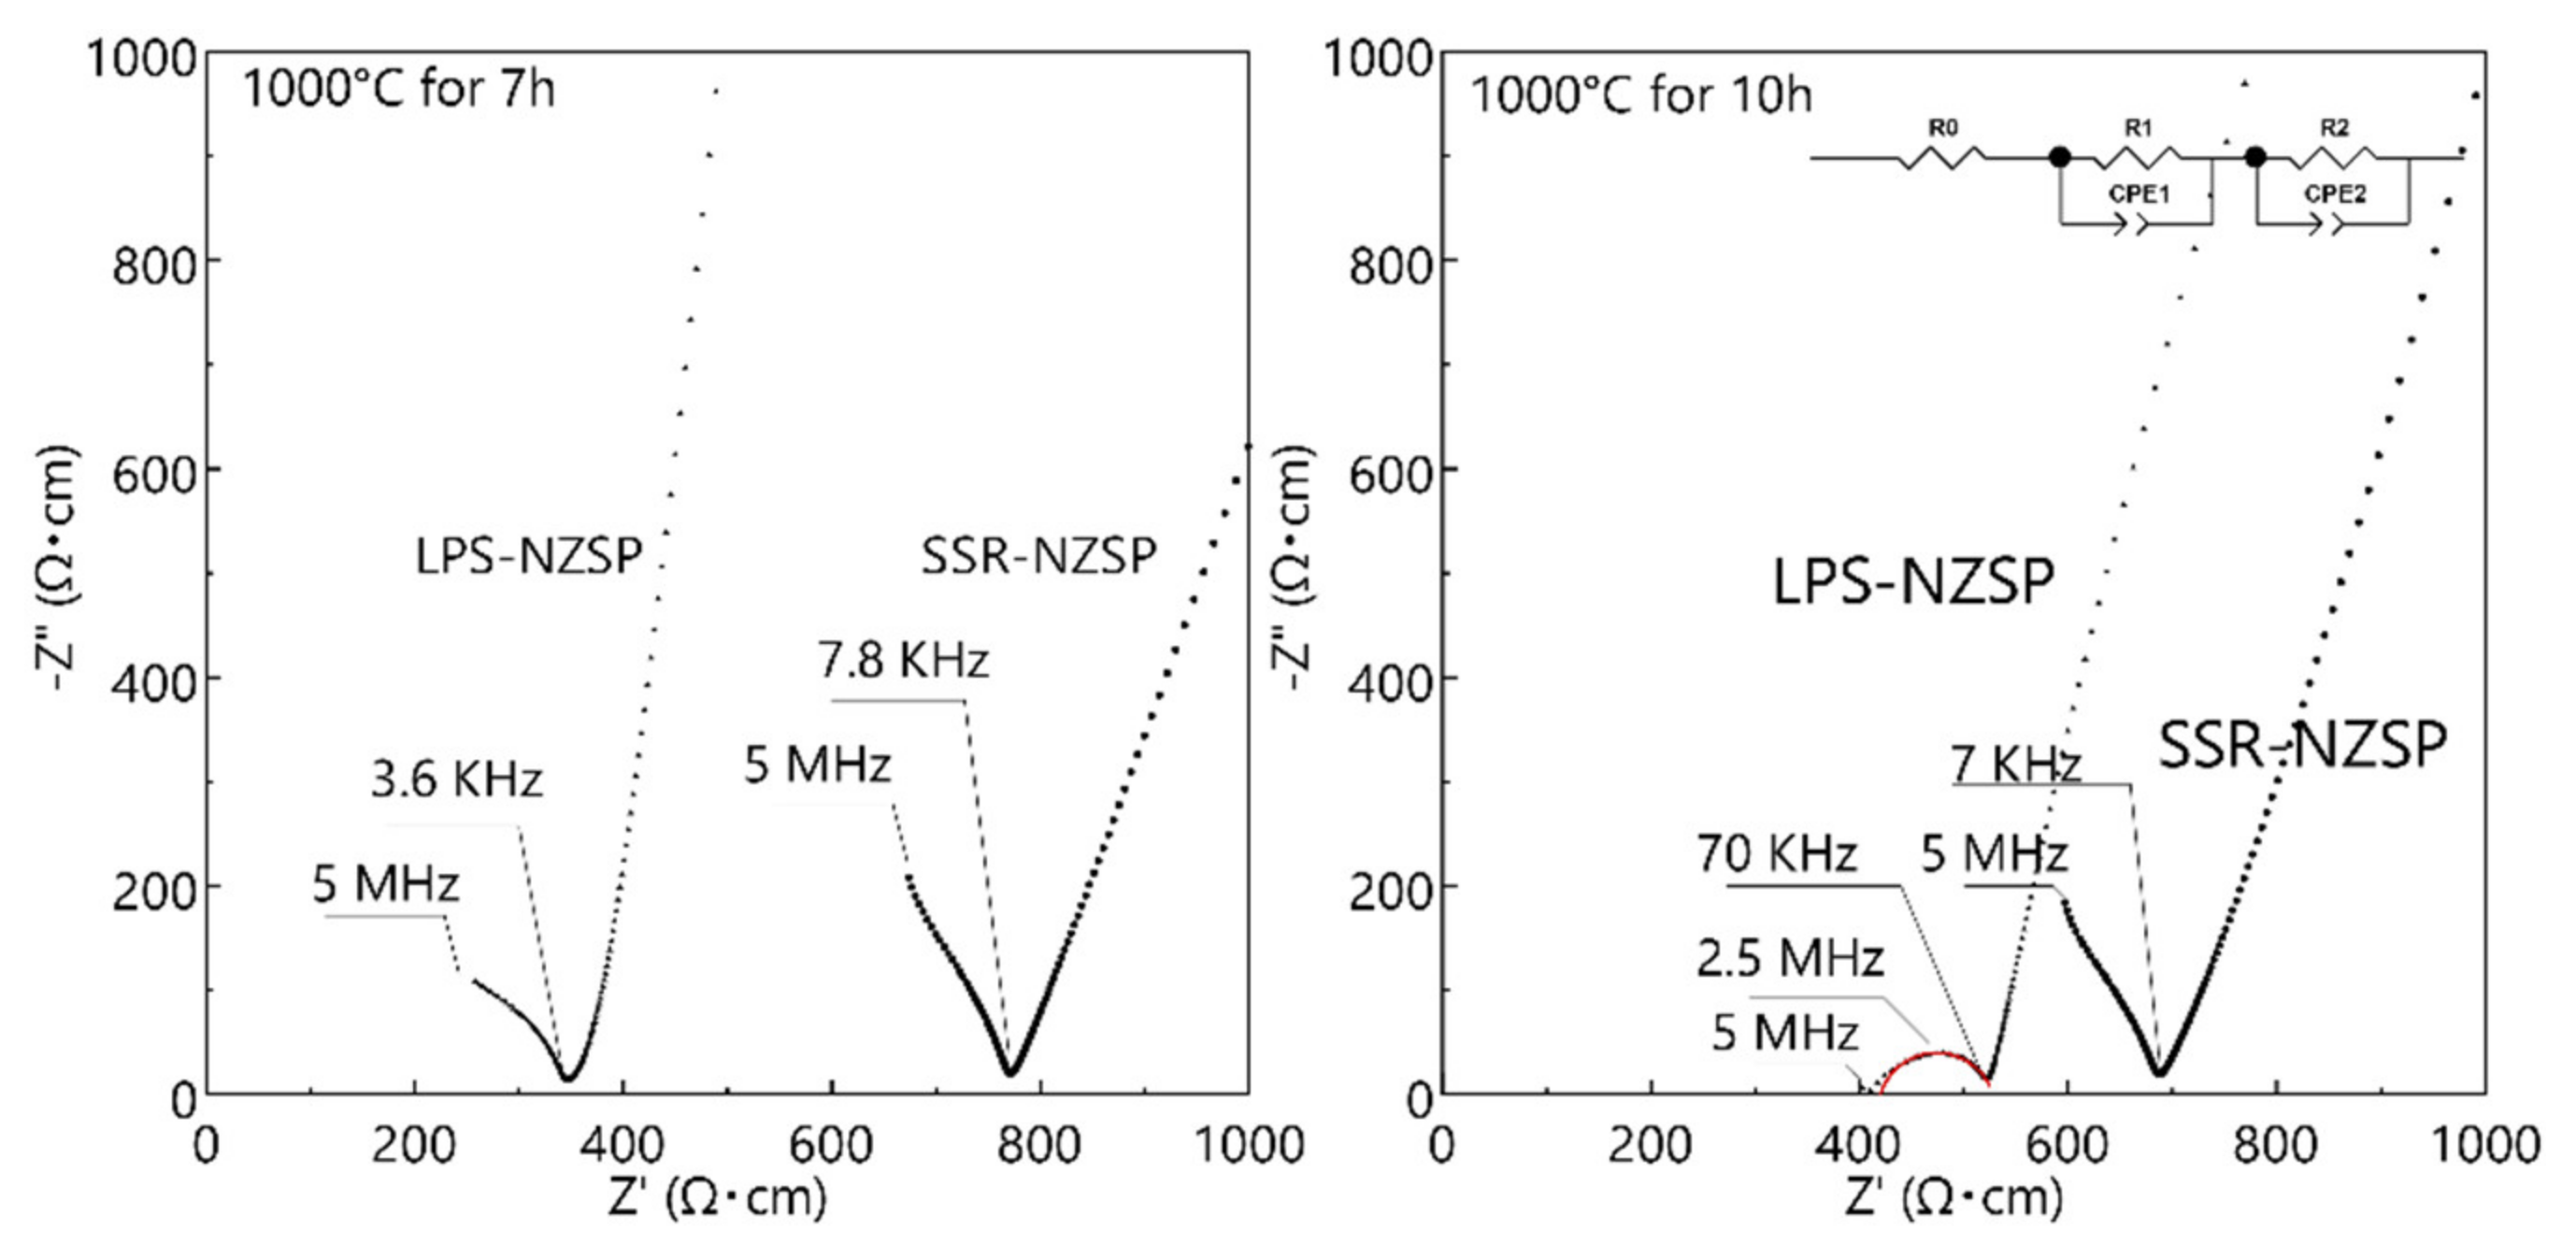
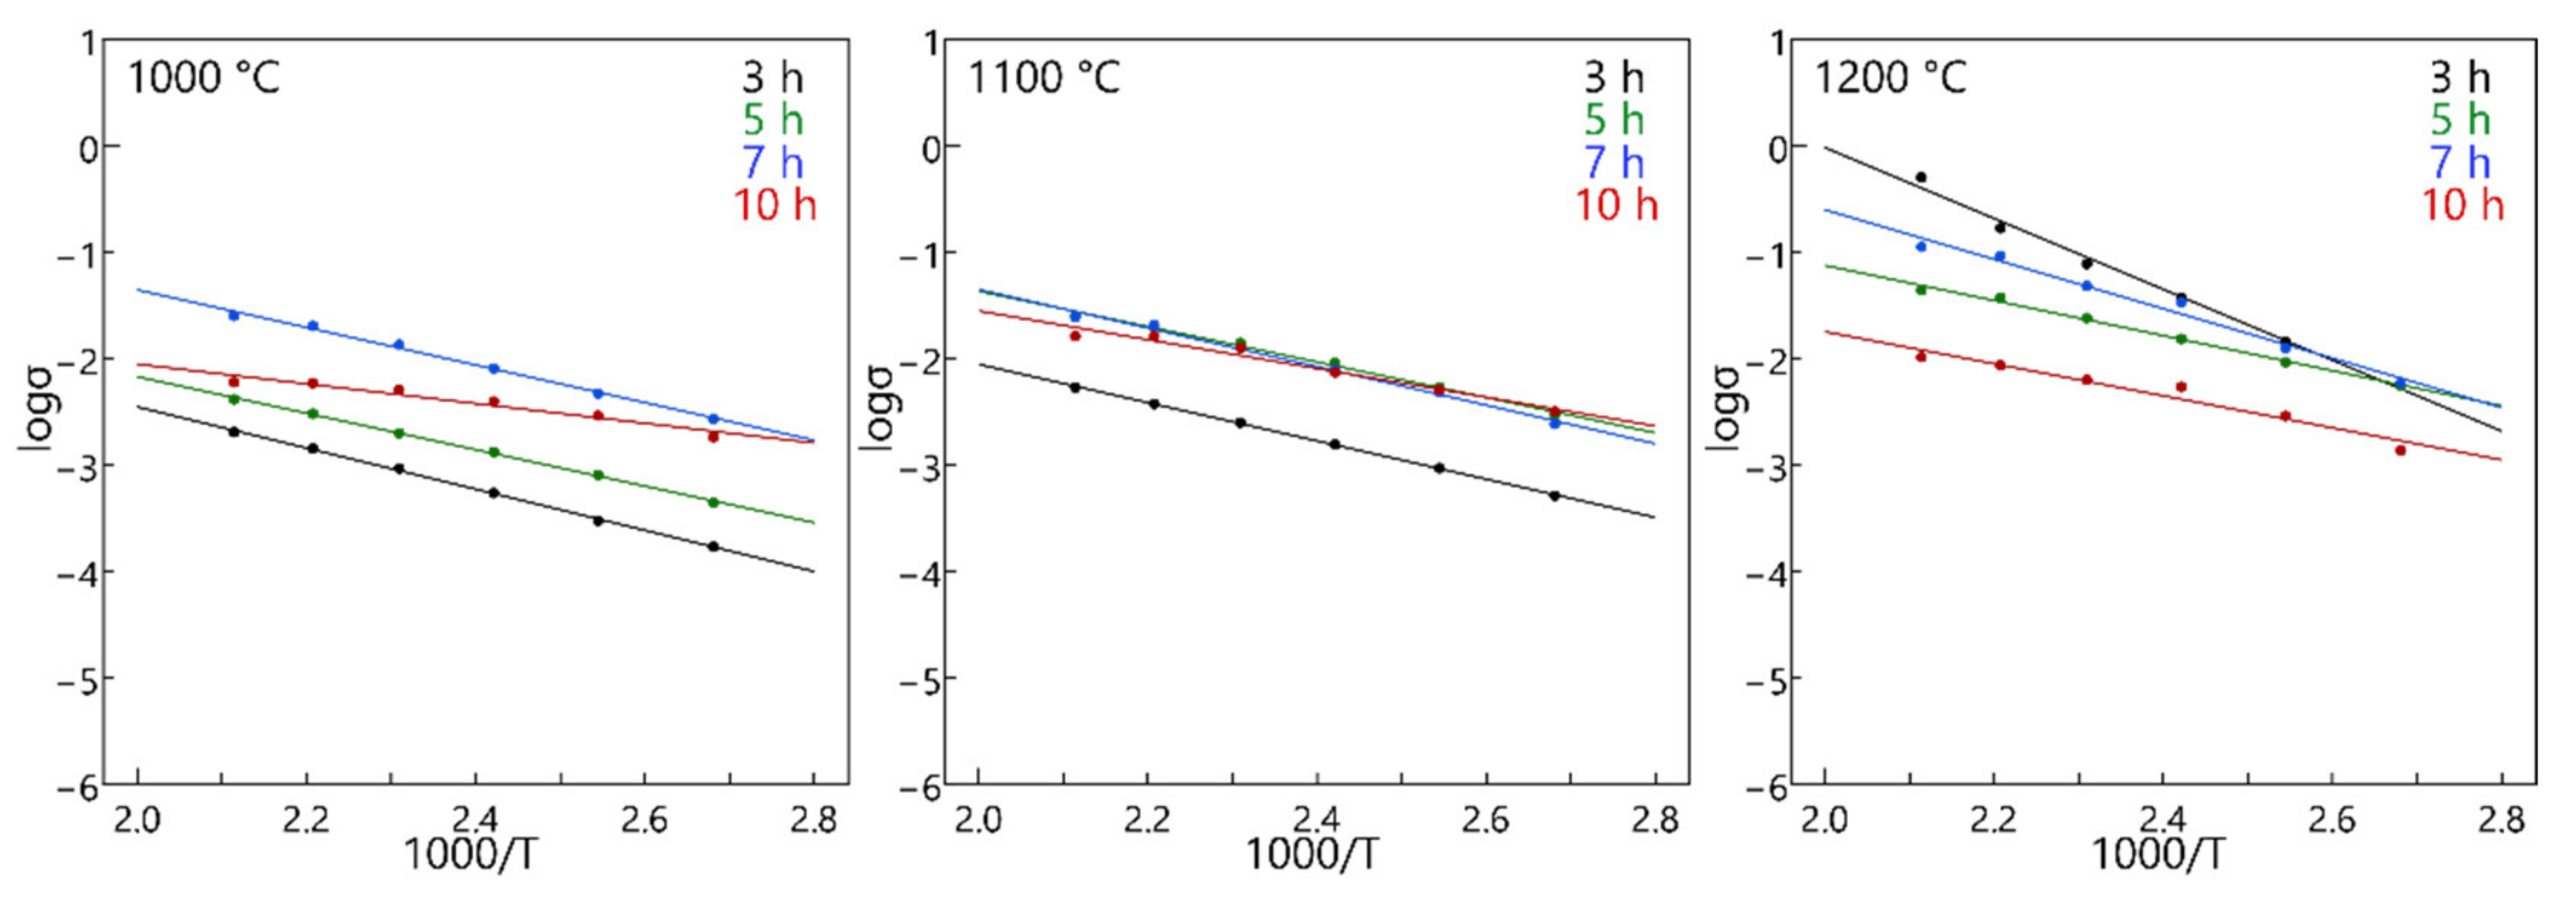
3.3. Electrical Conductivity

Figure 8 shows the Nyquist plots for the ionic conductivities of the samples measured from 100 °C to 200 °C. By means of comparing the ionic conductivities between the two kinds of electrolytes under 100 °C, we found that the ionic conductivity of the LPS-NZSP is higher than that of the sample by SSR-NZSP in the sintering condition of 1000 °C for 7 h and 1000 °C for 10 h. Only the LPS-NZSP calcined of 1000 °C for 10 h shows the one semi-circle (108 Ωcm) according to the grain boundary but the other spectra did not show semi-circles. We decided to determine the ionic conductivity from the sum of the resistances of the bulk and grain boundaries. It indicated that use the feature of low melting point of NaPO3 glass will improve the process of solid-state reaction under a relatively lower sintering temperature and a longer sintering time.
Arrhenius plot of ionic conductivities of the LPS-NZSP are showed in Figure 9. It shows clearly that the ionic conductivities will increase with the sintering temperature going up. However, the ionic conductivities of the LPS-NZSP calcined for 10 h did not exhibit a superiority with the sintering temperature increasing. It means that the LPS-NZSP calcined at 1000 °C for 10 h showed the same ionic transport ability against the 1100 °C for 10 h and 1200 °C 10 h. This could be also attributable to the NaPO3 glass.
To analyze the role of the NaPO3 glass, activation energies were calculated via Arrhenius equation based on the fitting slope of Arrhenius plots. Figure 10 shows that the activation energies will increase with the increase of sintering temperature. In addition, though the LPS-NZSP calcined at 1000 °C and 1100 °C showed a near activation energy, the LPS-NZSP calcined at 1000 °C for 10 h exhibited a preponderant low activation energy 0.18 eV, which is 62% lower than the SSR-NZSP 0.29 eV. It indicated that the NaPO3 glass will work in reducing the grain barrier in a quite long sintering time and low sintering temperature. On the other side, the sintering time is longer, NaPO3 glass will flow and diffuse sufficiently. For this reason, the longest sintering time 10 h showed the lowest activation energy in the different sintering time.
The ceramics sintered at 1000 °C showed favorable electrical conductivity despite the residual Na2ZrSi2O7. The absence of ZrO2, which does not contribute to the conductivity of sodium ions, is one of the reasons for the improvement in electrical conductivity, but the presence of Na2ZrSi2O7 should be noted. In the crystal structure of Na2ZrSi2O7, there is a large space that can contain water molecules [40,41,42]. It is curious that the ionic conductivity of Na2ZrSi2O7 has not been evaluated so far, but the results of this study strongly suggest that Na2ZrSi2O7 as well as the NZSP phase contribute to the sodium ion conductivity.

4. Conclusions

We synthesized the Na3Zr2Si2PO12 ceramics by adding the NaPO3 glass successfully. The LPS-NZSP calcined at 1000 °C for 10 h showed a great superiority to synthesize the NZSP. Owing to the hygroscopic of the NaPO3 glass, the pores formed in the sintering process of the LPS-NZSP can be observed bigger than that of the samples by SSR. Under the condition of 1000 °C for 10 h, the LPS-NZSP showed the same ionic transport ability against the 1100 °C for 10 h and 1200 °C for 10 h. Furthermore, the LPS-NZSP calcined at 1000 °C for 10 h exhibited a preponderant low activation energy 0.18 eV, which is pretty lower than the SSR-NZSP. This indicated that the NaPO3 glass did work on reducing the grain barrier and facilitate the solid-state reaction at the lower sintering temperature and longer sintering time. Moreover, in the sintering at 1000 °C for 10 h, the LPS-NZSP showed the ratio of Si/P is closer to the composition Na3Zr2Si2PO12. In summary, the NaPO3 glass as the additive to synthesis the NASICON-type Na3Zr2Si2PO12 can lower the sintering temperature, improve the solid-state reaction and reduce the grain barrier. It can be expected to be an advantageous synthesis method for the solid oxide electrolyte.

Author Contributions

T.H. and T.K. conceived the idea and designed the research. Y.J. prepared the samples and did all the characterization. All authors analyzed the results and commented on the paper. All authors wrote the paper. All authors have read and agreed to the published version of the manuscript.

Funding

This study has received funding from Nagaoka University of Technology (NUT) presidential research grant, the research corroboration project to develop high performance secondary battery materials between NUT and Nippon Electric Glass Co. Ltd., and the KAKENHI (Grant Numbers 19K22046 and 19H02428) from the Japan Society for the Promotion of Science (JSPS). This work was partly supported by the JSPS WISE Program (Doctoral Program for World-leading Innovative & Smart Education) from JSPS (JSPS).

Data Availability Statement

The data that support the findings of this study are available from the corresponding author, T.H., upon reasonable request.

Conflicts of Interest

The authors declare no conflict of interest.

References

  1. Takada, K. Progress and prospective of solid-state lithium batteries. Acta Mater. 2013, 61, 759–770. [Google Scholar] [CrossRef]
  2. Kato, Y.; Hori, S.; Saito, T.; Suzuki, K.; Hirayama, M.; Mitsui, A.; Yonemura, M.; Iba, H.; Kanno, R. High-power all-solid-state batteries using sulfide superionic conductors. Nat. Energy 2016, 1, 16030. [Google Scholar] [CrossRef]
  3. Tatsumisago, M.; Nagao, M.; Hayashi, A. Recent development of sulfide solid electrolytes and interfacial modification for all-solid-state rechargeable lithium batteries. J. Asian Ceram. Soc. 2013, 1, 17–25. [Google Scholar] [CrossRef] [Green Version]
  4. Tatsumisago, M.; Hayashi, A. Sulfide Glass-Ceramic Electrolytes for All-Solid-State Lithium and Sodium Batteries. Int. J. Appl. Glass Sci. 2014, 5, 226–235. [Google Scholar] [CrossRef]
  5. Hayashi, A.; Noi, K.; Sakuda, A.; Tatsumisago, M. Superionic glass-ceramic electrolytes for room-temperature rechargeable sodium batteries. Nat. Commun. 2012, 3, 856. [Google Scholar] [CrossRef]
  6. Lalère, F.; Leriche, J.B.; Courty, M.; Boulineau, S.; Viallet, V.; Masquelier, C.; Seznec, V. An all-solid state NASICON sodium battery operating at 200 °C. J. Power Sources 2014, 247, 975–980. [Google Scholar] [CrossRef]
  7. Lan, T.; Tsai, C.-L.; Tietz, F.; Wei, X.-K.; Heggen, M.; Dunin-Borkowski, R.E.; Wang, R.; Xiao, Y.; Ma, Q.; Guillon, O. Room-temperature all-solid-state sodium batteries with robust ceramic interface between rigid electrolyte and electrode materials. Nano Energy 2019, 65, 104040. [Google Scholar] [CrossRef]
  8. Yamauchi, H.; Ikejiri, J.; Sato, F.; Oshita, H.; Honma, T.; Komatsu, T. Pressureless all-solid-state sodium-ion battery consisting of sodium iron pyrophosphate glass-ceramic cathode and β″-alumina solid electrolyte composite. J. Am. Ceram. Soc. 2019, 102, 6658–6667. [Google Scholar] [CrossRef]
  9. Yamauchi, H.; Ikejiri, J.; Tsunoda, K.; Tanaka, A.; Sato, F.; Honma, T.; Komatsu, T. Enhanced rate capabilities in a glass-ceramic-derived sodium all-solid-state battery. Sci. Rep. 2020, 10, 9453. [Google Scholar] [CrossRef]
  10. Honma, T.; Togashi, T.; Ito, N.; Komatsu, T. Fabrication of Na2FeP2O7 glass-ceramics for sodium ion battery. J. Ceram. Soc. Jpn. 2012, 120, 344–346. [Google Scholar] [CrossRef] [Green Version]
  11. Honma, T.; Ito, N.; Togashi, T.; Sato, A.; Komatsu, T. Triclinic Na2−xFe1+x/2P2O7/C glass-ceramics with high current density performance for sodium ion battery. J. Power Sources 2013, 227, 31–34. [Google Scholar] [CrossRef]
  12. Ji, Y.; Honma, T.; Komatsu, T. Crystallization of the Na2FexNi1−xP2O7 Glass and Ability of Cathode for Sodium-Ion Batteries. Front. Mater. 2020, 7. in press. [Google Scholar] [CrossRef] [Green Version]
  13. Tanabe, M.; Honma, T.; Komatsu, T. Unique crystallization behavior of sodium manganese pyrophosphate Na2MnP2O7 glass and its electrochemical properties. J. Asian Ceram. Soc. 2017, 5, 209–215. [Google Scholar] [CrossRef] [Green Version]
  14. Tanabe, M.; Honma, T.; Komatsu, T. Crystallization behavior and electrochemical properties of Na2FeyMn1−yP2O7 glass. J. Non Cryst. Solids 2018, 501, 153–158. [Google Scholar] [CrossRef]
  15. Akatsuka, C.; Honma, T.; Komatsu, T. Surface crystallization tendency of Na2FeP2O7 glass. J. Ceram. Soc. Jpn. 2018, 126, 563–567. [Google Scholar] [CrossRef] [Green Version]
  16. Kato, A.; Nagao, M.; Sakuda, A.; Hayashi, A.; Tatsumisago, M. Evaluation of young’s modulus of Li2S-P2S5-P2O5 oxysulfide glass solid electrolytes. J. Ceram. Soc. Jpn. 2014, 122, 552–555. [Google Scholar] [CrossRef] [Green Version]
  17. Goodenough, J.B.; Hong, H.-P.; Kafalas, J.A. Fast Na+-ion transport in skeleton structures. Mater. Res. Bull. 1976, 11, 203–220. [Google Scholar] [CrossRef]
  18. Naqash, S.; Ma, Q.; Tietz, F.; Guillon, O. Na3Zr2(SiO4)2(PO4) prepared by a solution-assisted solid state reaction. Solid State Ionics 2017, 302, 83–91. [Google Scholar] [CrossRef]
  19. Naqash, S.; Sebold, D.; Tietz, F.; Guillon, O. Microstructure–conductivity relationship of Na3Zr2(SiO4)2(PO4) ceramics. J. Am. Ceram. Soc. 2019, 102, 1057–1070. [Google Scholar] [CrossRef]
  20. Bouquin, O.; Perthuis, H.; Colomban, P. Low-temperature sintering and optimal physical properties: A challenge-the NASICON ceramics case. J. Mater. Sci. Lett. 1985, 4, 956–959. [Google Scholar] [CrossRef]
  21. Höland, W.; Beall, G. Glass-Ceramic Technology; Wiley: Hoboken, NJ, USA, 2019; ISBN 9781119423690. [Google Scholar]
  22. Deubener, J.; Allix, M.; Davis, M.J.; Duran, A.; Höche, T.; Honma, T.; Komatsu, T.; Krüger, S.; Mitra, I.; Müller, R.; et al. Updated definition of glass-ceramics. J. Non Cryst. Solids 2018, 501, 3–10. [Google Scholar] [CrossRef]
  23. Agea-Blanco, B.; Reinsch, S.; Müller, R. Sintering and foaming of barium silicate glass powder compacts. Front. Mater. 2016, 3, 1–10. [Google Scholar] [CrossRef] [Green Version]
  24. Blaeß, C.; Müller, R.; Poologasundarampillai, G.; Brauer, D.S. Sintering and concomitant crystallization of bioactive glasses. Int. J. Appl. Glass Sci. 2019, 10, 449–462. [Google Scholar] [CrossRef]
  25. Goel, A.; Ferrari, A.M.; Kansal, I.; Pascual, M.J.; Barbieri, L.; Bondioli, F.; Lancellotti, I.; Ribeiro, M.J.; Ferreira, J.M.F. Sintering and crystallization behavior of CaMgSi2O6-NaFeSi2O6 based glass-ceramics. J. Appl. Phys. 2009, 106. [Google Scholar] [CrossRef] [Green Version]
  26. Goel, A.; Reddy, A.A.; Pascual, M.J.; Gremillard, L.; Malchere, A.; Ferreira, J.M.F. Sintering behavior of lanthanide-containing glass-ceramic sealants for solid oxide fuel cells. J. Mater. Chem. 2012, 22, 10042. [Google Scholar] [CrossRef]
  27. Honma, T.; Okamoto, M.; Togashi, T.; Ito, N.; Shinozaki, K.; Komatsu, T. Electrical conductivity of Na2O–Nb2O5–P2O5 glass and fabrication of glass–ceramic composites with NASICON type Na3Zr2Si2PO12. Solid State Ionics 2015, 269, 19–23. [Google Scholar] [CrossRef]
  28. Suzuki, K.; Noi, K.; Hayashi, A.; Tatsumisago, M. Low temperature sintering of Na1+xZr2SixP3−xO12 by the addition of Na3BO3. Scr. Mater. 2018, 145, 67–70. [Google Scholar] [CrossRef]
  29. Oh, J.A.S.; He, L.; Plewa, A.; Morita, M.; Zhao, Y.; Sakamoto, T.; Song, X.; Zhai, W.; Zeng, K.; Lu, L. Composite NASICON (Na3Zr2Si2PO12) Solid-State Electrolyte with Enhanced Na+ Ionic Conductivity: Effect of Liquid Phase Sintering. ACS Appl. Mater. Interfaces 2019, 11, 40125–40133. [Google Scholar] [CrossRef]
  30. Shao, Y.; Zhong, G.; Lu, Y.; Liu, L.; Zhao, C.; Zhang, Q.; Hu, Y.S.; Yang, Y.; Chen, L. A novel NASICON-based glass-ceramic composite electrolyte with enhanced Na-ion conductivity. Energy Storage Mater. 2019, 23, 514–521. [Google Scholar] [CrossRef]
  31. Grady, Z.M.; Tsuji, K.; Ndayishimiye, A.; Hwan-Seo, J.; Randall, C.A. Densification of a Solid-State NASICON Sodium-Ion Electrolyte Below 400 °C by Cold Sintering With a Fused Hydroxide Solvent. ACS Appl. Energy Mater. 2020, 3, 4356–4366. [Google Scholar] [CrossRef]
  32. Okubo, K.; Wang, H.; Hayashi, K.; Inada, M.; Enomoto, N.; Hasegawa, G.; Osawa, T.; Takamura, H. A dense NASICON sheet prepared by tape-casting and low temperature sintering. Electrochim. Acta 2018, 278, 176–181. [Google Scholar] [CrossRef]
  33. Hoppe, U.; Delevoye, L.; Montagne, L.; Zimmermann, M.V.; Hannon, A.C. Structure of Nb2O5–NaPO3 glasses by X-ray and neutron diffraction. Phys. Chem. Chem. Phys. 2013, 15, 8520–8528. [Google Scholar] [CrossRef]
  34. Bhide, A.; Hariharan, K. Sodium ion transport in NaPO3-Na2SO4 glasses. Mater. Chem. Phys. 2007, 105, 213–221. [Google Scholar] [CrossRef]
  35. Rousselot, C. Correlations between structure and conductivity in NaPO3-TiO2 glasses. Solid State Ionics 1992, 58, 71–76. [Google Scholar] [CrossRef]
  36. Langar, A.; Sdiri, N.; Elhouichet, H.; Ferid, M. Conductivity and dielectric behavior of NaPO3–ZnO–V2O5 glasses. J. Alloys Compd. 2014, 590, 380–387. [Google Scholar] [CrossRef]
  37. Sokolov, I.A.; Murin, I.V.; Kriyt, V.E.; Pronkin, A.A. Structure and electric properties of Na2SO4-NaPO3 glasses. Russ. J. Electrochem. 2011, 47, 410–415. [Google Scholar] [CrossRef]
  38. Sokolov, I.A.; Murin, I.V.; Kriyt, V.E.; Pronkin, A.A. Structure and electrical conductivity of glasses in the Na2O-Na2SO4-P2O5 system. Glas. Phys. Chem. 2011, 37, 351–361. [Google Scholar] [CrossRef]
  39. Doebelin, N.; Kleeberg, R. Profex: A graphical user interface for the Rietveld refinement program BGMN. J. Appl. Crystallogr. 2015, 48, 1573–1580. [Google Scholar] [CrossRef] [PubMed] [Green Version]
  40. Voronkov, A.A.; Shumyatskaya, N.G.; Pyatenko, Y.A.; Voronkov, A.A.; Shumyatskaya, N.G.; Pyatenko, Y.A. Crystal Structure of a New Natural Modification of Na2Zr(Si2O7). J. Struct. Chem. 1970, 11, 932–933. [Google Scholar] [CrossRef]
  41. Nikolova, R.P.; Fujiwara, K.; Nakayama, N.; Kostov-Kytin, V. Crystal structure of a new small-pore zirconosilicate Na2ZrSi2O7·H2O and its relation to stoichiometrically and topologically similar compounds. Solid State Sci. 2009, 11, 382–388. [Google Scholar] [CrossRef]
  42. Petrova, N.R.; Noriaki, N.; Snejana, B.; Petr, B.; Vladislav, K.-K. Temperature-induced phase transformations of the small-pore zirconosilicate Na2ZrSi2O7·H2O. Solid State Sci. 2011, 13, 1187–1190. [Google Scholar] [CrossRef]
Figure 1. DTA curves of NaPO3 glass.
Materials 14 03790 g001
Figure 2. XRD patterns of the LPS-NZSP (ac) and SSR-NZSP (df) calcined at various temperature.
Materials 14 03790 g002
Figure 3. Refined XRD pattern of LPS-NZSP calcined at 1000 °C 10 h.
Materials 14 03790 g003
Figure 4. Content of formed phases determined by Rietveld fitting.
Materials 14 03790 g004
Figure 5. Bulk density and relative density of the LPS-NZSP as a function of calcination temperature.
Materials 14 03790 g005
Figure 6. SEM cross-section observation of the samples.
Materials 14 03790 g006
Figure 7. XPS survey spectra of the samples calcined at 1000 °C for 10 h.
Materials 14 03790 g007
Figure 8. Nyquist plots of the samples calcined at 1000 °C for 7 h and 10 h. The sampling was performed at 100 °C. The red line mean fitted curve using equivalent circuit as shown in the figure.
Materials 14 03790 g008
Figure 9. Arrhenius plots for electrical conductivity of the LPS-NZSP.
Materials 14 03790 g009
Figure 10. Activation Energy of the LPS-NZSP.
Materials 14 03790 g010
Table 1. Refined lattice parameters of LPS-NZSP.
Heat Treatment Conditiona (nm)b (nm)c (nm)Beta (Deg.)
1000 °C for 3 h1.5604 (1)0.9003 (4)0.9244 (3)124.25 (2)
1000 °C for 5 h1.5617 (1)0.9015 (2)0.9247 (3)124.23 (4)
1000 °C for 7 h1.5641 (1)0.9012 (1)0.9241 (2)124.20 (4)
1000 °C for 10 h1.5652 (1)0.9018 (4)0.9233 (2)124.15 (3)
1100 °C for 3 h1.5647 (4)0.9043 (4)0.9227 (4)123.76 (3)
1100 °C for 5 h1.5650 (1)0.9046 (4)0.9227 (1)123.74 (3)
1100 °C for 7 h1.5648 (1)0.9046 (4)0.9228 (2)123.73 (1)
1100 °C for 10 h1.5653 (1)0.9055 (4)0.9220 (2)123.72 (2)
1200 °C for 3 h1.5647 (1)0.9051 (4)0.9223 (4)123.69 (3)
1200 °C for 5 h1.5644 (1)0.9049 (3)0.9224 (2)123.67 (4)
1200 °C for 7 h1.5642 (1)0.9047 (3)0.9224 (3)123.65 (1)
1200 °C for 10 h1.5644 (1)0.9049 (3)0.9217 (4)123.68 (2)
Publisher’s Note: MDPI stays neutral with regard to jurisdictional claims in published maps and institutional affiliations.

