
Effect of Particle Morphology on Stiffness, Strength and Volumetric Behavior of Rounded and Angular Natural Sand


Abstract
1. Introduction
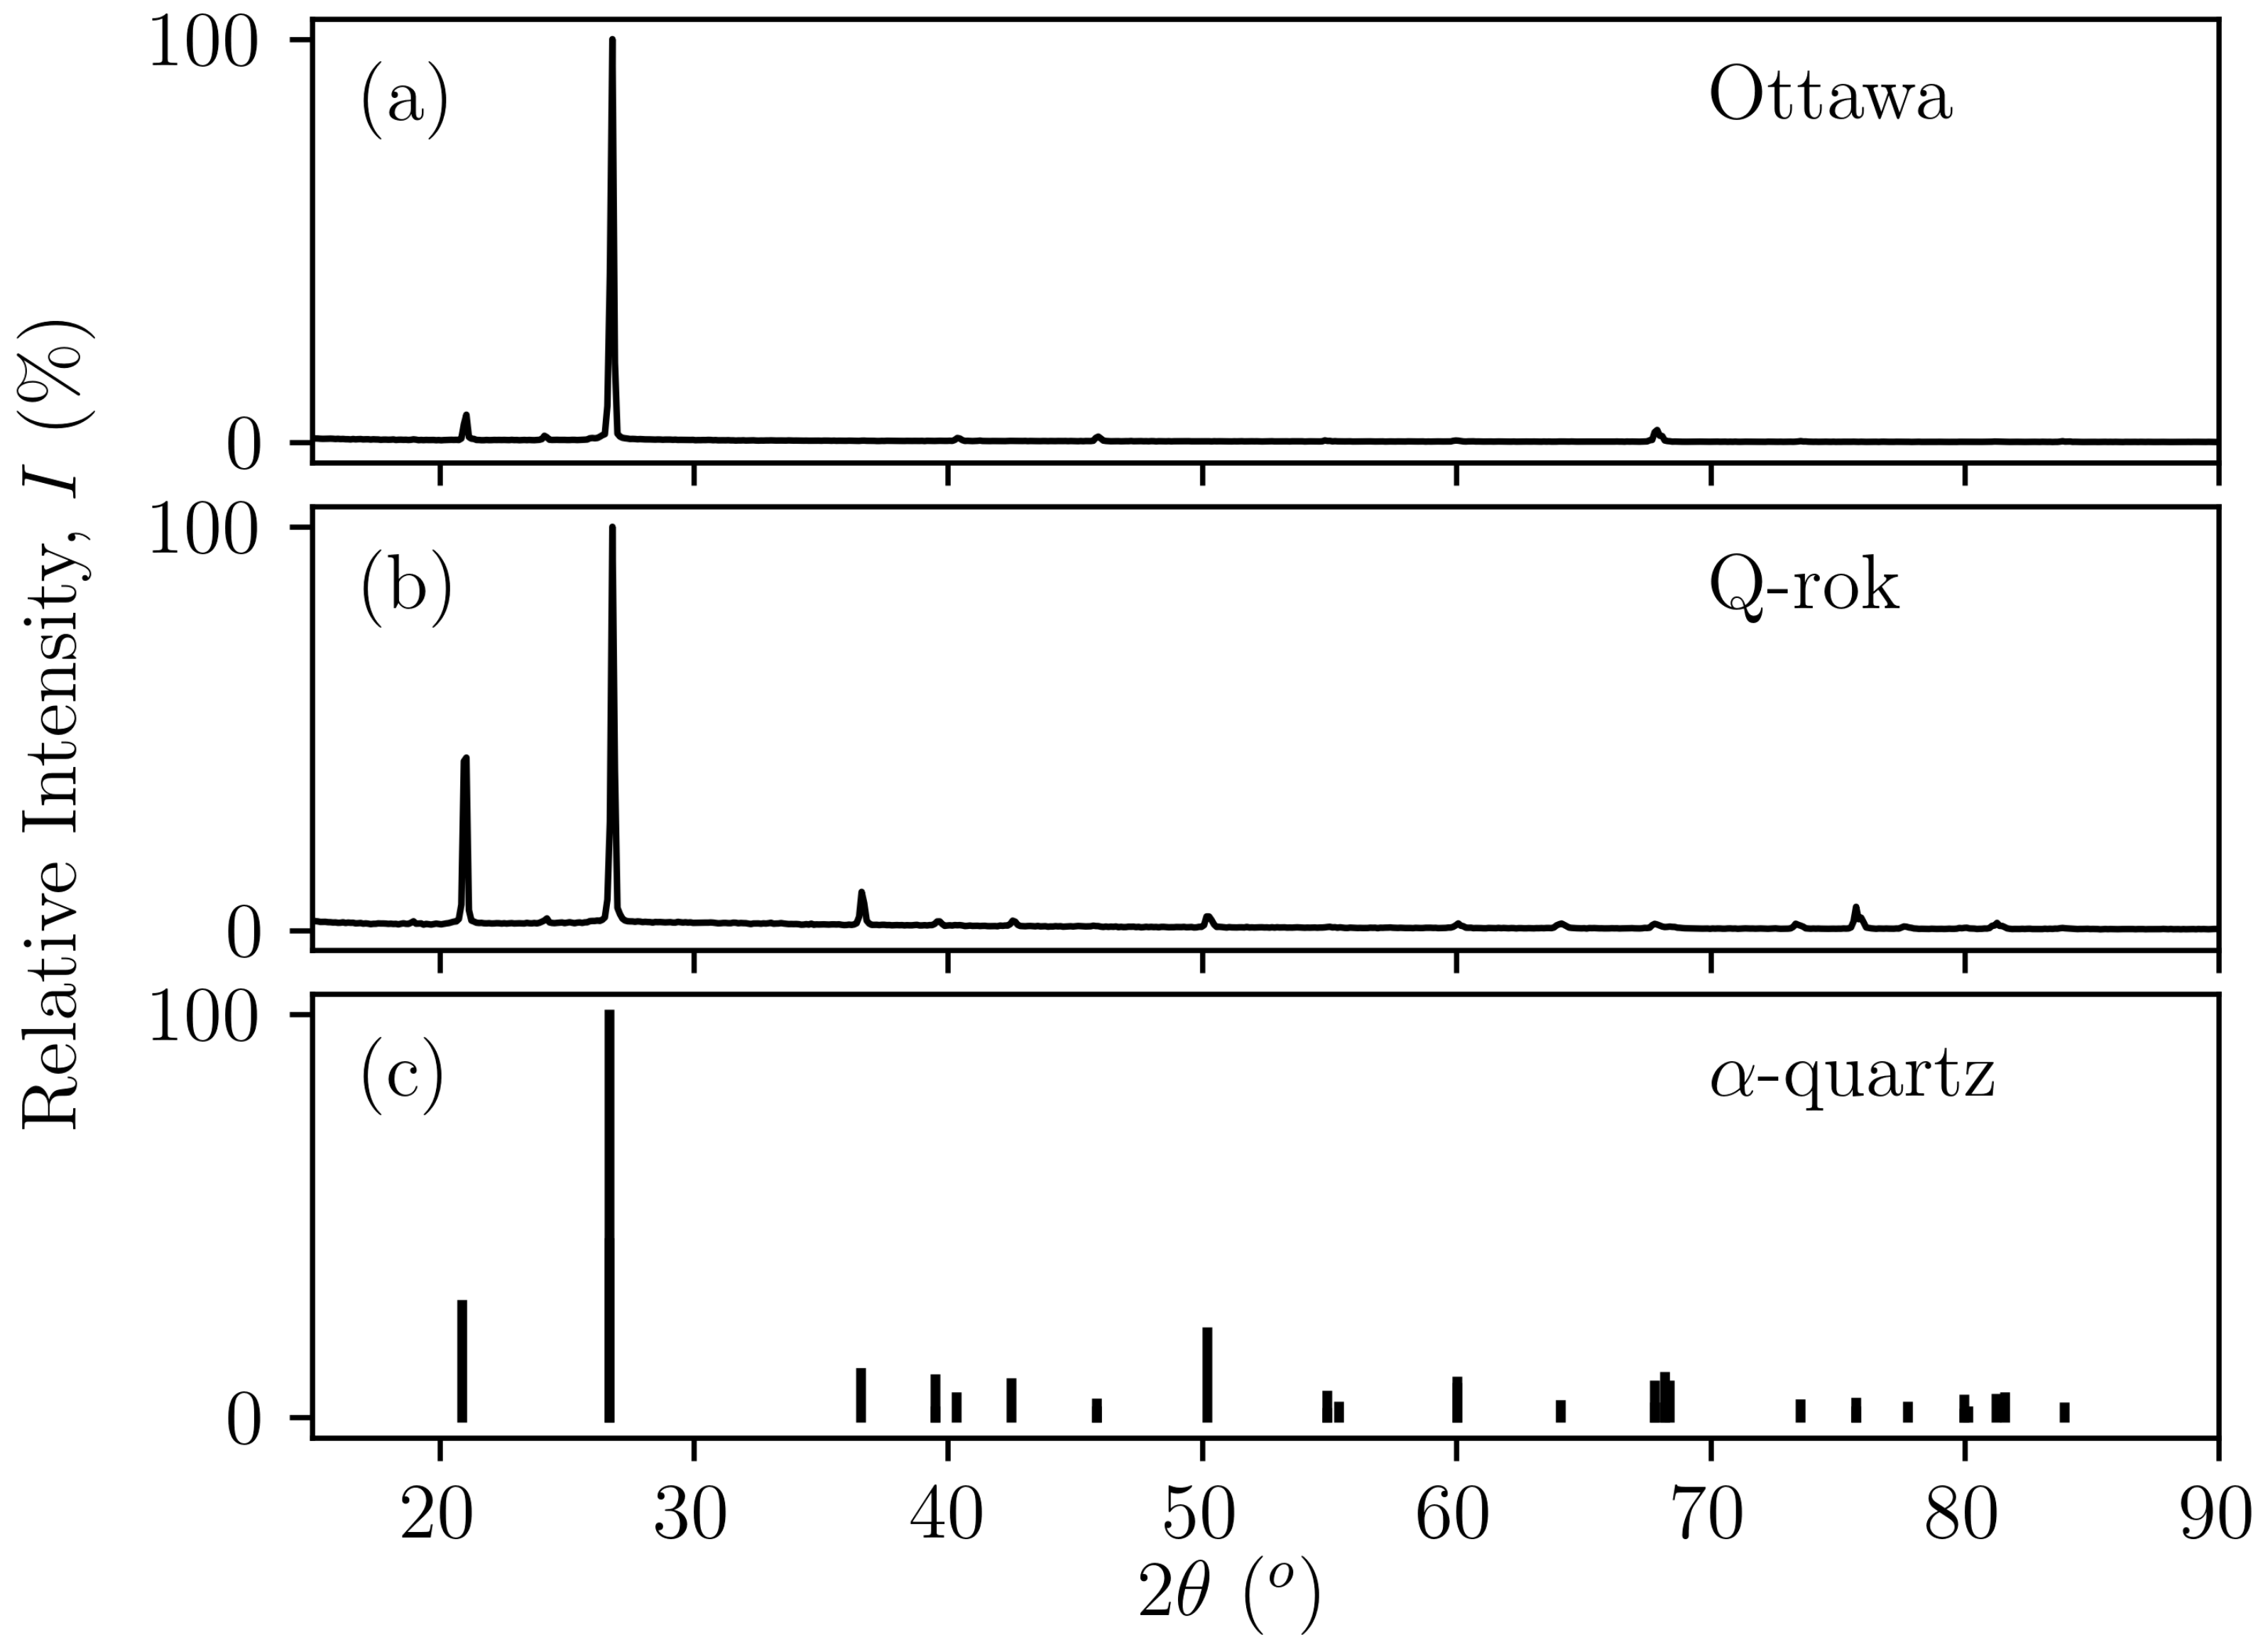
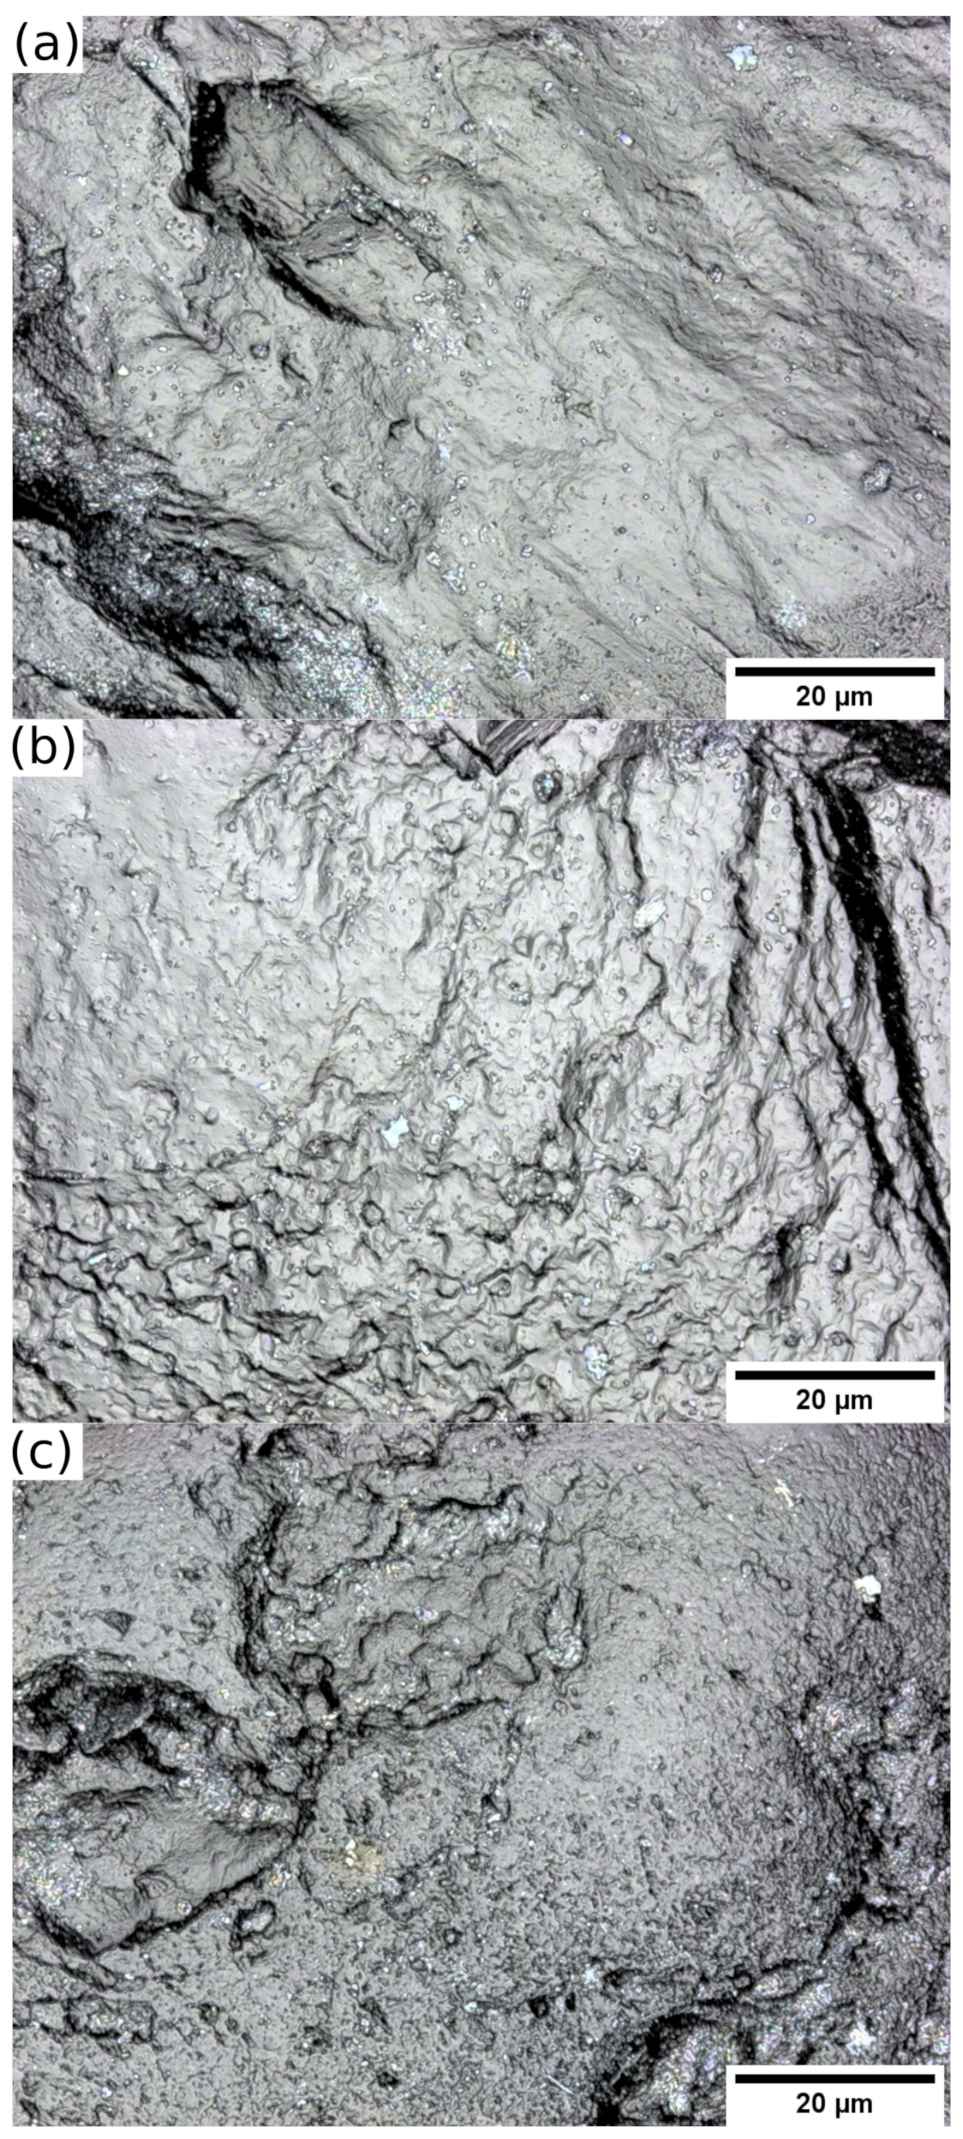
2. Materials
3. Procedure
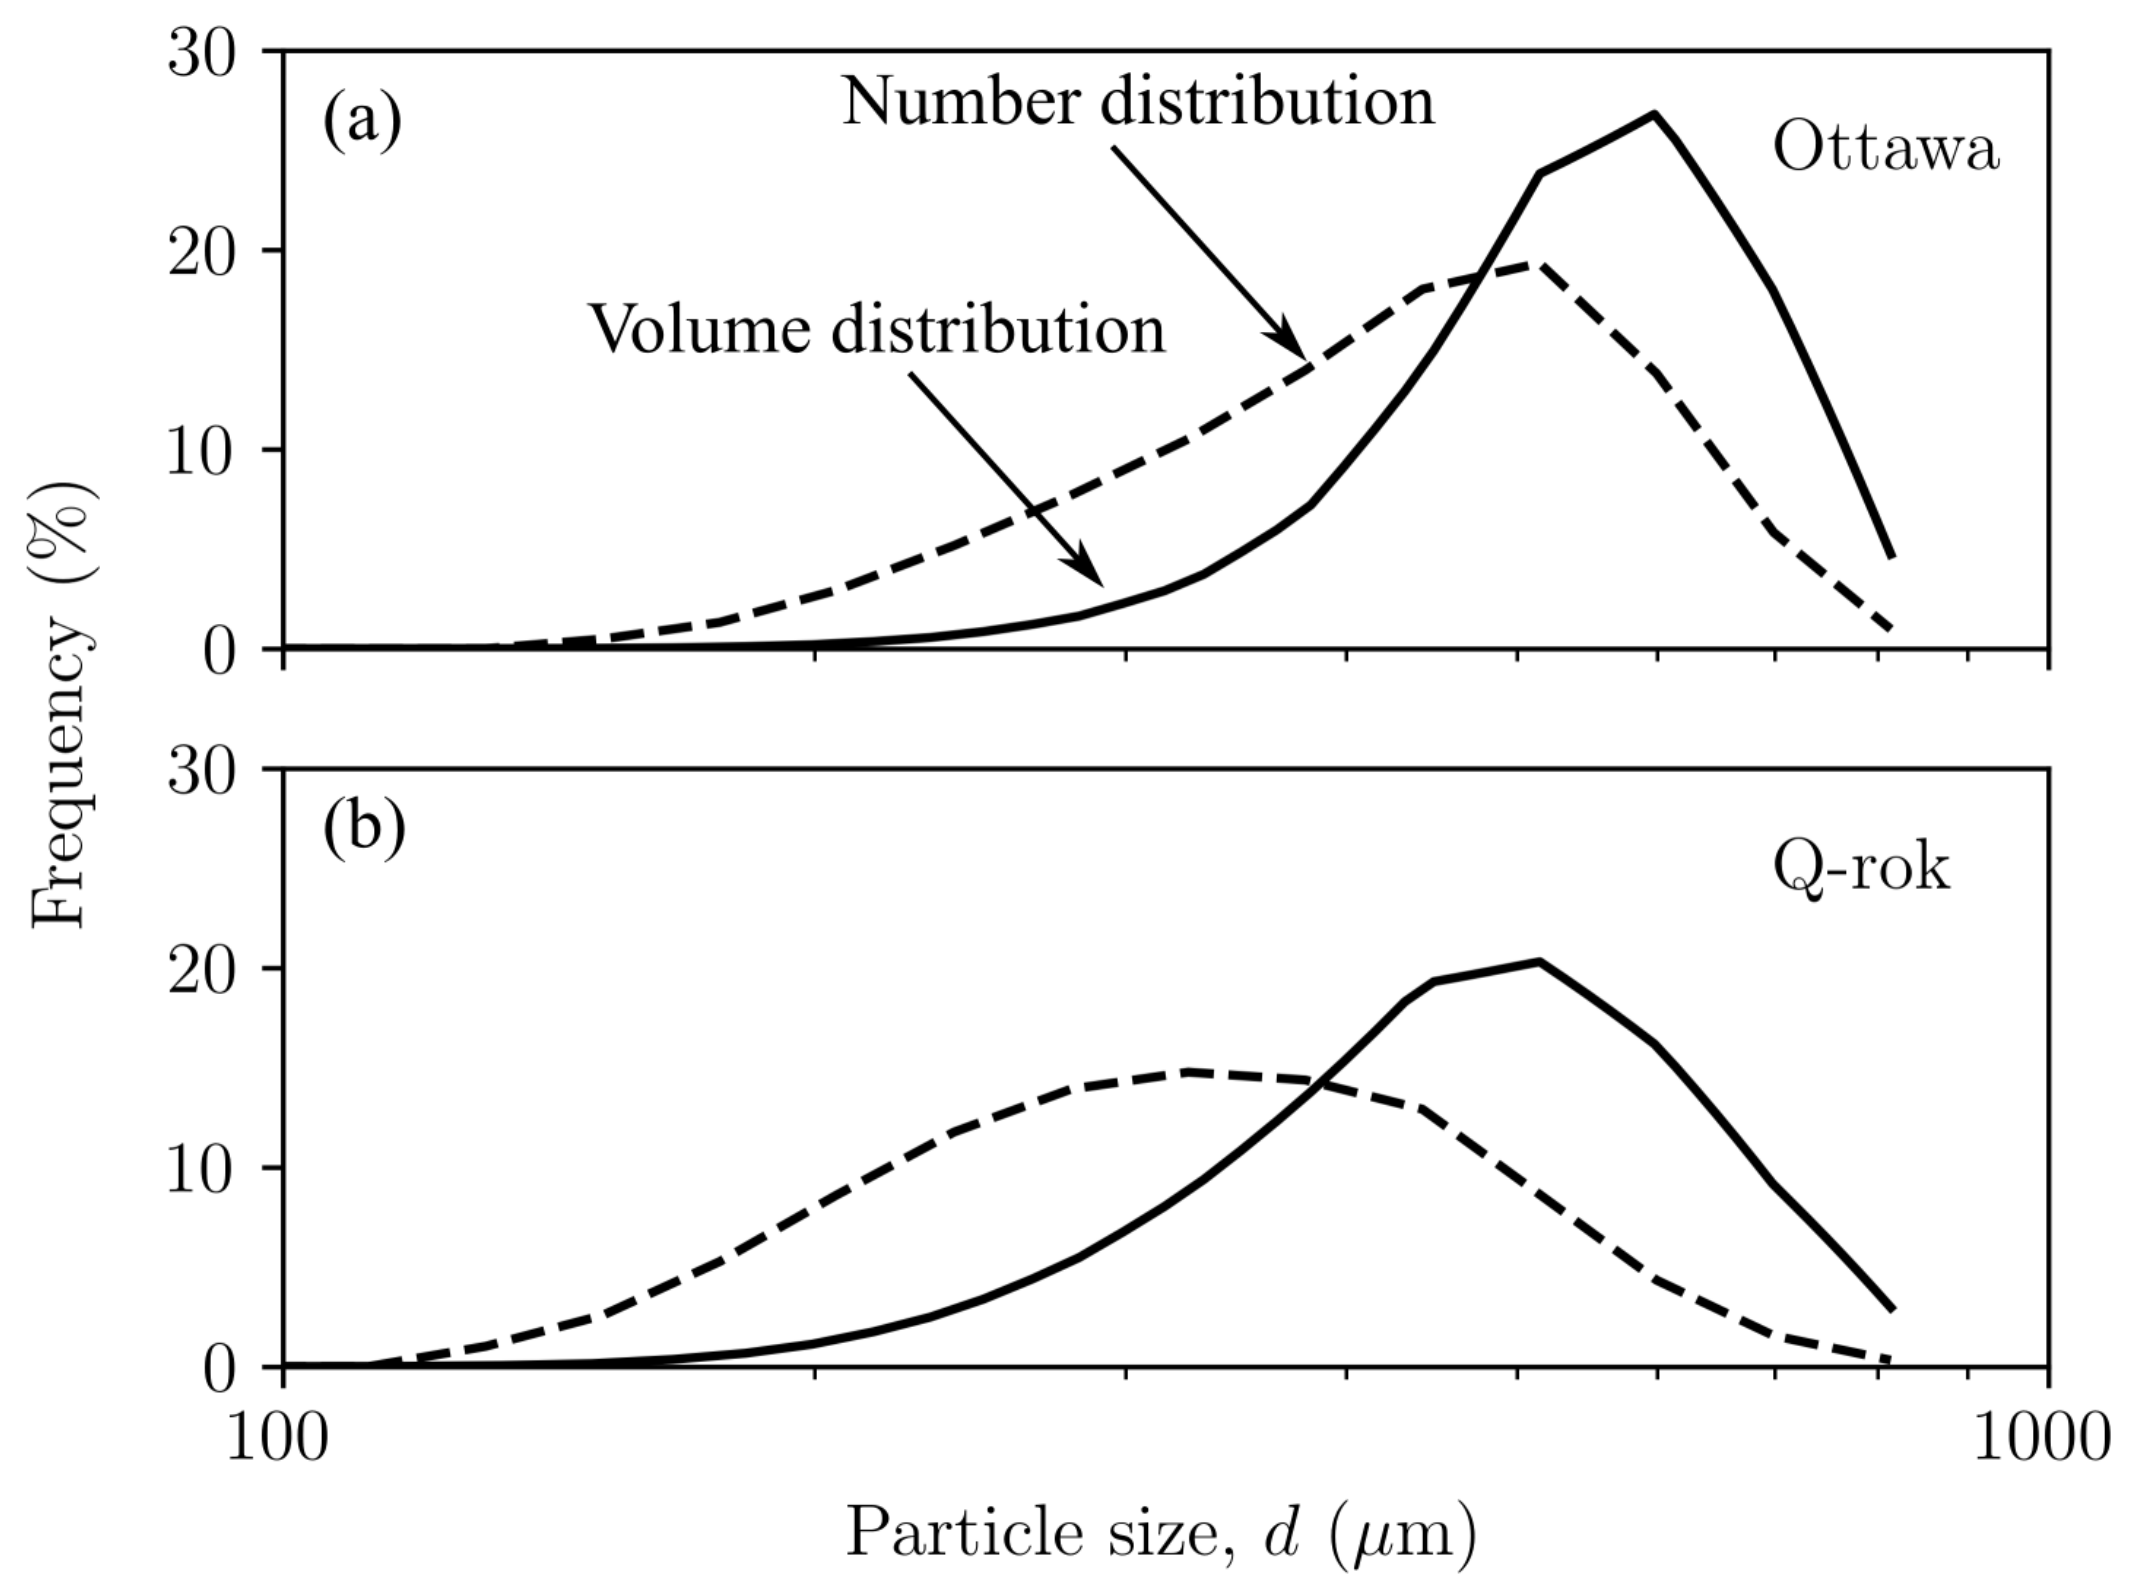
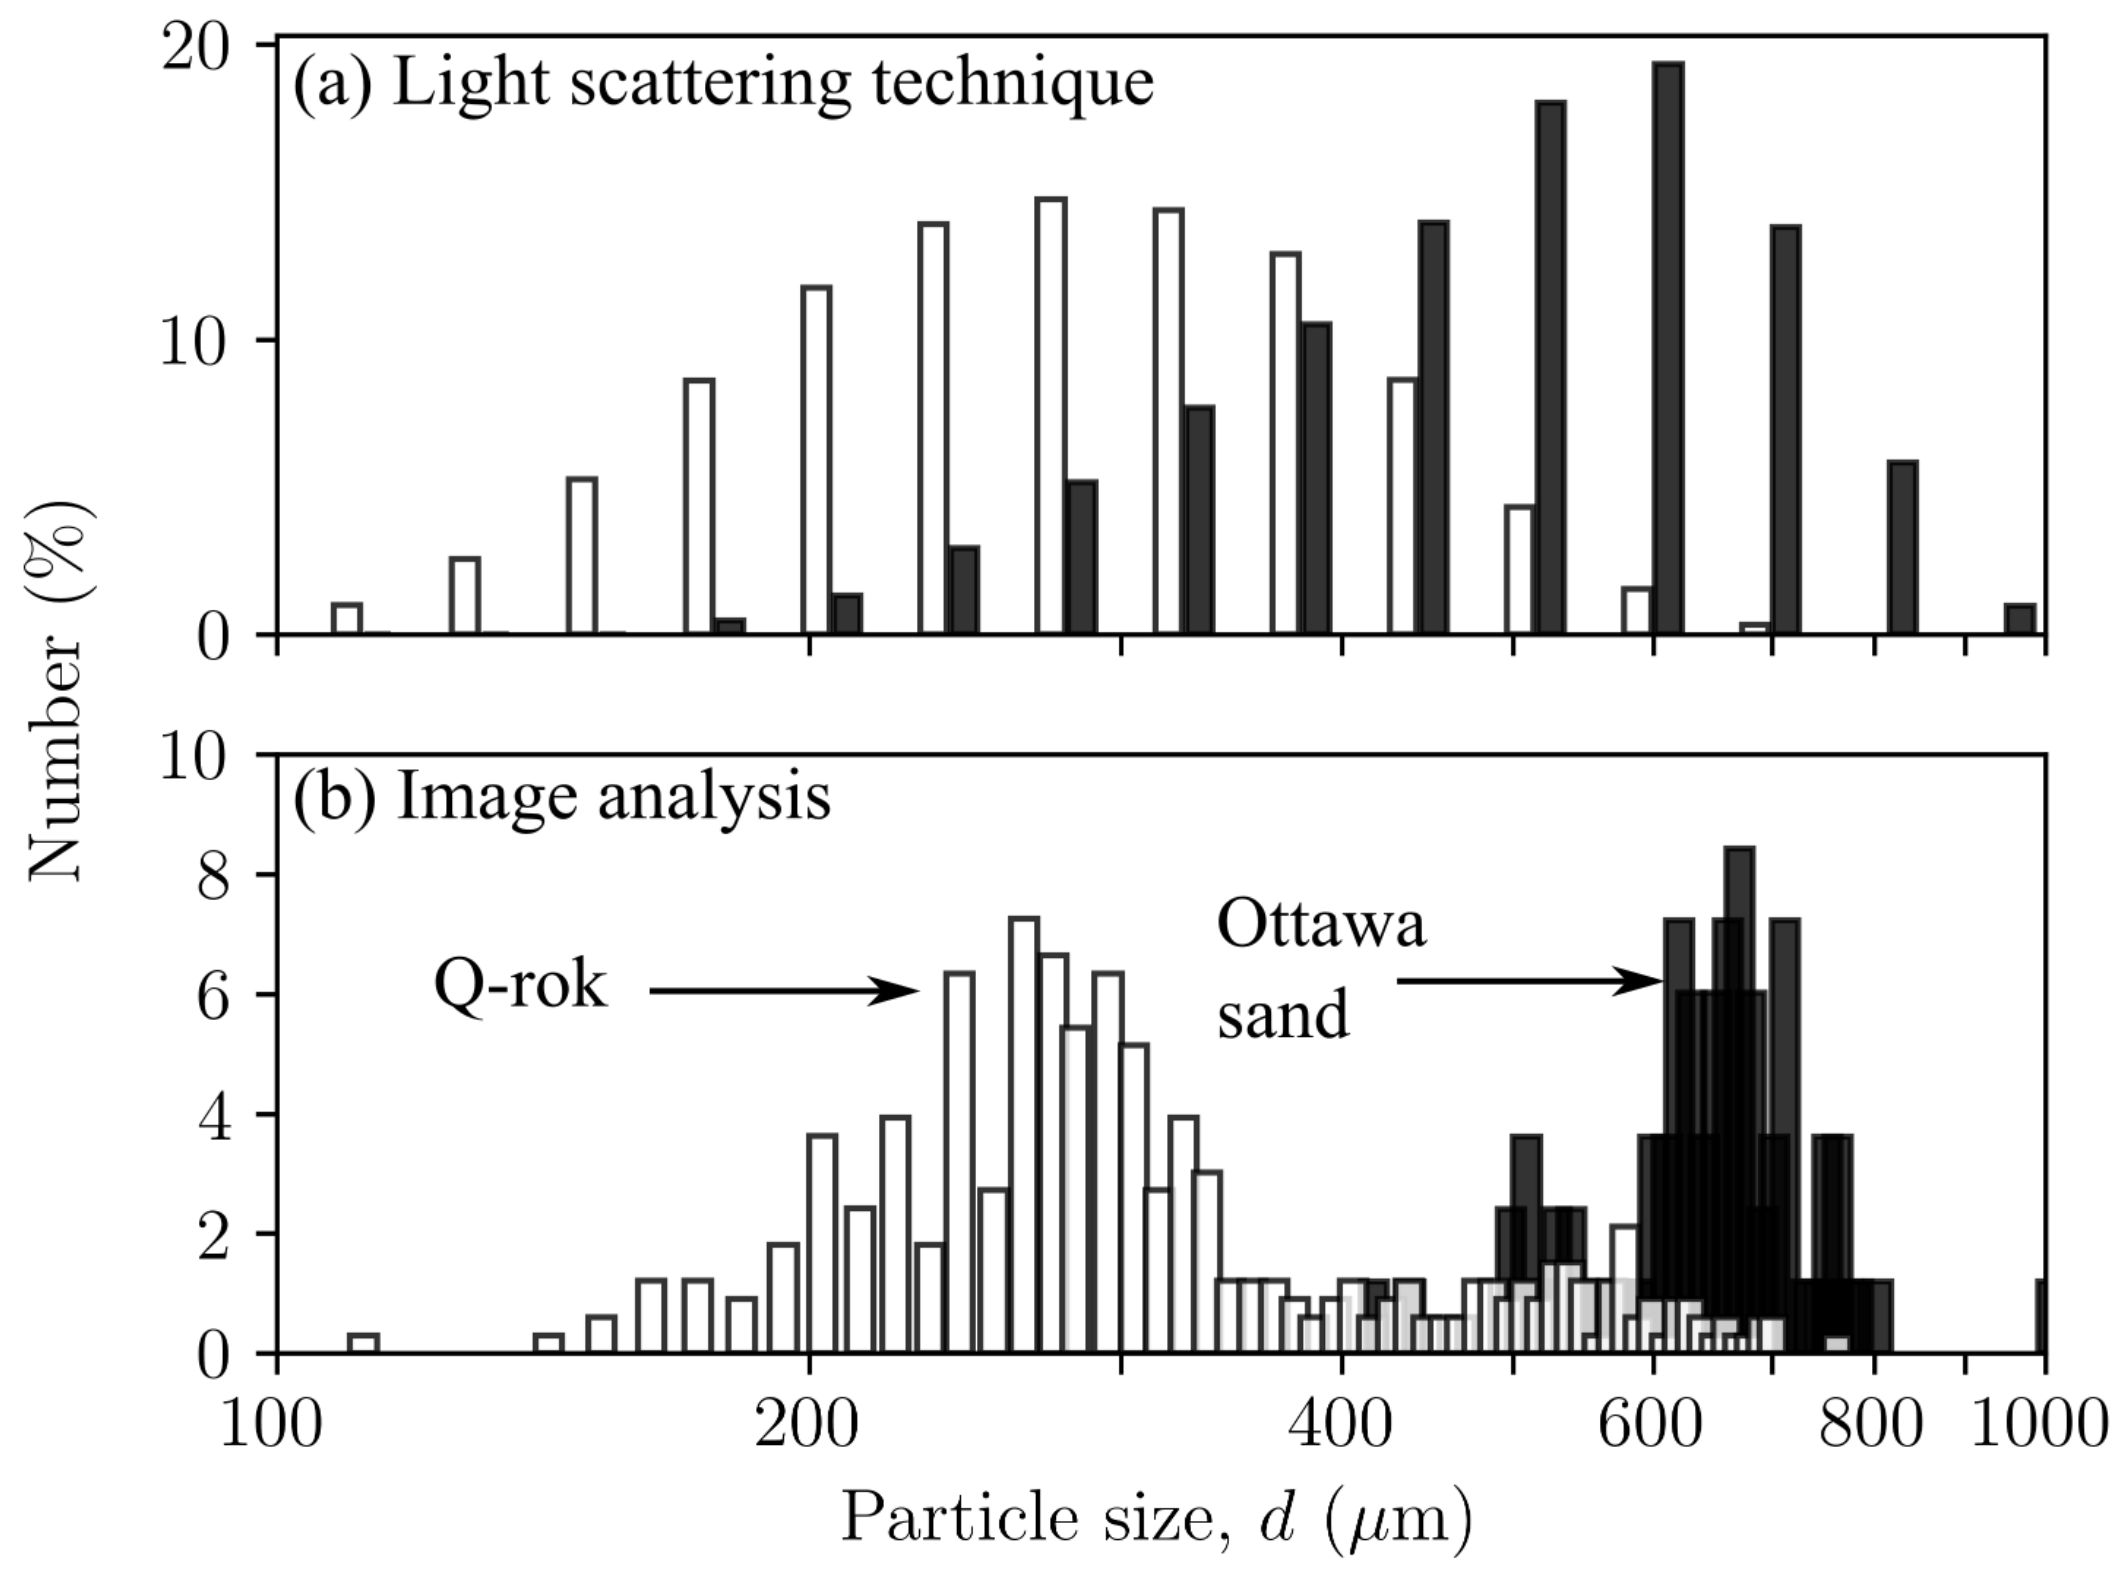
3.1. Particle Size Distribution
3.2. 1D Compression
3.3. Isotropic Consolidation
3.4. Triaxial Tests
4. Results and Discussion
4.1. Particle Size Distribution
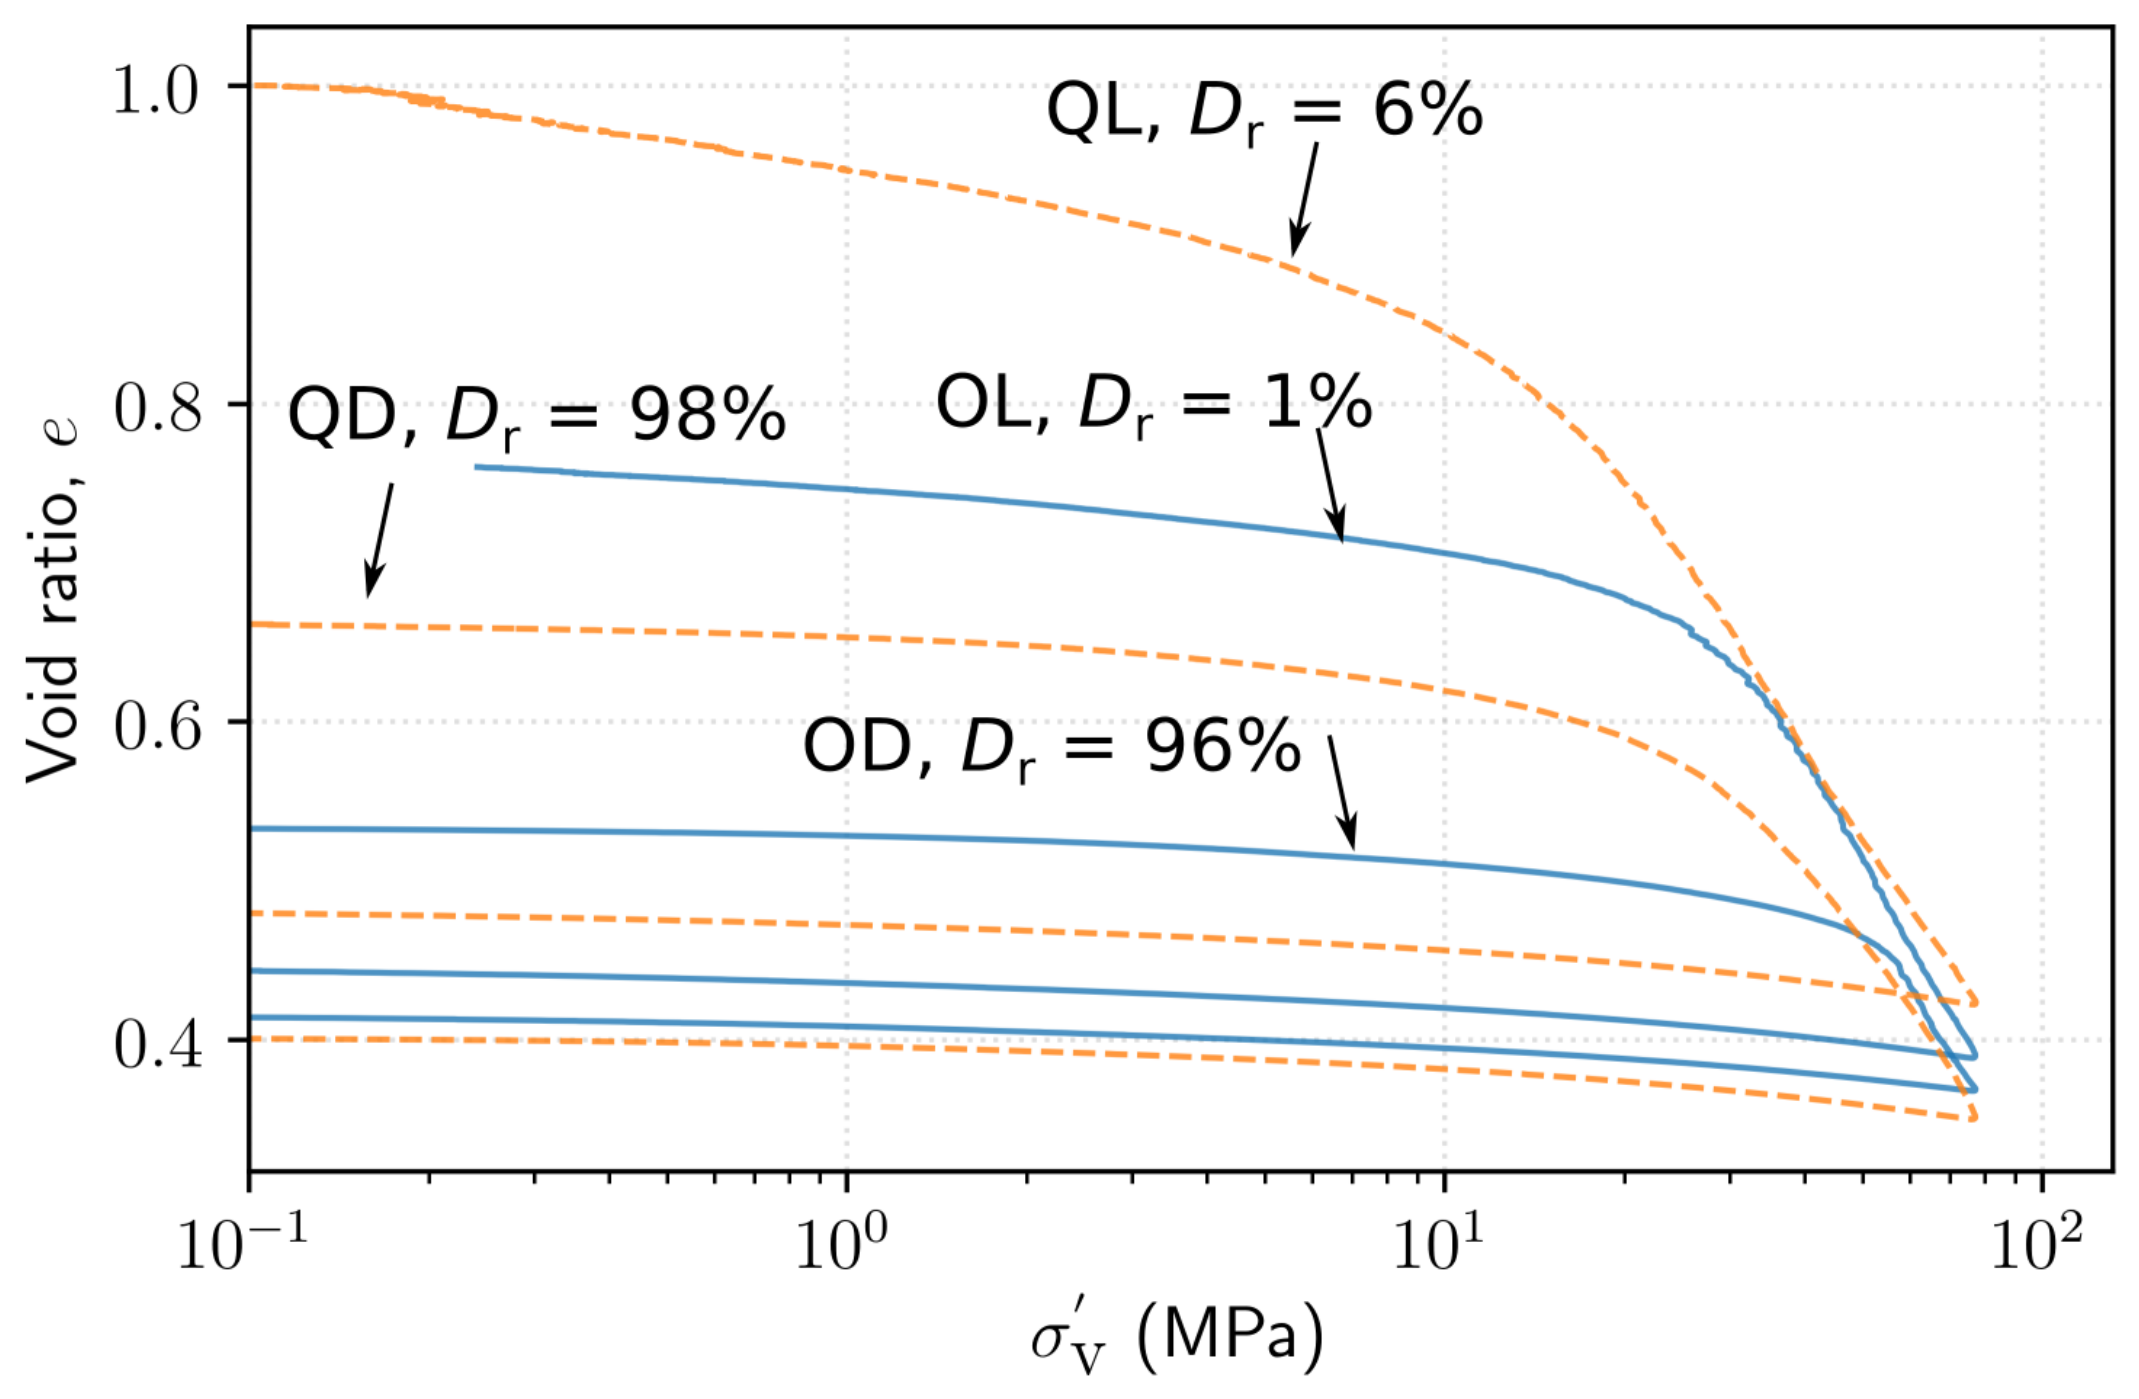
4.2. 1D Compression
4.3. Isotropic Consolidation
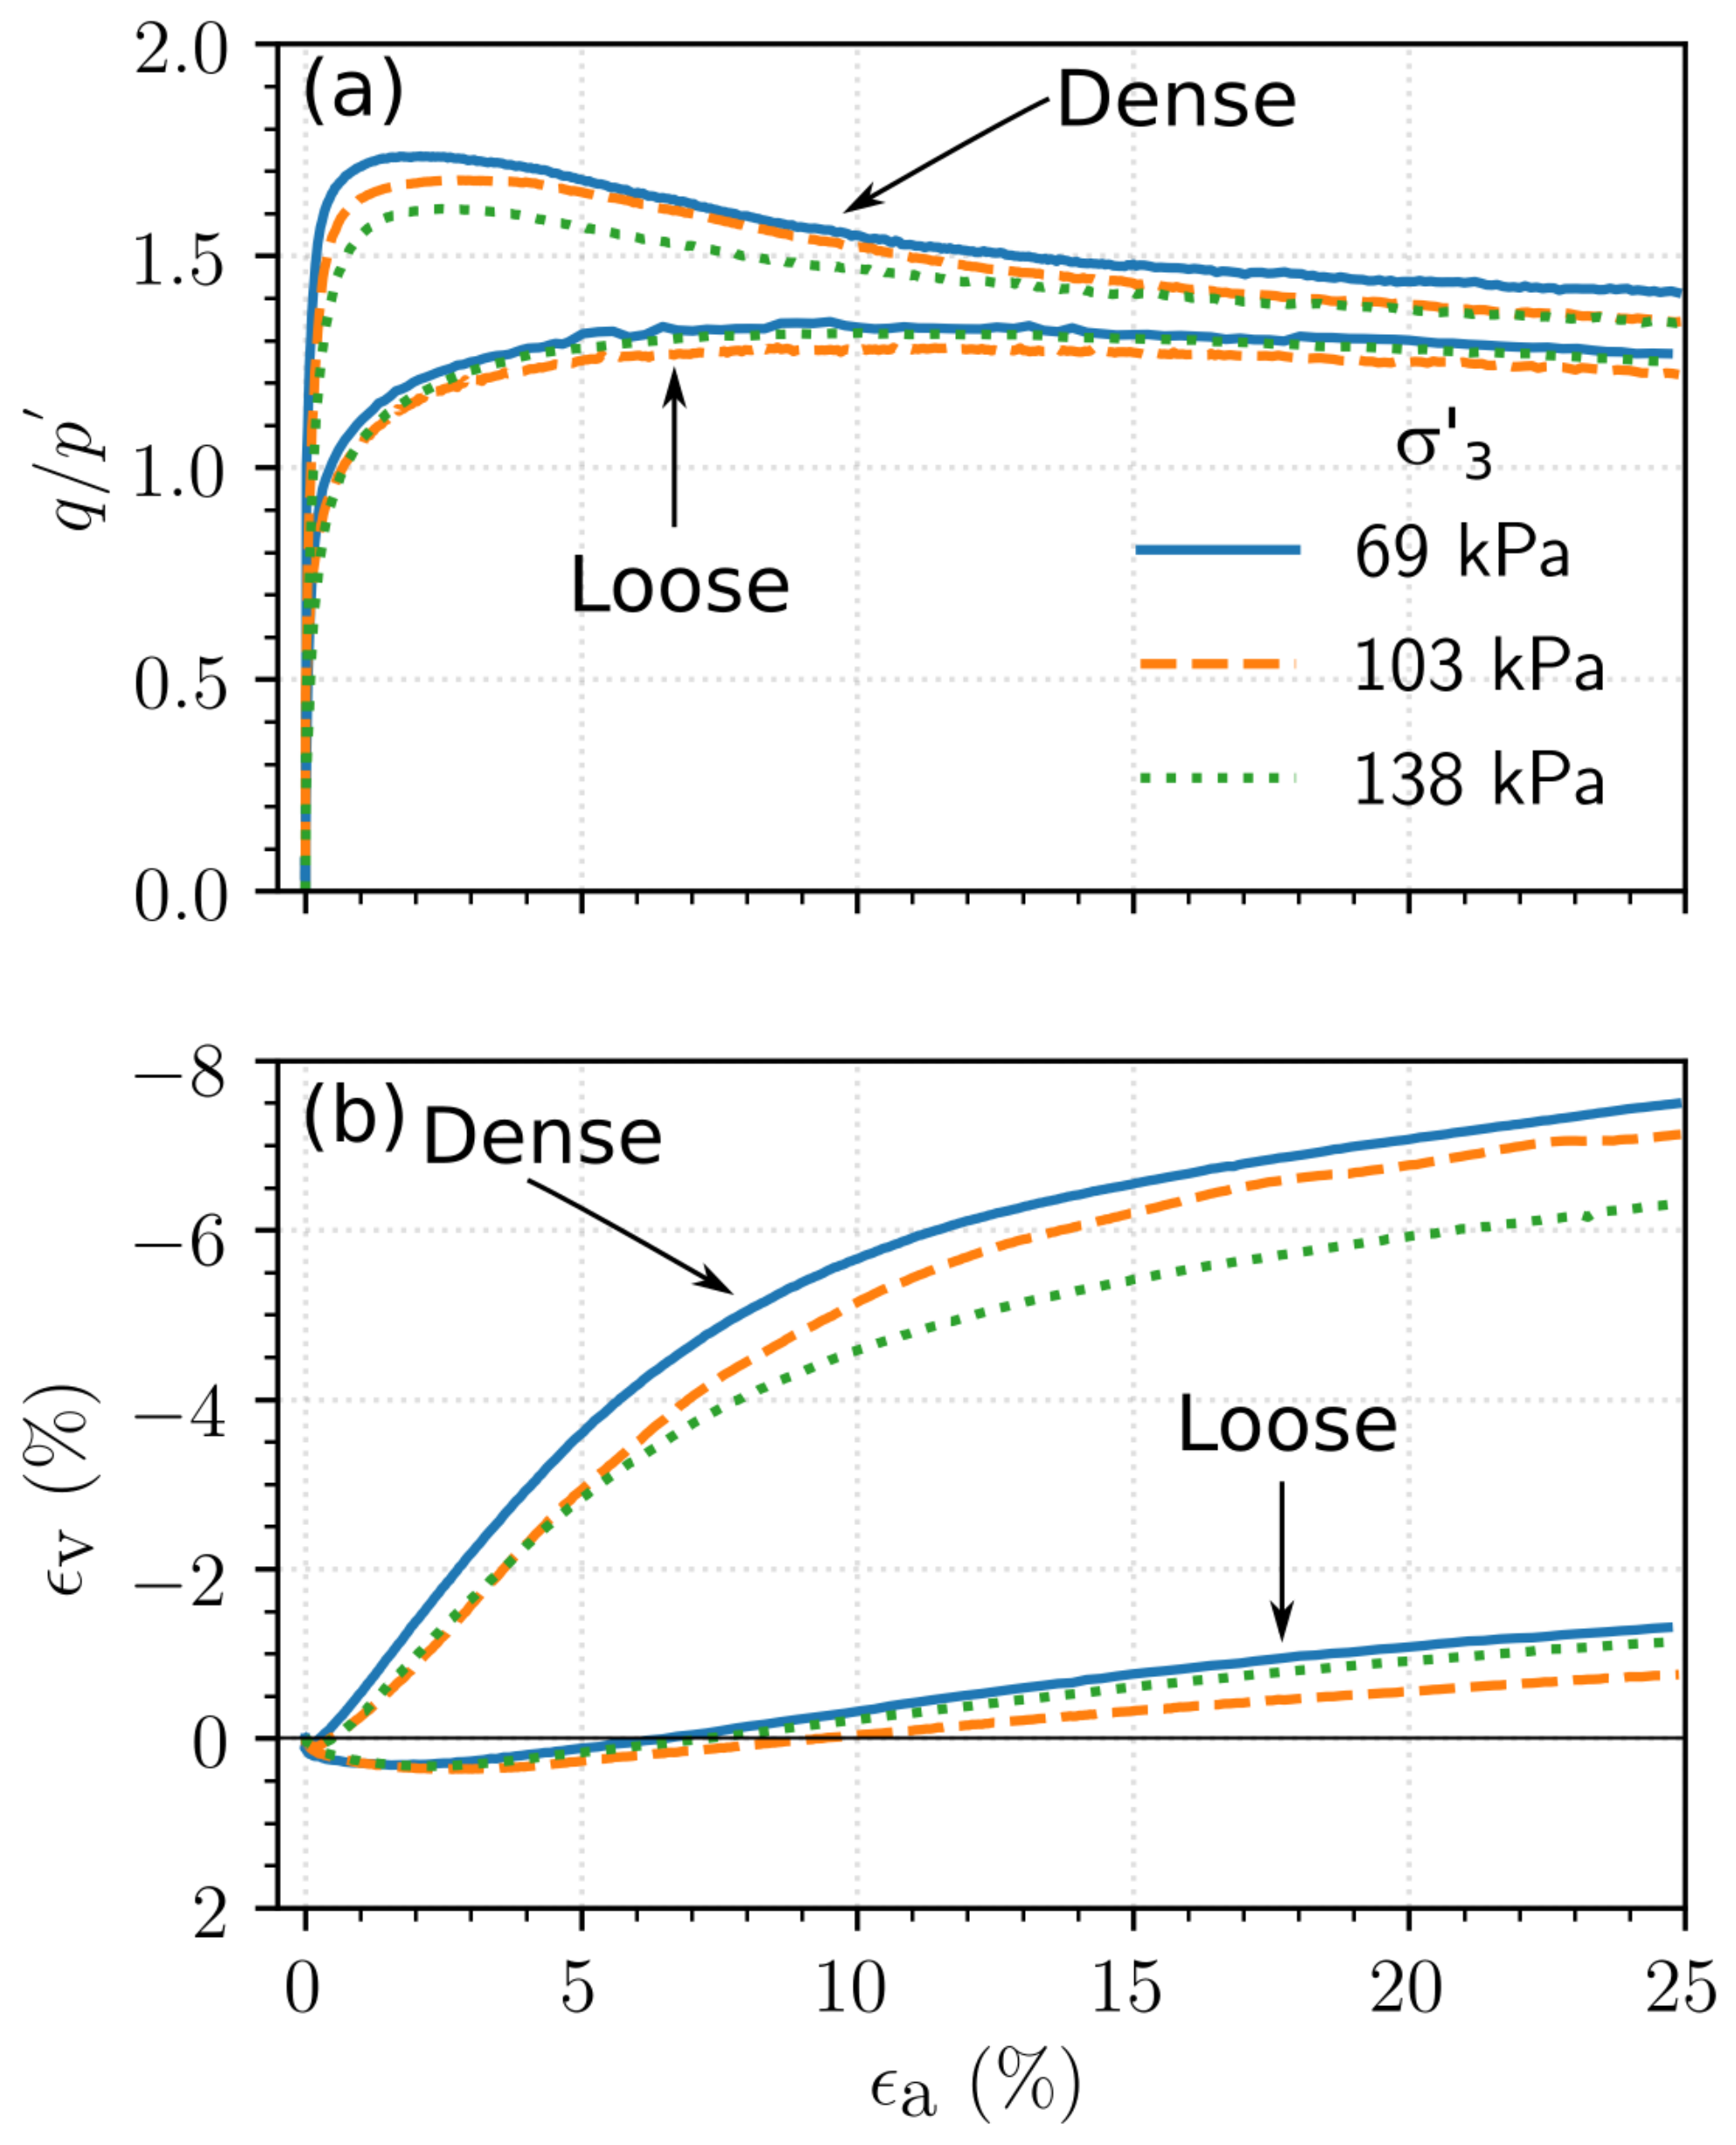
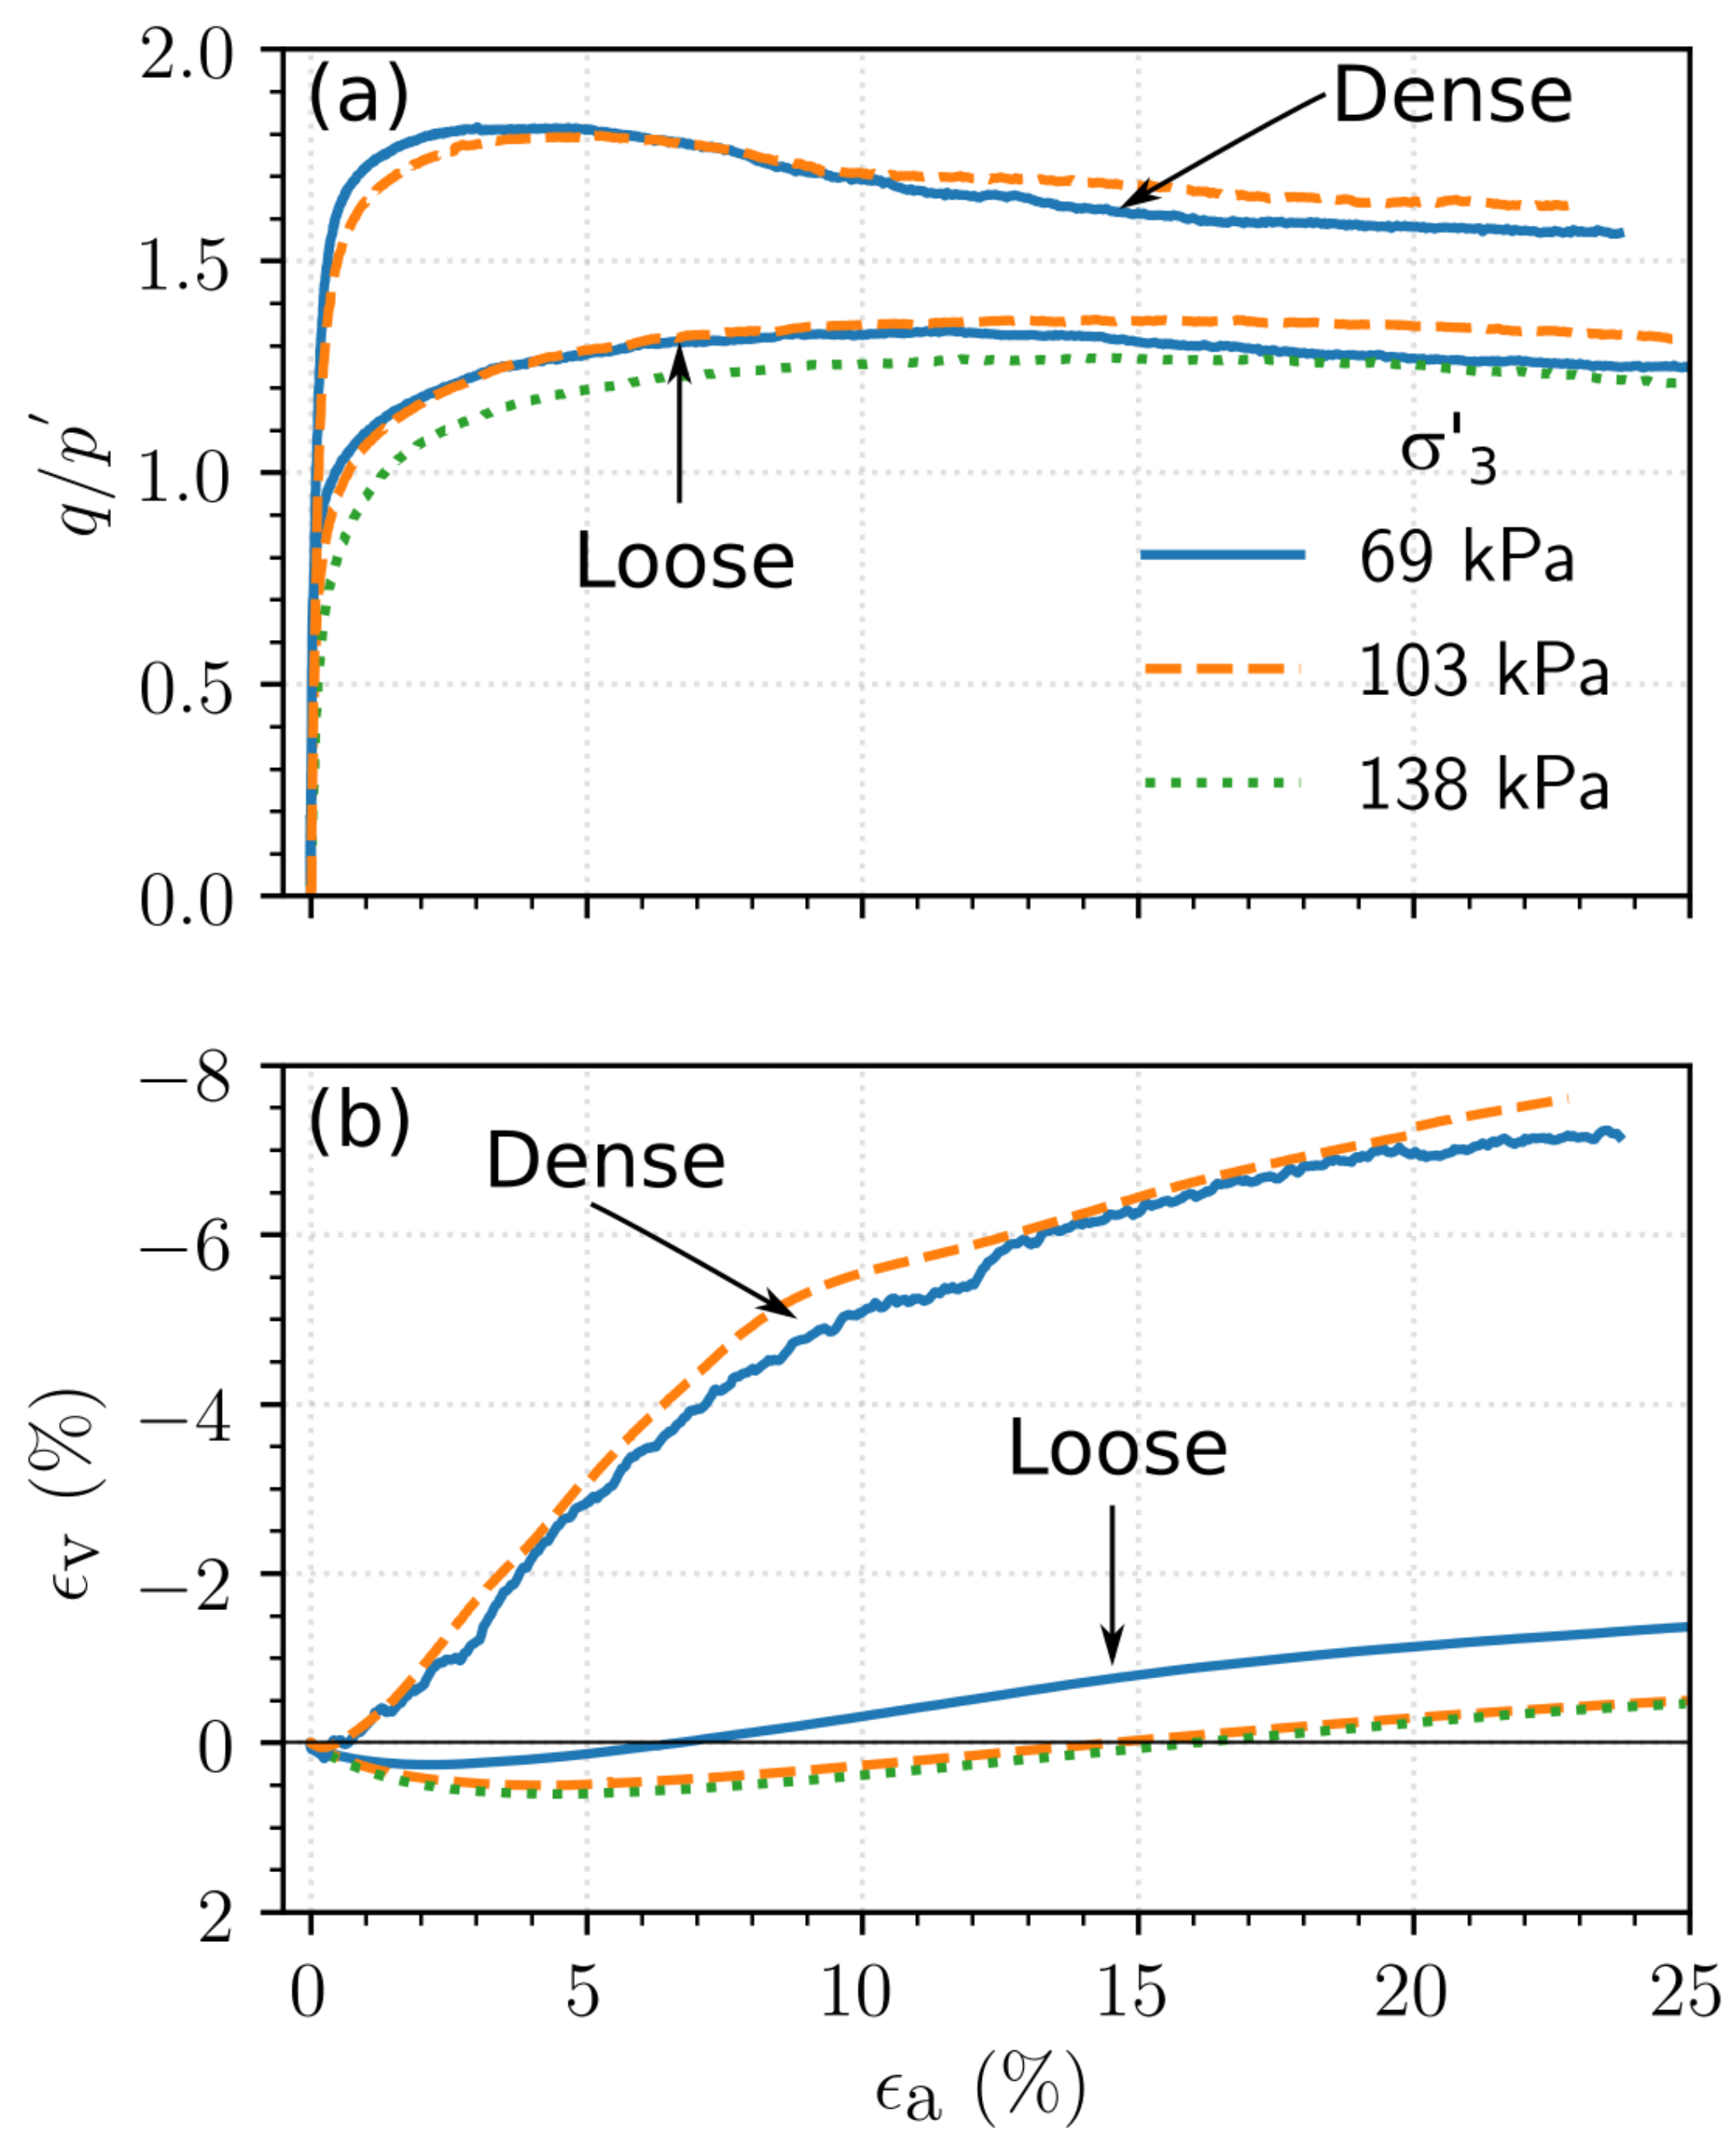
4.4. Triaxial Tests
5. Conclusions
Author Contributions
Funding
Data Availability Statement
Conflicts of Interest
References
- Vesic, A.B. Bearing Capacity of Deep Foundations in Sand. In Highway Research Record; Highway Research Board: Washington, DC, USA, 1963; pp. 112–153. [Google Scholar]
- Glößner, C.; Moser, S.; Külls, R.; Heß, S.; Nau, S.; Salk, M.; Penumadu, D.; Petrinic, N. Instrumented Projectile Penetration Testing of Granular Materials. Exp. Mech. 2017, 57, 261–272. [Google Scholar] [CrossRef]
- Omidvar, M.; Malioche, J.; Bless, S.; Iskander, M. Phenomenology of Rapid Projectile Penetration into Granular Soils. Int. J. Impact Eng. 2015, 85, 146–160. [Google Scholar] [CrossRef]
- Soriano-Moranchel, F.A.; Sandoval-Pineda, J.M.; Gutiérrez-Paredes, G.J.; Silva-Rivera, U.S.; Flores-Herrera, L.A. Simulation of Bullet Fragmentation and Penetration in Granular Media. Materials 2020, 13, 5243. [Google Scholar] [CrossRef] [PubMed]
- Jing, X.; Pan, C.; Chen, Y.; Li, X.; Wang, W.; Hu, X. Improvement Effect of Reticular Glass Fibers on the Mechanical Properties of Tailings Sand with the Lenticle (Layered Sandy Soil). Water 2021, 13, 1379. [Google Scholar] [CrossRef]
- Liu, Y.; Liao, X.; Li, L.; Mao, H. Discrete Element Modelling of the Mechanical Behavior of Sand–Rubber Mixtures under True Triaxial Tests. Materials 2020, 13, 5716. [Google Scholar] [CrossRef]
- Li, J.; Cui, J.; Shan, Y.; Li, Y.; Ju, B. Dynamic Shear Modulus and Damping Ratio of Sand–Rubber Mixtures under Large Strain Range. Materials 2020, 13, 4017. [Google Scholar] [CrossRef] [PubMed]
- Koerner, R. Effect of Particle Characteristics on Soil Strength. J. Soil Mech. Found. Div. 1970, 96, 1221–1234. [Google Scholar] [CrossRef]
- Cavarretta, I.; Coop, M.; O’sullivan, C. The Influence of Particle Characteristics on the Behaviour of Coarse Grained Soils. Géotechnique 2010, 60, 413–423. [Google Scholar] [CrossRef]
- Morris, H.C. Effect of Particle Shape and Texture on the Strength of Noncohesive Aggregates. In Papers on Soils 1959 Meetings; Committee D-18; ASTM International: West Conshohocken, PA, USA, 1960; pp. 350–364. [Google Scholar] [CrossRef]
- Chen, L.S. A Investigation of Stress-Strain and Strength Characteristics of Cohensionless Soils by Triaxial Compression Tests. In Proceedings of the International Conference on Soil Mechanics and Foundation Engineering, Rotterdam, The Netherlands, 21–30 June 1948; pp. 35–43. [Google Scholar]
- Cho, G.C.; Dodds, J.; Santamarina, J.C. Particle Shape Effects on Packing Density, Stiffness, and Strength: Natural and Crushed Sands. J. Geotech. Geoenviron. Eng. 2006, 132, 591–602. [Google Scholar] [CrossRef]
- Holubec, I.; D’Appolonia, E. Effect of Particle Shape on the Engineering Properties of Granular Soils. In Evaluation of Relative Density and Its Role in Geotechnical Projects Involving Cohesionless Soils; Selig, E.T., Ladd, R.S., Eds.; ASTM International: West Conshohocken, PA, USA, 1973; pp. 304–318. [Google Scholar] [CrossRef]
- Kolbuszewski, J.; Frederic, M.R. The Significance of Particle Shape and Size on the Mechanical Behaviour of Granular Materials. In Proceedings of the European Conference on Soil Mechanics and Foundation Engineering, Wiesbaden, Germany, 15–18 October 1963. [Google Scholar]
- Miura, K.; Maeda, K.; Furukawa, M.; Toki, S. Mechanical Characteristics of Sands with Different Primary Properties. Soils Found. 1998, 38, 159–172. [Google Scholar] [CrossRef]
- Shin, H.; Santamarina, J. Role of Particle Angularity on the Mechanical Behavior of Granular Mixtures. J. Geotech. Geoenviron. Eng. 2013, 139, 353–355. [Google Scholar] [CrossRef]
- Taylor, D.W. Fundamentals of Soil Mechanics; John Wiley & Sons: New York, NY, USA, 1948. [Google Scholar]
- Terzaghi, K.; Peck, R.B. Soil Mechanics in Engineering Practice; J. Wiley & Sons: New York, NY, USA, 1948. [Google Scholar]
- Chan, L.C.Y.; Page, N.W. Particle Fractal and Load Effects on Internal Friction in Powders. Powder Technol. 1997, 90, 259–266. [Google Scholar] [CrossRef]
- Santamarina, J.C.; Cho, G.C. Soil Behaviour: The Role of Particle Shape. In Advances in Geotechnical Engineering: The Skempton Conference; Conference Proceedings; Thomas Telford Publishing: Telford, UK, 2004; pp. 604–617. [Google Scholar] [CrossRef]
- Alshibli, K.A.; Cil, M.B. Influence of Particle Morphology on the Friction and Dilatancy of Sand. J. Geotech. Geoenviron. Eng. 2018, 144, 1–12. [Google Scholar] [CrossRef]
- Guo, P.; Su, X. Shear Strength, Interparticle Locking, and Dilatancy of Granular Materials. Can. Geotech. J. 2007, 44, 579–591. [Google Scholar] [CrossRef]
- Alshibli, K.A.; Alsaleh, M.I. Characterizing Surface Roughness and Shape of Sands Using Digital Microscopy. J. Comput. Civ. Eng. 2004, 18, 36–45. [Google Scholar] [CrossRef]
- Altuhafi, F.; Coop, M.; Georgiannou, V. Effect of Particle Shape on the Mechanical Behavior of Natural Sands. J. Geotech. Geoenviron. Eng. 2016, 142, 04016071. [Google Scholar] [CrossRef]
- White, H.E.; Walton, S.F. Particle Packing and Particle Shape. J. Am. Ceram. Soc. 1937, 20, 155–166. [Google Scholar] [CrossRef]
- Al Mahbub, A.; Haque, A. X-Ray Computed Tomography Imaging of the Microstructure of Sand Particles Subjected to High Pressure One-Dimensional Compression. Materials 2016, 9, 890. [Google Scholar] [CrossRef] [PubMed]
- Altuhafi, F.N.; Coop, M.R. Changes to Particle Characteristics Associated with the Compression of Sands. Geotechnique 2011, 61, 459–471. [Google Scholar] [CrossRef]
- Lade, P.V.; Yamamuro, J.A.; Bopp, P.A. Significance of Particle Crushing in Granular Materials. J. Geotech. Eng. 1996, 122, 309–316. [Google Scholar] [CrossRef]
- Lee, K.L.; Farhoomand, I. Compressibility And Crushing Of Granular Soil In Anisotropic Triaxial Compression. Can. Geotech. J. 1967, 4, 68–86. [Google Scholar] [CrossRef]
- Miura, K.; Maeda, K.; Furukawa, M.; Toki, S. Physical Characteristics of Sands with Different Primary Properties. Soils Found. 1997, 37, 53–64. [Google Scholar] [CrossRef]
- Einav, I. Breakage Mechanics—Part I: Theory. J. Mech. Phys. Solids 2007, 55, 1274–1297. [Google Scholar] [CrossRef]
- Hardin, B.O. Crushing of Soil Particles. J. Geotech. Eng. 1985, 111, 1177–1192. [Google Scholar] [CrossRef]
- Marsal, R.J. Large Scale Testing of Rockfill Materials. J. Soil Mech. Found. Div. 1967, 93, 27–43. [Google Scholar] [CrossRef]
- Altuhafi, F.; O’Sullivan, C.; Cavarretta, I. Analysis of an Image-Based Method to Quantify the Size and Shape of Sand Particles. J. Geotech. Geoenviron. Eng. 2013, 139, 1290–1307. [Google Scholar] [CrossRef]
- Huang, J.; Xu, S.; Hu, S. Influence of Particle Breakage on the Dynamic Compression Responses of Brittle Granular Materials. Mech. Mater. 2014, 68, 15–28. [Google Scholar] [CrossRef]
- Vilhar, G.; Jovičić, V.; Coop, M.R. The Role of Particle Breakage in the Mechanics of a Non-Plastic Silty Sand. Soils Found. 2013, 53, 91–104. [Google Scholar] [CrossRef]
- Zhang, X.; Baudet, B.A.; Hu, W.; Xu, Q. Characterisation of the Ultimate Particle Size Distribution of Uniform and Gap-Graded Soils. Soils Found. 2017, 57, 603–618. [Google Scholar] [CrossRef]
- Dishman, K.L.; Doolin, P.K.; Hoffman, J.F. Comparison of Particle Size of Cracking Catalyst Determined by Laser Light Scattering and Dry Sieve Methods. Ind. Eng. Chem. Res. 1993, 32, 1457–1463. [Google Scholar] [CrossRef]
- Ruckdeschel, P.; Dulle, M.; Honold, T.; Förster, S.; Karg, M.; Retsch, M. Monodisperse Hollow Silica Spheres: An in-Depth Scattering Analysis. Nano Res. 2016, 9, 1366–1376. [Google Scholar] [CrossRef]
- Coop, M.; Sorensen, K.; Bodas Freitas, T.; Georgoutsos, G. Particle Breakage during Shearing of a Carbonate Sand. Géotechnique 2004, 54, 157–163. [Google Scholar] [CrossRef]
- Hagerty, M.M.; Hite, D.R.; Ullrich, C.R.; Hagerty, D.J. One-dimensional High-pressure Compression of Granular Media. J. Geotech. Eng. 1993, 119, 1–18. [Google Scholar] [CrossRef]
- Cooper, W.L.; Breaux, B.A. Grain Fracture in Rapid Particulate Media Deformation and a Particulate Media Research Roadmap from the PMEE Workshops. Int. J. Fract. 2010, 162, 137–150. [Google Scholar] [CrossRef]
- Alam, M.; Haque, A.; Ranjith, P. A Study of the Particle-Level Fabric and Morphology of Granular Soils under One-Dimensional Compression Using Insitu X-Ray CT Imaging. Materials 2018, 11, 919. [Google Scholar] [CrossRef]
- Zheng, J.; Hryciw, R. Roundness and Sphericity of Soil Particles in Assemblies by Computational Geometry. J. Comput. Civ. Eng. 2016, 30, 04016021. [Google Scholar] [CrossRef]
- Krumbein, W.; Sloss, L. Stratigraphy and Sedimentation, 2nd ed.; W. H. Freeman: San Francisco, CA, USA, 1963. [Google Scholar]
- ASTM. Standard Test Methods for Maximum Index Density and Unit Weight of Soils Using a Vibratory Table; Technical Report D4253; ASTM International: West Conshohocken, PA, USA, 2014. [Google Scholar]
- ASTM. Standard Test Methods for Minimum Index Density and Unit Weight of Soils and Calculation of Relative Density; Technical Report D4254; ASTM International: West Conshohocken, PA, USA, 2014. [Google Scholar]
- Lade, P.V.; Liggio, C.D.; Yamamuro, J.A. Effects of Non-Plastic Fines on Minimum and Maximum Void Ratios of Sand. Geotech. Test. J. 1998, 21, 336–347. [Google Scholar]
- Presti, D.C.F.L.; Pedroni, S.; Crippa, V. Maximum Dry Density of Cohesionless Soils by Pluviation and by ASTM D 4253-83: A Comparative Study. Geotech. Test. J. 1992, 15, 180. [Google Scholar] [CrossRef]
- ASTM. Standard Test Methods for Particle-Size Distribution (Gradation) of Soils Using Sieve Analysis; ASTM D6913; ASTM International: West Conshohocken, PA, USA, 2017. [Google Scholar]
- Schneider, C.A.; Rasband, W.S.; Eliceiri, K.W. NIH Image to ImageJ: 25 Years of Image Analysis. Nat. Methods 2012, 9, 671–675. [Google Scholar] [CrossRef]
- Yamamuro, J.A.; Bopp, P.A.; Lade, P.V. One-Dimensional Compression of Sands at High Pressures. J. Geotech. Eng. Asce 1996, 122, 147–154. [Google Scholar] [CrossRef]
- ASTM. Standard Test Method for Consolidated Drained Triaxial Compression Test for Soils; Technical Report D7181; ASTM International: West Conshohocken, PA, USA, 2011. [Google Scholar] [CrossRef]
- ASTM. Standard Practice for Classification of Soils for Engineering Purpose (Unified Soil Classification System); D2487; ASTM International: West Conshohocken, PA, USA, 2011. [Google Scholar]
- Zhang, J.; Wong, T.; Davis, D. Micromechanics of Pressure-Induced Grain Crushing in Porous Rocks. J. Geophys. Res. Solid Earth 1990, 95, 341–352. [Google Scholar] [CrossRef]
- Brzesowsky, R.H.; Spiers, C.; Peach, C.; Hangx, S. Failure Behavior of Single Sand Grains: Theory versus Experiment. J. Geophys. Res. Solid Earth 2011, 116, B06205. [Google Scholar] [CrossRef]
- Kanda, Y.; Sano, S.; Saito, F.; Yashima, S. Relationships between Particle Size and Fracture Energy for Single Particle Crushing. KONA Powder Part. J. 1985, 3, 26–31. [Google Scholar] [CrossRef]
- King, R.; Bourgeois, F. Measurement of Fracture Energy during Single-Particle Fracture. Miner. Eng. 1993, 6, 353–367. [Google Scholar] [CrossRef]
- Kendall, K. The Impossibility of Comminuting Small Particles by Compression. Nature 1978, 272, 710. [Google Scholar] [CrossRef]
- Turner, A.K.; Kim, F.H.; Penumadu, D.; Herbold, E.B. Meso-Scale Framework for Modeling Granular Material Using Computed Tomography. Comput. Geotech. 2016, 76, 140–146. [Google Scholar] [CrossRef]
- McDowell, G.; Bolton, M. On the Micromechanics of Crushable Aggregates. Géotechnique 1998, 48, 667–679. [Google Scholar] [CrossRef]
- McDowell, G.; Bolton, M.; Robertson, D. The Fractal Crushing of Granular Materials. J. Mech. Phys. Solids 1996, 44, 2079–2101. [Google Scholar] [CrossRef]
- Tsoungui, O.; Vallet, D.; Charmet, J. Numerical Model of Crushing of Grains inside Two-Dimensional Granular Materials. Powder Technol. 1999, 105, 190–198. [Google Scholar] [CrossRef]
- Desu, R.K.; Annabattula, R.K. Particle Size Effects on the Contact Force Distribution in Compacted Polydisperse Granular Assemblies. Granul. Matter 2019, 21, 29. [Google Scholar] [CrossRef]
- Sharma, A.; Penumadu, D. Role of Particle Shape in Determining Tensile Strength and Energy Release in Diametrical Compression of Natural Silica Grains. Soils Found. 2020, 60, 1299–1311. [Google Scholar] [CrossRef]
- Sammis, C.; King, G.; Biegel, R. The Kinematics of Gouge Deformation. Pure Appl. Geophys. 1987, 125, 777–812. [Google Scholar] [CrossRef]
- Altuhafi, F.N.; Jardine, R.J.; Georgiannou, V.N.; Moinet, W.W. Effects of Particle Breakage and Stress Reversal on the Behaviour of Sand around Displacement Piles. Géotechnique 2018, 68, 546–555. [Google Scholar] [CrossRef]
- Alshibli, K.A.; Batiste, S.N.; Sture, S. Strain Localization in Sand: Plane Strain versus Triaxial Compression. J. Geotech. Geoenviron. Eng. 2003, 129, 483–494. [Google Scholar] [CrossRef]
- Batiste, S.N.; Alshibli, K.A.; Sture, S.; Lankton, M. Shear Band Characterization of Triaxial Sand Specimens Using Computed Tomography. Geotech. Test. J. 2004, 27, 568–576. [Google Scholar] [CrossRef]
- Desrues, J.; Chambon, R.; Mokni, M.; Mazerolle, F. Void Ratio Evolution inside Shear Bands in Triaxial Sand Specimens Studied by Computed Tomography. Geotechnique 1996, 46, 529–546. [Google Scholar] [CrossRef]
- Alshibli, K.; Sture, S. Shear Band Formation in Plane Strain Experiments of Sand. J. Geotech. Geoenviron. Eng. 2000, 126, 495–503. [Google Scholar] [CrossRef]
- Leib, A.R.; Sharma, A.; Penumadu, D. Visualization of Localized Deformations of Sand in Drained Triaxial Compression Using Digital Image Correlation. Geotech. Test. J. 2020, 44, 782–798. [Google Scholar] [CrossRef]
- Bolton, M.D. The Strength and Dilatancy of Sands. Geotechnique 1986, 36, 65–78. [Google Scholar] [CrossRef]
- Vermeer, P.; de Borst, R. Non-Associated Plasticity for Soils, Concrete and Rock. Heron 1984, 29, 1–64. [Google Scholar]
- Vaid, Y.P.; Sasitharan, S. The Strength and Dilatancy of Sand. Can. Geotech. J. 1992, 29, 522–526. [Google Scholar] [CrossRef]


| Parameter | Siligran 0.125 to 0.71 | Ottawa Sand | Q-Rok |
|---|---|---|---|
| ASTM method | |||
| 0.507 | 0.630 | ||
| 0.689 | 0.901 | ||
| Cylinder method | |||
| 0.52 | 0.51 | 0.60 | |
| 0.78 | 0.75 | 1.01 | |
| Grain size distribution | |||
| [m] | 380 | 595 | 475 |
| [m] | 190 | 465 | 300 |
| 2.21 | 1.37 | 1.67 | |
| Classification | SP | SP | SP |
| Specimen | Volume [29] | Number [29] | Volume [31] | ||||
|---|---|---|---|---|---|---|---|
| OL | 389.9 | 288.1 | 1.35 | 266.0 | 0.19 | 1401 | 0.12 |
| OD | 389.9 | 283.1 | 1.38 | 266.0 | 0.53 | 502 | 0.15 |
| QL | 305.6 | 257.0 | 1.19 | 198.0 | 0.84 | 235 | 0.10 |
| QD | 305.6 | 269.0 | 1.14 | 198.0 | 0.20 | 988 | 0.09 |
| Specimen | [%] | [] | [] | [%] | [] | ||
|---|---|---|---|---|---|---|---|
| OL1 | 32.9 | 0.669 | 0.664 | 69 | 32.6 | 9.5 | 3.4 |
| OL2 | 26.9 | 0.683 | 0.676 | 103 | 31.2 | 8.2 | 2.2 |
| OL3 | 29.1 | 0.678 | 0.669 | 138 | 32.2 | 10.1 | 2.9 |
| OD1 | 97.4 | 0.518 | 0.515 | 69 | 41.6 | 2.1 | 22.2 |
| OD2 | 91.5 | 0.532 | 0.527 | 103 | 40.5 | 2.8 | 21.1 |
| OD3 | 96.6 | 0.520 | 0.514 | 138 | 39.1 | 2.5 | 23.6 |
| QL1 | 29.6 | 0.917 | 0.907 | 69 | 35.0 | 13.6 | 1.5 |
| QL2 | 35.8 | 0.897 | 0.885 | 103 | 34.9 | 12.8 | 1.7 |
| QL3 | 31.8 | 0.910 | 0.898 | 138 | 34.9 | 13.5 | 1.6 |
| QD1 | 91.7 | 0.716 | 0.711 | 69 | 42.0 | 2.6 | 14.8 |
| QD2 | 94.8 | 0.706 | 0.700 | 103 | 42.7 | 3.1 | 15.6 |
| QD3 | 94.1 | 0.708 | 0.700 | 138 | 42.6 | 3.1 | 15.1 |
| SL1 | 28.5 | 0.706 | 0.701 | 69 | 33.0 | 11.5 | 2.85 |
| SL2 | 19.7 | 0.728 | 0.721 | 103 | 34.2 | 14.2 | 2.69 |
| SL3 | 25.1 | 0.714 | 0.704 | 138 | 31.9 | 14.3 | 1.86 |
| SD1 | 113 | 0.485 | 0.482 | 69 | 44.4 | 3.0 | 16.7 |
| SD2 | 109 | 0.495 | 0.491 | 103 | 43.7 | 5.1 | 15.2 |
Publisher’s Note: MDPI stays neutral with regard to jurisdictional claims in published maps and institutional affiliations. |
© 2021 by the authors. Licensee MDPI, Basel, Switzerland. This article is an open access article distributed under the terms and conditions of the Creative Commons Attribution (CC BY) license (https://creativecommons.org/licenses/by/4.0/).
Share and Cite
Sharma, A.; Leib-Day, A.R.; Thakur, M.M.; Penumadu, D. Effect of Particle Morphology on Stiffness, Strength and Volumetric Behavior of Rounded and Angular Natural Sand. Materials 2021, 14, 3023. https://doi.org/10.3390/ma14113023
Sharma A, Leib-Day AR, Thakur MM, Penumadu D. Effect of Particle Morphology on Stiffness, Strength and Volumetric Behavior of Rounded and Angular Natural Sand. Materials. 2021; 14(11):3023. https://doi.org/10.3390/ma14113023
Chicago/Turabian StyleSharma, Aashish, Alexia R. Leib-Day, Mohmad Mohsin Thakur, and Dayakar Penumadu. 2021. "Effect of Particle Morphology on Stiffness, Strength and Volumetric Behavior of Rounded and Angular Natural Sand" Materials 14, no. 11: 3023. https://doi.org/10.3390/ma14113023
APA StyleSharma, A., Leib-Day, A. R., Thakur, M. M., & Penumadu, D. (2021). Effect of Particle Morphology on Stiffness, Strength and Volumetric Behavior of Rounded and Angular Natural Sand. Materials, 14(11), 3023. https://doi.org/10.3390/ma14113023