Article

How Can the Introduction of Zr4+ Ions into TiO2 Nanomaterial Impact the DSSC Photoconversion Efficiency? A Comprehensive Theoretical and Experimental Consideration

by
Aleksandra Bartkowiak
1,2,*,
Oleksandr Korolevych
3,
Gian Luca Chiarello
2,
Malgorzata Makowska-Janusik
3 and
Maciej Zalas
1,*
1
Faculty of Chemistry, Adam Mickiewicz University, Uniwersytetu Poznańskiego 8, 61-614 Poznań, Poland
2
Department of Chemistry, University of Milan, Via Golgi 19, 20133 Milano, Italy
3
Faculty of Science and Technology, Jan Dlugosz University, Al. Armii Krajowej 13/15, 42-200 Częstochowa, Poland
*
Authors to whom correspondence should be addressed.
Materials 2021, 14(11), 2955; https://doi.org/10.3390/ma14112955
Submission received: 26 April 2021 / Revised: 19 May 2021 / Accepted: 25 May 2021 / Published: 30 May 2021
(This article belongs to the Special Issue Recent Development in Dye-Sensitized and Organic Solar Cells)

Abstract

:
A series of pure and doped TiO2 nanomaterials with different Zr4+ ions content have been synthesized by the simple sol-gel method. Both types of materials (nanopowders and nanofilms scratched off of the working electrode’s surface) have been characterized in detail by XRD, TEM, and Raman techniques. Inserting dopant ions into the TiO2 structure has resulted in inhibition of crystal growth and prevention of phase transformation. The role of Zr4+ ions in this process was explained by performing computer simulations. The three structures such as pure anatase, Zr-doped TiO2, and tetragonal ZrO2 have been investigated using density functional theory extended by Hubbard correction. The computational calculations correlate well with experimental results. Formation of defects and broadening of energy bandgap in defected Zr-doped materials have been confirmed. It turned out that the oxygen vacancies with substituting Zr4+ ions in TiO2 structure have a positive influence on the performance of dye-sensitized solar cells. The overall photoconversion efficiency enhancement up to 8.63% by introducing 3.7% Zr4+ ions into the TiO2 has been confirmed by I-V curves, EIS, and IPCE measurements. Such efficiency of DSSC utilizing the working electrode made by Zr4+ ions substituted into TiO2 material lattice has been for the first time reported.

Graphical Abstract

1. Introduction

In the last few decades, many scientific papers have focused on research on the generation and storage of energy, e.g., batteries, supercapacitors, wind turbines (wind farm), heat exchangers (geothermal energy) [1,2,3,4,5]. The year 1991 marked a significant milestone in the photovoltaic technology world due to the first highly efficient dye-sensitized solar cells (DSSCs) invented by O’Regan and Grätzel [6]. This breakthrough invention has been extensively developed for the last 30 years by worldwide scientists (about 29,770 records of scientific articles may be found in databases). Due to many advantages, such as inexpensive manufacturing costs using non-toxic substrates and leaving a remarkably lower carbon footprint, as well as workability under indoor ambient light, DSSCs are a promising alternative to the other types of solar cells [7]. It is still worth developing a technology that uses renewable energy sources such as solar light from an ecological perspective. Over 85% of humanity’s energy demand is met by fossil fuels, leading to severe climate changes such as global warming and depletion of our planet’s natural sources [8]. Moreover, the announced 2020 pandemic of coronavirus SARS-Cov-2 shows how reducing car transport (through introducing, e.g., remote learning and work) and decreasing energy consumption caused a drop in greenhouse gases emission [9]. That leads to the statement that changing some habits and a few factors can positively affect the environment. The issues mentioned above confirm the validity of supporting sustainable energy sources and developing technologies in line with the Internet of Things (IoT) concept. Unlike silicon photovoltaic cells, recent reports indicate that DSSCs can efficiently convert solar energy into electricity even under low light conditions. DSSCs work either on a cloudy day, installed on the building’s façade, or under ambient conditions, powering household appliances, which make them even more promising [10,11].
DSSCs consists of three essential parts: photoanode (usually a metalorganic dye adsorbed on a semiconductor metal oxide), electrolyte, and a counter electrode. The dye’s electron is excited by photon absorption from the ground state and injected into the semiconductor’s conduction band [12]. Subsequently, electrons from the conduction band are transported through the external circuit to the counter electrode, acting as an electron collector [13]. Finally, a redox mediator in the electrolyte regenerates the dye. Although all of the DSSC elements are equally important for a proper working principle, in this paper, we focused on one of the photoanode components—titanium dioxide.
Titanium dioxide (TiO2) has large numbers of polymorphs depending on pressure and temperature formation, and the most common are rutile, anatase, and brookite [14,15]. The typical DSSCs photoanodes are created with TiO2 in anatase form {I41/amd, No. 141} [16,17], or with mixture of anatase and rutile {P42/mnm, No. 136}. However, it should be considered that rutile has less efficient charge transport properties than pure anatase. Unfortunately, the main problem of the anatase form is its instability and thermal phase transformation to rutile [18]. However, it was shown that doping titania with zirconium, such as Ti1−xZrxO2, with x = 0.1, can thermally stabilize anatase, preventing its transition to rutile [14]. Unfortunately, doping with zirconium led to a widening of the energy bandgap compared to the undoped one. That is because the energy gap of ZrO2 is higher than 5 eV compared to the ca. 3.2 eV of anatase [14].
A number of researchers have investigated the effect of TiO2 doped with Zr4+ ions on the physicochemical properties and electrical performance of DSSCs. The most common preparation technique of nanosized TiO2 is the sol-gel method, but other synthetic approaches such as the solvothermal process and electrospinning have also been used [19,20,21,22]. Properly selected techniques provide different advantages, such as better size control, due to automatization of process or higher crystallinity and obtaining single-phase products. Chattopadhyay et al. synthesized spiky-shaped TiO2 nanocrystals doped with Zr4+ by solvothermal method and showed enhancement in their photoactivity up to 7.52% in comparison to the commercially used P25 (4.20%) as well as very high short-circuit photocurrent density value (21.83 mA/cm2) [21]. Similarly, Cavallo and coworkers synthesized undoped and TiO2 doped with 0.1–0.3% Zr4+ ions with 7% photoconversion efficiency with charge injection enhancement after introducing dopant ions [23]. Pasche, with coauthors, conducted an extensive study about the influence of annealing temperature and concentration of Zr4+ ions on the performance of DSSC [24]. They proved that introducing Zr4+ ions at a higher temperature of sintering (>400 °C) inhibits thermal degradation and boosts the overall efficiency of DSSC. One-dimensional (1D) nanofibers doped with zirconium ions were also analyzed by Mohamed et al. [25]. The enhancement of electron transfer in the TiO2:1%Zr nanofibers synthesized using electrospinning technique and increment of dye amount loaded on their surface was observed. It led to the obtainment of 4.51% DSSC performance value. In other studies, the increment of electron diffusion coefficient values, chemical capacitance, and overall efficiency of DSSC caused by the insertion of Zr4+ ions into 1D TiO2 have been described [22]. Data from selected publications are summarized in Table 1.
In this work, we synthesized Zr4+-doped TiO2 nanomaterials used as a photoanode component of DSSCs, leading to an unprecedented 8.63% photoconversion efficiency. The complex structural and photophysical research of semiconducting nanopowders and working electrodes with different content of Zr4+ ions have been made. Moreover, to characterize the role of the Zr4+ ions in TiO2 structures and to explain their influence on electronic properties of anodes, extensive theoretical calculations were performed using density functional theory (DFT) with Hubbard correction.

2. Materials and Methods

2.1. Computer Simulations

Electronic properties of the TiO2 crystals cannot be computed correctly by standard density functional theory (DFT). The origin of the DFT failure in transition metal oxides is associated with an inadequate description of the strong Coulomb repulsion between 3D electrons localized on metal ions [26]. In many research works, the hybrid DFT functionals or Hubbard corrections were implemented to improve the computational results [27,28].
In the presented work, structural and electronic properties of the TiO2 anatase crystal structure (a-TiO2) were calculated using the Vienna ab initio simulation package (VASP) (Version vasp.5.4.4, VASP Software GmbH, Vienna, Austria). The sw-GW basis set was used for all atoms in the system. The calculations were performed applying DFT/GGA methodology using PBE functional with Hubbard correction. The Hubbard correction was implemented into calculations as rotationally invariant LSDA+U introduced by Liechtenstein et al. [29], where the U and J as screened Coulomb and exchange parameters, respectively, are used. The Hubbard correction was applied for 3d electrons of Ti atoms, where UTi = 6 eV and JTi = 1 eV [28]. The energy cut-off for the plane-wave basis set was fixed at the value of 520 eV. The reciprocal space sampling was done with k-point Monkhorst-Pack grid 8 × 8 × 8.
First, the a-TiO2 crystal structure was fully relaxed to obtain a minimum of total energy. In the mentioned procedure, cell parameters, volume, and atomic position have the possibility of changes. The crystals’ electronic properties were calculated in the Brillouin zone’s points specified in Figure 1, following the path G-X-M-G-Z-R-A-Z[X-R]M-A [30].
The supercell was built by repeating anatase unit cell as 2 × 2 × 1 to calculate structural and electronic properties of defected TiO2 crystal structures. In this case, the reciprocal space sampling was also done with k-point Monckhorst-Pack grids 8 × 8 × 8. The supercell’s electronic properties were calculated following a simple path in the Brillouin zone depicted as G-F-Q-Z-G, where F (0, 0.5, 0) and Q (0, 0.5, 0.5). In this case, all other computational parameters remained the same as described above. The TiO2 defected structures were built by removing one O atom or one Ti atom from the crystal supercell in anatase form. In addition, the electronic properties of the TiO2 structure doped by the Zr atom were calculated. The Hubbard correction was applied for 4d electrons of Zr atoms using UZr = 6 eV, JZr = 1 eV [28]. Electronic properties of the tetragonal ZrO2 crystal structure (t-ZrO2) were also calculated to check applied parameters’ correctness. The electronic properties were calculated applying Hubbard parameters UTi = UZr = 9.25 eV and JTi = JZr = 1.00 eV.

2.2. Materials

Titanium (IV) isopropoxide (TTIP, 97%, Sigma Aldrich, St. Louis, MO, USA), zirconium (IV) n-propoxide (ZrP, solution 70 wt% in 1-propanol, Sigma Aldrich, St. Louis, MO, USA), acetic acid (p.a., POCh, Gliwice, Poland), nitric acid (p.a., POCh, Gliwice, Poland), and freshly distilled before synthesis 2-propanol (99.8%, WITKO, Poland) were used for synthesis. Titanium (IV) chloride (99.9%, Sigma Aldrich, St. Louis, MO, USA), anhydrous ethanol (p.a., POCh, Gliwice, Poland), acetone (p.a., PPH Stanlab, Poland), cis-Bis(isothiocyanato)bis(2,2′-bipyridyl-4,4′-dicarboxylato)ruthenium(II) (N3 dye, 95% NMR, Sigma Aldrich, St. Louis, MO, USA), chloroplatinic acid (99.9% Merck, Darmstadt, Germany), ammonia water solution (25%, p.a. POCh, Gliwice, Poland), α-Terpineol (96%, Sigma-Aldrich, St. Louis, MO, USA), and ethylcellulose (p.a., Sigma-Aldrich St. Louis, MO, USA) were applied, among others, for cleaning TCO glass and preparing 10−4 M dye’s solution, titania’s pastes, protective coating of TiO2, Pt electrodes and the dye desorption process. The electrolyte mixture consisted of 0.03 M iodine (Sigma Aldrich, St. Louis, MO, USA), 0.6 M 1-propyl-3-methyl-imidazolium iodide (Sigma Aldrich, St. Louis, MO, USA), 0.1 M guanidine thiocyanate (Sigma Aldrich, St. Louis, MO, USA), and 0.5 M 4-tert-butylpiridine (Sigma Aldrich, St. Louis, MO, USA) in acetonitrile (p.a., POCh, Gliwice, Poland). TCO22-7 FTO glass (Solaronix, Aubonne, Switzerland) and ionomeric foil Meltonic (Solaronix, Aubonne, Switzerland) were used as substrates and sealing material, respectively. P25 Aeroxide (Evonik, Essen, Germany) was used as a reference titanium dioxide nanopowder. Deionized water was employed at every step of the experiment.

2.3. Preparation Method

The synthesis of materials was performed applying a modified version of the sol-gel method [31]. Generally, 0.592 mL of TTIP (and 9.06 µL, 27.73 µL or 47.18 µL of ZrP were designated as 1.2%, 3.7%, and 5.6% of Zr4+ ions, respectively, in the case of doped TiO2) was added to 200 mL of 2-propanol in a two-neck round bottom flask and mixed for 15 min. Vigorous stirring occurred throughout the whole process. Subsequently, the mixture of 10 mM acetic acid in 100 mL of isopropanol was added dropwise for another 40 min. In the next step, 30 mL of deionized water was introduced to the as-prepared solution with a 0.5 mL/min flow rate by a syringe pump (MEDIMA S200) (Medima, Warszawa, Poland). Afterward, 0.4 mL of nitric acid was injected, and the mixture was heated under reflux for 75 min. Finally, additional 7 mL of deionized water was added, and the reaction was refluxed for 24 h. The as-obtained colloidal solution was filtered under reduced pressure (Whatman NL17 Polyamide Membrane Filters 0.45 µm) (Whatman plc part of Cytiva, Marlborough, MA, USA), washed with ethanol several times, and dried overnight at 60 °C. Samples were divided into three parts. One of them was analyzed by FT-IR and TGA-DTA techniques, the second was annealed at 450 °C for 2 h with a 7.5 °C/min ramp rate for further analyses, and the last one was used for viscous paste preparation.

2.4. DSSC Fabrication

Before the cell’s fabrication, FTO substrates were sonicated for 30 min in a 1:1 (v/v) acetone and ethanol mixture. The viscous paste was prepared by mixing particulate samples with other components based on a ratio: 1 g of nanopowder, 1 mL of acetic acid, and 20 mL of ethanol, and it was kept in an ultrasound bath for 3 h. Afterward, a solution of 1.5 g of ethylcellulose, 10 mL of α-terpineol, and 13.5 g of ethanol was added to a nanopowders colloid. The above mixture was kept in an ultrasound bath for 1 h and finally stirred overnight [32]. Finally, the excess of ethanol was evaporated, and paste was spread on FTO glass via the “doctor blade” technique with scotch tape as a template (62.5 µm of thickness). Next, FTO substrates with TiO2 layers were calcined in the air for 2 h at 450 °C with a ramp rate of 7.5 °C/min. As-prepared photoelectrodes were immersed in a 40 mM aqueous solution of TiCl4 for 1 h at 70 °C. Subsequently, working electrodes were washed with water and ethanol, dried in hot air, and again annealed for 30 min at 450 °C. Finally, photoanodes were sensitized overnight with a 10−4 M N3 dye solution in a staining chamber. Counter electrodes were prepared by wiping predrilled FTO glass with a tissue soaked in H2PtCl6 ethanolic solution (23 g/L of Pt) and then annealed at 450 °C for 30 min. Finally, photoelectrodes were combined with a 25 μm thick ionomeric foil as a sealant and a spacer. The electrolyte was injected through two holes predrilled in the photocathodes, and the devices were finally sealed by hot melted foil and microscopic slide. The typical active area of the cells presented in this work was approximately 0.125 cm2.

2.5. Dye Loading Determination

Additionally, the particular working electrodes with an active area of about 3 cm2 were prepared to determine the dye amount adsorbed on the TiO2 film surface. These photoanodes were immersed in a 2 M ammonia solution in ethanol for 30 min to investigate the number of dye molecules adsorbed on the TiO2 films. Afterward, the desorbed dye concentration in the obtained solution was examined using UV-Vis measurement at 310 nm based on the calibration curve. The above procedure has been made for five electrodes of each type, and the presented results are the average of these five measurements.

2.6. Characterization

The structural analyses were employed using the X-ray diffraction (XRD) examination on the D8 Advance diffractometer (Bruker, Billerica, MA, USA) with λ = 0.15406 nm Cu Kα radiation. The reference patterns of anatase, rutile, brookite, and tin oxide were taken from the International Centre for Diffraction Data (ICDD). Scherrer’s equation was applied to determine the crystallites’ size [33]:
D h k l = K λ β h k l c o s θ ,
where Dhkl is a crystallite size, K is a shape factor equal to 0.9, λ is a radiation wavelength (0.15406 nm), βhkl is the line broadening half the maximum intensity (FWHM) in radians, and θ is the Bragg angle. While the lattice parameters (a and c) were calculated based on the equation for tetragonal type of phase [34,35]:
1 d 2 = h 2 + k 2 a 2 + l 2 c 2 ,
where d is the interplanar spacing:
d = λ 2   s i n θ ,
For calculation, the (004) and (200) reflexes were used.
Transmission electron microscopy (TEM) images were recorded on a Hitachi HT7700 microscope (Hitachi, Tokyo, Japan), operating at an accelerating voltage of 100 kV. Samples were dispersed in ethanol and sonicated for 5 min, then deposited at copper grids coated with carbon. Scanning electron microscopy (SEM) images and energy-dispersive X-ray spectroscopy (EDS) were taken on FEI Quanta FEG 250 (FEI Company, Hillsboro, OR, USA) at 30 kV. The concentration of dopant ions in TiO2 nanoparticles was examined via X-ray fluorescence spectroscopy (XRF) on MiniPal2 apparatus (PANalytical B.V., Almelo, The Netherlands). The calibration curve was prepared by mixing ZrO2 and P25 with the increasing amount of the latter. Subsequently, all powders were ground in a ball mill (Mixer/Mill 8000M, Spex, New York, NY, USA) equipped with a zirconia ceramic vial set for 30 min. Fourier transforms infrared (FTIR) spectra were registered on an IFS-66/s spectrometer (Bruker, Billerica, MA, USA) using KBr powder as a dilutant. The samples’ structure was also investigated using an inVia Raman microscope (Renishaw plc, Wotton-under-Edge, UK) with an excitation beam at 514 nm. The phonon lifetimes were calculated for Eg mode, based on the relation of the energy-time uncertainty:
1 τ = Δ E = 2 π c Γ ,
where ΔE is uncertainty in phonon mode’s energy, ℏ indicates Planck’s constant, c is the speed of light, and Γ is the FWHM of the Raman peaks (cm−1). The bandgap’s width was determined via diffuse-reflectance spectroscopy (DRS) on Cary 5000 spectrometer (Varian, Palo Alto, CA, USA) equipped with a 100 mm diameter integrating sphere and using a BaSO4 powder as a reference—total reflectance material. The bandgap value was established by plotting the Tauc Equation:
( α h υ ) n = A ( h υ E b g ) ,
where is the energy of an incident photon, α is absorption coefficient, n determines electronic transitions linked to the absorption processes (n = ½ allowed indirect), A describes a constant, and the Ebg is a bandgap.
The N2 adsorption-desorption isotherms at 77 K curves were recorded by a Nova 1200e sorptometer (Quantachrome Instruments, Boynton Beach, FL, USA). Specific surface area was determined using Brunauer-Emmett-Teller (BET) method and simultaneously, the average pore volumes (Vp) and diameters (Sp) were calculated using a Barrett–Joyner–Halenda (BJH) equation based on the desorption branch. The electron paramagnetic resonance (EPR) spectra were recorded at 77 K. They were run on an X-band (~8.9 GHz) CW-EPR SE/X-2547 spectrometer (Radiopan, Poznań, Poland) with a reflection type resonator and 100 kHz modulation of the magnetic field. X-ray Photoelectron Spectroscopy (XPS) was carried out at ultra-high vacuum (<2 × 10⁻⁸ mbar) on spectrometer SPECS Surface Nano Analysis GmbH (Berlin, Germany) to determine the surface bonding and atomic concentration. The binding energies of all peaks were corrected and shifted concerning the C 1s signal, defined as an adventitious carbon with a set value of 284.8 eV, to yield meaningful results. Ultraviolet Photoelectron Spectroscopy (UPS) measurements were carried out on the same equipment as XPS measurements with UVS 10/35 light source and He I 21.2 eV ionization source. The Jupiter STA 449 F3 (Netzsch GmbH, Selb, Germany) experimental equipment was applied for thermogravimetric analysis and developed in the air atmosphere and 30–1000 °C temperature range (10 °C/min). The amount of dye adsorbed on titania films was determined via the UV-Vis technique on a Cary 50 (Varian, Palo Alto, CA, USA) spectrometer. The current density and photovoltage characteristics (J-V), as well as electrochemical impedance spectroscopy (EIS), was conducted on Gamry Interface 1000 Potentiostat/Galvanostat/ZRA (Gamry Instruments, Warminster, PA, USA) with Sun 2000 Solar Simulator (ABET Technologies, Inc., Milford, MA, USA) light source under the simulated AM 1.5G (100 mW/cm2) conditions. The efficiency (η) and fill factor (FF) values were calculated based on the following Equations:
η = P M A X P I N = V O C × J S C × F F P I N × 100 % ,
F F = J M A X × V M A X J S C × V O C × 100 % ,
where PMAX is maximum device power, VOC is open circuit photovoltage, JSC is short circuit photocurrent density, FF is fill factor, and PIN is the power of incident light.
Electron lifetime (τ) have been calculated using the frequency (f) of the maximum point at the mid-frequency arc of the Bode plot according to the Equation:
τ = ( 2 π f ) 1 .
Incident photon-to-current efficiency (IPCE) measurements were developed on Bentham PVE300 EQE/IPCE (Bentham Instruments Limited, Reading Berkshire, UK). The IPCE is a conversion ratio between the number of charge carriers collected to the cell to the number of photons of a given energy.

3. Results and Discussion

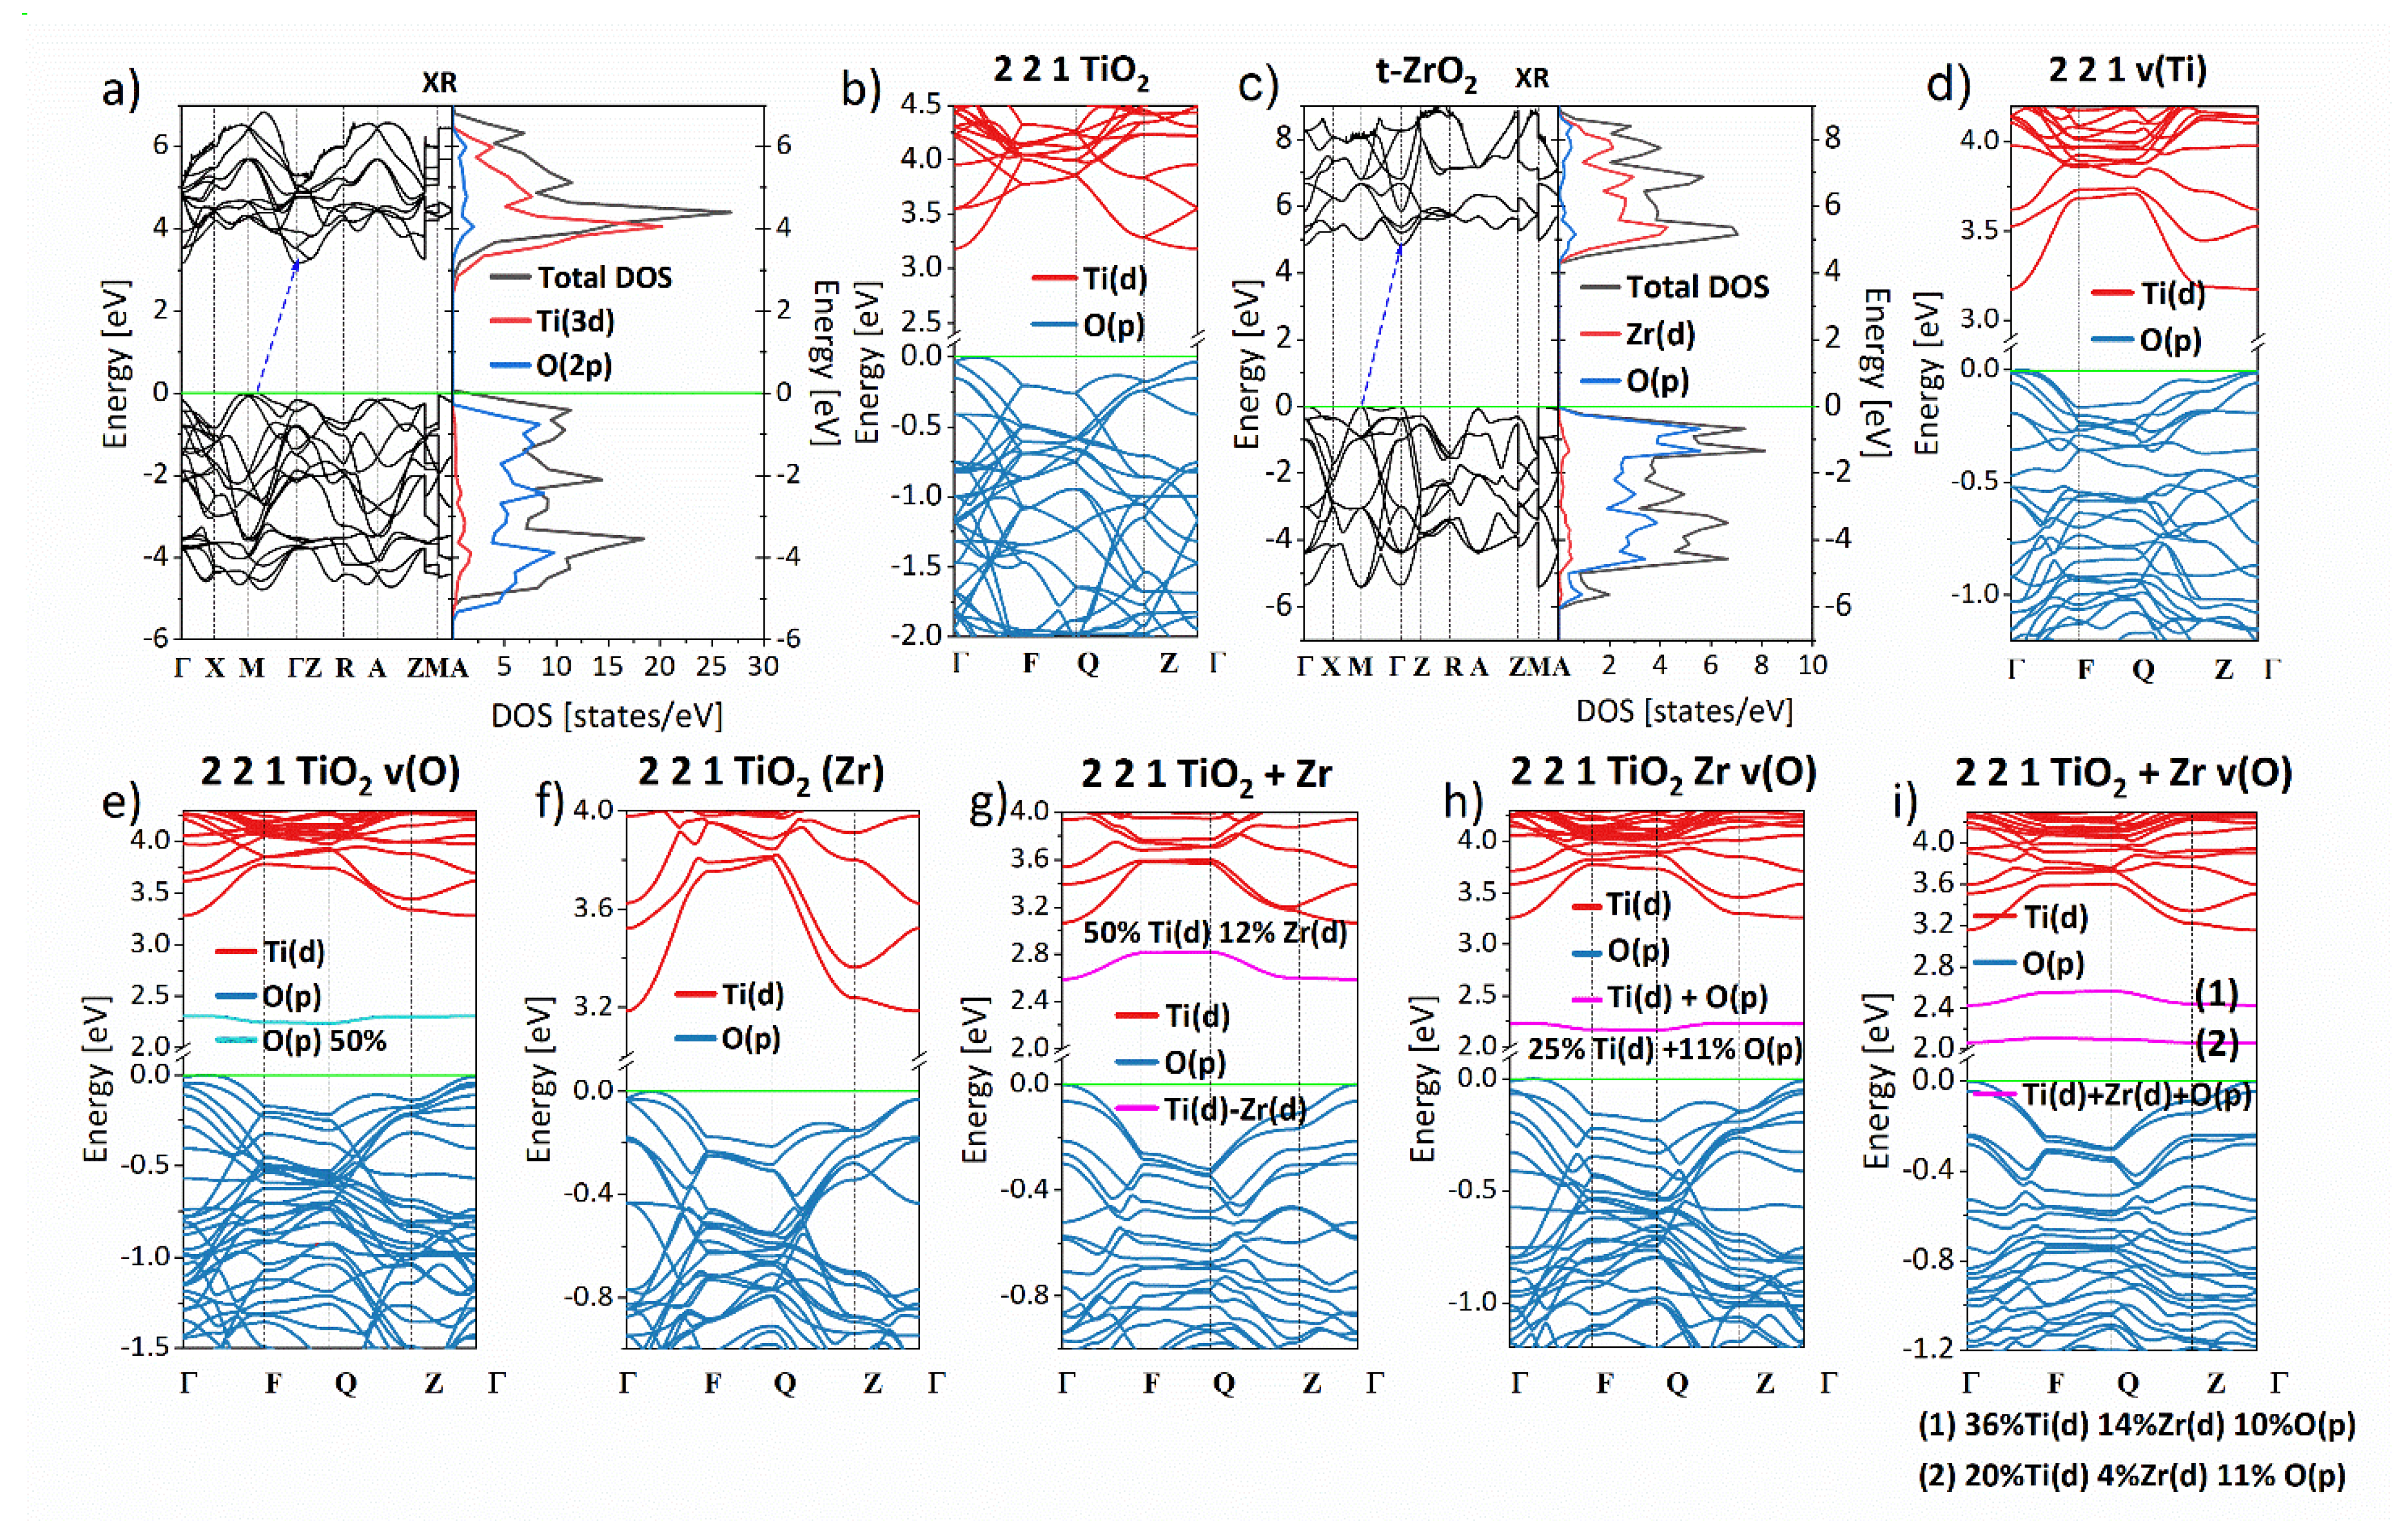
3.1. Theoretical Calculations

3.1.1. Structural Properties

The a-TiO2 and t-ZrO2 crystal structures were relaxed applying DFT/PBE+U method, and the obtained unit cell parameters are presented in Table 2. These results show that the DFT/PBE+U method with UTi = 6 eV and JTi = 1 eV reproduces the structure of the a-TiO2 acceptably. One can see that the modeled unit cell of the a-TiO2 is slightly larger than the experimentally studied one. However, the deviation of the lattice parameters compared to experimentally obtained data is less than 2.1%. It allows us to conclude that the obtained structure can be used to calculate the electronic properties of the a-TiO2 crystal. Moreover, the t-ZrO2 crystal unit cell’s side lengths are also overestimated using the DFT/PBE + U method. It should be noted that all computational parameters were used the same as for a-TiO2. In the case of the t-ZrO2, the deviation of obtained lattice parameters from experimental data measured in temperature 293 K is less than 2.3% and is less than 1% for the ones investigated in temperature equal to 1543 K [36,37]. One can conclude that the quantum-chemical calculations based on the DFT method with chosen Hubbard parameter reproduce the experimental structure of studied crystals. Additionally, comparing total energies per atom of both structures, it can be said that the t-ZrO2 is more stable than the structure of the a-TiO2. It is caused by the fact that the Zr-O interaction is stronger than the Ti-O interplay.
In the a-TiO2 crystal structure, six O atoms creating octahedron (see Figure S1 at Supplementary Materials) surround each Ti atom. The Ti-O bonds along c direction are longer than those lying in the ab plane, and they are equal to 1.966 Å and 1.937 Å, respectively [41]. Both calculated Ti-O bonds are longer than the experimental ones, and they are equal to 2.001 Å and 1.967 Å, respectively. The spicier of the octahedron is slightly longer. Although the modeled Ti-O bonds are more extended than the experimental results, the O-Ti-O angles are almost identical. Experimental angles are equal to 102′38 and 92′60, and the modeled ones are equal to 102′23 and 92′57. Obtained results confirm that performed calculations well reproduce the structure of the a-TiO2.
In the t-ZrO2, each zirconium atom maintains its eight oxygen coordination: four oxygen atoms at a distance of ~2.10 Å and four at a distance of ~2.30 Å [42]. Performed calculations give a length of these bounds equal to 2.18 Å and 2.32 Å, respectively. It can be concluded, comparing the theoretical data with the experimental ones, that the DFT method with the adopted Hubbard parameters well reflects the structure of a-TiO2 and t-ZrO2 crystals.
To investigate defected structures with vacancies or dopants not exceeding a few percent of the tested material’s composition, the supercell of the a-TiO2 was built. The new supercell was constructed by 2 × 2 × 1 repetition of the a-TiO2 unit cell. The constructed a-TiO2 supercell (2 × 2 × 1 TiO2) was also relaxed applying the DFT/PBE+U method (UTi = 6eV, and JTi = 1 eV). Analyzing data collected in Table 2 shows that the supercell parameters are equal to the a-TiO2 unit cell parameters. The total energy per atom for the unit cell of the a-TiO2 and supercell is also the same. It means that the constructed supercell can be used for further calculations.
The oxygen v(O) and titanium v(Ti) vacancies were introduced into the 2 × 2 × 1 TiO2 supercell. One oxygen or titanium atom was removed from the structure giving a 6% crystal defect in both situations. Oxygen vacancies (2 × 2 × 1 TiO2 v(O), see Table 2) practically do not change unit cell lengths compare to the stoichiometric crystal (2 × 2 × 1 TiO2). The changes are more significant for the titanium vacancies (2 × 2 × 1 TiO2 v(Ti)). Consequently, the volume of the unit cell diminishes with the existence of the v(Ti). One can also see that the total energy per atom increases with oxygen and titanium vacancies compared to the stoichiometric a-TiO2 crystal. It means that the defective structure is less stable than the stoichiometric crystal. However, it is worth noticing that oxygen vacancies stabilize the structure more than titanium vacancies.
The 2 × 2 × 1 TiO2 structure was doped by Zr4+ ions located in interstitial position (2 × 2 × 1 TiO2 + Zr) or substituting the Ti atom (2 × 2 × 1 TiO2Zr). A total energy per atom is lower in the case of substituting than an interstitial Zr atom. It should also be noted that the 2 × 2 × 1 TiO2 structure doped by replacing Zr atom (2 × 2 × 1 TiO2Zr) is more stable than the pure a-TiO2 crystal structure, but the energy of the 2 × 2 × 1 TiO2 + Zr is comparable to the total energy of the 2 × 2 × 1 TiO2. It allows us to conclude that about 6% of the Zr dopants stabilizes the a-TiO2 crystal structure. The Zr dopants do not change the parameters of the a-TiO2 crystal unit cell significantly. However, in both cases, the unit cell increases compared to the 2 × 2 × 1 TiO2 crystal structure. It is caused by an increase in the sides a and b of the unit cell. The length of side c remains unchanged in both instances of the substitution of the Zr atom.
The 2 × 2 × 1 TiO2 crystal structures doped by Zr atoms were also modeled with oxygen vacancies. The v(O) was created close to the Zr atom and far from the Zr atom. They have been marked as 2 × 2 × 1 TiO2Zr v(O), 2 × 2 × 1 TiO2+Zr v(O), and 2 × 2 × 1 TiO2Zr v(O)far, 2 × 2 × 1 TiO2+Zr v(O)far, respectively. The oxygen vacancies present in Zr doped a-TiO2 structure do not stabilize the crystal more compared to the 2 × 2 × 1 TiO2Zr and 2 × 2 × 1 TiO2 + Zr structures, respectively. One can conclude that as was observed for the virgin a-TiO2, vacancies destabilize the crystals. However, structures 2 × 2 × 1 TiO2Zr v(O) and 2 × 2 × 1 TiO2Zr v(O) possess total energy per atom than the energy of the non-doped a-TiO2 structure. The Zr doping of the a-TiO2 v(Ti) structure was not modeled due to the high total energy per atom of the a-TiO2 structure with Ti vacancies.
Analyzing performed calculations, it can be concluded that the most probable are a-TiO2 structures doped by Zr in substituting position with oxygen vacancies far from Zr atom. It means that the Zr atoms should be observed in the Zr4+ state, but the titanium atoms should be observed in Ti4+ and Ti3+ state.

3.1.2. Electronic Properties of a-TiO2 and t-ZrO2

One of the most essential and common parameters representing the properties of crystals is their bandgap. The calculated energy gap compared with experimentally obtained data can check the calculation’s correctness method. Performed calculations of electron properties of the a-TiO2 crystal proved that the Hubbard correction parameters are not universal. The optimization procedure of studied structures, giving good results was performed with parameters UTi = UZr =6 eV and JTi = JZr = 1 eV. Unfortunately, the bandgap value calculated with that parameter is underestimated, offering the same values as the conventional DFT method (in the case of a-TiO2 Eg ∼ 2.2 eV and t-ZrO2 Eg ∼ 3.8 eV). Therefore, the a-TiO2 crystal structure electronic properties were calculated with Hubbard parameters UTi = 9, 9.1, 9.25, 9.50, 9.75, and with JTi = 1. However, the correct energy gap compared with the experiment was obtained using UTi = 9.25 eV and JTi = 1. It was also proved that the same parameter works well for calculations performed for t-ZrO2.
The energy band structure and the electron density of states (DOS), calculated for the a-TiO2 using the parameters mentioned above, is presented in Figure 2a,b. One may see that the a-TiO2 is an indirect semiconductor with a calculated energy gap equal to 3.16 eV. It is in good agreement with an experimentally measured energy bandgap of a-TiO2 equal to 3.20 eV. The a-TiO2 is a typical metal oxide of the form AB2 for which O 2p electrons create the valence band, and d-Ti states construct the conduction band.
Electronic properties of the (2 × 2 × 1 TiO2) supercell were also calculated to check the correctness of the chosen model, and the obtained data are presented in Figure 2b. Comparing two energy band structures calculated for the a-TiO2 and the 2 × 2 × 1 TiO2 structure, one can conclude that the extension of the primitive unit cell to the supercell does not change its electronic parameters. It means that the proposed supercell can reproduce the character of the a-TiO2 crystal structure.
The energy band structure was also calculated for the t-ZrO2 crystal using the same computational parameters as implemented for the a-TiO2. The obtained results are presented in Figure 2c. The t-ZrO2 crystal valence band, as in the case of the a-TiO2 crystal, is built with oxygen states and a conduction band with zirconium states. The t-ZrO2 is also an indirect semiconductor with a bandgap equal to 4.83 eV that is in satisfactory agreement compared to the experimentally measured energy gap equal to 5.0 eV [14]. Calculations performed for a-TiO2 and t-ZrO2 conclude that the implemented DFT quantum-chemical method augmented by Hubbard correction with U and J parameters specially selected for relaxation of the crystals and their electronic properties calculations can be used to study doped and defected a-TiO2.
The 2 × 2 × 1 TiO2 structure was used to calculate properties of the defected a-TiO2 crystal. Two kinds of defects were constructed: oxygen vacancies v(O) and titanium vacancies v(Ti). Calculated energy band structures are presented in Figure 2d–e. Comparing the energy band structure obtained for 2 × 2 × 1 TiO2 (see Figure 2b) and the ones presented in Figure 2d–e, it may be seen that vacancies do not change the shape of the valence bad. However, both vacancies change the bottom of the conduction band. Comparing these data to results obtained for virgin a-TiO2 structure, one can see that low-lying conductionbands of defected structures are less dispersed. They do not cross one other. Additionally, the v(O) creates an additional occupied energy band located in the bandgap region. This band is constructed mainly by oxygen states, but its DOS intensity is very low.
Electronic properties of the Zr4+-doped a-TiO2 crystal structure were also calculated. In one case, the Zr atoms replace the Ti atoms, but in the second case, the Zr atoms are in an interstitial position. The amount of dopants is equal to 6%. The energy band structures calculated for the Zr4+-doped crystals are presented in Figure 2f,g. The energy band structure calculated for the 2 × 2 × 1 TiO2Zr looks like the structure calculated for a-TiO2 with titanium vacancies. The deeply lying zirconium states do not change the electronic structure of the a-TiO2. The situation is different when the Zr is in the interstitial position of the a-TiO2 crystal. Here titanium and zirconium electrons create an additional energy band located below the bottom of the conduction band. The DOS intensity of the formed energy band is very low.
The electronic band structures calculated for a-TiO2 crystal doped by Zr4+ ions and oxygen vacancies are presented in Figure 2h,i. Obtained energy dependencies are a superposition of the energy bands illustrated in Figure 2d–g. Crystals with oxygen vacancies and doped by Zr atoms retain the energy band structure of the Zr4+ ion-doped structures and energy band structure of the a-TiO2 defected by oxygen vacancies. Also, the DOS intensities of additional energy bands created in the energy gap range are very low. One can conclude that they will not be seen in the experimentally obtained value of an energy gap.
In Table 3, the energy gap values calculated for all evaluated crystal structures are collected. One can see that the Zr atom substituting Ti atom does not change the energy gap of the a-TiO2 crystal. The Zr atom in the interstitial position decreases the energy gap value of the a-TiO2 crystal. Oxygen vacancies increase the energy gap no matter where they are located, far or close to the Zr atom.
From Figure 3, one can see that the oxygen vacancies decrease the value of the conduction band minimum and valence band maximum level. The v(O) in the TiO2 structure increases the mentioned energy levels, but the anatase structure with Ti vacancies is the least likely from total energy analysis.

3.2. Experimental Determination

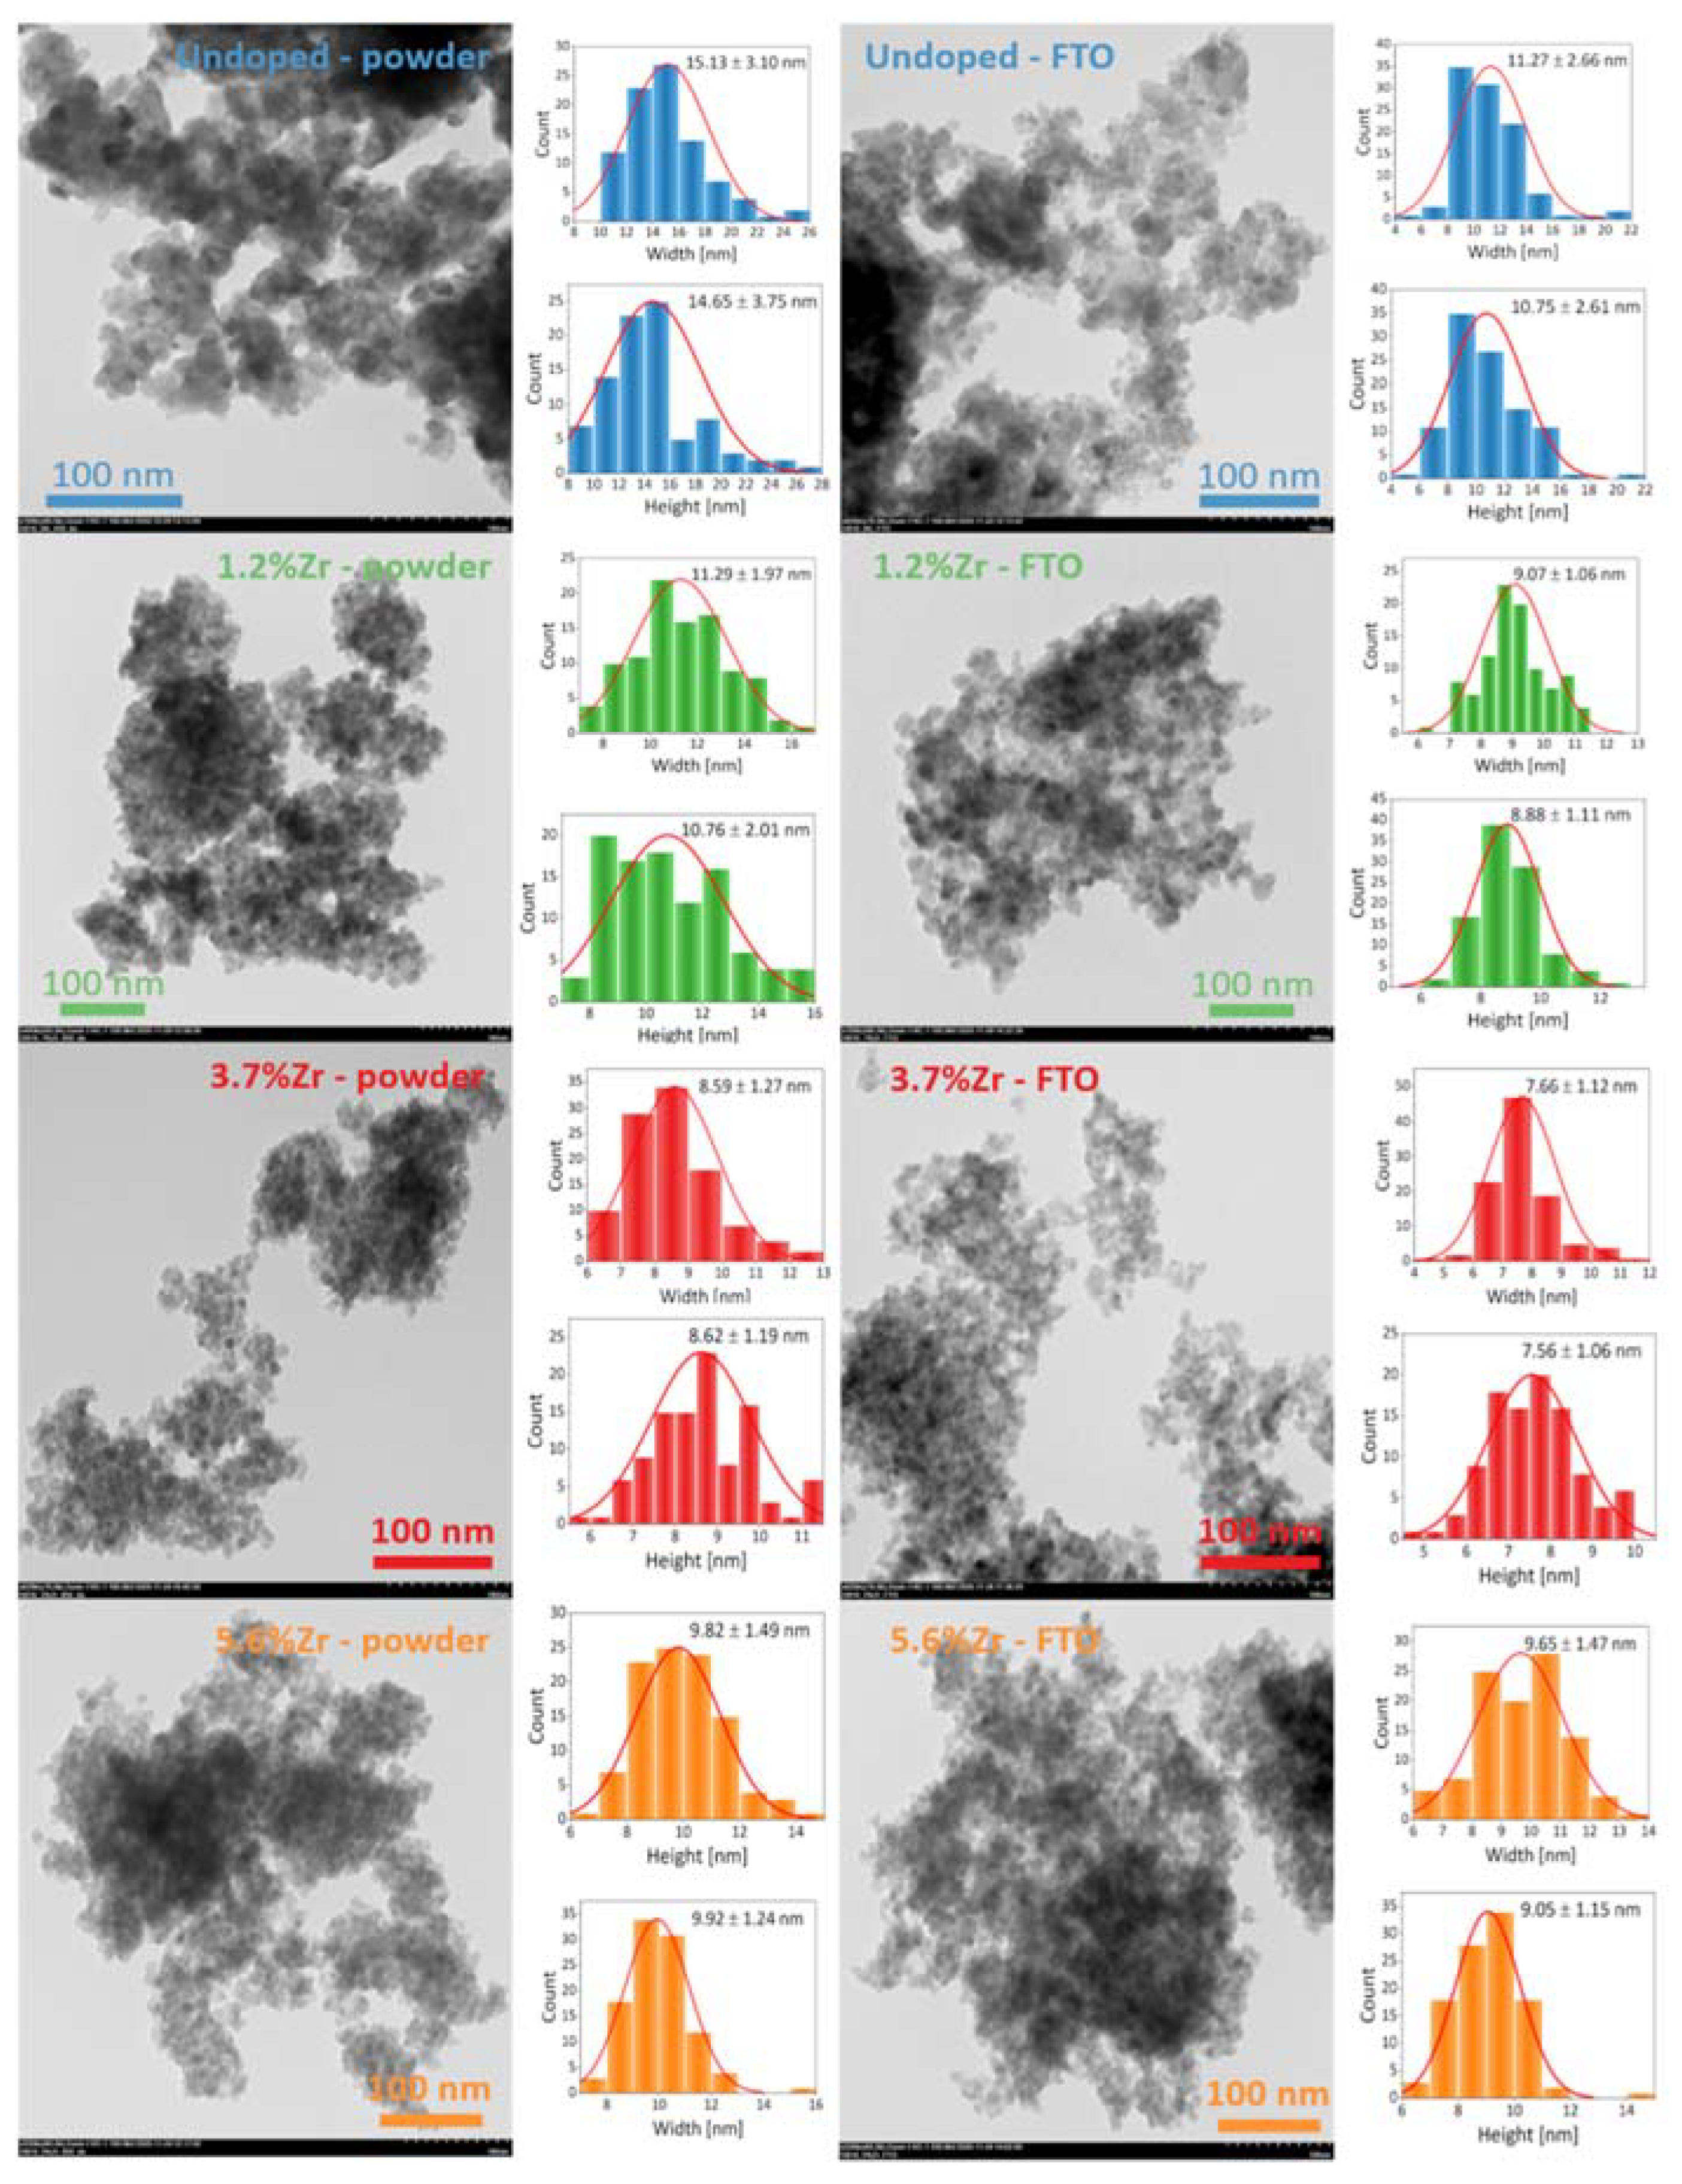
3.2.1. Structure and Morphology

Figure 4 shows the XRD spectra of the TiO2 matrices obtained at varied temperatures (a) and TiO2 doped with different concentrations of Zr4+ ions in the form of powders and as the layers deposited on FTO glass after annealing at 450 °C for 2 h (b). The content of Zr4+ ions (1.2, 3.7, and 5.6%) was determined by the XRF technique (see Figure S2). It can be noted that all of the samples exhibit mainly anatase structures (ICCD 1-084-1285). The XRD patterns of materials deposited on the FTO substrate show the sharp and narrow reflexes of the underneath SnO2 conductive layer (ICCD 2-1337). In Figure 4a, it may be seen that the nanocrystals’ mean size increases with an increase of treatment temperature, ranging from 4.89 up to 6.44 nm for TiO2 dried at 60 °C for 12 h and TiO2 annealed at 450 °C for 1 h, respectively. It is worth mentioning that annealing time is also crucial in nanocrystals’ growing process, and time elongation from 1 to 2 h caused a further rise of crystal size from 6.44 to 12.85 nm. As shown in Figure 4a, anatase reflexes, especially in dried TiO2, are broadened. Among other things, it indicates that crystal surface on the grain interface may contain defects [43]. The presence of defects caused an increase of strains in the lattice and prevented the growth of crystals. Therefore, an extension of the annealing process time may cause a diffusion phenomenon and disappearance of grain boundaries, which leads to the coalescence of crystals into the bigger one [44]. Finally, a narrowing of the reflections in diffractograms was observed.
Moreover, if dried at 60 °C, TiO2 is directly used for a viscous paste preparation and calcinated under the same conditions (450 °C, 2 h). After deposition on FTO glass, the crystal size is diminished from 12.85 to 7.61 nm. This can indicate that when the sample is being annealed on FTO substrate, the SnO2 can migrate into the TiO2 structure and inhibit the nanoparticles’ growth [45]. A similar situation may be observed when Zr4+ ions are doped into the TiO2 crystal site (Figure 4b). Aside from nanoparticles’ size-changing during the time elongation of the calcination process, the phase structure of investigated samples has also changed. Dried TiO2 matrices annealed at 450 °C for 1 h are single-phase products, whereas the rutile and brookite phases appeared in the titania nanoparticles calcinated for 2 h. However, introducing Zr4+ ions into TiO2 or annealing TiO2 paste on FTO glass caused inhibition of the anatase to rutile phase transformation [46,47,48].
Introducing 6% Zr4+ ions, which have a larger ionic radius than Ti4+ ions (0.72 Å and 0.69 Å, correspondingly), do not change the lattice parameters of TiO2 remarkably, referring to the theoretical calculations. Compared to the calculated unit cell parameters (see Table 2), a similar situation was observed in the experimental results (see Table 4). Nonetheless, it may be concluded that Zr4+ ions were successfully substituting the Ti4+ ions in the presented materials. This statement may be supported by the differences between the total energy per atom (see Table 2) for substitutional (2 × 2 × 1 TiO2Zr) and interstitial Zr4+ ions (2 × 2 × 1 TiO2 + Zr) arrangements, which are −8.78 and −8.70 eV, respectively, and suggests higher stability of the former form.
Slight differences in cell parameters between the experiment and theoretical calculations result from the fact that the temperature of 0K was assumed in the calculations.
Raman spectra of TiO2 nanopowders and TiO2:Zr_FTO were recorded and are presented in Figure 5a,b. Intense peaks at about 145, 196, 398, 519, and 639 cm−1 were observed for the corresponding anatase modes: Eg(1), Eg(2), B1g(1), A1g/B1g(2), and Eg(3), respectively. Crystal lattice vibrations A1g and B1g(2) are superimposed in the plot at 519 cm−1 and may only be separated at low-temperature measurements [49]. The additional low-intensity bands at about 245, 323, and 368 cm−1 may be observed and assigned to the A1g, B1g, and B2g of the brookite structure [50]. The low-intensity and broad peaks mentioned above may be explained by the high structural disorder and brookite phase partial amorphization [51]. The presence of brookite peaks and no additional phase are in good agreement with the XRD results described above.
The linewidth and peak position of Raman spectra may be influenced by many factors, e.g., phonon confinement, anharmonic effects, crystals size, as well as temperature or crystal defects, and strains of lattice sites [52,53,54,55,56,57]. The detailed Raman data presented in Table S1 (based on the bands’ deconvolution using Lorentz fitting) has been compiled to distinguish particular samples. It should be noted that after loading of dopant ions, the Eg mode scattering intensities in Raman spectra decreased. Komaraiah and co-workers also observed similar effects and described it as the lattice periodicity changes and crystal symmetry translation in the long-range [34]. It might be induced by defects or distortion in the crystal lattice. Furthermore, the Eg mode blue shift of about 2–3 cm−1 is also observed and may be linked to the minimalizing of nanoparticles’ size.
Moreover, the phonon lifetime was also calculated based on Eg mode at 144 cm−1 (see Figure S3 and Table S2) and indicated the decline from 0.390 to 0.263 ps and 0.260 ps incrementing Zr species in the case of nanoparticles scratched off from the FTO substrates (called further as FTO nanoparticles) and nanopowders, respectively. This observation may support the statement about imperfections in the crystal lattice of obtained TiO2 materials [34].
The size and morphology of titanium dioxide nanoparticles calcinated at 450 °C for 2 h were visualized by TEM images. Figure 6 shows pristine TiO2 and Zr4+-doped TiO2 nanopowders and FTO nanoparticles with histogram distribution for width and height dimensions of particulate particles. Undoubtedly, there is a correlation between TEM and XRD results because of the particle sizes’ similar tendency. It can be seen that all samples tend to the aggregation, even though the sonication treatment was used for FTO nanoparticles. Furthermore, prepared nanoparticles had a very regular, spherical shape with a narrow size distribution. Simultaneously, a similar observation was made in the SEM images, presented in Figure S4. The hydroxyl group present on the TiO2 surface and the size to volume ratio may explain particles’ aggregation observed in both microscopic techniques [58,59].
The thermogravimetric (TGA) and derivative thermogravimetry (DTG) analyses of Zr4+ ions doped TiO2 have been performed, and the results are presented in Figure 7a. The first weight loss in the range of 83–96 °C is a result of the dehydration processes and/or escape of CO2 molecules trapped in the materials’ pores. In the range of 241–258 °C, the second weight loss may be assigned to the decomposition and/or oxidation of post-synthetic organic residues in the material. The third weight loss (396–550 °C) may be linked to the formation of defective titanium dioxide with oxygen vacancies. The other perceptible drop in TGA, observed in the materials doped with 3.7 and 5.6% of Zr4+ ions (>550 °C), may be related to the other ZrO2 phase transformations and composition of the lattice defects.
To better understand the interaction between the synthesis substrates, FTIR spectroscopy was carried out. In Figure 7b are presented FTIR spectra of samples dried at 60 °C (straight line) and after calcination at elevated temperature (dotted line). Metalloxane bondings M–O–M’ (M and M’ = Zr, Ti) at about 475–625 cm−1 are formed via M–OR (M = Ti, Zr, and R = isopropoxide, n-propoxide) and water hydrolysis, followed by a condensation process of creating in situ M–OH and M–OR (or other M–OH) groups [60,61,62]. The narrow peak at 1385 cm−1 corresponds to the σ(C–H) bonding from alkoxy groups, and it is being overlapped with C–O stretching vibration caused by alkoxy residue [60,63]. The isopropanol and n-propanol residues’ bands at about 2854–2974 cm−1 may be attributed to the –CH2 and –CH3 symmetrical and asymmetrical stretching bonds [64]. A peak at 1628 and in the range of 3200–3364 cm−1 is linked to the –OH groups bending and stretching bonds, respectively [65]. Their intensities decreased after calcination at 450 °C, whereas the peak at 2426 cm−1 corresponding with atmospheric CO2 (which can be adsorbed in the material’s pores) is not observed after high-temperature treatment [66]. The more visible differences between the spectra of dried and annealed materials may be observed in the fingerprint region. It is noted that an inconsiderable peak at 1160 cm−1 is linked to the stretching C–O vibrations emerging due to the RCO–M bonding [60,67]. Two peaks at about 1440 and 1540 cm−1 may point out the acetate group complexation with M ions and are assigned to asymmetric νasym (COO) and symmetric νsym (COO) stretching bonds, correspondingly [68]. The frequency separation between these two bands is equal to Δν = 100 cm−1 and suggests acetate’s coordination in bidentate geometry. That means that acetate ions may create bidentate and bridging ligands with both metal ions (Zr and/or Ti) [69,70]. It is worth noticing that with Zr4+ ions’ increasing content, the band at about 1228–1233 cm−1 may be observed and is no longer visible after the material calcination. It may be correlated with the acetate group of ester-isopropyl acetate or n-propyl acetate created after condensation of M-O-M’ species [71]. Bands at 1769 cm−1 assigned to the carbonyl moieties are also indicated in the spectra recorded after the drying process. The more detailed FTIR data were collected in Table S3.
Nitrogen adsorption-desorption isotherm curves of nanopowders annealed at 450 °C for 2 h, presented in Figure 8, have been performed to investigate the porosity type and specific surface area. Based on IUPAC classification, the type IVa isotherm with H2a hysteresis loops may be distinguished for all the materials presented [72]. Initially, between 0 and 0.6 relative pressure, a gradual increment of the adsorbed volume may be observed, then sharp triangular hysteresis appeared. It is worth noticing that doping Zr4+ ions into TiO2 matrices leads to surface area increment from 69.4 to 132.9 m2/g for pristine TiO2 and 5.6% of Zr4+ doped species, respectively (see Table 5). It may be linked to the previous XRD and TEM results because the specific surface area increase may be typically observed when the nanoparticles’ size decreases [73]. Increasing the Zr4+ content in the material up to 3.7% caused Vp’s increase, and then drop when Zr4+ content reaches 5.6%, while Sp grew from 3.8 to 7.5 nm. The above observations may be concluded that prepared materials have mesoporous structures created by aggregates built of spherical TiO2 nanoparticles [74]. Undoubtedly, the structure of used precursors (isopropoxide and n-propoxide alkoxy chains) can act as semi-templates and induce pores’ growth in investigated materials [63].

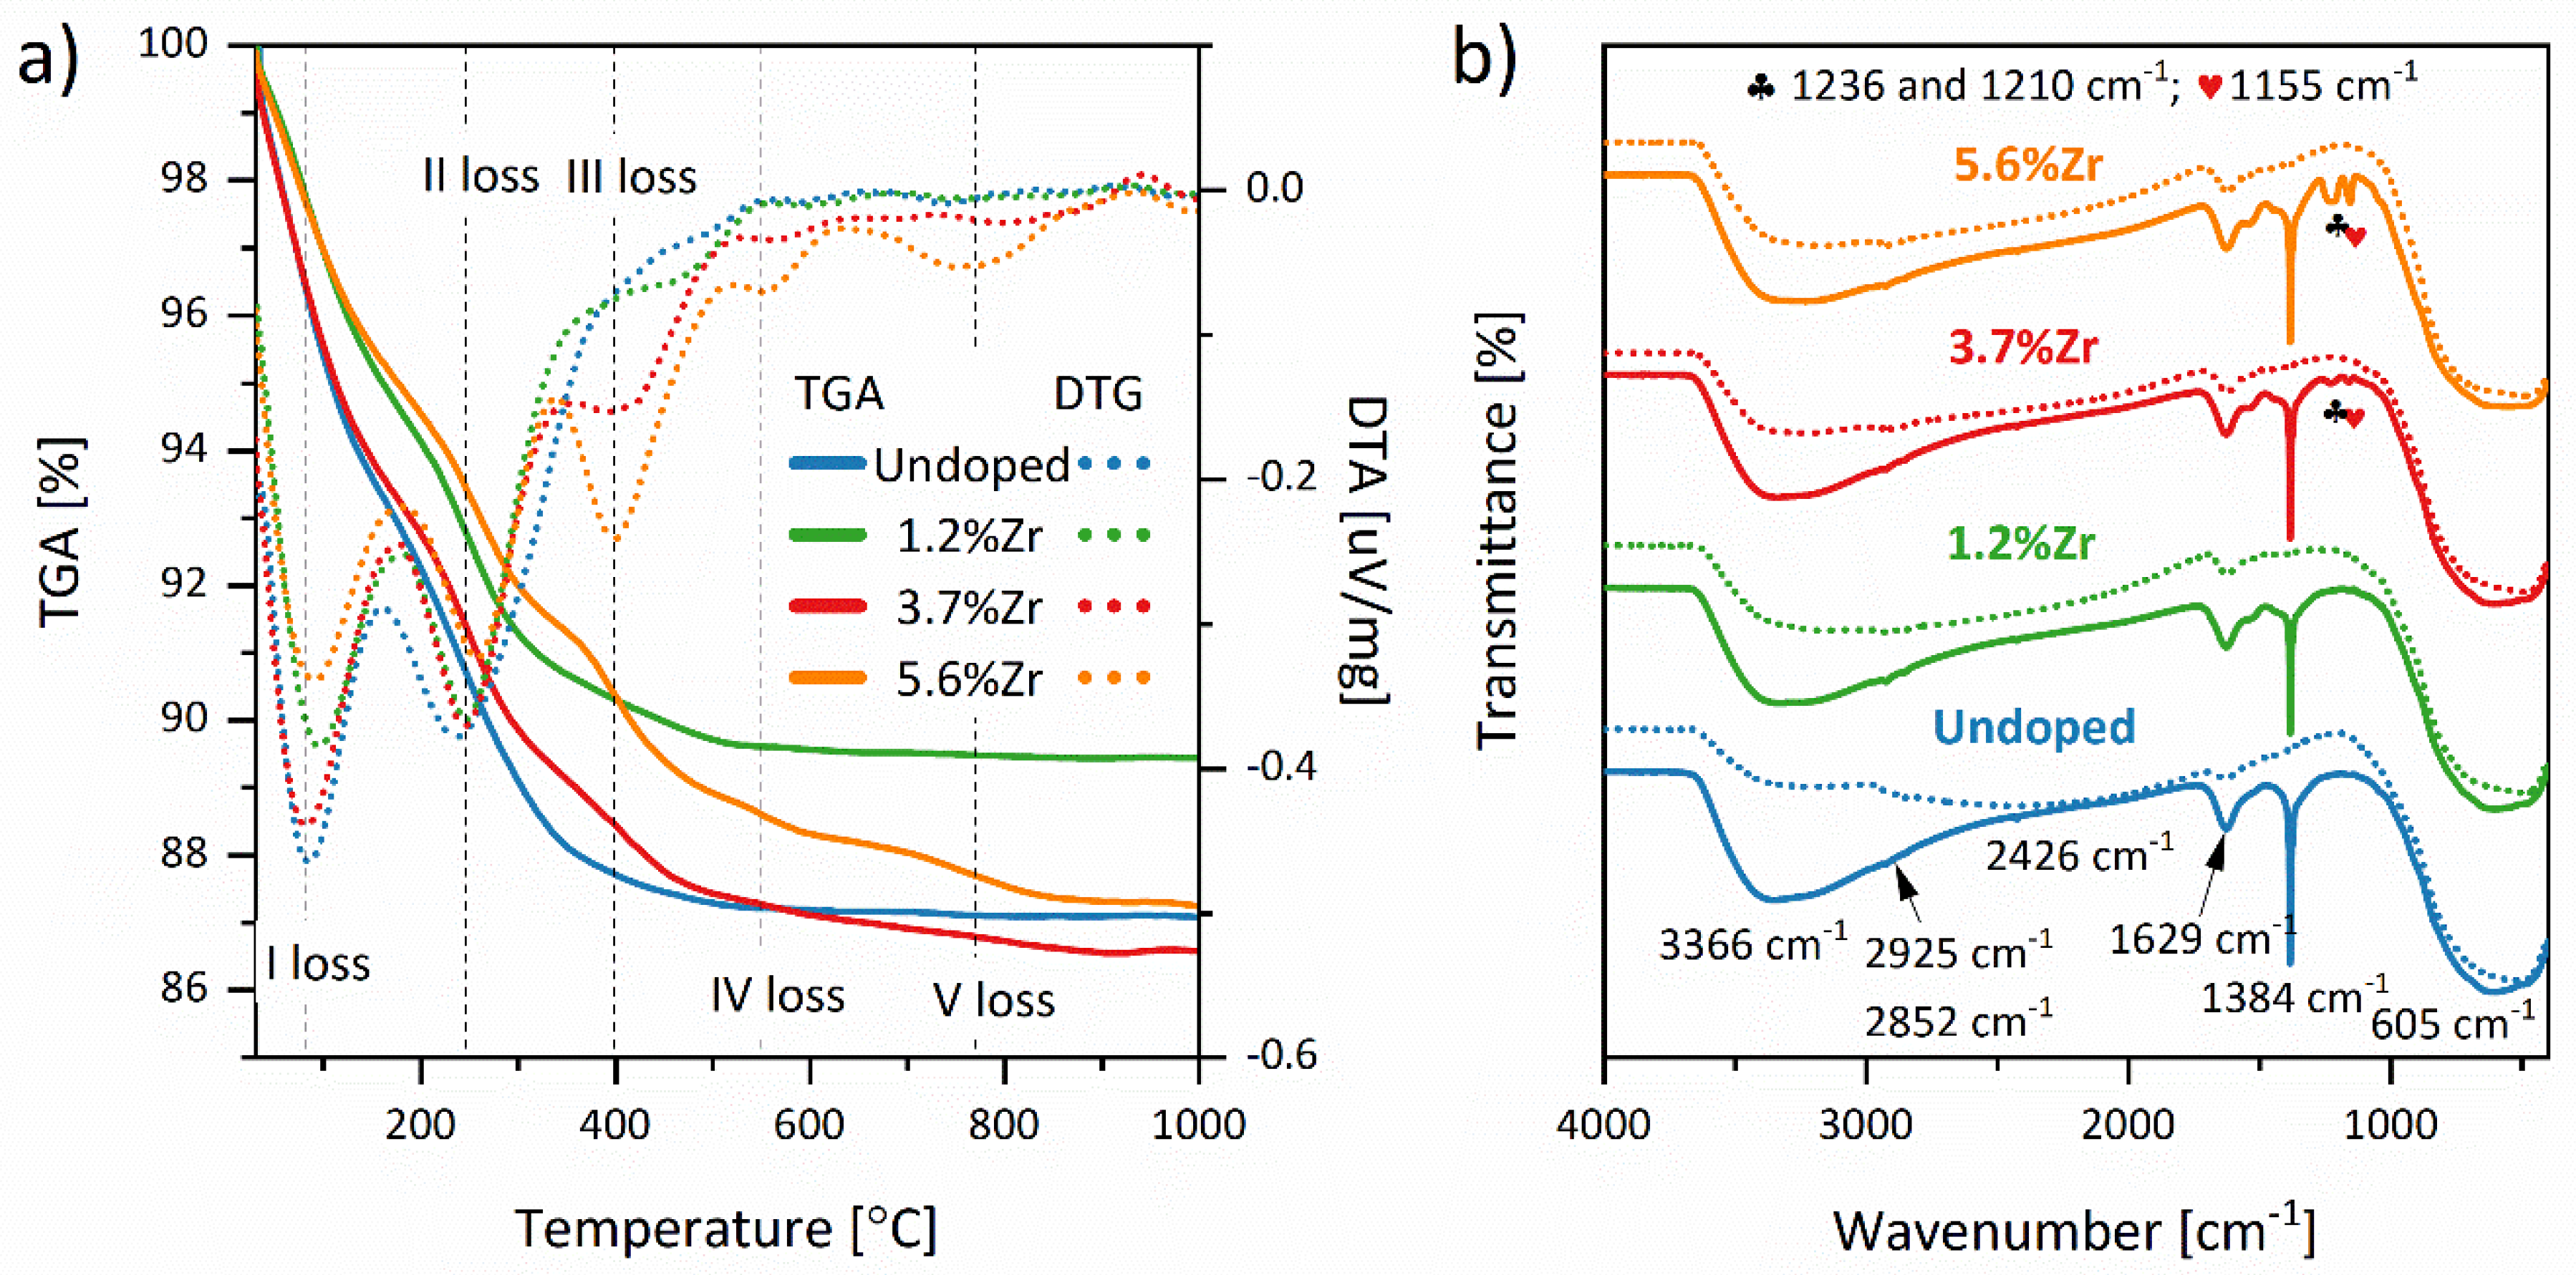
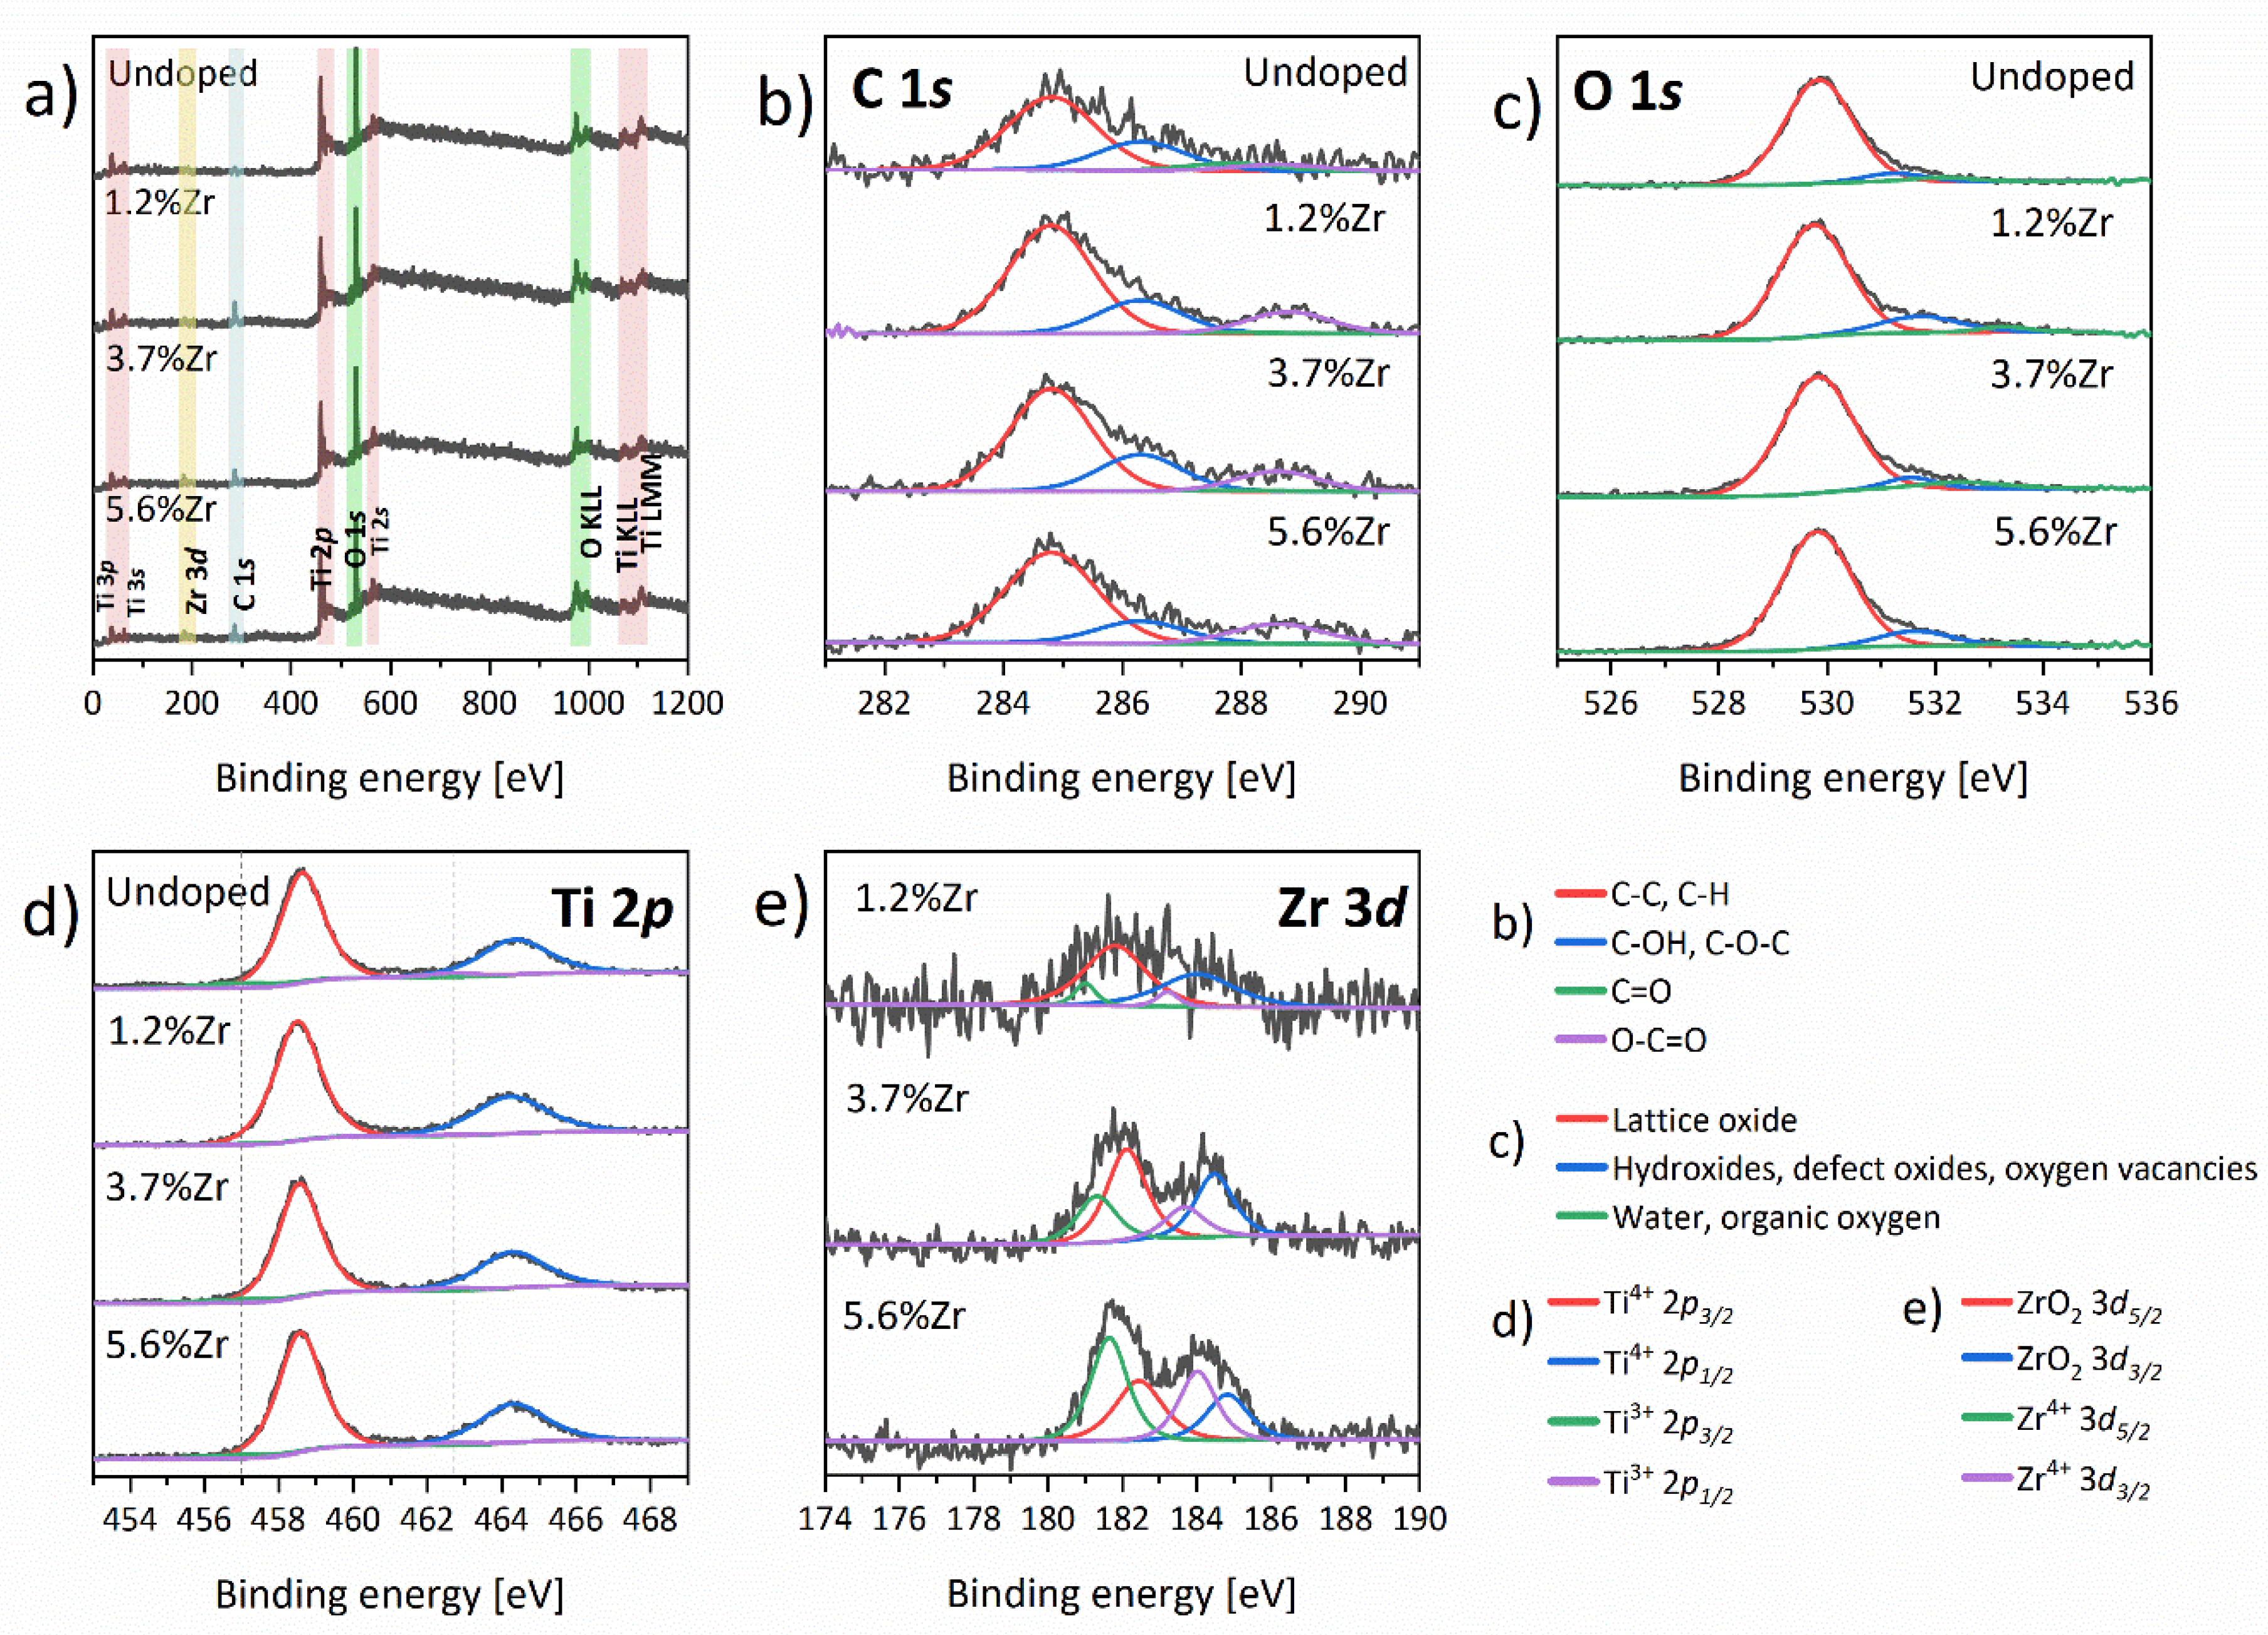
3.2.2. Physicochemical Analysis

Figure 9 shows the diffuse reflectance spectra (a), and indirect bandgap (b) plotted via (αhυ)1/2 vs. (hυ) of nanoparticles deposited on FTO substrates. As shown in the DRS graphs, presented materials absorb light in the UV region (<400 nm) mainly. Nevertheless, after embedding Zr4+ ions, a blue shift was observed in the case of 3.7%Zr_FTO and 5.6%Zr_FTO samples and a significant absorption increase in the Vis light range with a maximum effect for 3.7%Zr_FTO sample. That is in good agreement with our theoretical calculations because, as shown in Figure 2d–i, introducing substituting Zr4+ ions or creating oxygen vacancies leads to increased energy bandgap (see Table 3). As mentioned above, the energy gap area’s additional energy level due to very low DOS does not affect the optical spectrum.
The calculated values of indirect bandgaps for TiO2 and Zr4+ ions doped materials with increasing Zr4+ ions content from 0 to 5.6% are 3.22, 3.27, 3.26, and 3.28 eV, respectively (see Table 6). It is worth paying attention to the fact that the growth of the bandgap value is nonlinear, which may be a result of several contradictory factors, including decreases in nanoparticle sizes (especially in nanofilms) [75], doping of Zr4+ ions [76], or the formation of defects [77]. Gnatyuk et al. also observed a similar disproportion and explained it as a molecular scale mixing of Zr4+ ions and ZrO2 species in the TiO2 [76]. It should be emphasized that computational calculation results are very close to the experimental ones. The most likely structures which should be taken into consideration are TiO2v(O) for pristine TiO2 (2 × 2 × 1 TiO2 v(O)) and substitutional Zr with oxygen vacancies present far from the doped ion (2 × 2 × 1 TiO2 Zr v(O) far) due to the combination of total atom energy and bandgap values. It should be noticed that quantum chemical calculations were performed for bulk materials. The experimental data were measured for nanoparticles with environment interaction moving the UV-vis spectra into the red spectral range. Therefore, since the bandgap width increased in the experimental data, the structure (2 × 2 × 1 TiO2 Zr v(O) far) with oxygen vacancies located far away from Zr4+ ions is most probable for presented materials.
The X-ray photoelectron spectroscopy was performed to investigate the interaction between ions in as-prepared nanoparticles. Obtained XPS spectra are presented in Figure 10 and were analyzed and fitted using CasaXPS software (Casa Software Ltd, Teignmouth, UK). Three main bands discerned in the C 1s region (Figure 10b) may be resolved as alkyl, alcohol, and esters functional groups at 284.8, 286.3, and 288.8 eV, respectively. A minute amount of carbonyl group may also be observed at about 287.8 eV, except for the sample 5.6%Zr. The XPS spectra resolution in the C 1s region corresponds with our findings from the FTIR experiments described above. Furthermore, the intensity of C 1s signals increased in the doped materials compared with the undoped ones. The use of zirconium n-propoxide as a precursor of Zr4+ ions in the synthetic procedures may explain the higher concentration of organic residues in these samples. In the O 1s region (Figure 10c), two main bands may be identified. The main peak at 529.8 was assigned to the O2- ions in the anatase TiO2 lattice, while 531.4 eV is typically ascribed as connected with hydroxyl groups, carbon impurities, or defective TiOx [78]. A sample with a 1.2% concentration of Zr4+ ions also contained low water content. Figure 10d shows two characteristic 2p spin-orbit doublets of Ti4+ and Ti3+ (marked with dotted line). The two main peaks centered at 458.6 and 464.3 eV with a Ti 2p1/2 − Ti 2p3/2 splitting equally to 5.70 eV corresponds with Ti4+ ions in the anatase phase [79]. During the heating process, oxygen molecules are detaching from TiO2, leaving oxygen vacancies, and hence the resulting surplus of electrons reduces the Ti4+ ions to Ti3+ [80]. The reduced Ti3+ ions are detected at 457.0 and 462.7 eV with the same splitting value, which is also in good agreement with the literature [79]. It is worth taking into account the ratio of Ti4+/Ti3+peaks area. The significant difference occurred in the undoped TiO2 (1:0.079), then the embedding of Zr4+ ions led to a decrease in the number of defects on the titania nanoparticles’ surface. However, when Zr4+ content increases in the nanoparticles, more Ti3+ species are indicated: 1:0.016, 1:0.055, and 1:0.046, respectively. It may be elucidated by the discrepancies in the ionic radius of Ti4+ and Zr4+, which may cause some lattice distortion. Two Zr 3d5/2 peaks at about 181.8–182.4 eV and 181–181.6 eV may be observed in Figure 10e and it can be resolved as the Zr4+ ions of the ZrO2 lattice and as a Zr4+ in Ti1−xZrxO2 crystals, respectively [81]. The 3d3/2 signals were detected at 184–184.8 and 183.2–184 eV again for Zr4+ ions and ZrO2 in TiO2 matrices, correspondingly. It should be noted that with a higher content of Zr4+ ions in the samples, the shift occurred for all signals. Yu et al. calculated these two signals’ band ratio area to establish Zr4+ amount in Ti1−xZrxO2 materials. Based on this paper, we determined that 0.127, 0.509, and 1.337% of Zr4+ ions doped the TiO2 structure. The detailed data of the percentage distribution of particular peaks in the XPS spectra registered for the materials presented are collected in Table S4.
The valence band positions were determined for two representative materials: bare TiO2 and doped with 3.7% Zr4+ ions based on the UPS spectra. The work functions of nanomaterials surfaces were calculated using the equation:
ϕ S = h υ ( E c u t o f f E F e r m i ) .
The first term is related to photons’ He I energy (21.2 eV) applied in the UPS measurements, and the second one is the secondary electron cut-off energy. Therefore, based on the above results after doping with Zr4+ species, work-function decreases from 4.28 to 4.09 eV, respectively. The value of 4.28 eV for undoped nanomaterial is in good agreement with the literature [82,83], whereas 4.09 eV points out introducing dopant ions caused by minimizing charge injection barriers [82]. Factors that affect the work’s function are, among others, doping or contamination on crystallites surfaces [84]. Therefore, that can explain the difference between these two materials. Figure 11b presents a scheme of the energy band structure prepared by combining the UPS (Figure 11c,e) and DRS (Table 6) results. As can be seen, there are slight differences, about 0.02 eV in the conduction band and 0.06 eV in the valence band values. The above scheme’s band shape is in excellent agreement with the theoretical calculation shown in Figure 3. In addition, extra bands were detected in both UPS spectra (Figure 11c,e) at 2.39 eV for undoped TiO2 and 2.47 eV for TiO2:3.7%Zr. The experimental results again coincide with computational calculations (Figure 2e,h,i), and recorded bands stem from oxygen vacancies present in both nanomaterials.
The paramagnetic phenomenon of the nanomaterials annealed at 450 °C was tested by Electron Paramagnetic Resonance (EPR). The EPR spectra depicted in Figure 12a,b show three distinguishable paramagnetic centers (C1-3). It is a well-known fact that with the increment of the temperature, the number of vacancies also increases to the moment of phase transformation by thermal depletion of oxygen [80]. This statement may justify the appearance of defects in the matrices of TiO2 calcinated at 450 °C. The differences in shifts and intensity observed in the EPR spectra (Figure 12b) originate from the measurements’ low resolution. A detailed study of the EPR spectra is beyond this paper’s scope, but still, component C1 line shape can indicate the Ti3+ ions embedded in a regular site of anatase lattice. Mohajernia et al. noticed a similar defect in TiO2 annealed at 700 °C in the air and described it as a Ti3+ with moderate tetragonal distortion g-tensor values equal gx = 1.994, gy = 1.994, and gz = 1.944, which also corresponds to our findings [85]. The last signal of gz tensor is not visible in the above graph, which may be related to a superimposition of highly disordered component C3 of Ti3+ species in the surface sites [86]. It is worth noticing that oxygen vacancies are also detected as anisotropic g-tensors of g1 = 2.017, g2 = 1.974, and g3 = 1.927. Under the above considerations, the situation that occurred in as-prepared samples may be described by the following equation:
O 2 + 2 T i 4 + 1 2 O 2 + v ( O ) + 2 T i 4 + + 2 e 1 2 O 2 + v ( O ) + 2 T i 3 +
After thermal depletion of oxygen molecules, an excess of electrons stabilizes the resultant Ti3+ ions, consistent with XPS analysis. Furthermore, it can be seen that introduction of Zr4+ ions at the beginning caused the reduction of paramagnetic signals’ intensity and again increment with increasing of Zr4+ content. This observation correlates with XPS and XRF results. After metal ions doping, the rutile phase disappeared, which could be explained by lattice distortion induced by both v(O) and the presence of additional crystal structure. Notwithstanding, a higher dopant ions content again disturbed the crystal lattice, which can be explained by the differences in the ionic radius of Zr4+ and Ti4+/3+. The detailed data of g parameters observed in the EPR spectra of presented materials are collected in Table S5.

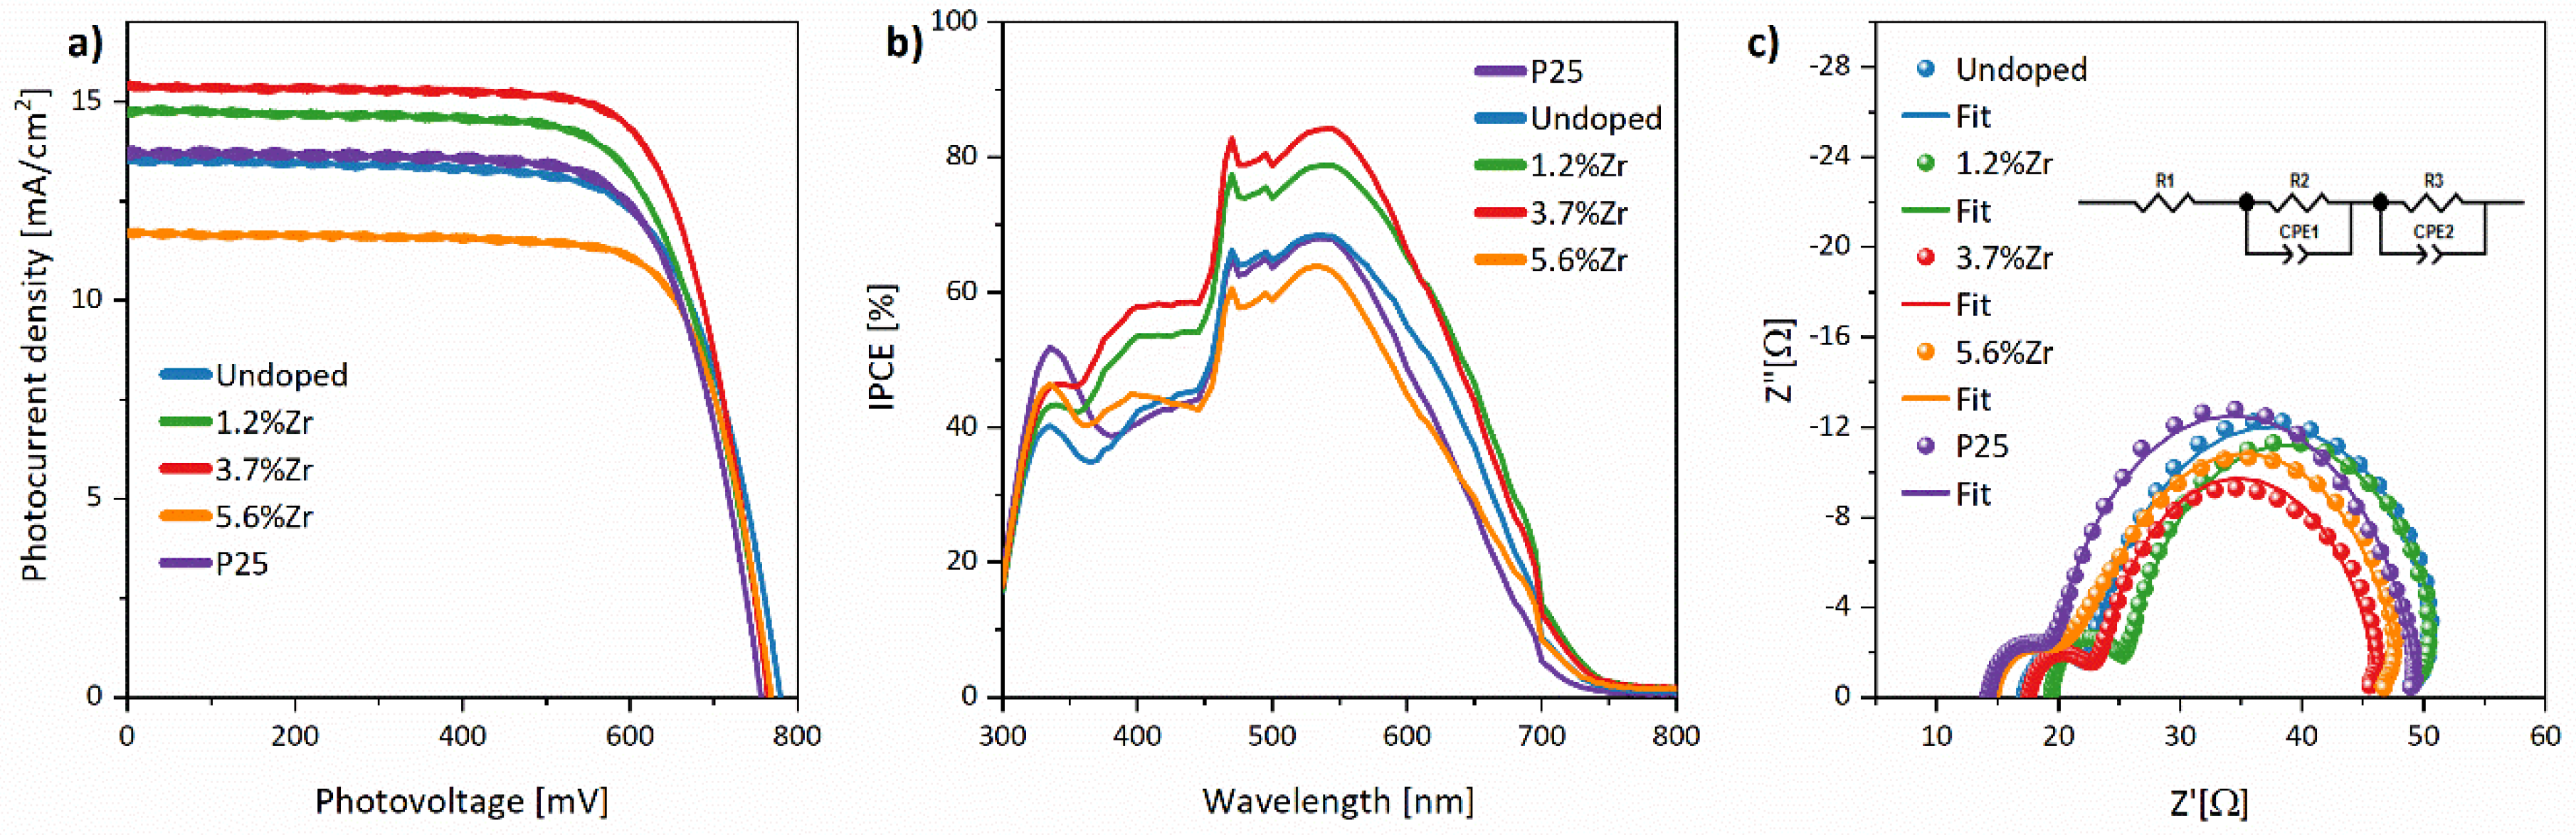
3.2.3. Photovoltaic Characterization

The performance of DSSCs was investigated under AM 1.5G simulated sunlight by J-V characteristics and electrochemical impedance spectroscopy measurements. A commercial P25 material was tested as a reference. As shown in Figure 13a, the open-circuit photovoltage (VOC) value drop from 779.1 to 768.1 mV for undoped material and 3.7% Zr4+-doped TiO2, respectively. Notably, VOC is a difference between the semiconductors’ conduction band Fermi level and the redox couple Nernst potential in the electrolyte [87]. As shown in Figure 2d,e,h,i, replacing Ti4+ ions with Zr4+ leads to the lower values’ conduction band’s shift. As the type of electrolyte remained unchanged during the whole experiment, the conduction band’s shift seems to be the most probable reason for the VOC changes. Therefore, computational calculations again supported the experimental results and explained the reason for the VOC drop. Moreover, the above result corresponds with the energy scheme (Figure 11b), combining results extracted from DRS and UPS analyses.
Another DSSC device parameter, short-circuit photocurrent density (JSC), mainly corresponding to the charge recombination/electron transports and the working electrode’s specific surface area, was also determined. As shown in Table 7, the more considerable Zr4+ ion content, the higher JSC value, up to 15.47 mA/cm2 for 3.7% Zr4+ ions, and then dropped when Zr4+ concentration reaching 5.6%. Undoubtedly, the surface area increment in the investigated sample series corresponds to the dye loading (see Ndye value in Table 7) and caused enhancement of short-circuit photocurrent density. However, the JSC sharp decline in the case of 5.6% Zr4+ may be caused by carbon residues, the presence of which has been confirmed by XPS and FTIR results described above. According to the literature data, carbon impurities significantly impact charge transport and recombination processes, leading to photocurrent density weakness [63].
It should be noted that the fill factor (FF) values registered for all devices are very high (>70%), which indicates that the semiconductor manufacturing process developed by our research group ensures high-quality cells. Fill factor is a crucial DSSC parameter and represents, among others, the energy loss caused by series resistance, electrolyte thickness (spacer influence), and counter electrode production quality (Pt layer) [88,89,90]. It may be observed that indeed the TCO resistance (R1) correlates with FF since the highest FF value was observed for DSSC with the lowest R1 values (see Table 7). In contrast, it is challenging to define the direct influence counter electrodes resistance (R2) due to the Nyquist plot fitting uncertainty.
The overall photon-to-current conversion efficiency (η) is the most measurable cell efficiency indicator based on other parameters. As shown in Table 7, similar DSSC performance, equal to 7.49 and 7.41%, have been registered for P25 nanopowder and bare TiO2 cells, correspondingly. Again, a gradual increase of η is observed up to 3.7% Zr4+ device, then drops to the lowest value of 6.74% for 5.6% Zr4+ device. The above effect may be a combination of several factors mentioned above, e.g., bandgap value, specific surface area, and dye loading. On the one hand, the incorporation of Zr4+ ions causes imperfection in the crystal lattice, improving the cells’ photoelectrochemical activity; on the other hand, defect surplus may promote charge recombination and decrease the DSSC efficiency [21]. To sum up, the increasing photon-to-current conversion efficiency supports the appropriateness of introducing Zr4+ dopants into TiO2 (up to 3.7% content of Zr4+ ions).
The incident photon-to-current efficiency (IPCE) shown in Figure 13b reveals that the typical N3 dye profile corresponds to its light absorption spectrum with a maximum at 540 nm characteristic for metal-to-ligand charge transfer bands [91]. The obtained IPCE values are in good agreement with the overall efficiency of DSSC.
Electrochemical impedance spectroscopy (EIS) was also conducted to understand the electron transport mechanism in DSSC better. Generally, Nyquist plots consist of four elements. The first one is a series resistance linked to the FTO substrate (R1). In contrast, the small semicircle corresponds to the high-frequency area is a combination of charge transfer resistance on the counter electrode (R2 = RPt) and Helmholtz capacity (CPt). The second bigger semicircle in the medium frequency range is related to recombination process resistance (R3 = Rct) and chemical capacity (Cµ) at the TiO2 layer/dye/electrolyte interface. The last semicircle, called the Warburg element, at the low-frequency region, is the electrolyte impedance image (Zd), and it is not observed in Figure 13c. The EIS data collected in Table 7 were calculated based on the Nyquist plot fitting using the equivalent circuit scheme inserted in Figure 13c. This diagram is composed of resistors (R1—FTO and external circuit resistance, R2—Pt resistance, R3—TiO2 layer/dye/electrolyte recombination processes resistance), and constant phase elements (CPE1 and CPE2).
As described above, R1 values are related to the FTO and external circuit resistance, and they correlate with FF values extracted from J-V curves, while R2 values connected to the counter electrode are consistent one to another. The minor discrepancies in these two parameter values may be associated with the typical imperfect “hand-made” method of preparing DSSC in the presented research [32]. The more important in the EIS results is the R3 parameter assigned to the electron transport at TiO2/dye/electrolyte interface corresponding with the overall photoconversion efficiency. Indeed, this study has a noticeable tendency–the higher the R3 parameter, the lower η value. The one exception is observed in the case of 5.6% content of Zr4+ ions. Initially, the doping of Zr4+ ions leads to improving the electron transfer through the cell what can be seen in diminishing the R3 values, but then dropped concerning to the 5.6%Zr. Ünlü et al. noticed a similar situation in the Mn2+-doped TiO2 and described it as a structural problem, not only resulting from the recombination processes [92]. Based on this statement and our results, the increasing specific surface area with increasing zirconium content should be considered. Despite that, the highest amount of adsorbed dye molecules is connected with the standard P25 (which may be elucidated as the densest packed thin film in investigated series of DSSC), while the second one was 5.6%Zr cell with the value of 43.85 nmol/cm2. The mesoporous structure of TiO2:5.6%Zr4+ with 132.9 m2/g specific surface area and 7.5 nm pores size provides a larger surface for dye adsorption, leading to the aggregation of dye and photoconversion efficiency decline. It is worth noticing that amount of adsorbed dye is a decisive factor up to the particular level, after which the photoconversion efficiency reaches a plateau [93]. Another reason may be related to crystallites’ size because nanomaterial with a 5.6% content of Zr4+ ions indicates larger crystallites than 3.7% Zr4+ material. Moreover, the increment of Zr4+ and ZrO2 species on the TiO2 surface can also act as recombination centers even though a certain level of doping provides better contact TiO2 with dye molecules [94]. These considerations may be supported by the electron lifetimes calculated from the Bode plot. It can be shown that after doping the 1.2% of Zr4+ ions injected electron lifetime increase and then decline: 10.18, 15.96, 12.76, and 10.18 ms for TiO2:xZr4+ where x = 0, 1.2, 3.7, 5.6%, respectively. As shown in Table 7, the longer the electron lifetime, the higher photoelectric conversion efficiency with a slight difference between 1.2% and 3.7% content of Zr4+ ions in examined nanomaterials. It can be explained as a strong impact of injected electron lifetime on recombination and photon-to-current conversion processes [63]. Electron injection and recombination processes are contradictory mechanisms. Therefore, it is worth highlighting that DSSC can be affected by many factors, concluding that it is difficult to point out the exact reason for these small discrepancies.

4. Conclusions

In conclusion, inserting the Zr4+ ions into TiO2 lattice in substituted positions was obtained in this work. Nanopowders and working electrode calcination at 450 °C also led to the formation of defects in the titanium dioxide structure. Doping of Zr4+ ions or sintering titania film on FTO substrate caused crystal growth inhibition (below 10 nm in size). It also preserved emerging the rutile phase (observed in the undoped sample). These observations were in line with theoretical calculations that oxygen vacancies and Zr4+ ions doping caused stabilization of TiO2 structure without substantial cell parameter changes. Moreover, we showed that with increasing dopant ions content, the specific surface area increases and by extension, the amount of adsorbed dye on the TiO2 surface also increases. Furthermore, defects in the TiO2 crystal lattice induced the broadening of the energy bandgap and shifted the conduction band to lower energy. Again, experimental results were in excellent agreement with computational calculations. All of the factors mentioned above had an impact on the working principle of DSSCs. Shifting of conduction band caused decreasing of open-circuit photovoltage, which in case of 3.7% of Zr4+ ions content occurred to be optimized for effective electron transfer injection. It is worth noticing that as a result, short-circuit photocurrent density was enhanced to the 15.47 mA/cm2, and recombination processes on the TiO2/dye/electrolyte interface were suppressed. Finally, we reported for the first time, highly efficient DSSC built with photoanode consists of substituted Zr4+ species in TiO2.

Supplementary Materials

The following are available online at https://www.mdpi.com/article/10.3390/ma14112955/s1, Figure S1: Unit cell of a-TiO2 crystal structure (blue—Ti atoms, red—O) (a,b) and t-ZrO2 crystal structure (—Zr atoms, red—O) (c), Figure S2: XRF spectra of nanopowders calcined at 450 °C, Figure S3: The Eg enlargement of Raman spectra: nanopowders (a) and FTO nanoparticles (b), Figure S4: SEM-EDS analysis of TiO2:3.7%Zr, Table S1: The wavenumber assignment of particular modes observed in Raman spectra, Table S2: Detailed data concerned the Eg mode extracted from the Raman spectra, Table S3: Infrared data of samples dried at 60 °C and after calcination at 450 °C, Table S4: Summary of the percentage distribution of particular peaks in the XPS spectra, Table S5: Comparison of the g parameters observed in the spectra (*—not visible in the graph).

Author Contributions

Conceptualization: A.B., M.Z., M.M.-J.; Data curation: A.B.; Formal analysis: A.B.; Funding acquisition: A.B., M.M.-J., M.Z.; Investigation: A.B., O.K., M.M.-J., M.Z.; Methodology: A.B., M.Z., M.M.-J., O.K.; Project administration: A.B., M.Z., M.M.-J.; Resources: A.B., O.K., G.L.C., M.M.-J., M.Z.; Supervision: G.L.C., M.M.-J., M.Z.; Validation: A.B., O.K., G.L.C., M.M.-J., M.Z.; Visualisation: A.B., O.K.; Writing—original draft: A.B., O.K.; Writing—review & editing: G.L.C., M.M.-J., M.Z. All authors have read and agreed to the published version of the manuscript.

Funding

The authors acknowledge the financial support from the National Science Centre, Poland (grant no. 2017/25/B/ST8/01864). A.B., during this work, was also supported by Grant No. POWR.03.02.00-00-I023/17 co-financed by the European Union through the European Social Fund under the Operational Program Knowledge Education Development. Calculations have been partially carried out at the Wrocław Centre for Networking and Supercomputing http://www.wcss.wroc.pl, accessed on 26 April 2021 (Grant no. 171).

Institutional Review Board Statement

Not applicable.

Informed Consent Statement

Not applicable.

Data Availability Statement

Data are available on request at corresponding authors.

Conflicts of Interest

The authors declare no conflict of interest.

References

  1. Hussain, S.; Yangb, X.; Aslam, M.K.; Shaheend, A.; Javed, M.S.; Aslamf, N.; Aslamg, B.; Liua, G.; Qiaoa, G. Robust TiN nanoparticles polysulfide anchor for Li–S storage and diffusion pathways using first principle calculations. Chem. Eng. J. 2020, 391, 123595. [Google Scholar] [CrossRef]
  2. Hussaina, S.; Javed, M.S.; Asimd, S.; Shaheene, A.; Khan, A.J.; Abbasg, Y.; Ullaha, N.; Iqbalh, A.; Wanga, M.; Qiaoa, G.; et al. Novel gravel-like NiMoO4 nanoparticles on carbon cloth for outstanding supercapacitor applications. Ceram. Int. 2020, 46, 6406–6412. [Google Scholar] [CrossRef]
  3. Hussain, S.; Khan, A.J.; Arshad, M.; Javed, M.S.; Ahmad, A.; Shah, S.S.; Khan, M.R.; Akram, S.; Ali, S.; ALOthman, Z.A.; et al. Charge storage in binder-free 2D-hexagonal CoMoO4 nanosheets as a redox active material for pseudocapacitors. Ceram. Int. 2021, 47, 8659–8667. [Google Scholar] [CrossRef]
  4. Chetan, M.; Yao, S.; Griffith, D.T. Multi-fidelity digital twin structural model for a sub-scale downwind wind turbine rotor blade. Wind. Energy 2021, 1–20. [Google Scholar] [CrossRef]
  5. Ma, J.; Jiang, Q.; Zhang, Q.; Xie, Y.; Wang, Y.; Yi, F. Effect of groundwater forced seepage on heat transfer characteristics of borehole heat exchangers. Geotherm. Energy 2021, 9, 1–23. [Google Scholar] [CrossRef]
  6. O’Regan, B.; Grätzel, M. A low-cost, high-efficiency solar cell based on dye-sensitized colloidal TiO2 films. Nature 1991, 353, 737–740. [Google Scholar] [CrossRef]
  7. Aslam, A.; Mehmood, U.; Arshad, M.H.; Ishfaq, A.; Zaheer, J.; Ul Haq Khan, A.; Sufyan, M. Dye-sensitized solar cells (DSSCs) as a potential photovoltaic technology for the self-powered internet of things (IoTs) applications. Sol. Energy 2020, 207, 874–892. [Google Scholar] [CrossRef]
  8. Fakharuddin, A.; Jose, R.; Brown, T.M.; Fabregat-Santiago, F.; Bisquert, J. A perspective on the production of dye-sensitized solar modules. Energy Environ. Sci. 2014, 7, 3952–3981. [Google Scholar] [CrossRef]
  9. Rume, T.; Islam, S.D.-U. Environmental effects of COVID-19 pandemic and potential strategies of sustainability. Heliyon 2020, 6, e04965. [Google Scholar] [CrossRef]
  10. Khamrang, T.; Velusamy, M.; Ramesh, M.; Jhonsi, M.A.; Jaccob, M.; Ramasubramanian, K.; Kathiravan, A. IoT-enabled dye-sensitized solar cells: An effective embedded tool for monitoring the outdoor device performance. RSC Adv. 2020, 10, 35787–35791. [Google Scholar] [CrossRef]
  11. Michaels, H.; Rinderle, M.; Freitag, R.; Benesperi, I.; Edvinsson, T.; Socher, R.; Gagliardi, A.; Freitag, M. Dye-sensitized solar cells under ambient light powering machine learning: Towards autonomous smart sensors for the internet of things. Chem. Sci. 2020, 11, 2895–2906. [Google Scholar] [CrossRef] [Green Version]
  12. Gong, J.; Sumathy, K.; Qiao, Q.; Zhou, Z. Review on dye-sensitized solar cells (DSSCs): Advanced techniques and research trends. Renew. Sustain. Energy Rev. 2017, 68, 234–246. [Google Scholar] [CrossRef]
  13. Gong, J.; Liang, J.; Sumathy, K. Review on dye-sensitized solar cells (DSSCs): Fundamental concepts and novel materials. Renew. Sustain. Energy Rev. 2012, 16, 5848–5860. [Google Scholar] [CrossRef]
  14. Swamy, V.; Gale, J.; Dubrovinsky, L. Atomistic simulation of the crystal structures and bulk moduli of TiO2 polymorphs. J. Phys. Chem. Solids 2001, 62, 887–895. [Google Scholar] [CrossRef]
  15. Reyescoronado, D.; Rodriguezgattorno, G.; Espinosa-Pesqueira, M.; Cab, C.; De Coss, R.; Oskam, G. Phase-pure TiO2 nanoparticles: Anatase, brookite and rutile. Nanotechnology 2008, 19, 145605. [Google Scholar] [CrossRef] [PubMed]
  16. Hagfeldt, A.; Graetzel, M. Light-Induced Redox Reactions in Nanocrystalline Systems. Chem. Rev. 1995, 95, 49–68. [Google Scholar] [CrossRef]
  17. Hoffmann, M.R.; Martin, S.T.; Choi, W.; Bahnemann, D.W. Environmental Applications of Semiconductor Photocatalysis. Chem. Rev. 1995, 95, 69–96. [Google Scholar] [CrossRef]
  18. Chiarello, G.L.; Dozzi, M.V.; Scavini, M.; Grunwaldt, J.-D.; Selli, E. One step flame-made fluorinated Pt/TiO2 photocatalysts for hydrogen production. Appl. Catal. B Environ. 2014, 160–161, 144–151. [Google Scholar] [CrossRef]
  19. Bsiri, N.; Zrir, M.; Bouaicha, M. Effect of Cr and Zr doping of TiO2 on the opto-electrical properties of dye sensitized solar cells. Optics 2020, 207, 163888. [Google Scholar] [CrossRef]
  20. Unal, F.A.; Ok, S.; Unal, M.; Topal, S.; Cellat, K.; Şen, F. Synthesis, characterization, and application of transition metals (Ni, Zr, and Fe) doped TiO2 photoelectrodes for dye-sensitized solar cells. J. Mol. Liq. 2020, 299, 112177. [Google Scholar] [CrossRef]
  21. Chattopadhyay, S.; Mondal, S.; De, G. Hierarchical Ti1−xZrxO2−y nanocrystals with exposed high energy facets showing co-catalyst free solar light driven water splitting and improved light to energy conversion efficiency. J. Mater. Chem. A 2017, 5, 17341–17351. [Google Scholar] [CrossRef]
  22. Archana, P.S.; Gupta, A.; Yusoff, M.M.; Jose, R. Charge transport in zirconium doped anatase nanowires dye-sensitized solar cells: Trade-off between lattice strain and photovoltaic parameters. Appl. Phys. Lett. 2014, 105, 153901. [Google Scholar] [CrossRef]
  23. Cavallo, C.; Mantella, V.; Dulong, A.; Di Pascasio, F.; Quaranta, S. Investigation on Zr-, Hf-, and Ta-doped submicrometric beads for DSSC photoanodes. Appl. Phys. A 2017, 123, 180. [Google Scholar] [CrossRef]
  24. Pasche, A.; Grohe, B.; Mittler, S.A.; Charpentier, P. Zr-doped TiO2 nanoparticles synthesized via a sol–gel route and their application in dye-sensitized solar cells for thermo-stabilization. Mater. Res. Express 2017, 4, 065501. [Google Scholar] [CrossRef] [Green Version]
  25. Mohamed, I.M.; Dao, V.-D.; Barakat, N.A.; Yasin, A.S.; Yousef, A.; Choi, H.-S. Efficiency enhancement of dye-sensitized solar cells by use of ZrO2 -doped TiO2 nanofibers photoanode. J. Colloid Interface Sci. 2016, 476, 9–19. [Google Scholar] [CrossRef]
  26. Hüfner, S. Electronic structure of NiO and related 3d-transition-metal compounds. Adv. Phys. 1994, 43, 183–356. [Google Scholar] [CrossRef]
  27. Holbig, E.S. The Effect of Zr-Doping and Crystallite Size on the Mechanical Properties of TiO2 Rutile and Anatase. PhD Dissertation, Universität Bayreuth, Bayreuth, Germany, 2008. [Google Scholar]
  28. Arroyo-de Dompablo, M.E.; Morales-García, Á.; Taravillo, M. DFT+U calculations of crystal lattice, electronic structure, and phase stability under pressure of TiO2 polymorphs. J. Chem. Phys. 2011, 135, 054503. [Google Scholar] [CrossRef] [PubMed]
  29. Liechtenstein, A.I.; Anisimov, V.I.; Zaanen, J. Density-functional theory and strong interactions: Orbital ordering in Mott-Hubbard insulators. Phys. Rev. B 1995, 52, R5467–R5470. [Google Scholar] [CrossRef] [Green Version]
  30. Setyawan, W.; Curtarolo, S. High-throughput electronic band structure calculations: Challenges and tools. Comput. Mater. Sci. 2010, 49, 299–312. [Google Scholar] [CrossRef] [Green Version]
  31. Javed, S.; Islam, M.; Mujahid, M. Synthesis and characterization of TiO2 quantum dots by sol gel reflux condensation method. Ceram. Int. 2019, 45, 2676–2679. [Google Scholar] [CrossRef]
  32. Bartkowiak, A.; Orwat, B.; Zalas, M.; Ledwon, P.; Kownacki, I.; Tejchman, W. 2-Thiohydantoin Moiety as a Novel Acceptor/Anchoring Group of Photosensitizers for Dye-Sensitized Solar Cells. Materials 2020, 13, 2065. [Google Scholar] [CrossRef] [PubMed]
  33. Patterson, A.L. The Scherrer Formula for X-Ray Particle Size Determination. Phys. Rev. 1939, 56, 978–982. [Google Scholar] [CrossRef]
  34. Komaraiah, D.; Radha, E.; James, J.; Kalarikkal, N.; Sivakumar, J.; Ramana Reddy, M.; Sayanna, R. Effect of particle size and dopant concentration on the Raman and the photoluminescence spectra of TiO2:Eu3+ nanophosphor thin films. J. Lumin. 2019, 211, 320–333. [Google Scholar] [CrossRef]
  35. Treacy, J.P.W.; Hussain, H.; Torrelles, X.; Grinter, D.C.; Cabailh, G.; Bikondoa, O.; Nicklin, C.; Selcuk, S.; Selloni, A.; Lindsay, R.; et al. Geometric structure of anatase TiO2(101). Phys. Rev. B 2017, 95, 075416. [Google Scholar] [CrossRef] [Green Version]
  36. Southon, P.D.; Bartlett, J.R.; Woolfrey, J.L.; Stevens, M.G. Evolution of the structure of aqueous zirconia gels during preparation and heating. Ceram. Trans. 1998, 81, 1998. [Google Scholar]
  37. Teufer, G. The crystal structure of tetragonal ZrO2. Acta Crystallogr. 1962, 15, 1187. [Google Scholar] [CrossRef]
  38. Burdett, J.K.; Hughbanks, T.; Miller, G.J.; Richardson, J.W., Jr.; Smith, J.V. Structural-electronic relationships in inorganic solids: Powder neutron diffraction studies of the rutile and anatase polymorphs of titanium dioxide at 15 and 295 K. J. Am. Chem. Soc. 1987, 109, 3639–3646. [Google Scholar] [CrossRef]
  39. Rao, K.V.K.; Naidu, S.V.N.; Iyengar, L. Thermal Expansion of Rutile and Anatase. J. Am. Ceram. Soc. 1970, 53, 124–126. [Google Scholar] [CrossRef]
  40. Arlt, T.; Bermejo, M.; Blanco, M.A.; Gerward, L.; Jiang, J.Z.; Olsen, J.S.; Recio, J.M. High-pressure polymorphs of anatase TiO2. Phys. Rev. B 2000, 61, 14414–14419. [Google Scholar] [CrossRef] [Green Version]
  41. Diebold, U. The surface science of titanium dioxide. Surf. Sci. Rep. 2003, 48, 53–229. [Google Scholar] [CrossRef]
  42. Kisi, E.H.; Howard, C. Crystal Structures of Zirconia Phases and their Inter-Relation. Key Eng. Mater. 1998, 153–154, 1–36. [Google Scholar] [CrossRef]
  43. Choudhury, B.; Choudhury, A. Local structure modification and phase transformation of TiO2 nanoparticles initiated by oxygen defects, grain size, and annealing temperature. Int. Nano Lett. 2013, 3, 55. [Google Scholar] [CrossRef]
  44. Cao, Y.; He, T.; Zhao, L.; Wang, E.; Yang, W.; Cao, Y. Structure and Phase Transition Behavior of Sn4+-Doped TiO2 Nanoparticles. J. Phys. Chem. C 2009, 113, 18121–18124. [Google Scholar] [CrossRef]
  45. Andrei, C.; O’Reilly, T.; Zerulla, D. A spatially resolved study on the Sn diffusion during the sintering process in the active layer of dye sensitised solar cells. Phys. Chem. Chem. Phys. 2010, 12, 7241–7245. [Google Scholar] [CrossRef]
  46. Gao, B.; Lim, T.M.; Subagio, D.P.; Lim, T.-T. Zr-doped TiO2 for enhanced photocatalytic degradation of bisphenol A. Appl. Catal. A Gen. 2010, 375, 107–115. [Google Scholar] [CrossRef]
  47. Wang, J.; Yu, Y.; Li, S.; Guo, L.; Wang, E.; Cao, Y. Doping Behavior of Zr4+ Ions in Zr4+-Doped TiO2 Nanoparticles. J. Phys. Chem. C 2013, 117, 27120–27126. [Google Scholar] [CrossRef]
  48. Cavalheiro, A.A.; De Oliveira, L.C.S.; dos Santos, S.A.L. Structural Aspects of Anatase to Rutile Phase Transition in Titanium Dioxide Powders Elucidated by the Rietveld Method. Titanium Dioxide 2017, 63. [Google Scholar] [CrossRef] [Green Version]
  49. Mikami, M.; Nakamura, S.; Kitao, O.; Arakawa, H. Lattice dynamics and dielectric properties of TiO2 anatase: A first-principles study. Phys. Rev. B 2002, 66, 1–6. [Google Scholar] [CrossRef]
  50. Tompsett, G.A.; Bowmaker, G.A.; Cooney, R.P.; Metson, J.; Rodgers, K.A.; Seakins, J.M. The Raman spectrum of brookite, TiO2. J.Raman Spectrosc. 1995, 26, 57–62. [Google Scholar] [CrossRef]
  51. Šćepanović, M.; Aškrabić, S.; Berec, V.; Golubović, A.; Dohčević-Mitrović, Z.; Kremenovic, A.; Popović, Z. Characterization of La-Doped TiO2 Nanopowders by Raman Spectroscopy. Acta Phys. Pol. A 2009, 115, 771–774. [Google Scholar] [CrossRef]
  52. Sahoo, S.; Arora, A.K.; Sridharan, V. Raman Line Shapes of Optical Phonons of Different Symmetries in Anatase TiO2 Nanocrystals. J. Phys. Chem. C 2009, 113, 16927–16933. [Google Scholar] [CrossRef]
  53. Parker, J.C.; Siegel, R.W. Calibration of the Raman spectrum to the oxygen stoichiometry of nanophase TiO2. Appl. Phys. Lett. 1990, 57, 943–945. [Google Scholar] [CrossRef]
  54. Zhu, K.-R.; Zhang, M.-S.; Chen, Q.; Yin, Z. Size and phonon-confinement effects on low-frequency Raman mode of anatase TiO2 nanocrystal. Phys. Lett. A 2005, 340, 220–227. [Google Scholar] [CrossRef]
  55. Gao, Y.; Zhao, X.; Yin, P.; Gao, F. Size-Dependent Raman Shifts for nanocrystals. Sci. Rep. 2016, 6, 20539. [Google Scholar] [CrossRef] [PubMed]
  56. Spanier, J.E.; Robinson, R.D.; Zhang, F.; Chan, S.-W.; Herman, I.P. Size-dependent properties of CeO2−y nanoparticles as studied by Raman scattering. Phys. Rev. B 2001, 64, 245407. [Google Scholar] [CrossRef] [Green Version]
  57. Kumaravel, V.; Rhatigan, S.; Mathew, S.; Michel, M.C.; Bartlett, J.; Nolan, M.; Hinder, S.J.; Gascó, A.; Ruiz-Palomar, C.; Hermosilla, D.; et al. Mo doped TiO2: Impact on oxygen vacancies, anatase phase stability and photocatalytic activity. J. Phys. Mater. 2020, 3, 025008. [Google Scholar] [CrossRef]
  58. Tsuda, A.; Konduru, N.V. The role of natural processes and surface energy of inhaled engineered nanoparticles on aggregation and corona formation. NanoImpact 2016, 2, 38–44. [Google Scholar] [CrossRef] [Green Version]
  59. Tahmasebpoor, M.; De Martín, L.; Talebi, M.; Mostoufi, N.; Van Ommen, J.R. The role of the hydrogen bond in dense nanoparticle–gas suspensions. Phys. Chem. Chem. Phys. 2013, 15, 5788–5793. [Google Scholar] [CrossRef] [Green Version]
  60. Colomer, M.T. Straightforward synthesis of Ti-doped YSZ gels by chemical modification of the precursors alkoxides. J. Sol-Gel Sci. Technol. 2013, 67, 135–144. [Google Scholar] [CrossRef]
  61. Chen, H.-S.; Kumar, R.V. Sol–gel TiO2 in self-organization process: Growth, ripening and sintering. RSC Adv. 2012, 2, 2294–2301. [Google Scholar] [CrossRef]
  62. Nikkanen, J.-P.; Kanerva, T.; Mäntylä, T. The effect of acidity in low-temperature synthesis of titanium dioxide. J. Cryst. Growth 2007, 304, 179–183. [Google Scholar] [CrossRef]
  63. Zalas, M.; Wawrzyńczak, A.; Półrolniczak, P.; Sobuś, J.; Schroeder, G.; Jurga, S.; Selli, E. Effect of Solvent Variations in the Alcothermal Synthesis of Template-Free Mesoporous Titania for Dye-Sensitized Solar Cells Applications. PLoS ONE 2016, 11, e0164670. [Google Scholar] [CrossRef]
  64. Freund, F.; Staple, A.; Scoville, J. Organic protomolecule assembly in igneous minerals. Proc. Natl. Acad. Sci. USA 2001, 98, 2142–2147. [Google Scholar] [CrossRef] [PubMed] [Green Version]
  65. Nikkanen, J.-P.; Huttunen-Saarivirta, E.; Zhang, X.; Heinonen, S.; Kanerva, T.; Levänen, E.; Mäntylä, T. Effect of 2-propanol and water contents on the crystallization and particle size of titanium dioxide synthesized at low-temperature. Ceram. Int. 2014, 40, 4429–4435. [Google Scholar] [CrossRef]
  66. Arunachalam, T.; Karpagasundaram, M.; Rajarathinam, N. Ultrasound assisted green synthesis of cerium oxide nanoparticles using Prosopis juliflora leaf extract and their structural, optical and antibacterial properties. Mater. Sci. 2017, 35, 791–798. [Google Scholar] [CrossRef] [Green Version]
  67. Pretsch, E.; Buhlmann, P.; Badertscher, M. Structure Determination of Organic Compounds; Springer Science and Business Media LLC: Berlin/Heidelberg, Germany, 2009; pp. 269–335. [Google Scholar]
  68. Burunkaya, E.; Akarsu, M.; Camurlu, H.E.; Kesmez, Ö.; Yesil, Z.; Asiltürk, M.; Arpaç, E. Production of stable hydrosols of crystalline TiO2 nanoparticles synthesized at relatively low temperatures in diverse media. Appl. Surf. Sci. 2013, 265, 317–323. [Google Scholar] [CrossRef]
  69. Muñoz-Aguado, M.; Gregorkiewitz, M.; Larbot, A. Sol-gel synthesis of the binary oxide (Zr,Ti)O2 from the alkoxides and acetic acid in alcoholic medium. Mater. Res. Bull. 1992, 27, 87–97. [Google Scholar] [CrossRef]
  70. Doeuff, S.; Henry, M.; Sanchez, C.; Livage, J. Hydrolysis of titanium alkoxides: Modification of the molecular precursor by acetic acid. J. Non Cryst. Solids 1987, 89, 206–216. [Google Scholar] [CrossRef]
  71. Elghniji, K.; Anna-Rabah, Z.; Elaloui, E. Novel and facile synthesis of transparent-monolithic TiO2 gels by sol-gel method based on an esterification reaction. Mater. Sci. 2016, 34, 633–640. [Google Scholar] [CrossRef] [Green Version]
  72. Thommes, M.; Kaneko, K.; Neimark, A.V.; Olivier, J.P.; Rodriguez-Reinoso, F.; Rouquerol, J.; Sing, K.S. Physisorption of gases, with special reference to the evaluation of surface area and pore size distribution (IUPAC Technical Report). Pure Appl. Chem. 2015, 87, 1051–1069. [Google Scholar] [CrossRef] [Green Version]
  73. Li, D.; Song, H.; Meng, X.; Shen, T.; Sun, J.; Han, W.; Wang, X. Effects of Particle Size on the Structure and Photocatalytic Performance by Alkali-Treated TiO2. Nanomaterials 2020, 10, 546. [Google Scholar] [CrossRef] [PubMed] [Green Version]
  74. Benkhennouche-Bouchene, H.; Mahy, J.; Wolfs, C.; Vertruyen, B.; Poelman, D.; Eloy, P.; Hermans, S.; Bouhali, M.; Souici, A.; Bourouina-Bacha, S.; et al. Green Synthesis of N/Zr Co-Doped TiO2 for Photocatalytic Degradation of p-Nitrophenol in Wastewater. Catalizers 2021, 11, 235. [Google Scholar] [CrossRef]
  75. Singh, M.; Goyal, M.; Devlal, K. Size and shape effects on the band gap of semiconductor compound nanomaterials. J. Taibah Univ. Sci. 2018, 12, 470–475. [Google Scholar] [CrossRef] [Green Version]
  76. Gnatyuk, Y.; Smirnova, N.; Korduban, O.; Eremenko, A. Effect of zirconium incorporation on the stabilization of TiO2 mesoporous structure. Surf. Interface Anal. 2010, 42, 1276–1280. [Google Scholar] [CrossRef]
  77. Li, J.; Wu, E.-H.; Hou, J.; Huang, P.; Xu, Z.; Jiang, Y.; Liu, Q.-S.; Zhong, Y.-Q. A facile method for the preparation of black TiO2 by Al reduction of TiO2 and their visible light photocatalytic activity. RSC Adv. 2020, 10, 34775–34780. [Google Scholar] [CrossRef]
  78. Hannula, M.; Ali-Löytty, H.; Lahtonen, K.; Sarlin, E.; Saari, J.; Valden, M. Improved Stability of Atomic Layer Deposited Amorphous TiO2 Photoelectrode Coatings by Thermally Induced Oxygen Defects. Chem. Mater. 2018, 30, 1199–1208. [Google Scholar] [CrossRef] [PubMed] [Green Version]
  79. Biesinger, M.C.; Lau, L.W.; Gerson, A.R.; Smart, R.S. Resolving surface chemical states in XPS analysis of first row transition metals, oxides and hydroxides: Sc, Ti, V, Cu and Zn. Appl. Surf. Sci. 2010, 257, 887–898. [Google Scholar] [CrossRef]
  80. Livraghi, S.; Chiesa, M.; Paganini, M.C.; Giamello, E. On the Nature of Reduced States in Titanium Dioxide As Monitored by Electron Paramagnetic Resonance. I: The Anatase Case. J. Phys. Chem. C 2011, 115, 25413–25421. [Google Scholar] [CrossRef]
  81. Yu, J.C.; Lin, J.; Kwok, R.W.M. Ti1-xZrxO2 Solid Solutions for the Photocatalytic Degradation of Acetone in Air. J. Phys. Chem. B 1998, 102, 5094–5098. [Google Scholar] [CrossRef]
  82. Saha, A.; Moya, A.; Kahnt, A.; Iglesias, D.; Marchesan, S.; Wannemacher, R.; Prato, M.; Vilatela, J.J.; Guldi, D.M. Interfacial charge transfer in functionalized multi-walled carbon nanotube@TiO2 nanofibres. Nanoscale 2017, 9, 7911–7921. [Google Scholar] [CrossRef] [Green Version]
  83. Farsinezhad, S.; Sharma, H.; Shankar, K. Interfacial band alignment for photocatalytic charge separation in TiO2 nanotube arrays coated with CuPt nanoparticles. Phys. Chem. Chem. Phys. 2015, 17, 29723–29733. [Google Scholar] [CrossRef] [Green Version]
  84. Kahn, A. Fermi level, work function and vacuum level. Mater. Horizons 2016, 3, 7–10. [Google Scholar] [CrossRef]
  85. Mohajernia, S.; Andryskova, P.; Zoppellaro, G.; Hejazi, S.; Kment, S.; Zboril, R.; Schmidt, J.; Schmuki, P. Influence of Ti3+ defect-type on heterogeneous photocatalytic H2 evolution activity of TiO2. J. Mater. Chem. A 2020, 8, 1432–1442. [Google Scholar] [CrossRef]
  86. Chiesa, M.; Paganini, M.C.; Livraghi, S.; Giamello, E. Charge trapping in TiO2 polymorphs as seen by Electron Paramagnetic Resonance spectroscopy. Phys. Chem. Chem. Phys. 2013, 15, 9435–9447. [Google Scholar] [CrossRef]
  87. Hagfeldt, A.; Boschloo, G.; Sun, L.; Kloo, L.; Pettersson, H. Dye-Sensitized Solar Cells. Chem. Rev. 2010, 110, 6595–6663. [Google Scholar] [CrossRef] [PubMed]
  88. Pradhan, B.; Batabyal, S.K.; Pal, A.J. Vertically aligned ZnO nanowire arrays in Rose Bengal-based dye-sensitized solar cells. Sol. Energy Mater. Sol. Cells 2007, 91, 769–773. [Google Scholar] [CrossRef]
  89. Biswas, S.; Hossain, M.; Takahashi, T. Fabrication of Grätzel solar cell with TiO2/CdS bilayered photoelectrode. Thin Solid Films 2008, 517, 1284–1288. [Google Scholar] [CrossRef]
  90. Tasić, N.; Marinkovic-Stanojevic, Z.; Brankovic, Z.; Zunic, M.; Lacnjevac, U.; Gilic, M.; Novakovic, T.; Brankovic, G. Mesoporous TiO2 spheres as a photoanodic material in dye-sensitized solar cells. Process. Appl. Ceram. 2018, 12, 374–382. [Google Scholar] [CrossRef] [Green Version]
  91. Shoute, L.C.T.; Loppnow, G.R. Excited-State Metal-to-Ligand Charge Transfer Dynamics of a Ruthenium(II) Dye in Solution and Adsorbed on TiO2 Nanoparticles from Resonance Raman Spectroscopy. J. Am. Chem. Soc. 2003, 125, 15636–15646. [Google Scholar] [CrossRef]
  92. Ünlü, B.; Özacar, M. Effect of Cu and Mn amounts doped to TiO2 on the performance of DSSCs. Sol. Energy 2020, 196, 448–456. [Google Scholar] [CrossRef]
  93. Jiu, J.; Wang, F.; Sakamoto, M.; Takao, J.; Adachi, M. Performance of dye-sensitized solar cell based on nanocrystals TiO2 film prepared with mixed template method. Sol. Energy Mater. Sol. Cells 2005, 87, 77–86. [Google Scholar] [CrossRef]
  94. Ünlü, B.; Çakar, S.; Özacar, M. The effects of metal doped TiO2 and dithizone-metal complexes on DSSCs performance. Sol. Energy 2018, 166, 441–449. [Google Scholar] [CrossRef]
Figure 1. Brillouin zone path G-X-M- G-Z-R-A-Z[X-R]M-A for tetragonal crystals. Reproduced from ref. [25], with permission from Elsevier.
Materials 14 02955 g001
Figure 2. Energy band structure calculated by DFT/PBE+U method for: a-TiO2 crystal in primitive unit cell representation (a), a-TiO2 supercell (2 × 2 × 1 TiO2) (b), t-ZrO2 crystal (c), defected a-TiO2 crystal with titanium vacancies (d) and oxygen vacancies (e), a-TiO2 supercell doped by Zr substituting Ti atom (f) and in interstitial position (g), a-TiO2 doped by Zr atoms substituting Ti atoms (h) and in interstitial position (i) additionally possessing oxygen vacancies.
Materials 14 02955 g002
Figure 3. Valence band maximum and conductionband minimum for structures based on a-TiO2 crystals structure modified by dopants and vacancies calculated by DFT/PBE+U method.
Materials 14 02955 g003
Figure 4. XRD patterns of bare TiO2 annealed at different conditions (a), and Zr4+-doped TiO2 in the form of nanopowders and as working electrodes (on FTO substrate) (b).
Materials 14 02955 g004
Figure 5. Raman spectra of TiO2 nanopowders (a) and FTO nanoparticles (b) annealed at 450 °C for 2 h.
Materials 14 02955 g005
Figure 6. TEM images of undoped TiO2 and Zr-doped nanopowders with distribution histograms annealed at 450 °C for 2 h (left column), and FTO nanoparticles (right column).
Materials 14 02955 g006
Figure 7. TGA and DTG thermograms of TiO2 nanoparticles after drying at 60 °C (a), and FTIR spectra of materials dried at 60 °C (straight line) and annealed at 450 °C for 2 h (dotted line) (b).
Materials 14 02955 g007
Figure 8. Nitrogen adsorption-desorption isotherm curves of nanopowders annealed at 450 °C for 2 h.
Materials 14 02955 g008
Figure 9. DRS spectra (a) calculated using the Kubelka–Munk function F(R), and indirect bandgap evaluation (b) for investigated samples.
Materials 14 02955 g009
Figure 10. XPS spectra of nanoparticles annealed at 450 °C: (a) full scan, (b) C 1s, (c) O 1s, (d) Ti 2p (dotted line—Ti3+ 2p3/2 and 2p1/2), and (e) Zr 3d.
Materials 14 02955 g010
Figure 11. UPS spectra of undoped TiO2 (a,c,d) and nanomaterial with 3.7% content of Zr4+ ions (a,e,f) with a scheme of the energy structure band (b). The enlargements of valence bands (c,e) and secondary electron cut-offs (d,f) are shown.
Materials 14 02955 g011
Figure 12. X-band EPR spectra (a) with an enlargement (b) recorded at 77 K with distinct three components.
Materials 14 02955 g012
Figure 13. J-V characteristics (a), IPCE spectra (b), and Nyquist plots with inserted equivalent circuit scheme used to fit the EIS spectra (c) of investigated DSSCs.
Materials 14 02955 g013
Table 1. List of photovoltaic parameters of DSSCs based on a photoanode prepared using titanium oxide doped with Zr4+ ions.
DopantPhaseAnnealling Temp. [°C]JSC [mA/cm2]VOC [V]FF [%]η [%]Ref.
5% ZrAnatase4500.0170.7120<1[19]
10% ZrAnatase4000.130.450.340.02[20]
5% ZrAnatase60010.660.64614.16[24]
0.5% ZrAnatase45021.830.65537.52[21]
2% ZrAnatase5006.280.78763.23.12[22]
0.3% ZrAnatase50012.910.7239726.7[23]
1% ZrAnatase5007.740.8271.14.51[25]
3.7% ZrAnatase + Brookite45015.470.764172.978.63This study
Table 2. Parameters of the unit cell of the a-TiO2 and t-ZrO2 stoichiometric and defected crystals obtained relaxing structure by applying DFT/PBE+U (UTi = UZr = 6 eV and JTi = JZr = 1 eV) method and compared to experimental data.
Structurea (a = b) [Å]c [Å]c/aTotal Energy/Atom
[eV]
a-TiO23.859.712.52−8.74
3.79 [38,39,40]9.512.51
t-ZrO23.675.211.50−9.27
3.59 [36]5.191.44
3.64 [37]5.271.45
2 × 2 × 1 TiO27.69 9.702.52−8.73
2 × 2 × 1 TiO2 v(Ti)7.72 9.622.49−8.43
2 × 2 × 1 TiO2 v(O)7.68 9.722.53−8.70
2 × 2 × 1 TiO2Zr *7.729.772.53−8.78
2 × 2 × 1 TiO2 Zr v(O) *a = 7.72
b =7.69
9.782.49
2.51
−8.74
2 × 2 × 1 TiO2 Zr v(O) * fara =7.72
b = 7.70
9.792.56
2.54
−8.75
2 × 2 × 1 TiO2+Zr **a = 7.73
b = 7.79
9.702.51
2.49
−8.70
2 × 2 × 1 TiO2+Zr v(O)a = 7.73
b = 7.84
9.722.51
2.48
−8.68
2 × 2 × 1 TiO2+Zr v(O) fara = 7.69
b = 7.86
9.722.53
2.47
−8.67
* 2 × 2 × 1 TiO2Zr ≡ Ti0.94Zr0.06O2. ** 2 × 2 × 1 TiO2+Zr ≡ TiO2 + Zr.
Table 3. The energy of the bandgap calculated by using the DFT/PBE+U method for all modeled structures (the same description as in Table 2).
StructureEbg [eV]
a-TiO23.16
2 × 2 × 1 TiO23.21
2 × 2 × 1 TiO2 v(O)3.29
2 × 2 × 1 TiO2 v(Ti)3.19
2 × 2 × 1 TiO2 Zr 3.21
2 × 2 × 1 TiO2 Zr v(O)3.26
2 × 2 × 1 TiO2 Zr v(O) far3.36
2 × 2 × 1 TiO2 + Zr 3.06
2 × 2 × 1 TiO2 + Zr v(O)3.16
2 × 2 × 1 TiO2 +Zr v(O) far3.27
Table 4. Cell parameters of Zr4+ ions doped TiO2 nanopowders and layers on FTO.
SampleDhkl [nm]a = b [Å]c [Å]Cell volume [Å]
TiO2_FTO7.613.79489.5616134.5931
TiO2:1.3%Zr_FTO6.733.78969.5204133.5283
TiO2:3.7%Zr_FTO5.913.79769.5368134.6059
TiO2:5.6%Zr_FTO6.753.79369.5520134.5368
TiO2 (60 °C, 12 h)4.893.80189.5060137.5812
TiO2 (450 °C, 1 h)6.443.78689.4664135.9226
TiO2 (450 °C, 2 h)12.853.78849.5096136.5429
TiO2:1.3%Zr8.333.78349.4808135.7306
TiO2:3.7%Zr6.563.78889.4976136.4813
TiO2:5.6%Zr6.623.79209.5176136.7810
Table 5. Structural parameters of mesoporous TiO2 nanopowders annealed at 450 °C for 2 h.
SampleABET [m2/g]Vp [cm3/g]Sp [nm]
Undoped69.40.1563.8
1.2%Zr89.10.2385.5
3.7%Zr101.00.3255.5
5.6%Zr132.90.2807.5
Table 6. Indirect energy bandgap values extracted from Tauc’s plots.
SampleEbg [eV]
Undoped3.22
1.2%Zr3.27
3.7%Zr3.26
5.6%Zr3.28
Table 7. Photoelectrochemical parameters of the DSSC based on synthesized nanoparticles.
SampleVOC [mV]JSC [mA/cm2]FF [%]η [%]Ndye [nmol/cm2]IPCE [%]R1 [Ω]R2 [Ω]R3 [Ω]τ [ms]
P25756.113.6272.717.4946.5568.114.294.98530.245.49
Undoped779.113.5070.397.4116.6268.617.344.78530.7910.18
1.2%Zr767.114.6870.667.9627.3678.818.996.68226.2615.96
3.7%Zr764.115.4772.978.6333.7684.317.286.24622.7012.76
5.6%Zr768.111.6375.456.7443.8563.813.610.4624.2110.18
Publisher’s Note: MDPI stays neutral with regard to jurisdictional claims in published maps and institutional affiliations.

