1. Introduction
Nowadays due to growing industrialization, society has to face various environmental problems. Among them, one of the greatest priorities is water pollution caused by heavy metal ions [
1,
2]. Metals of a density larger than 4.5 × 10
−3 g/cm
3 belong definition to the heavy metal group [
2,
3]. In chemical reactions, they tend to donate electrons forming simple cations. They show good thermal and electrical conductivity in the solid as well as liquid states, have a gloss, and are opaque. They have high melting and boiling points and are characterized by reducing properties [
4,
5]. Some of these heavy metals like copper are required by living organisms in a smaller quantity but at higher concentrations, its presence results in toxic effects [
6]. They are found in raw sewage and they are not degraded in the sewage treatment being very harmful to living organisms causing mutagenic changes, damage to the central nervous system, and cancer [
7,
8,
9,
10]. Among them, copper which is present in fertilizers, tanning, and photovoltaic cells can cause allergies, cystic fibrosis, adreno-corticol hyperactivity, alopecia, arthritis, diabetes, hemorrhaging, and kidney disorders [
11]. Copper is considered to process carcinogenic properties through the interaction of its ions with lipids finally resulting in DNA and tissue damage [
12]. Therefore, one of the most important activities to protect human health and the natural environment is the improvement of water quality and sewage management [
13,
14,
15,
16].
Among different methods for wastewater treatment, ion exchange can be considered as one of prime importance as it is technologically simple and enables efficient removal of even traces of impurities from solutions [
17,
18,
19].
The main advantage of using the ion exchange process for the electroplating treatment is that it has the greatest metal ion removal efficiency compared to the conventional methods such as reverse osmosis, electrolysis, or evaporation. At the same time, the ion exchange process requires the use of the smallest amount of energy for wastewater treatment compared to the above-mentioned methods. However, the disadvantage of this method is the need to use chemical reagents in the wastewater treatment process.
The use of natural sorbents would be a much more ecological solution. Yet, a much smaller efficiency of metal ion removal is obtained and is associated with some technical problems such as flow resistance through the ion exchange column.
The ion exchange process is very often used in many stages of technological processes in electroplating. They apply regeneration of chromium plating bath and pickling in phosphoric acid(V), regeneration of rinse water, regeneration of baths for passivation of zinc coatings, recovery of precious metals from rinse waters, final polishing of neutralized sewage. The selective ion exchangers with the aminophosphonic functional groups play a special role in the processes of galvanic wastewater treatment. They are used to remove residues that were not removed during treatment with conventional physicochemical methods.
In the wastewater treatment process, chelating ion exchangers are commonly used. A special feature of this type of resins is the ability of selective sorption of one metal ion in the presence of others. Selective sorption of metal ions is usually not possible using typical cation exchangers because the affinity for the metal ion present in the solution is only determined by the electrostatic interactions. The ability of selective sorption of transition metal ions allows the use of chelating ion exchangers in industrial wastewater treatment processes and recovery of valuable metals from ores and sludges [
20,
21,
22].
As follows from the literature data, the chelating ion exchangers containing aminophosphonic functional groups are characterized better performance in the process of removing Cu(II) and Zn(II) ions from industrial waste, compared to other chelating resins [
23]. They also have a weak affinity for Ca(II) and Mg(II) ions. An example of this type of materials is commercially available Purolite S 940 and Purolite S 950. There are numerous papers and research works concerning the sorption studies of copper ions [
14,
15,
16], however, there is a lack of knowledge concerning the in-depth understanding of the mechanism of this process which can improve its efficiency greatly.
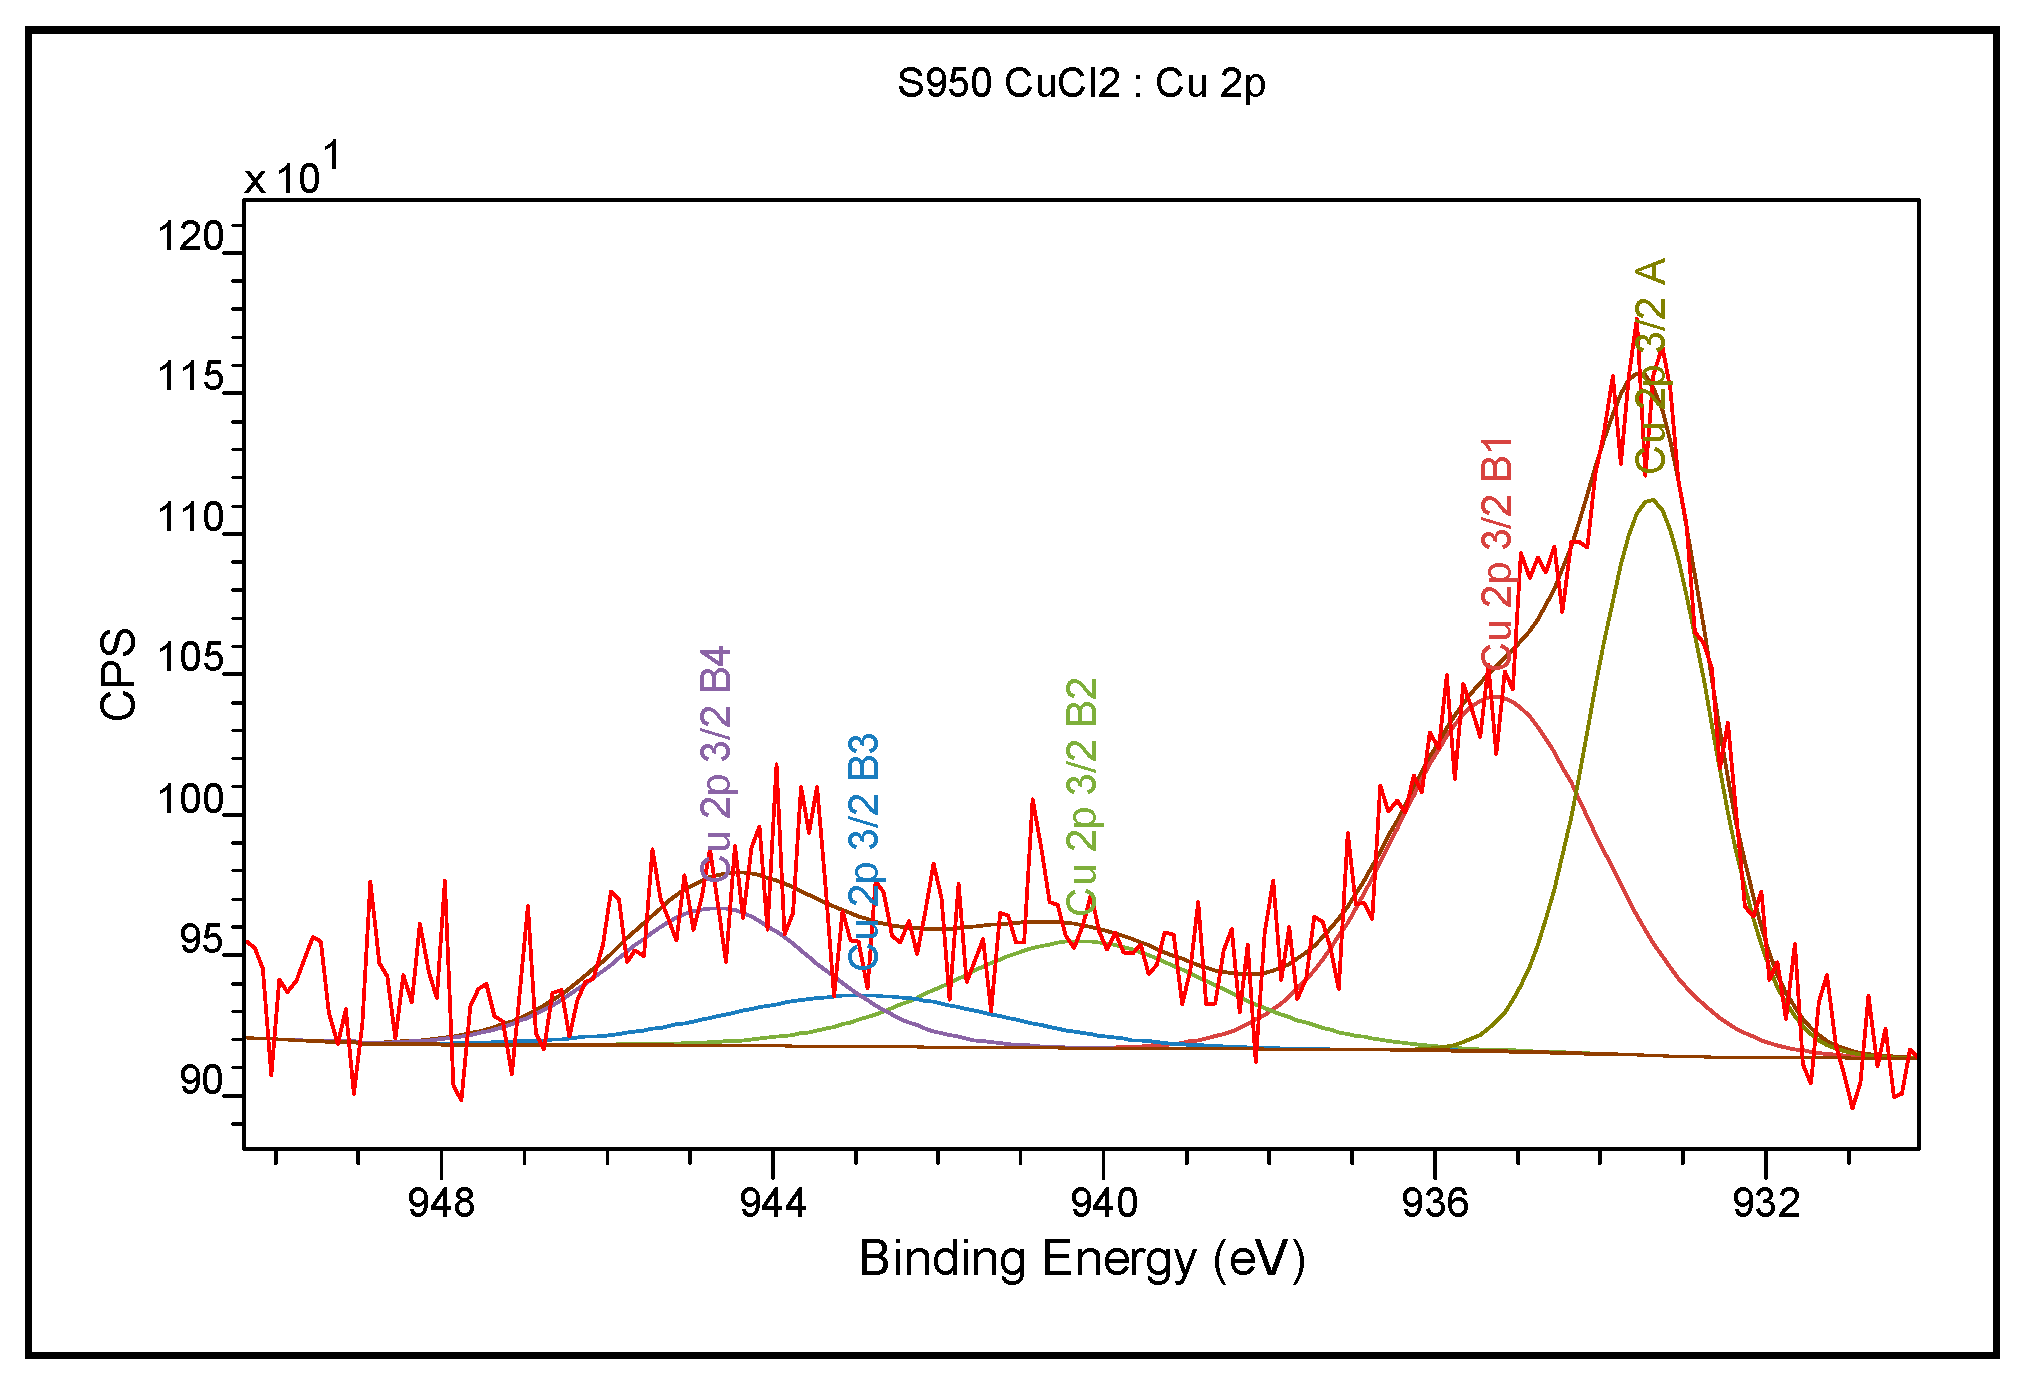
In the present study, the mechanism of Cu(II) ion sorption was examined based on the chosen ion exchangers using modern analytical techniques such as X-ray photoelectron spectroscopy (XPS), Fourier transform infrared spectroscopy (FTIR), and scanning electron microscopy (SEM). The presented results will allow us to learn more about the sorption mechanism using the chelating ion exchangers Purolite S 940 and Purolite S 950.
2. Materials and Methods
2.1. Material
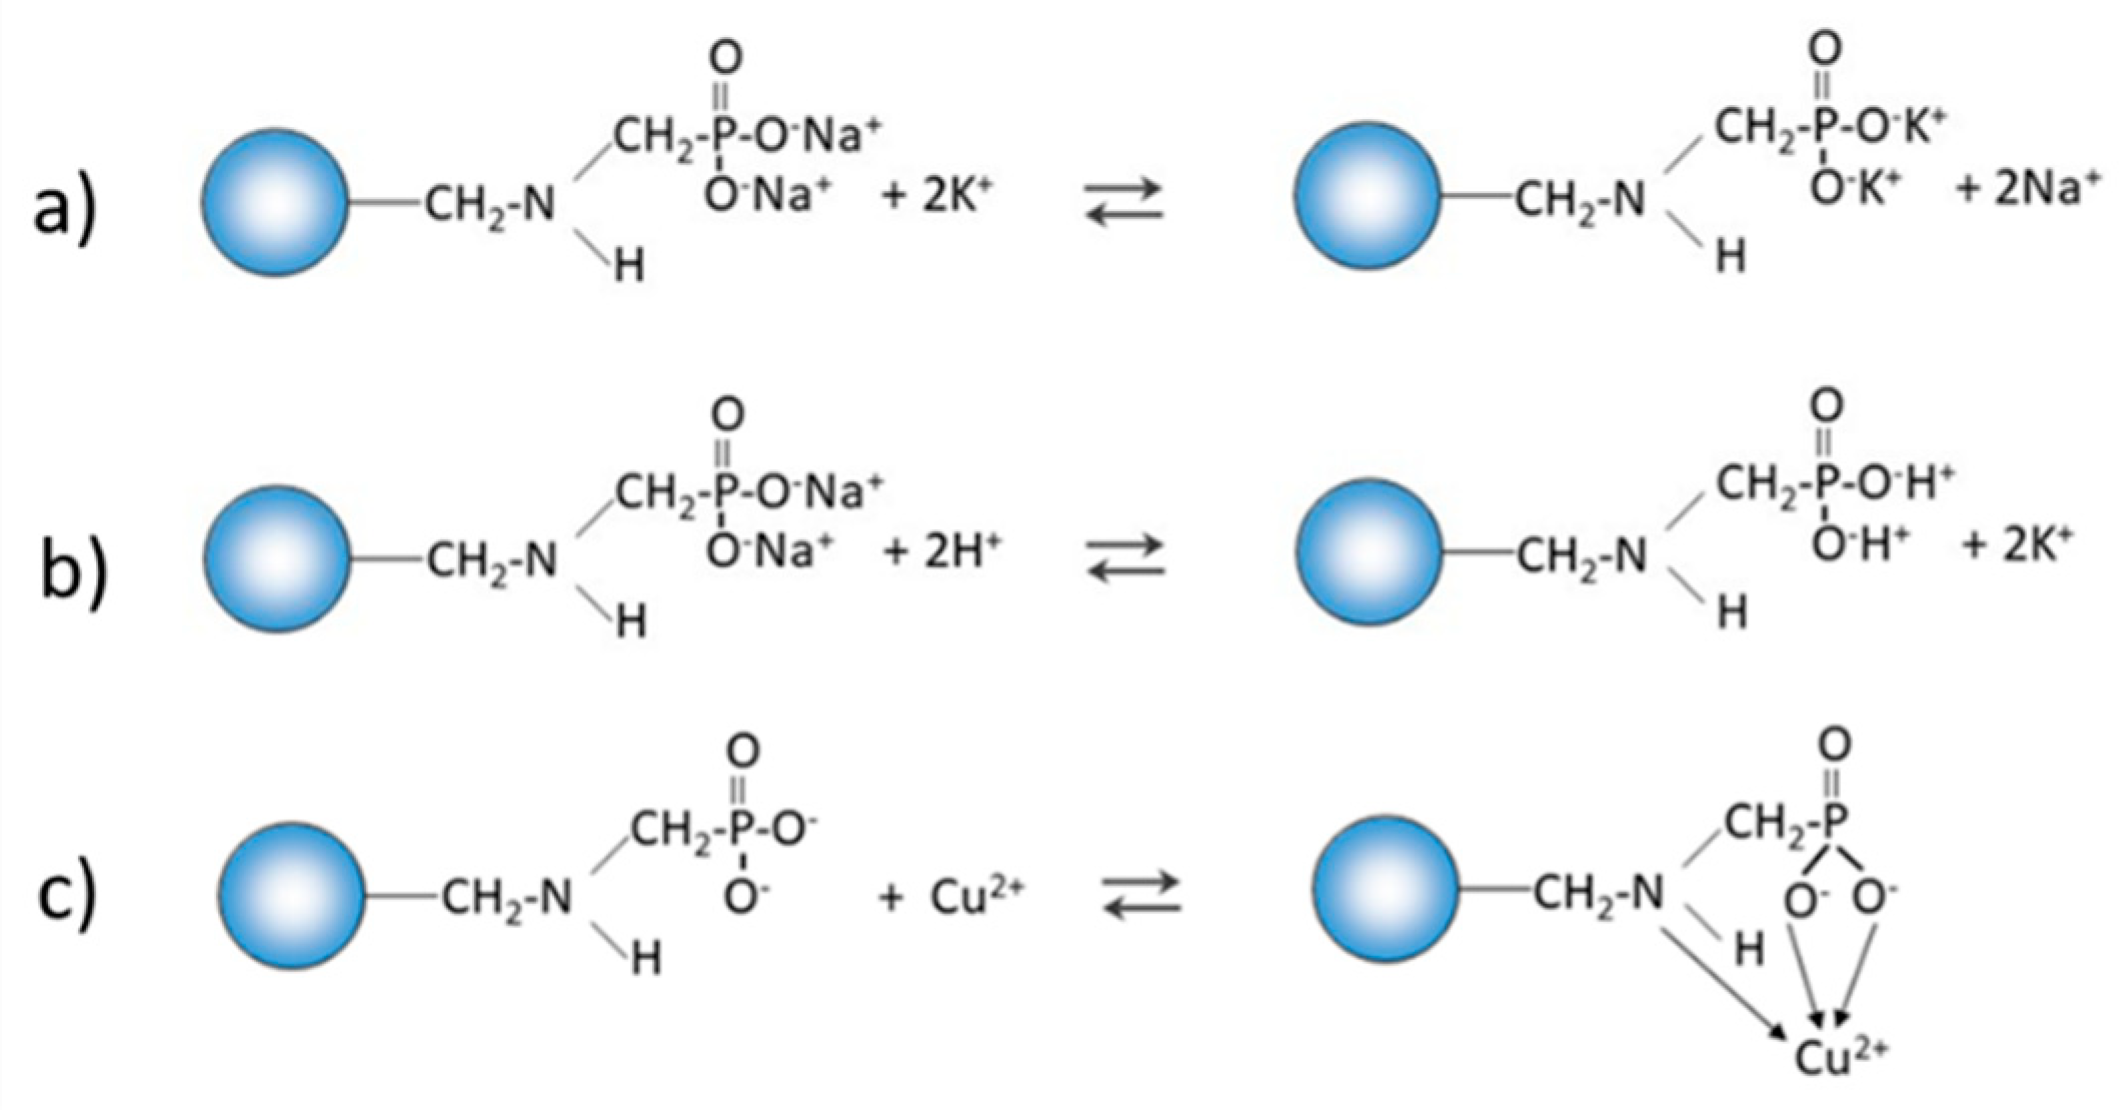
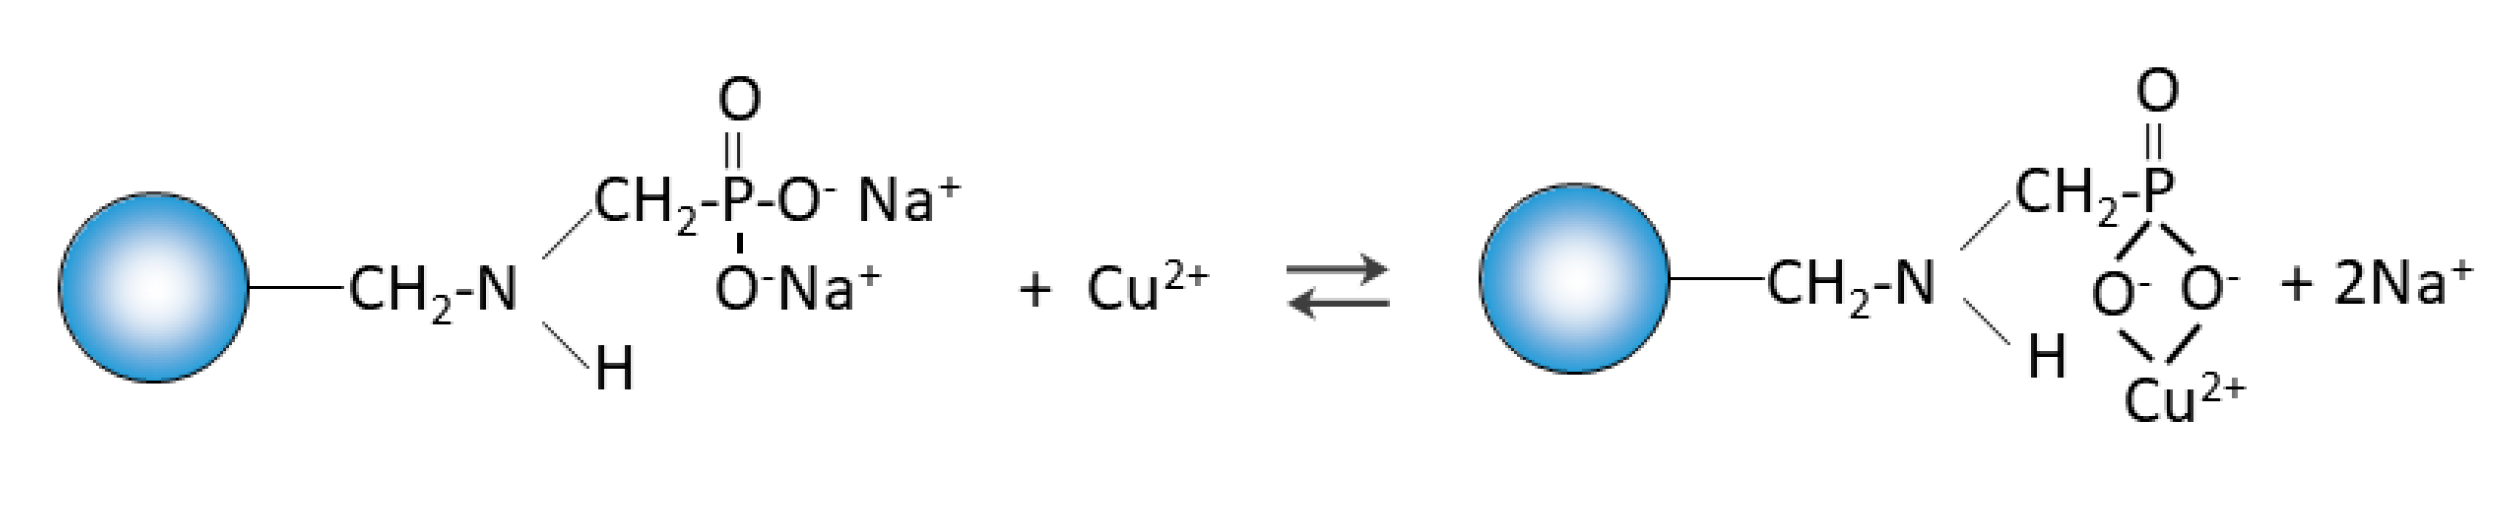
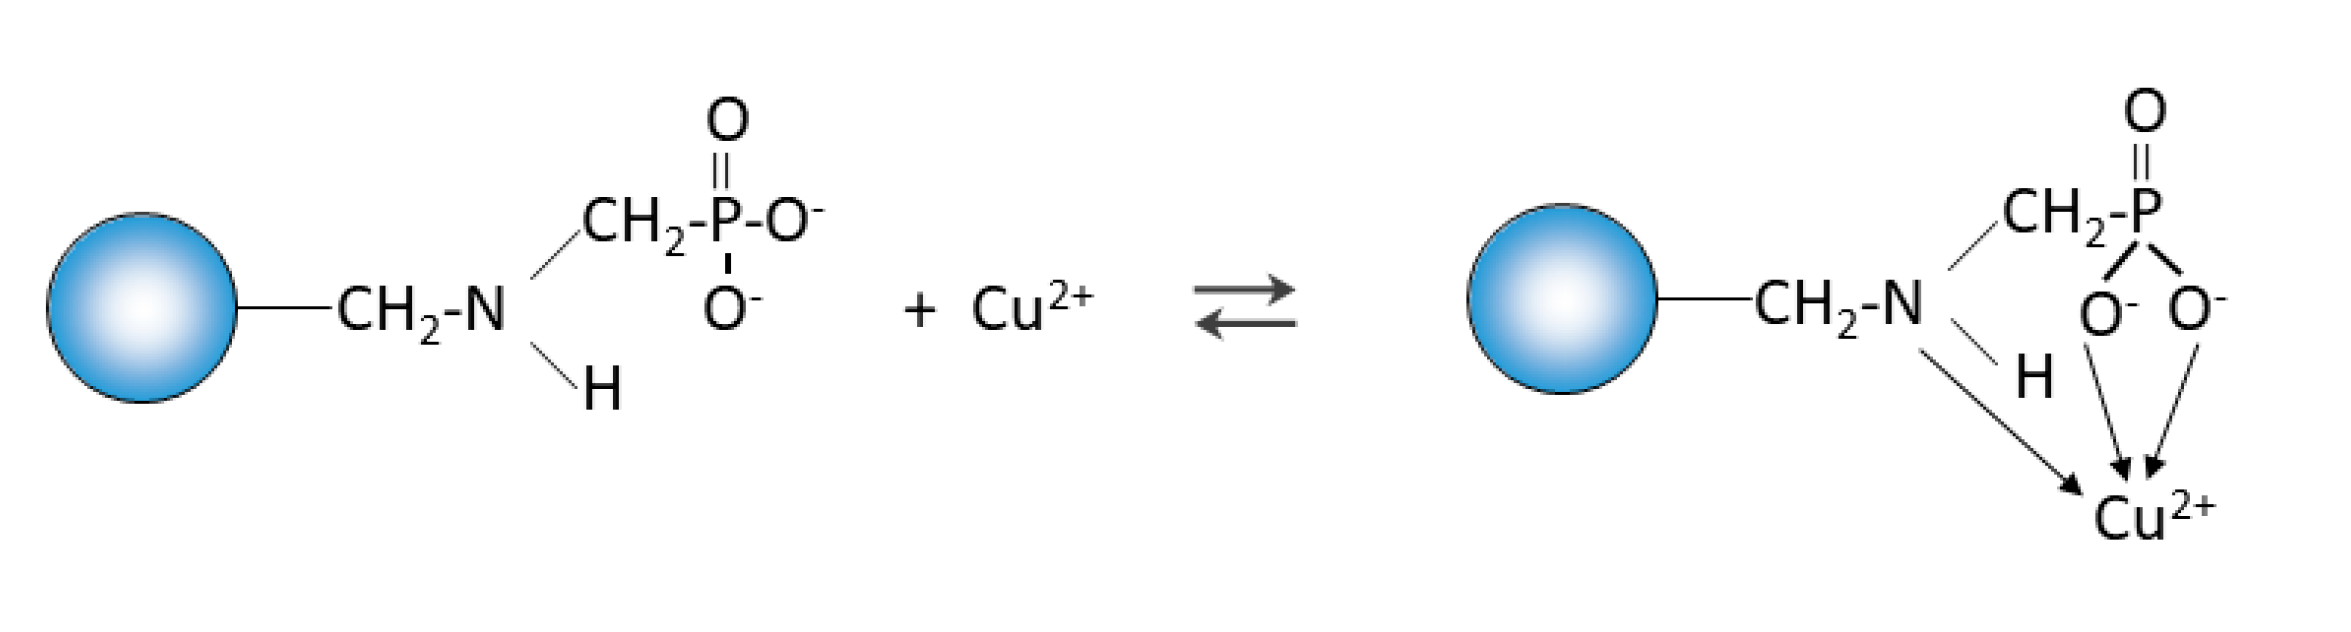
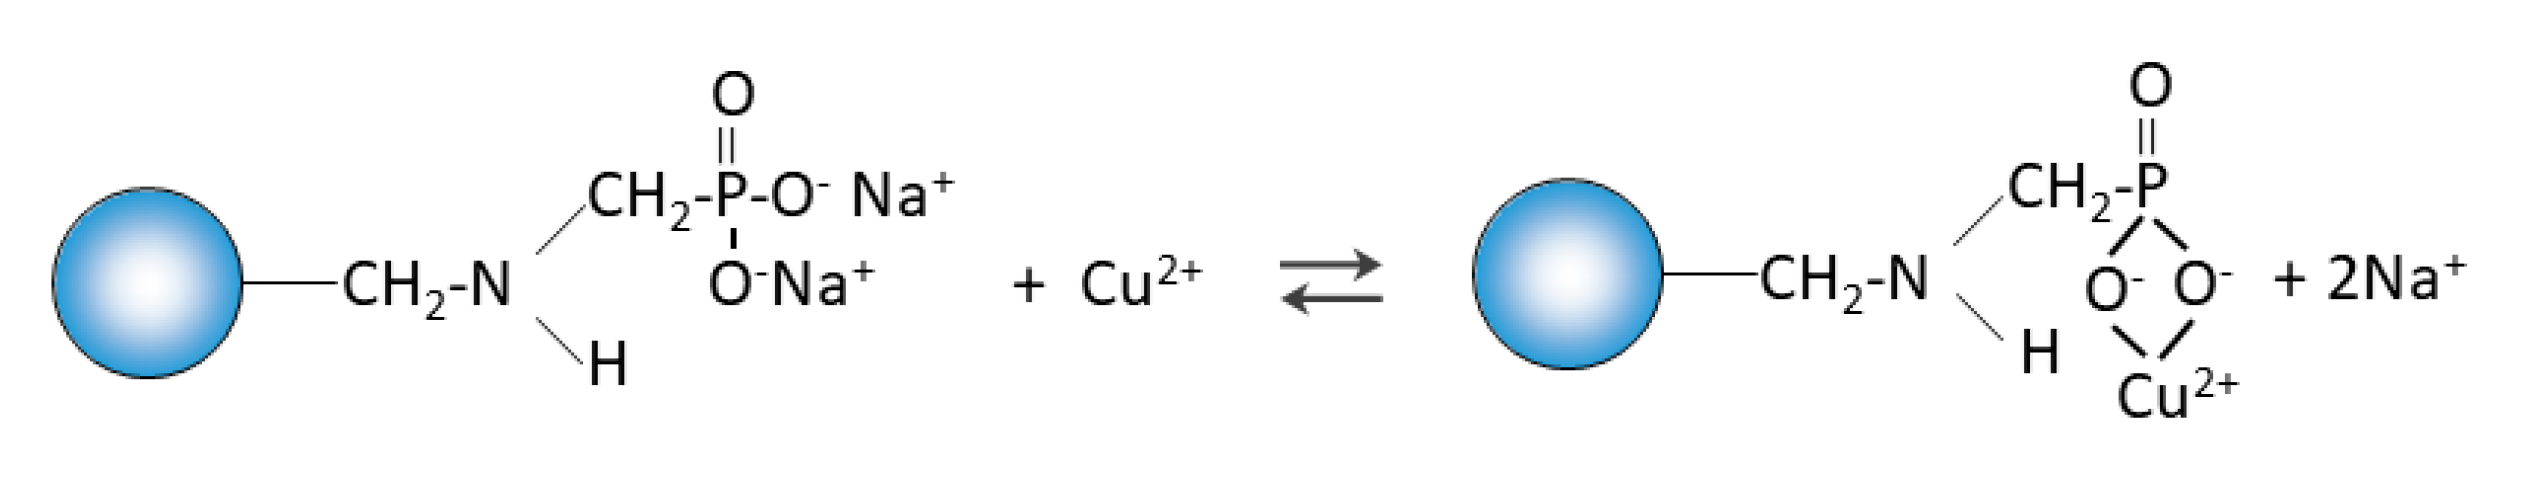
Purolite S 940 and Purolite S 950 are macroporous chelating resins with the aminophosphonic functional groups. The matrix of the above-mentioned ion exchangers is polystyrene cross-linked with divinylbenzene. Their chemical structure is presented in
Figure 1. The selected physicochemical parameters of Purolite S 940 and Purolite S 950 are presented in
Table 1.
2.2. Methods
The research was carried out using the commercial ion exchangers Purolite S 940 and Purolite S 950 (Purolite Ltd., King of Prussia, PA, USA). The aim of the research was to select an appropriate commercial ion exchanger for polishing galvanic wastewater for electroplating plants. The research was carried out using the model solutions and real galvanic wastewater. This paper presents the results of the studies on the sorption of Cu(II) ions on Purolite S 940 and S 950 ion exchangers from the model 0.001 M CuCl2 solution.
The selection of the appropriate model concentration was preceded by the studies on the effect of the solution-ion exchanger phase contact time. Kinetic studies have also been carried out. These sorption tests were carried out using the following solutions on the Purolite S 940 and Purolite S 950 ion exchangers: 0.001 M CuCl2, 0.005 M CuCl2, 0.001 M CuSO4, 0.005 M CuSO4. In the process of removing Cu(II) ions, it should be stated that the chloride system is more favorable for the sorption process compared to the sulfate system with the initial concentration of Cu(II) ions amounting to 0.001 M. The tests proved that the equilibrium state for the solution with the concentration of 0.001 M is achieved in the case of sorption of the Cu(II) ions sorption on all tested ion exchangers after about 40 min. At 0.005 M concentration, equilibrium is reached in a shorter period of time. For example, for the Purolite S 950 ion exchanger, it is about 5 min. 0.001 M CuCl2 was selected as the model solution. The standard solution with a concentration of 0.001 M was prepared from the CuCl2∙2H2O salt (POCh S.A. Gliwice). Additionally, 63.54 g of salt was weighed and dissolved in 1 L of redistilled water. It was adjusted to pH = 4 with NaOH solution and HCl.
Kinetic parameters for the pseudo first-order and pseudo second-order equations as well as intraparticle diffusion were determined.
The linear relationship t/qt = f(t) and the values of the determination coefficients R2 = 0.998 (close to unity), q2 = 8.17 mg/g, k2 = 0.076 g/mg min, h = 5.105 mg/g min as well as good agreement with the experimental data showed that the pseudo second-order kinetic model is fully suitable for the description of the Cu(II) sorption on Purolite S 940. For the IPD model the ki values were equal to 0.259 [mg/g min0.5] and R2 = 0.829 for Purolite S 940. The same results were obtained for Cu(II) ions on the Purolite S 950 ion exchanger. The linear relationship t/qt = f(t) and the values of the determination coefficients R2 = 0.998 (close to unity), q2 = 9.72 mg/g, k2 = 0.048 g/mg min, h = 4.537 mg/g min. For the IPD model the ki value was equal to 0.259 [mg/g min0.5] and R2 = 0.829. Good agreement with the experimental data showed that the pseudo second-order kinetic model is fully suitable for the description of the sorption process.
The final pH was in the range of 4–5.5. The final concentration of the copper solution after sorption on Purolite S 940 ion exchanger was: 20.09 mg cm−3 and for Purolite S 950 ion exchanger was: 14.15 mg cm−3.
The process of Cu(II) ions sorption on Purolite S 940 and Purolite S 950 was conducted in 100 mL Erlenmeyer flasks shaken by means of a laboratory shaker type 357 (Elpin Plus) with a rotation rate of 180 rpm. 0.20 g of the resin was added to 20 mL of 0.001 M CuCl2 metal ion solution. After being shaken at 298 K for 2 h, the solution was separated from the resin. The resin was dried at room temperature.
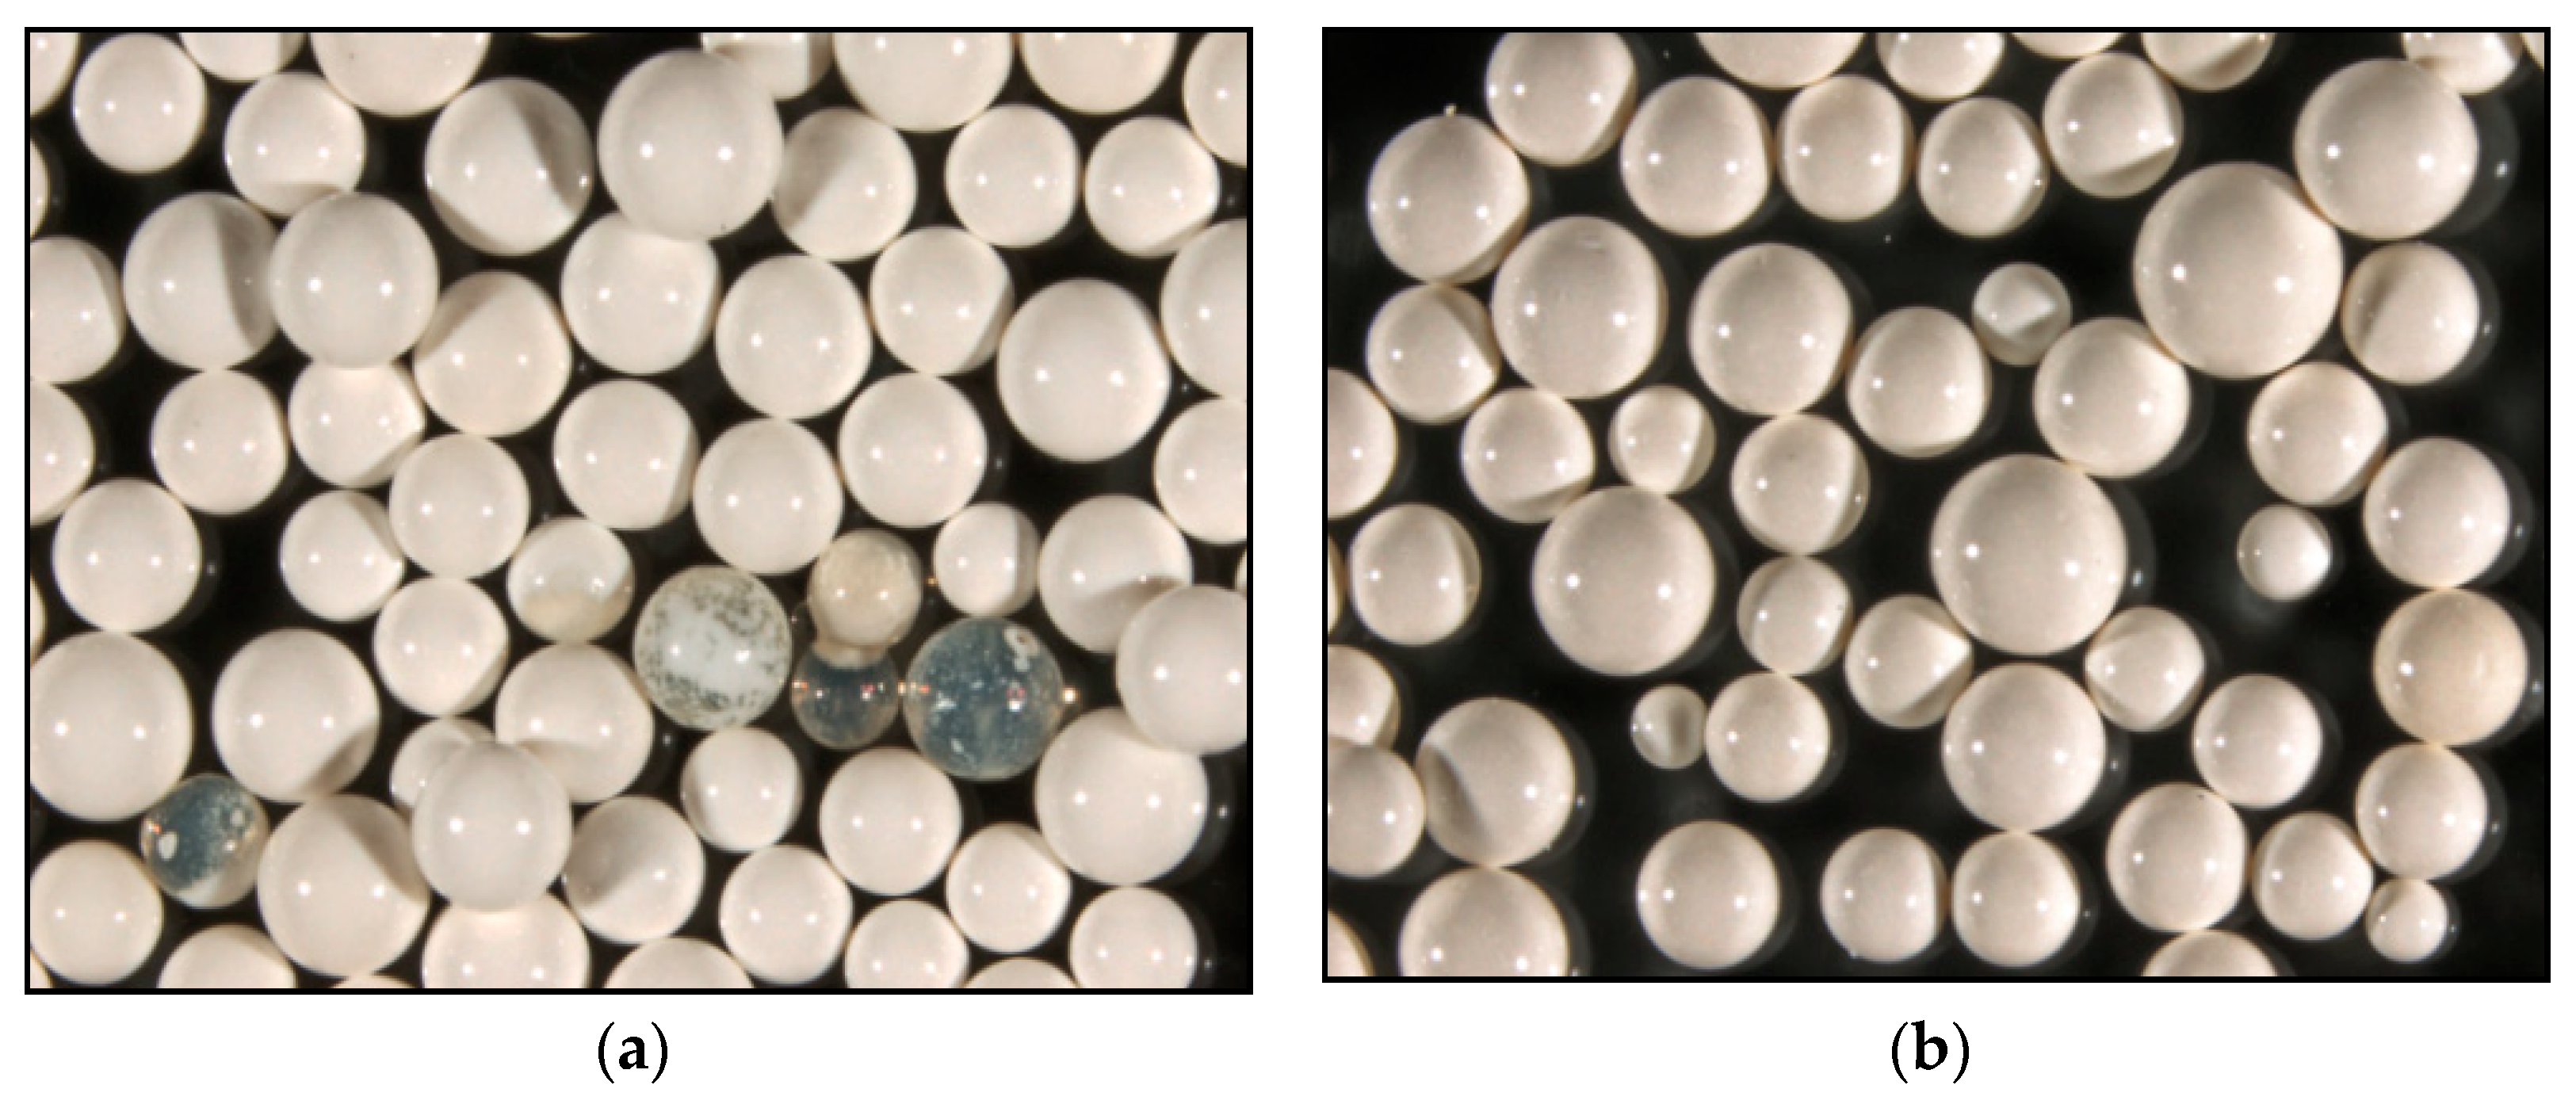
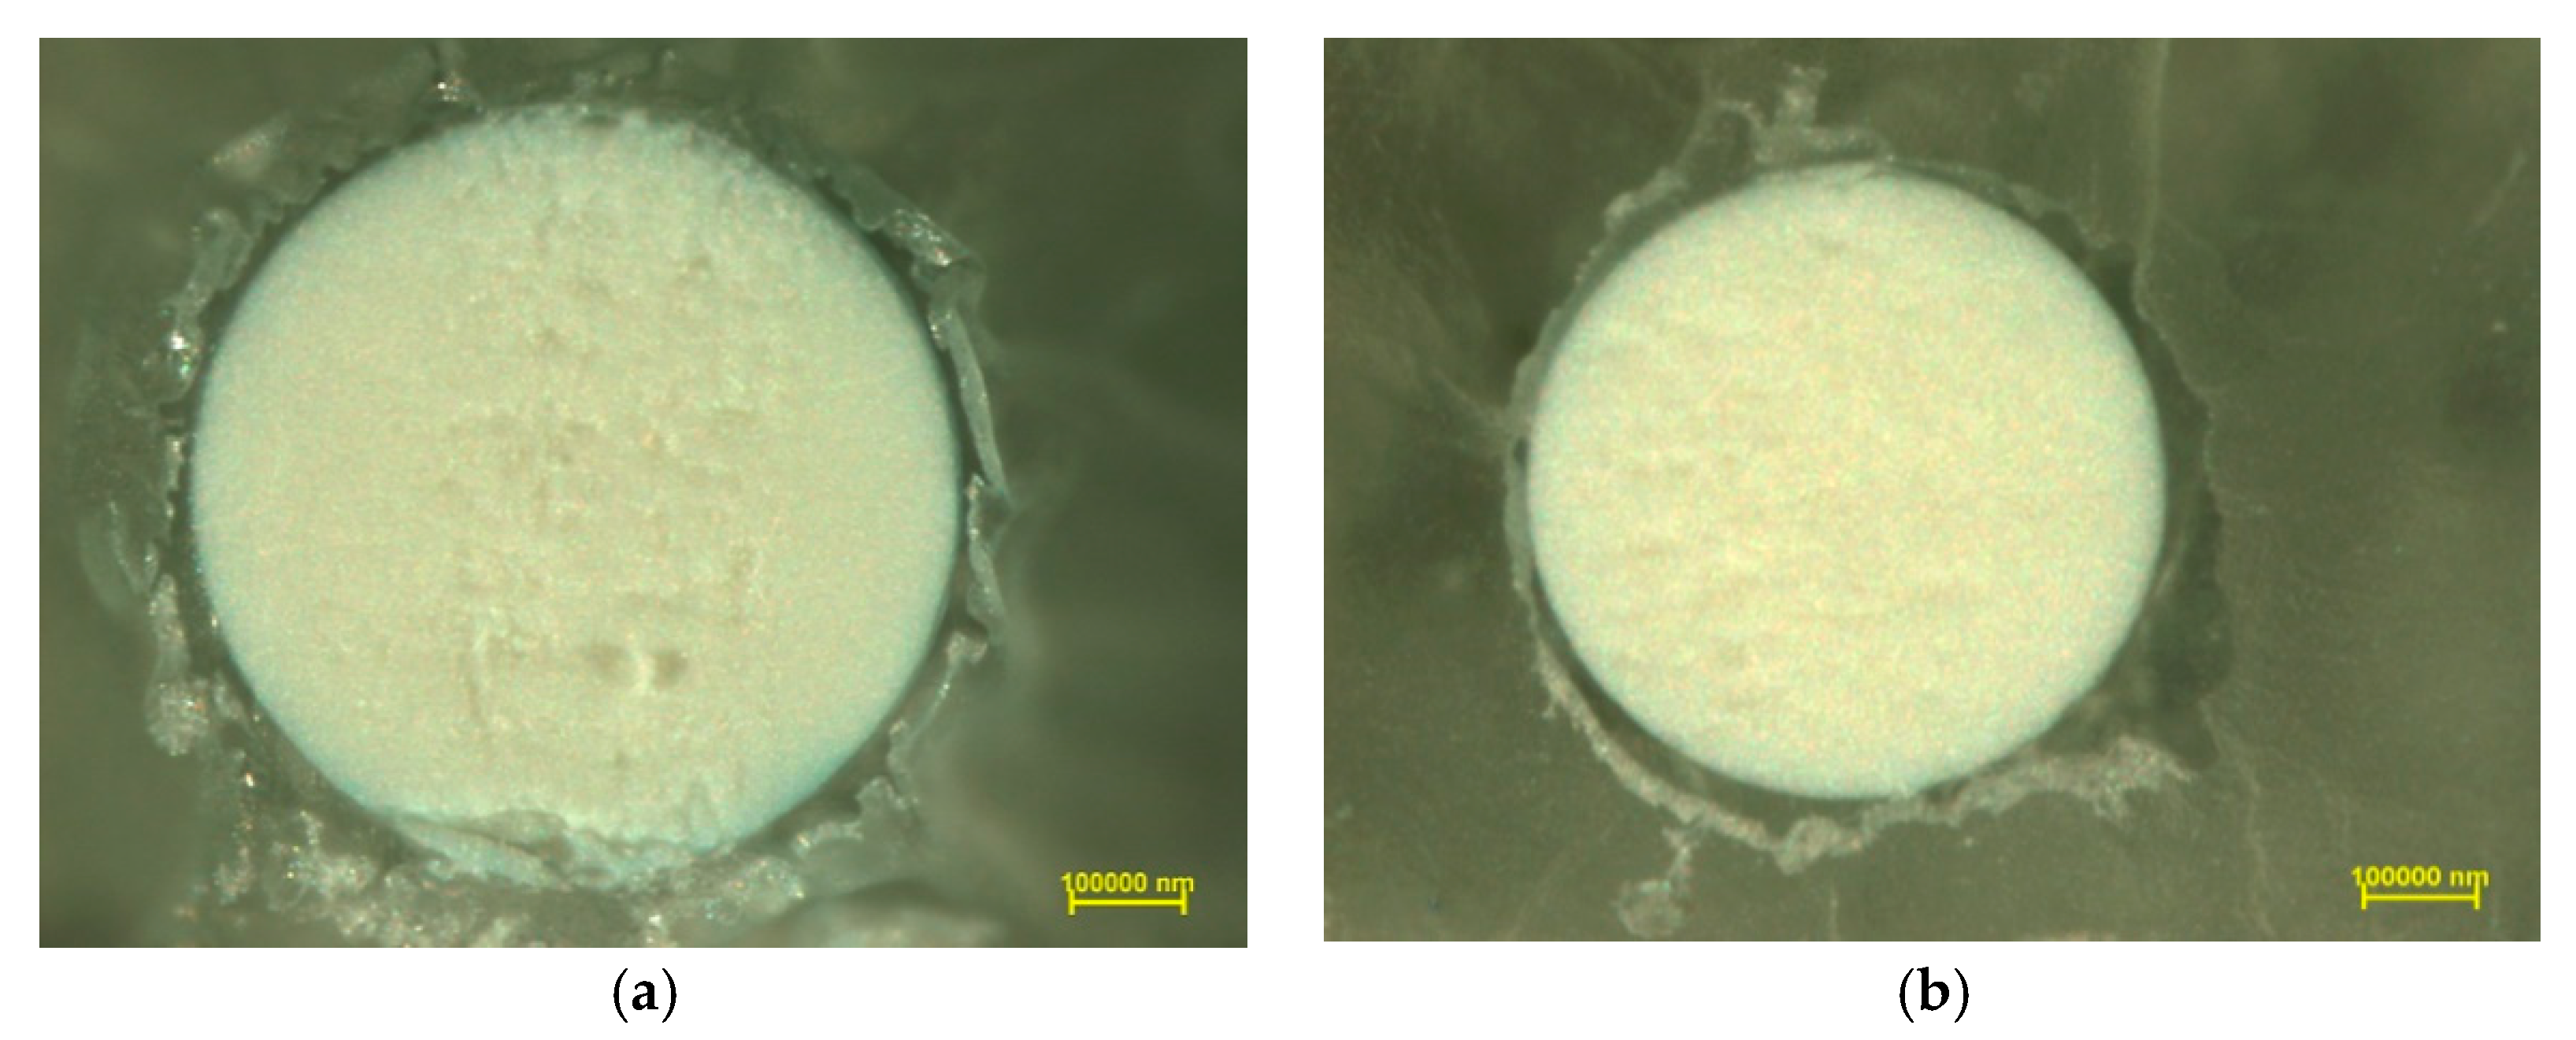
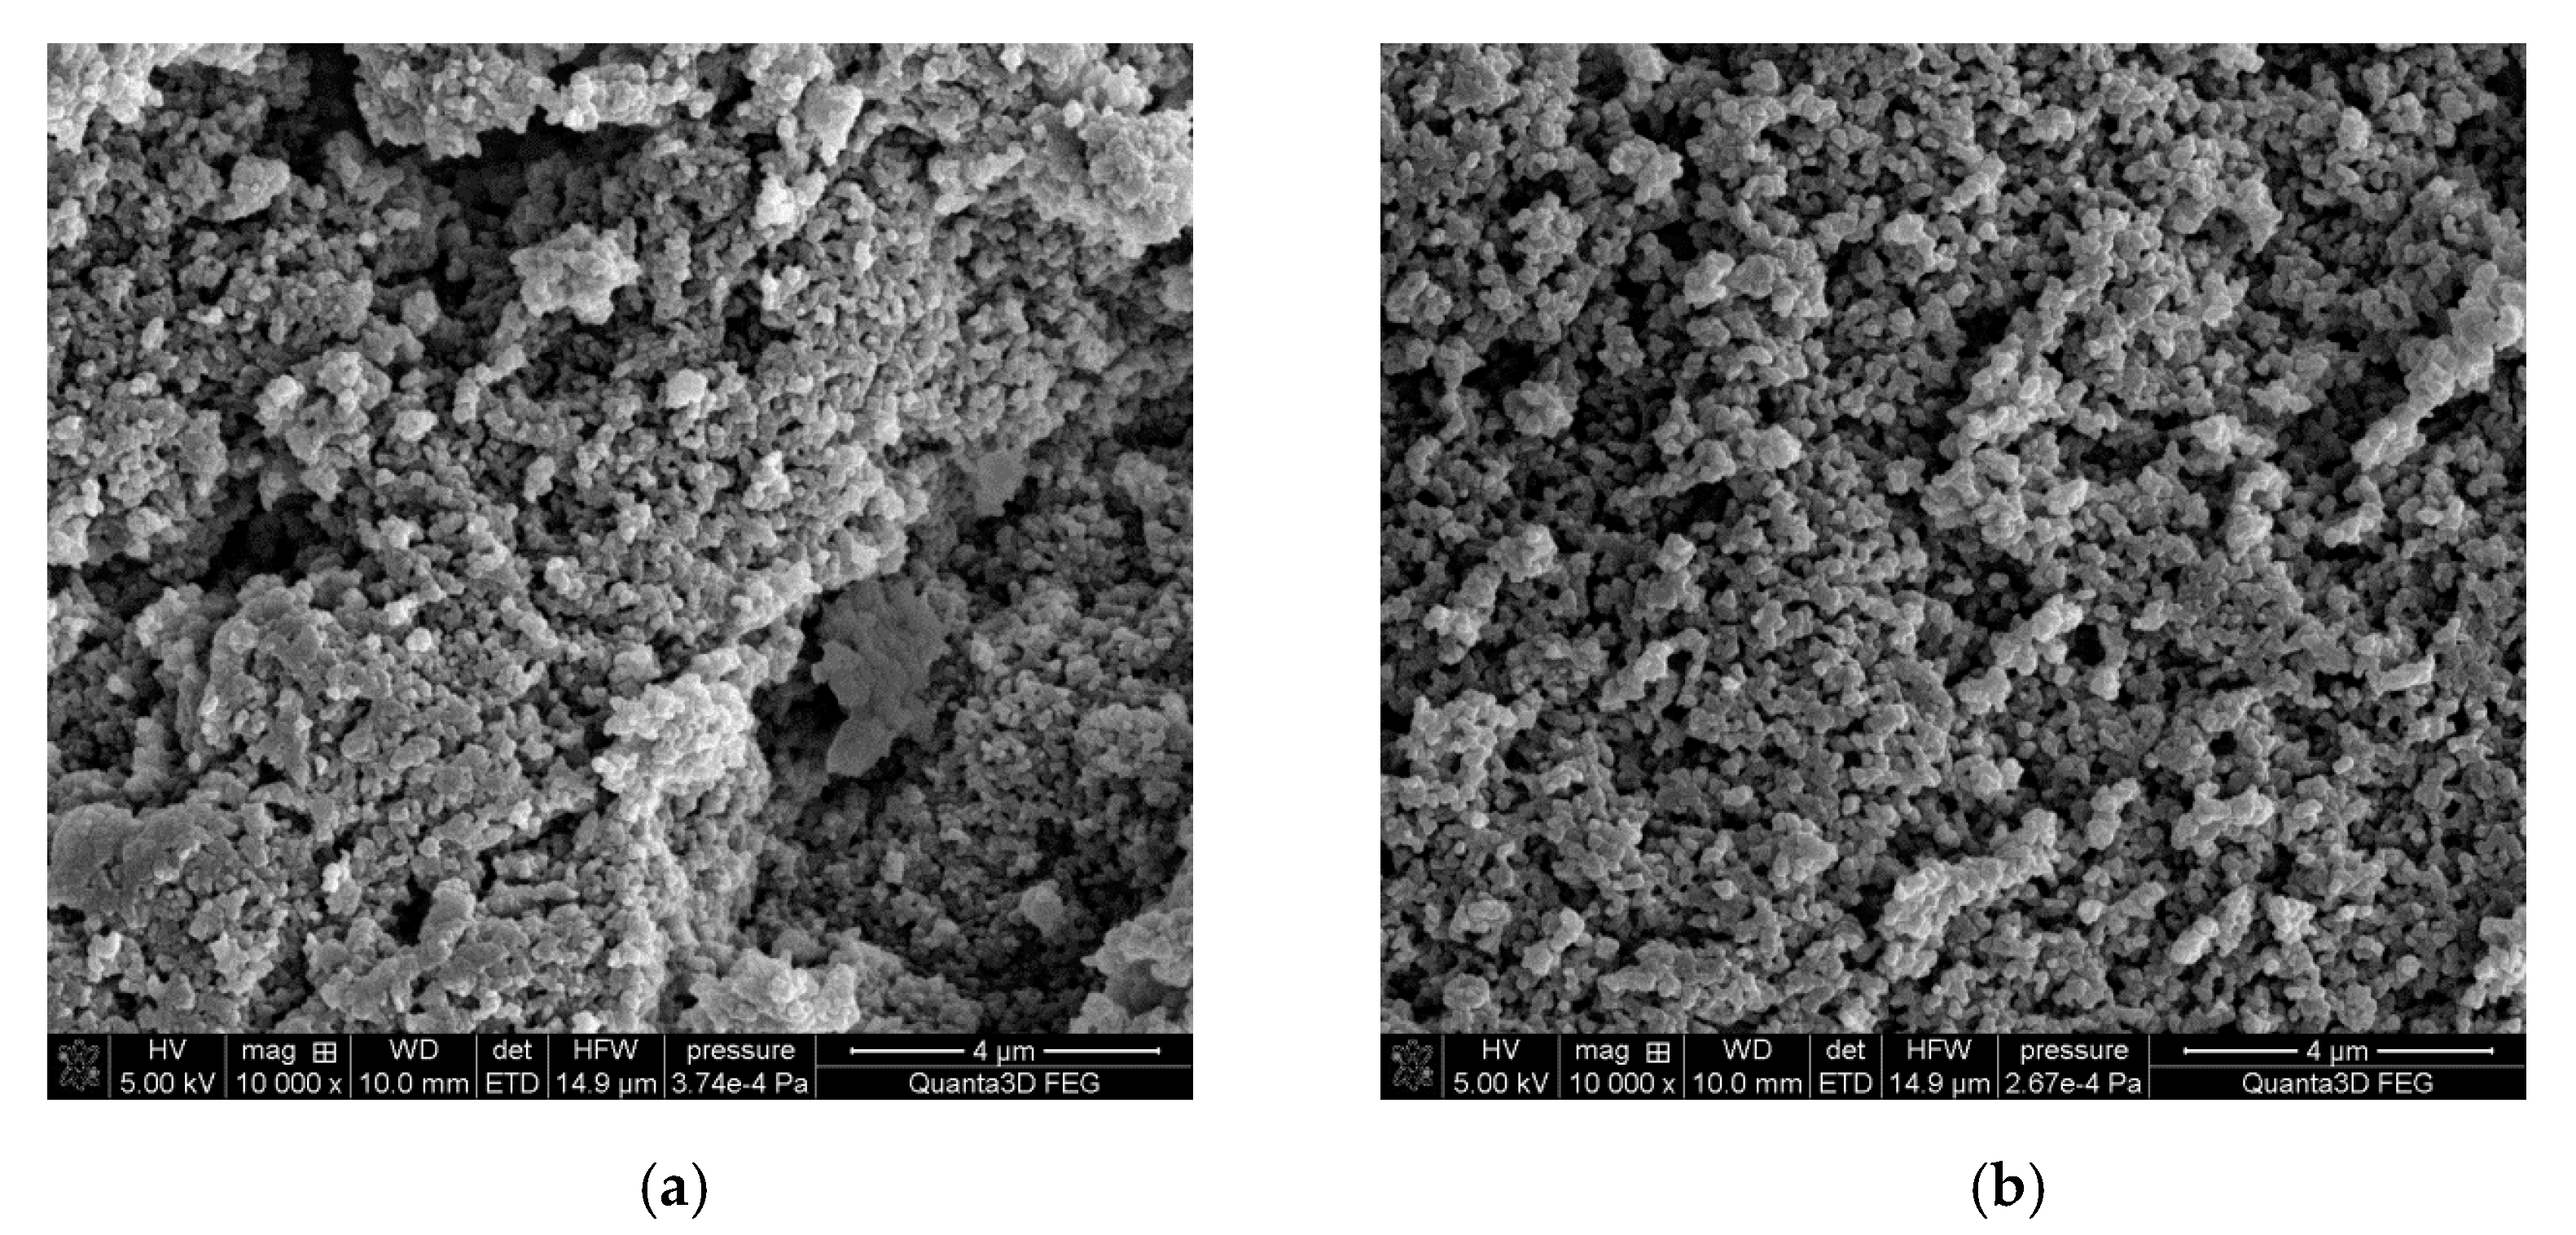
2.2.1. Microscopic Studies
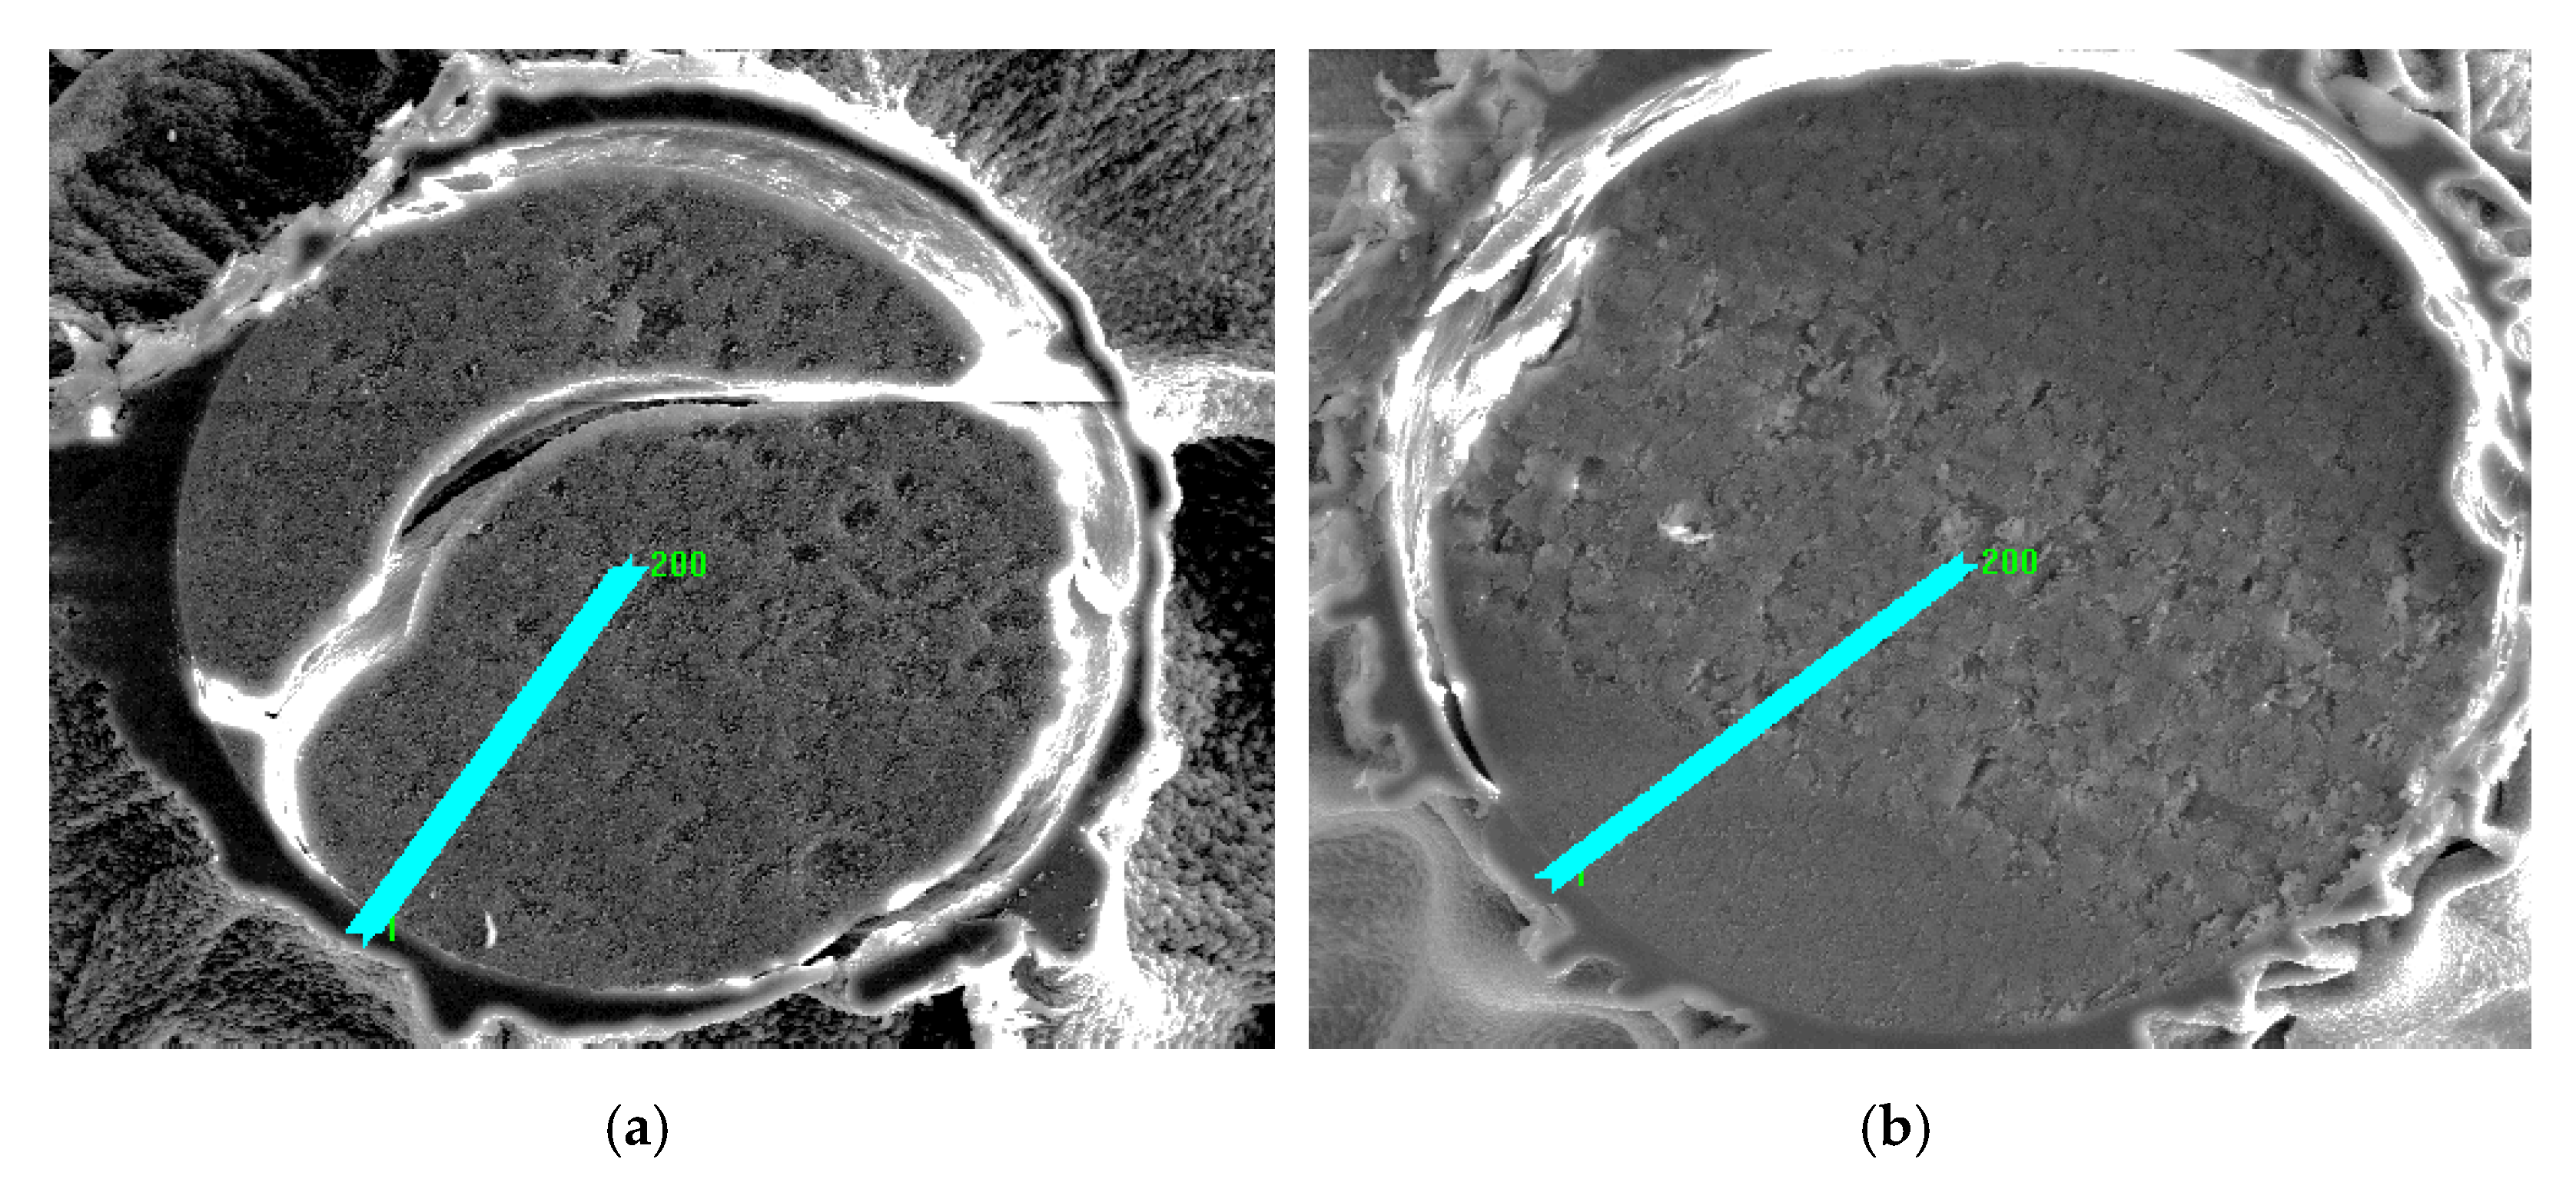
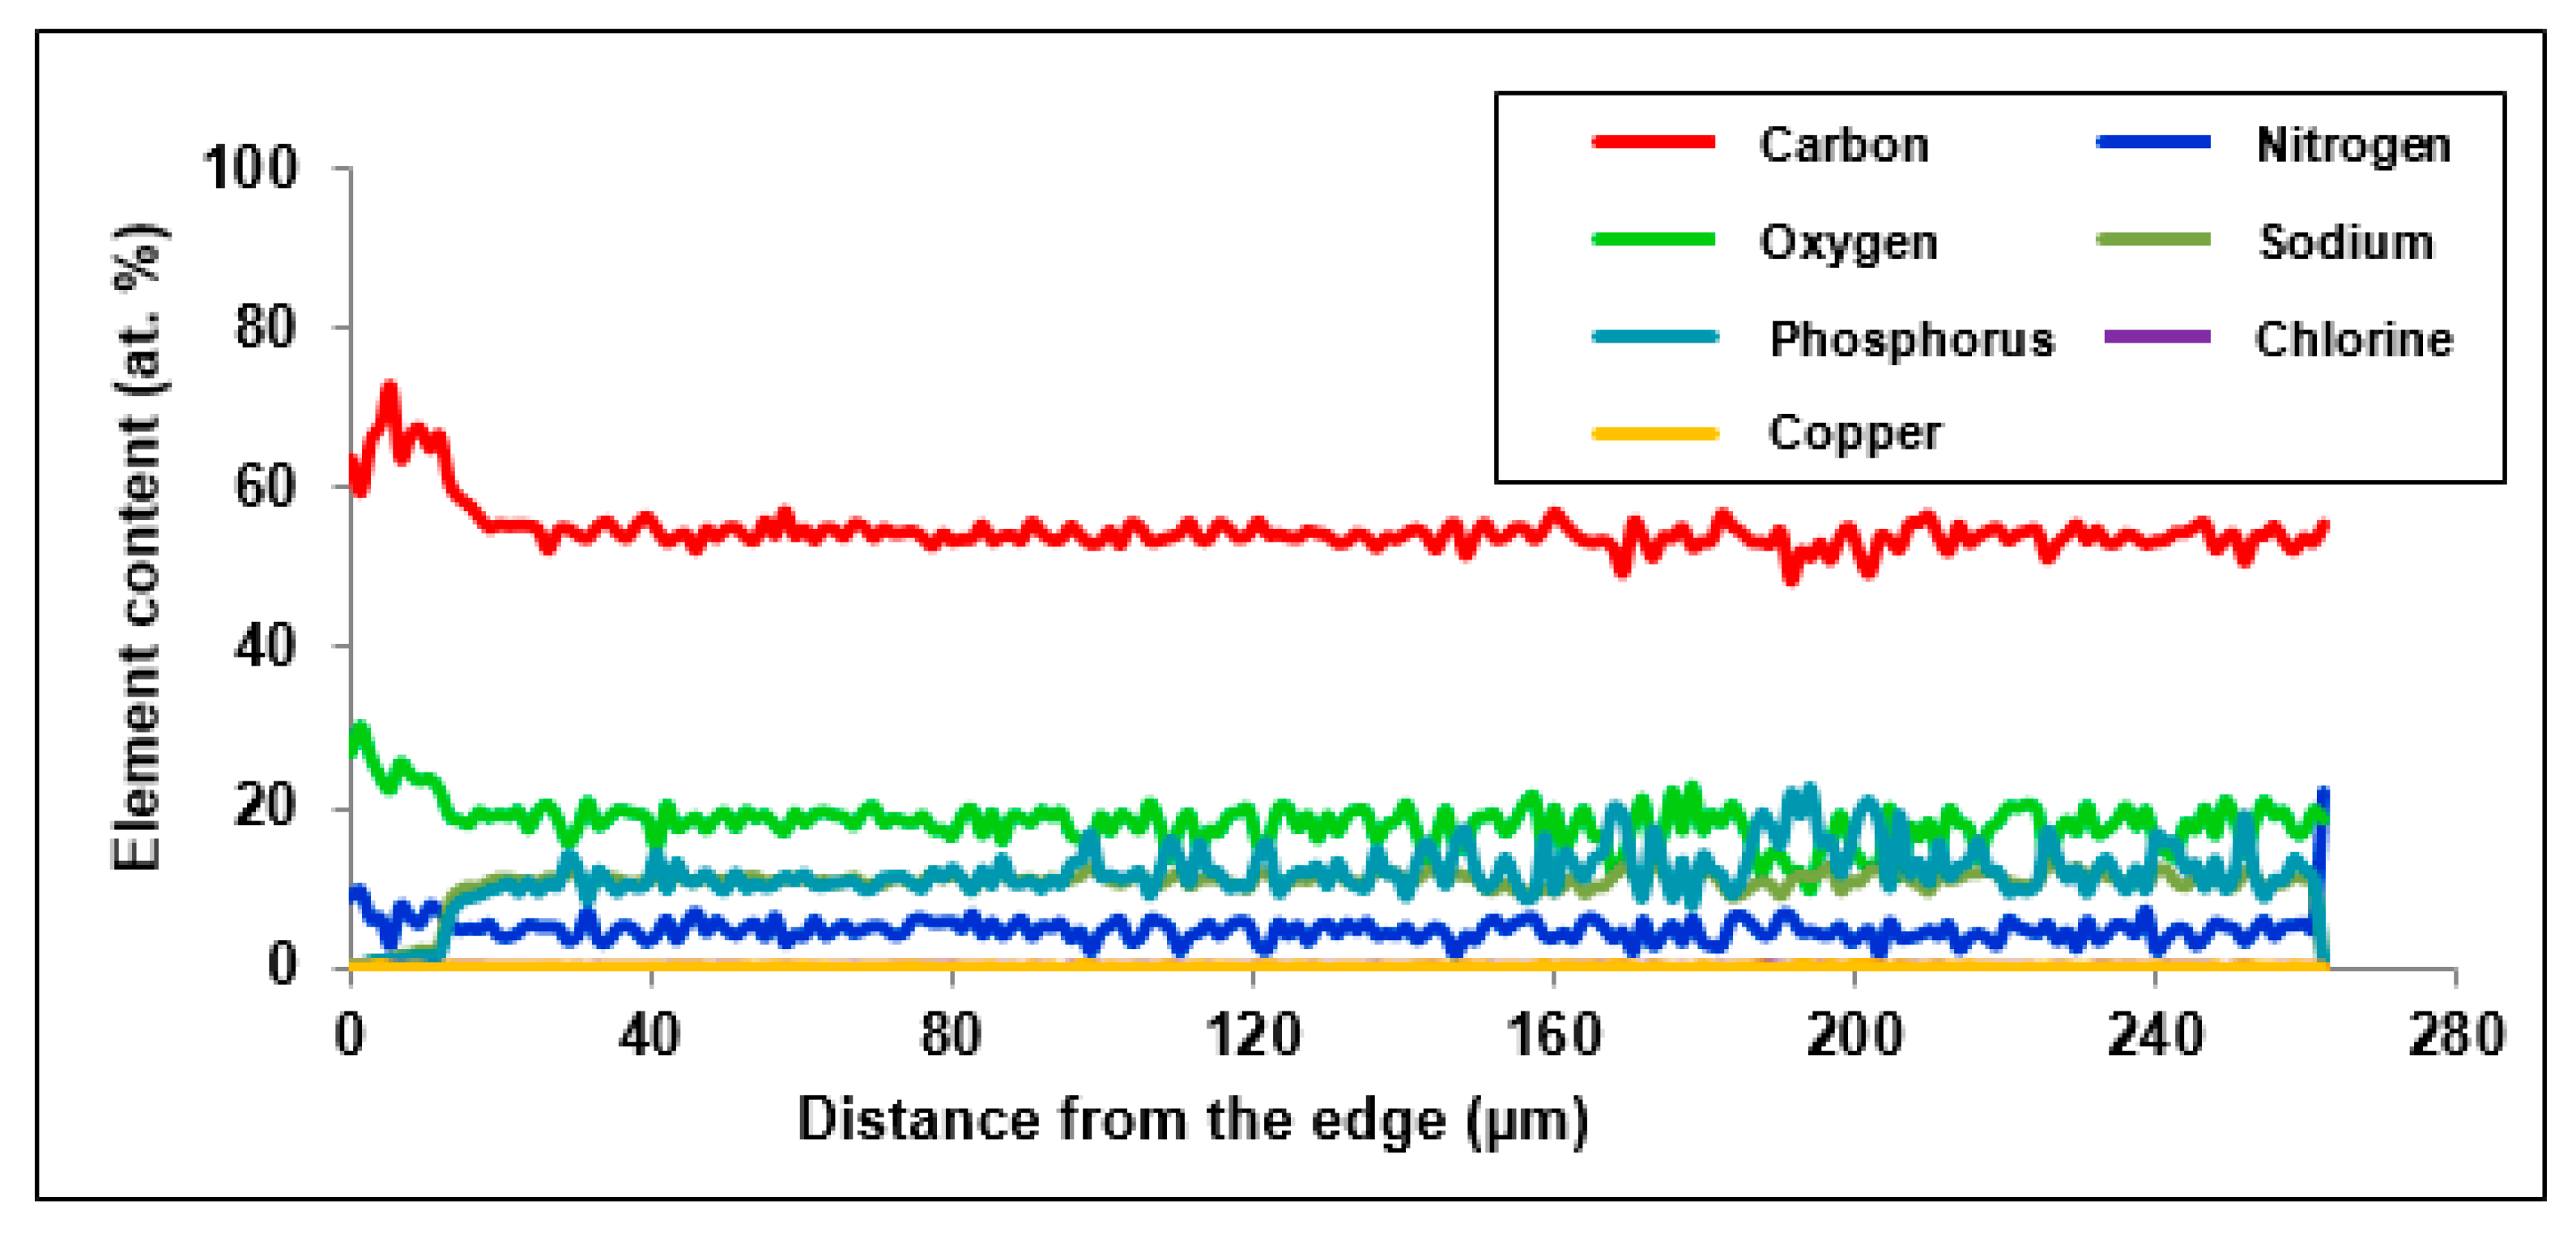
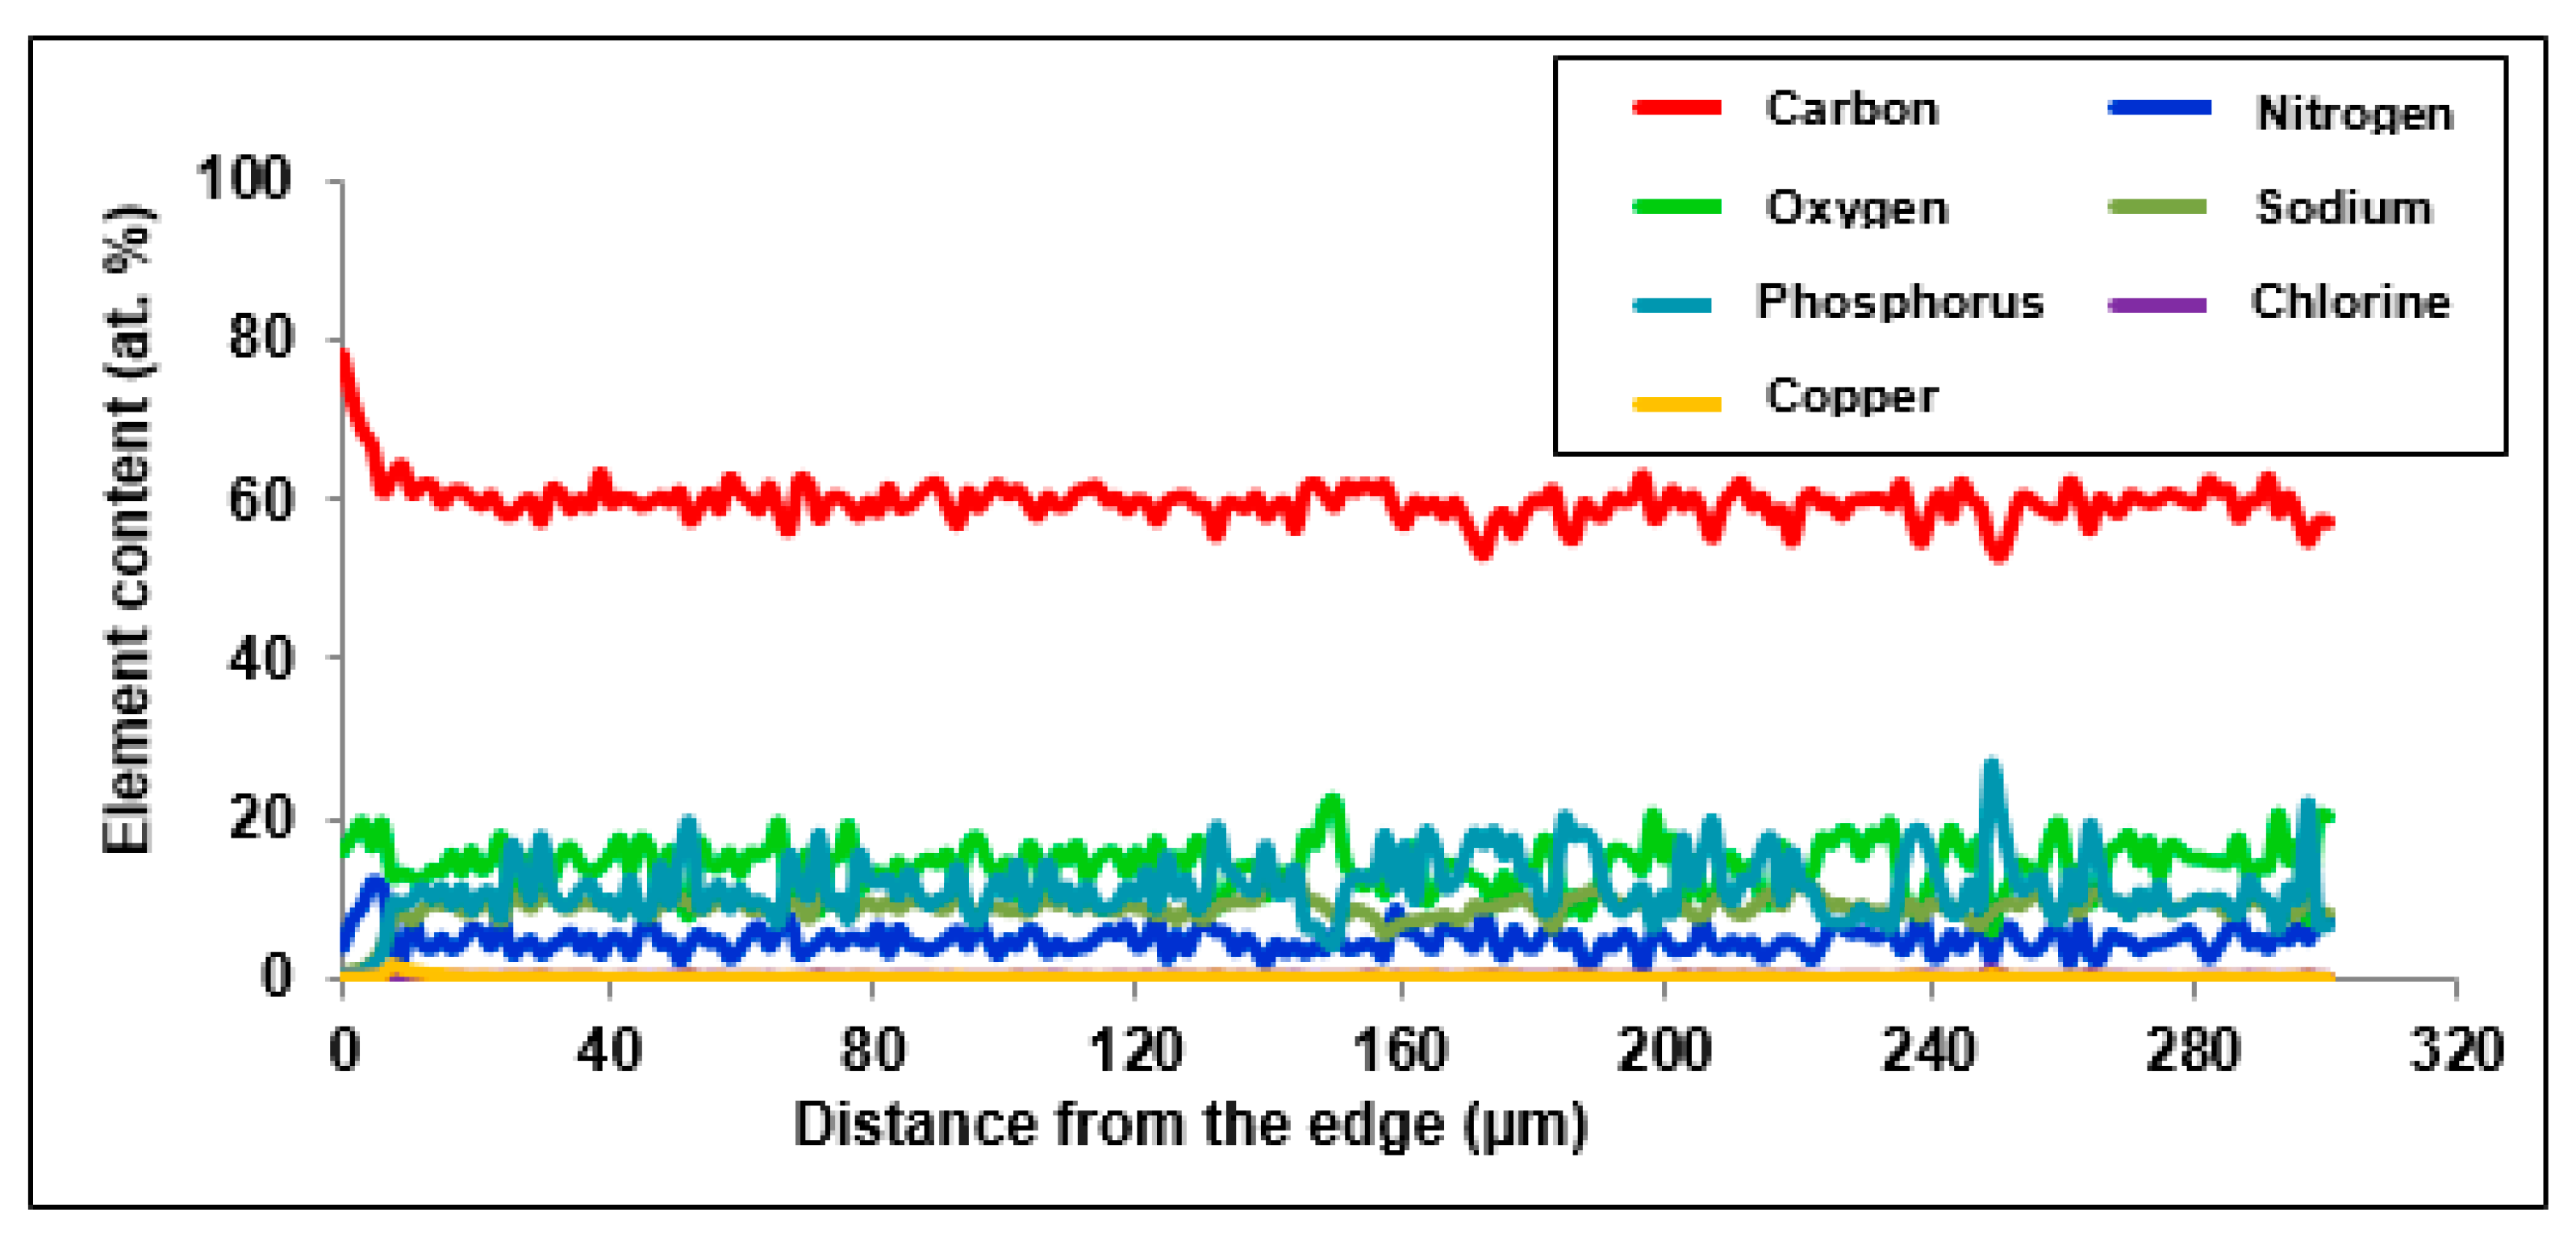
In order to examine the chemical structure and explain the mechanism of Cu(II) ion sorption on Purolite S 940 and Purolite S 950, the beads were cut through by means of ultramicrotome EM UC7 (Leica) and examined using the optical SMZ 1500 stereoscopic microscope (Nikon). To examine the distribution of elements and the sorbed metal Cu(II) ions, the linear profiles of elemental compositions for the cut beads after the Cu(II) sorption were prepared. In this stage of the study, the scanning electron microscope Quanta 3D FEG with the EDS/EBSD (FEI) system was used.
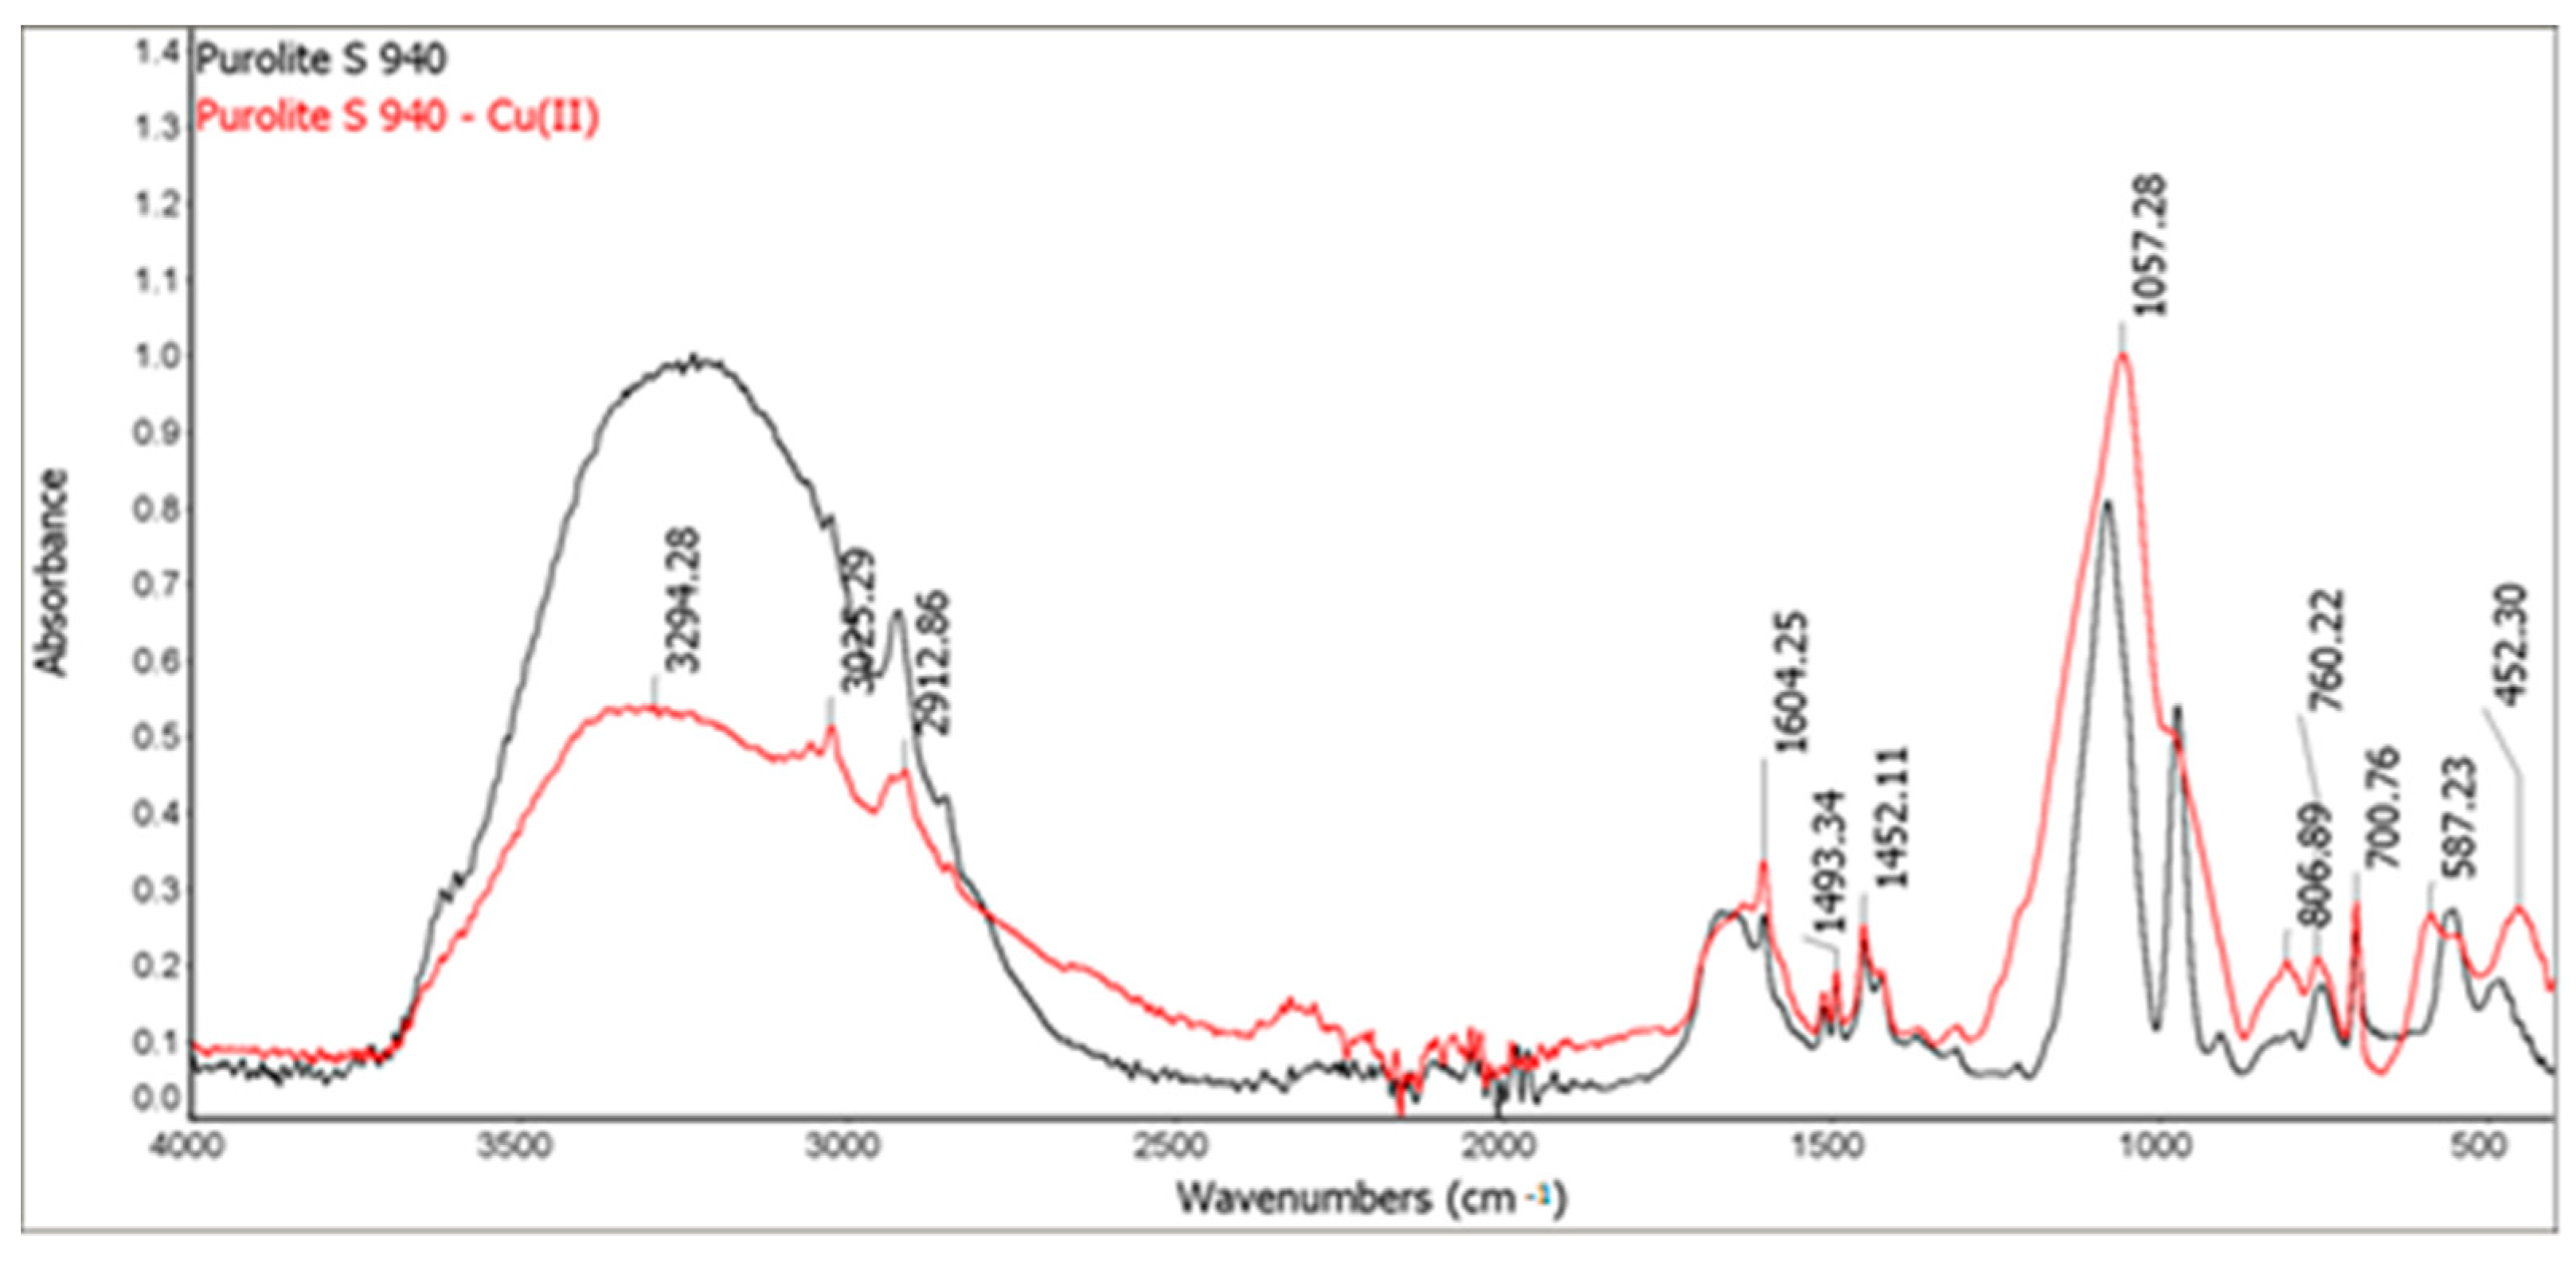
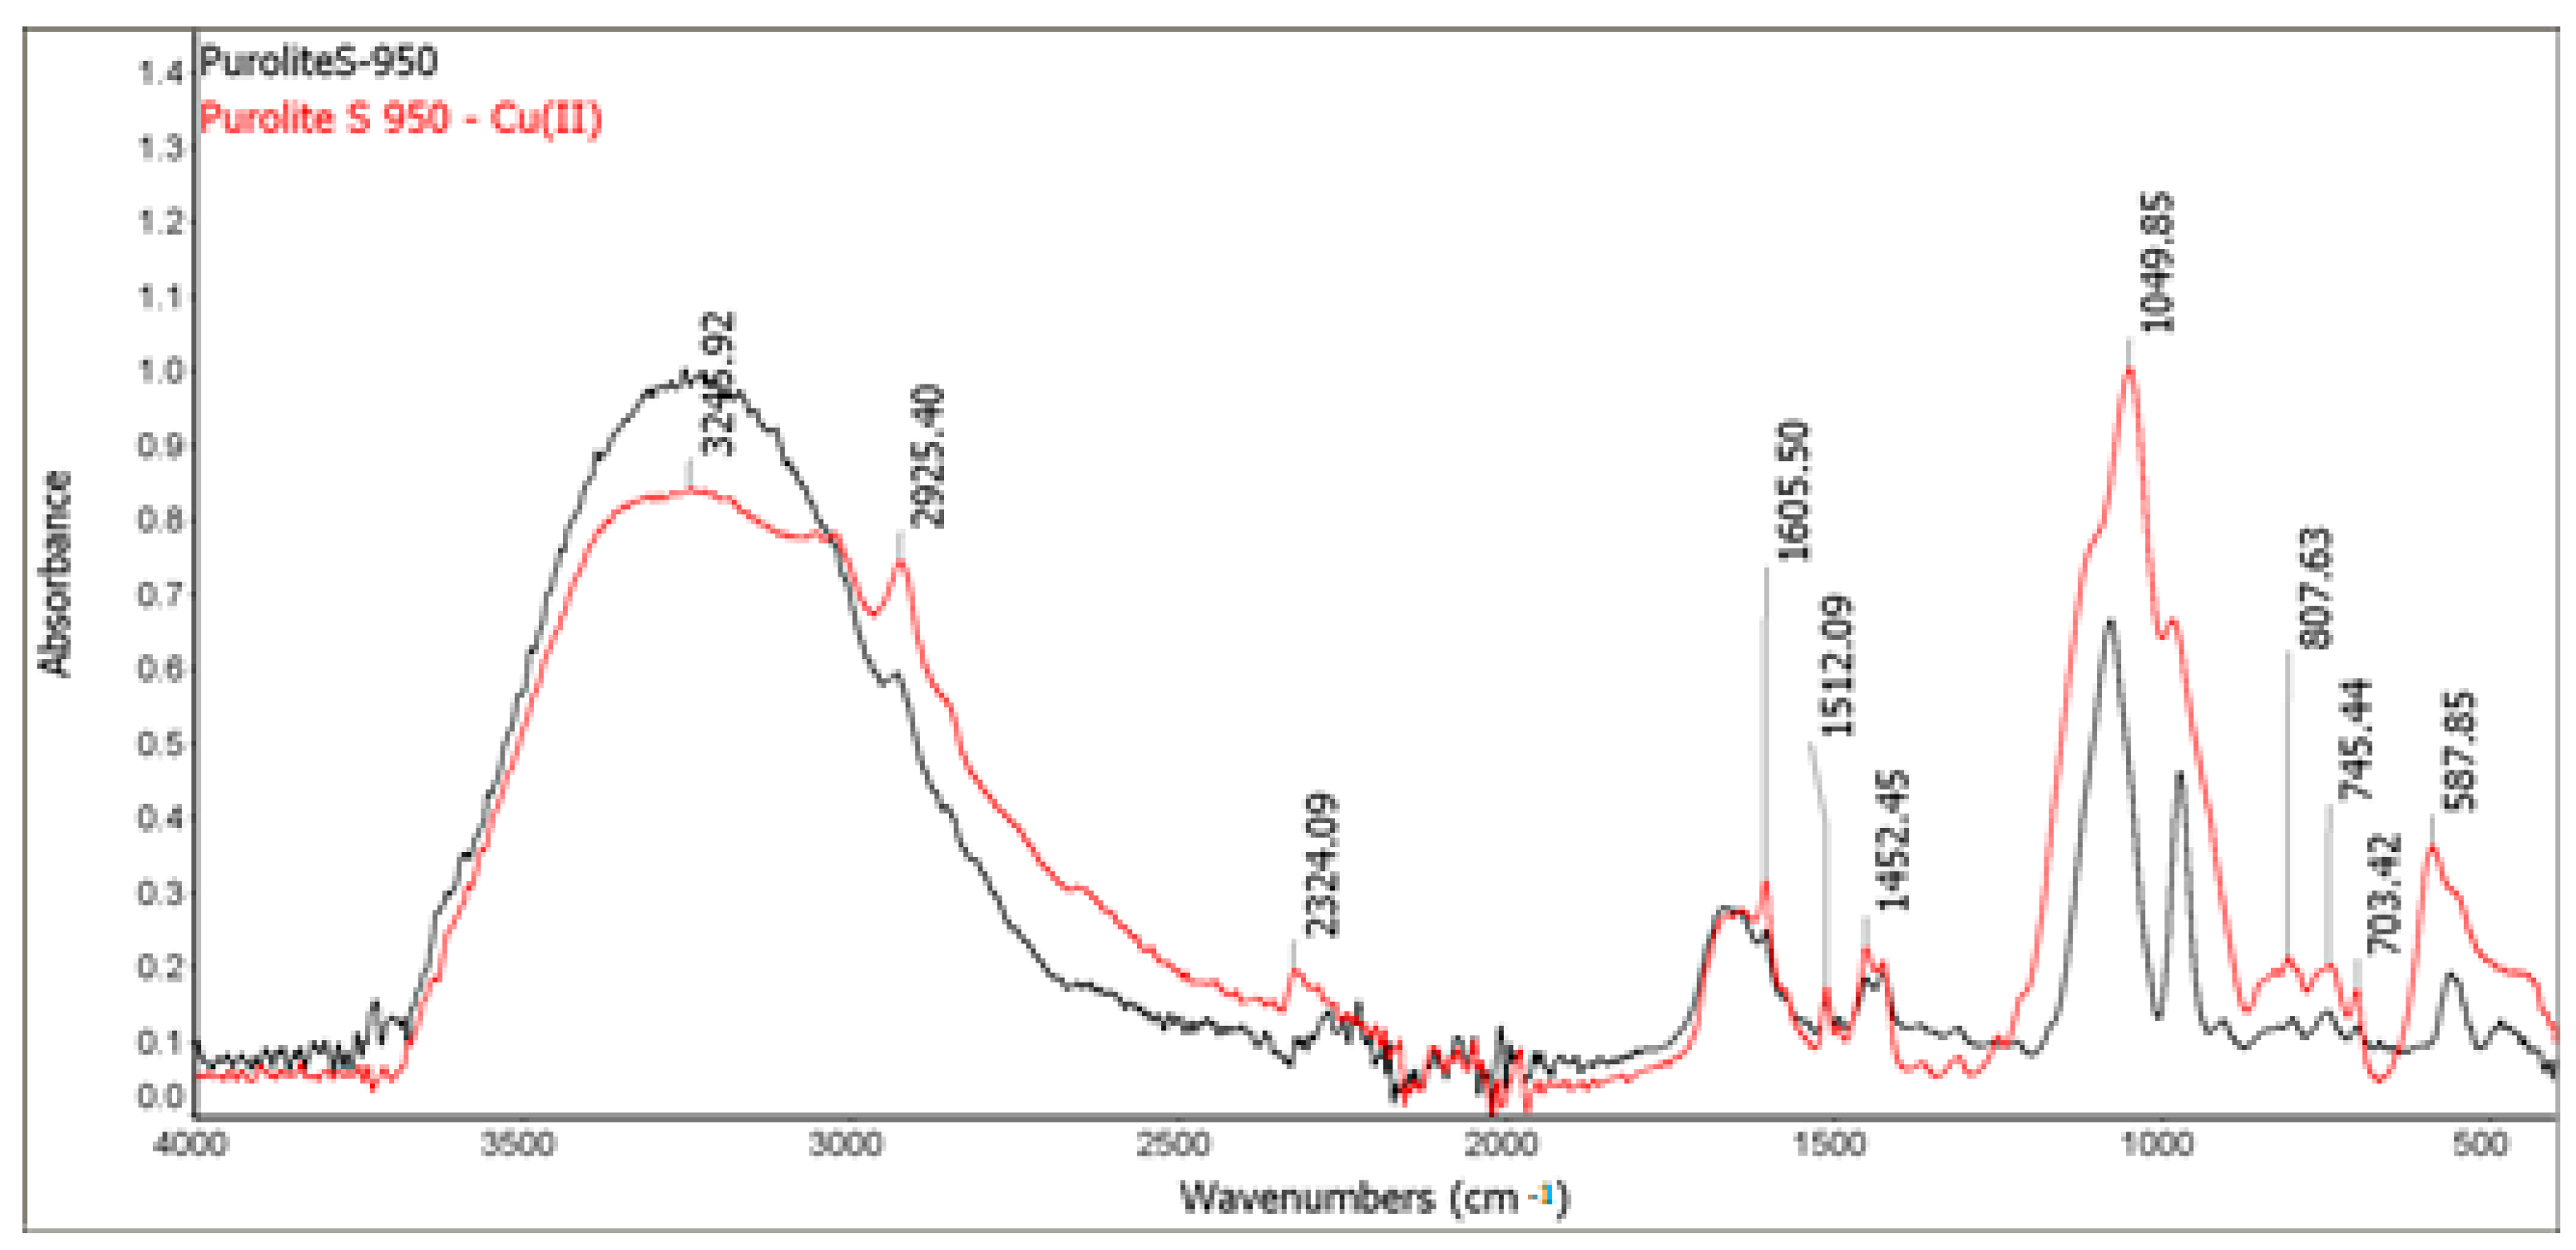
2.2.2. Fourier Transform Infrared Spectroscopy with Attenuated Total Reflection (FTIR-ATR)
In order to investigate the structure of ion exchangers before and after the Cu(II) sorption, the FTIR-ATR spectra of Purolite S 940 and Purolite S 950 using the FTIR Nicolet 8700 spectrometer (Thermo Scientific, Waltham, MA, USA) were recorded. They were performed by means of an ATR method with a diamond crystal in the range of wave numbers 4000–400 cm−1 and the spectral resolution of 4 cm−1. The spectra were recorded directly from the surface of the samples at room temperature.
2.2.3. X-ray Photoelectron Spectroscopy (XPS)
In order to examine the chemical structure and explain the mechanism of Cu(II) ion sorption on Purolite S 940 and Purolite S 950, XPS tests were made using the Ultra High Vacuum multi-chamber analytical system (Prevac). The tests were carried out for Purolite S 940 and Purolite S 950 before and after the Cu(II) ion sorption. After being fixed on a molybdenum carrier, the samples were degassed at room temperature to the high constant vacuum of about ~5 × 10⁻⁸ mbar, in the UHV system sluice. After their introduction into the analytical chamber of the system, the appropriate analysis was performed by means of the XPS spectroscopy method. AlKα monochromatic radiation was used as a source of photoelectrons. Photoelectrons were stimulated by X-ray of a characteristic line AlKα of 1486.7 eV energy, generated by a VG Scienta SAX 100 lamp with an aluminum anode with a VG Scienta XM 780 monochromator. The pressure in the chamber during the measurements was 2 × 10⁻⁸ mbar. The X-ray tube operating parameters were as follows: U = 12 kV, Ie = 30 mA. Photoelectrons were recorded by the hemispherical analyzer Scienta R4000. The measurements were made based on the following basic parameters: operating mode—sweeping, pass energy—200 eV, measured range of the binding energy of photoelectrons 0–1200 eV, measuring step 0.5 eV, collection time in a single step 0.2 s, and the number of iterations 5. The parameters of the analyzer for the high-resolution spectra were: operating mode sweeping, pass energy 50 eV, measuring step 0.1 eV, and collection time in a single step 0.667 s.
4. Conclusions
The studies with spectroscopic methods allowed for a comprehensive evaluation of the processes taking place during the sorption of Cu(II) ions on Purolite S 940 and Purolite S 950. The research allowed us to suggest the mechanism of Cu(II) sorption on the Purolite S 940 and Purolite S 950 chelating ion exchangers. The research confirmed that the sorption process takes place mainly on the surface of the examined ion exchangers.
The microscopic studies showed a different course of the Cu(II) sorption process on these ion exchangers. In the case of Purolite S 940, a uniform distribution of Cu(II) ion concentration was observed throughout the grain volume. In the case of Purolite S 950, the increased sorption of Cu(II) ions on the ion exchanger surface were demonstrated. The microscopic studies also showed the possibility of the ion exchange process between the Na(I) ions and the sorbed Cu(II) ions on Purolite S 940 and Purolite S 950.
The FTIR and XPS analyses exhibited some changes in the spectra of Purolite S 940 and Purolite S 950 before and after the process of Cu(II) ions sorption. These changes indicate the participation of nitrogen and oxygen present in the aminophosphonic functional groups in the sorption process. The research proved that in the process of sorption of Cu(II) ions on the chelating ion exchangers Purolite S 940 and Purolite S 950, both the ion exchange process and the formation of a coordination bond with the participation of free electron pairs of nitrogen and oxygen in the aminophosphonic functional groups take place.
The microscopic tests confirmed the kinetic test results in which the better efficiency of the Cu (II) ion sorption process was obtained for the Purolite S 950 ion exchanger.
The linear relationship t/qt = f (t) and the values of the determination coefficients (R2) close to unity as well as good agreement with the experimental data showed that the pseudo second-order kinetic model is fully suitable for the description of the sorption process. The studies of the sorption of Cu(II) ions from the 0.001 CuCl2 solutions showed better process efficiency on Purolite S 950 ion exchanger (qt = 9.88 mg g−1) compared to Purolite S 940 ionite (qt = 8.66 mg g−1).
The research allows us to state that spectroscopic methods are effective in the sorption processes studies.


 ,
, 


