
Experimental and Numerical Studies on the Direct Shear Behavior of Sand–RCA (Recycled Concrete Aggregates) Mixtures with Different Contents of RCA


Abstract
1. Introduction
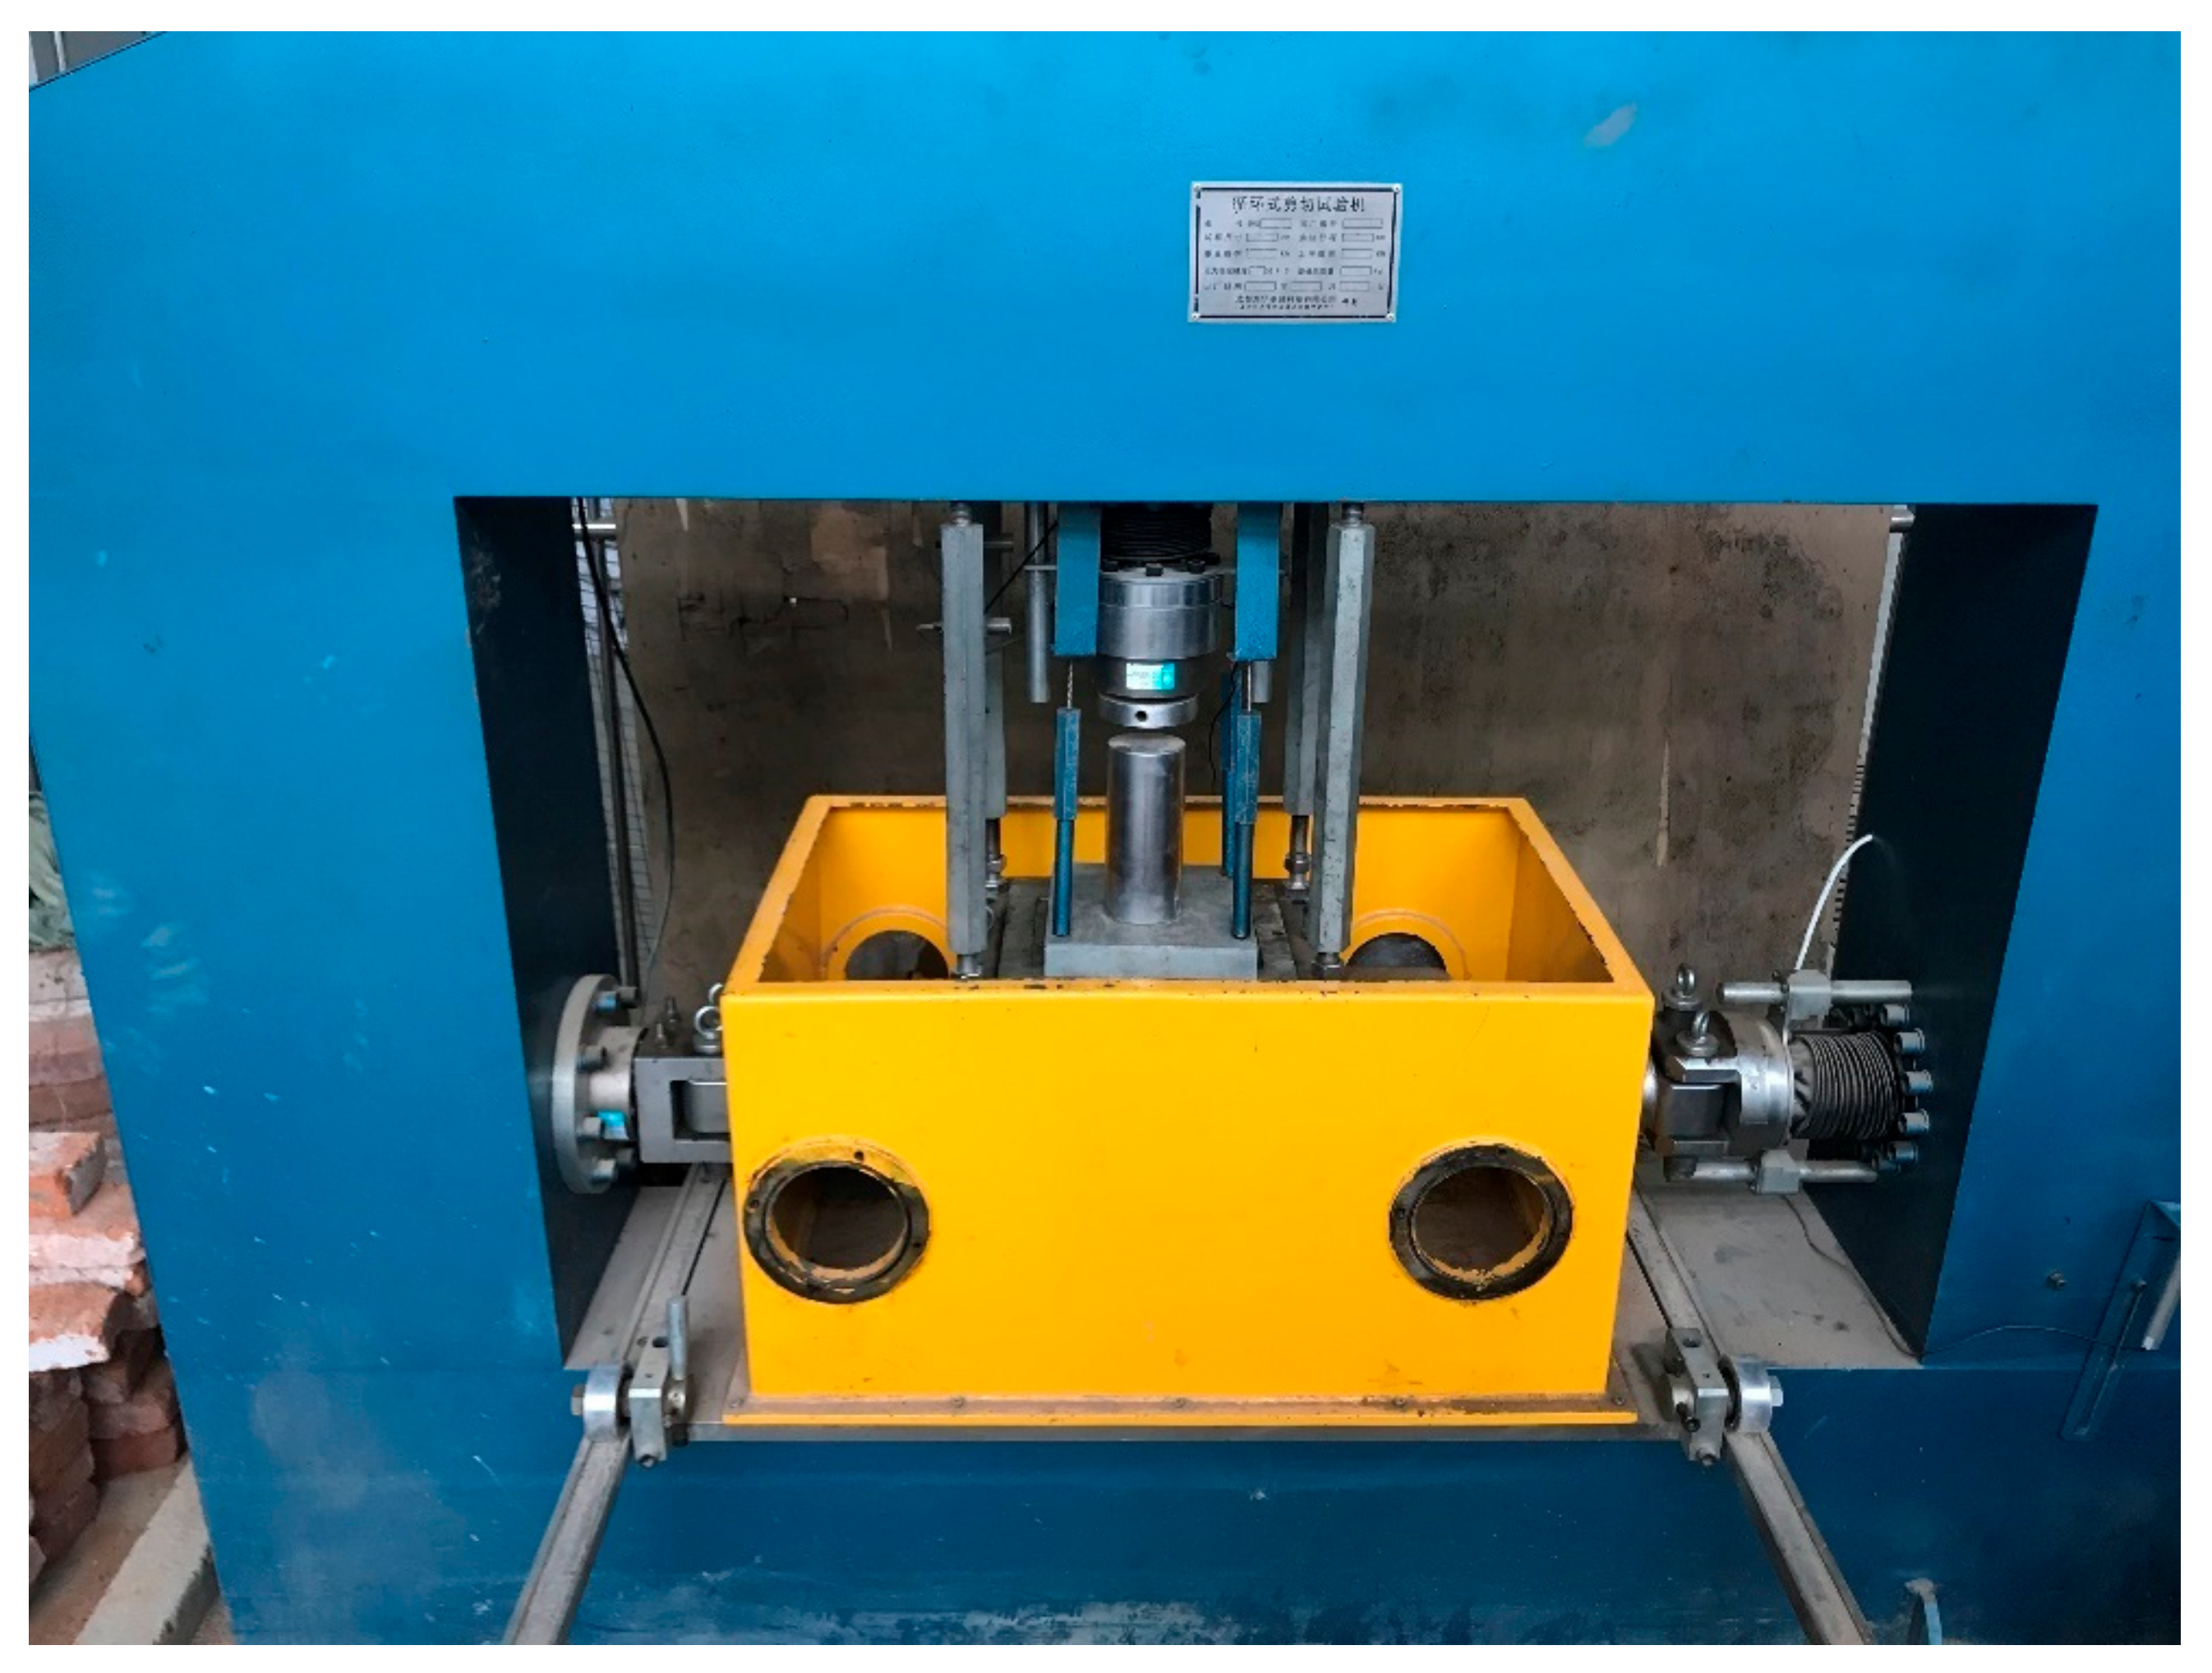
2. Laboratory Tests
2.1. Materials
2.2. Test Plan
3. DEM Simulation of Direct Shear Test
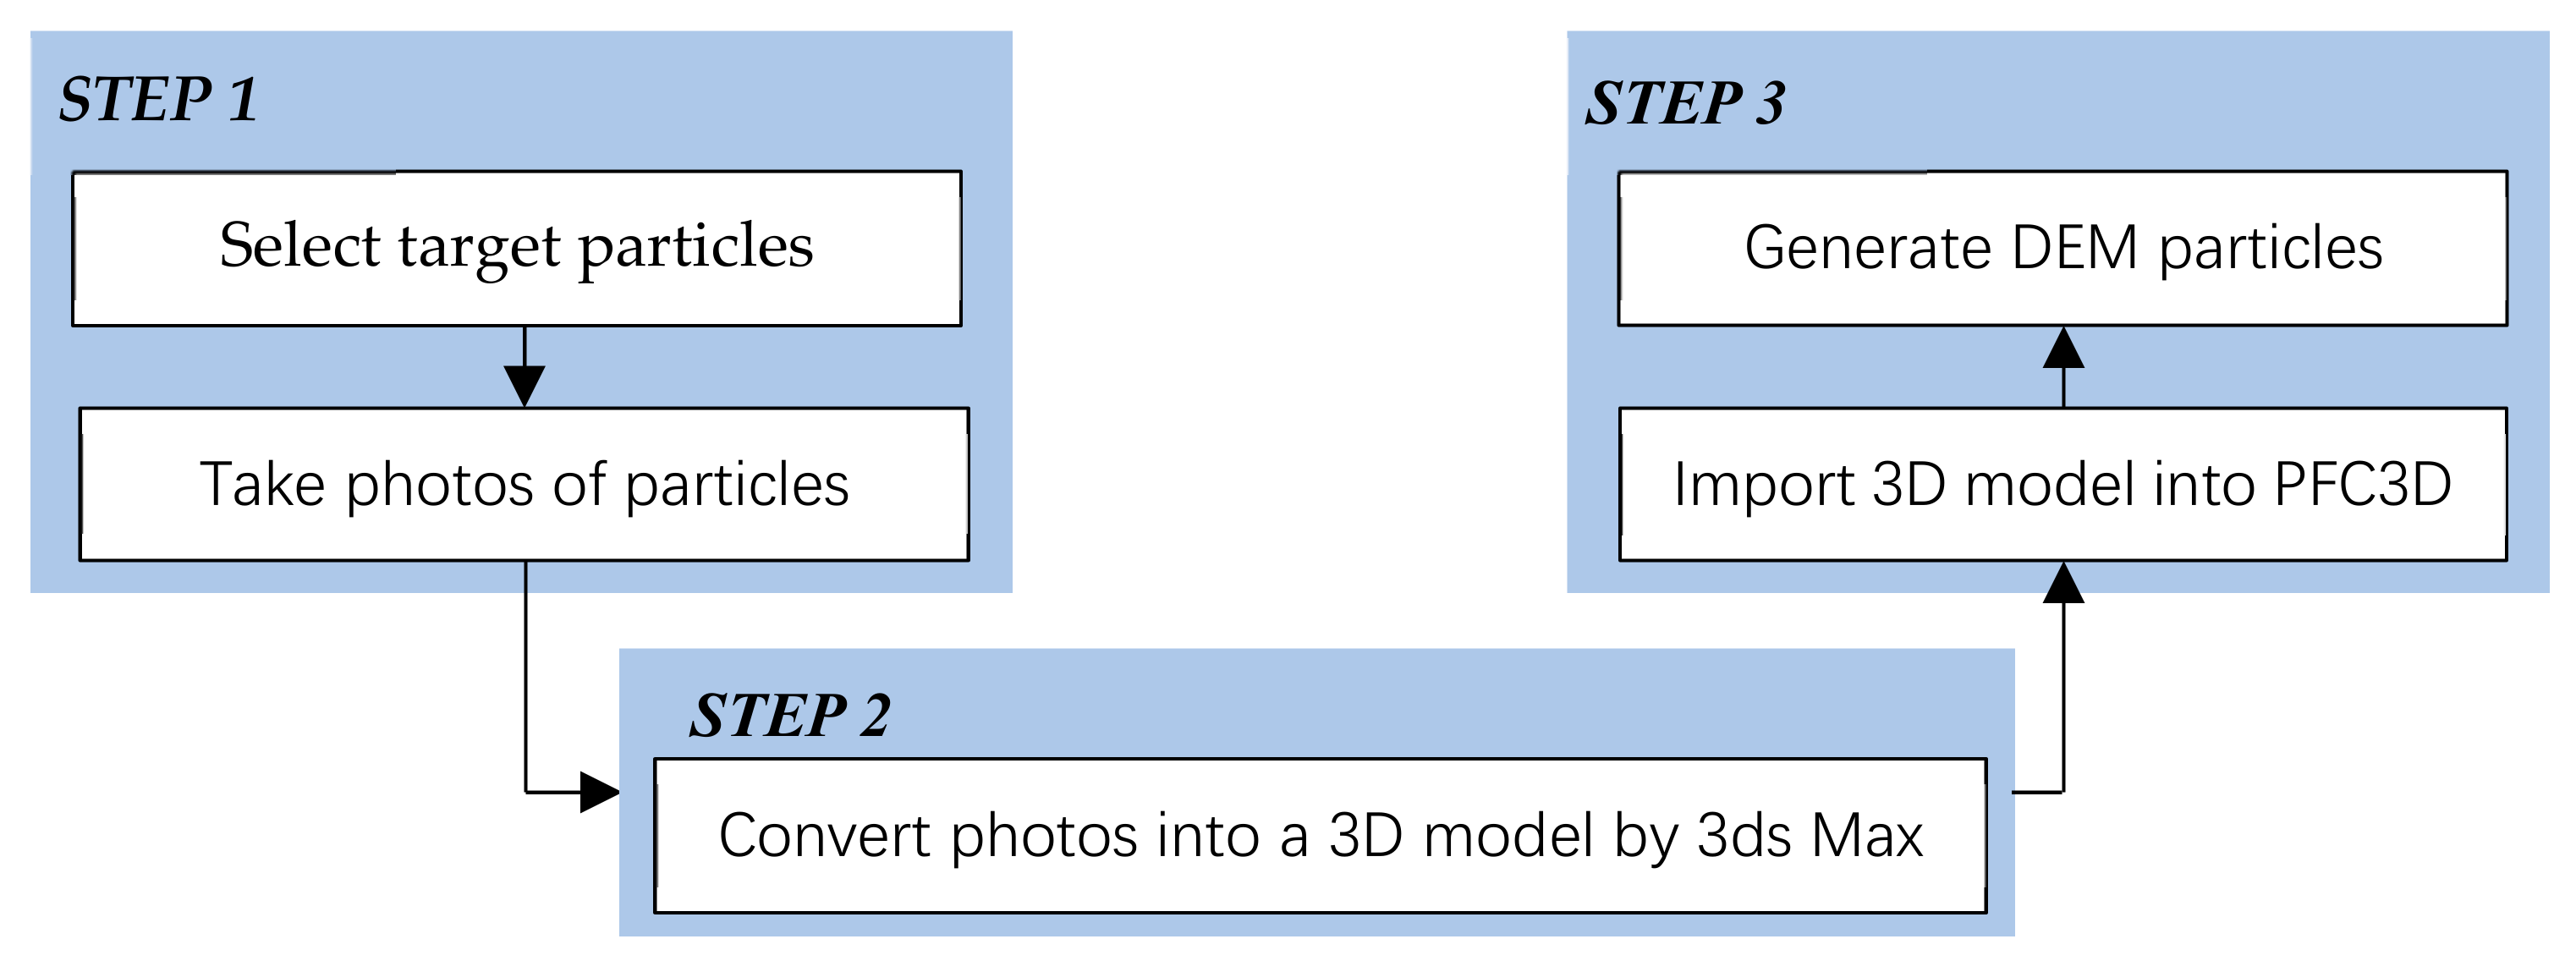
3.1. Modeling Authentic RCA
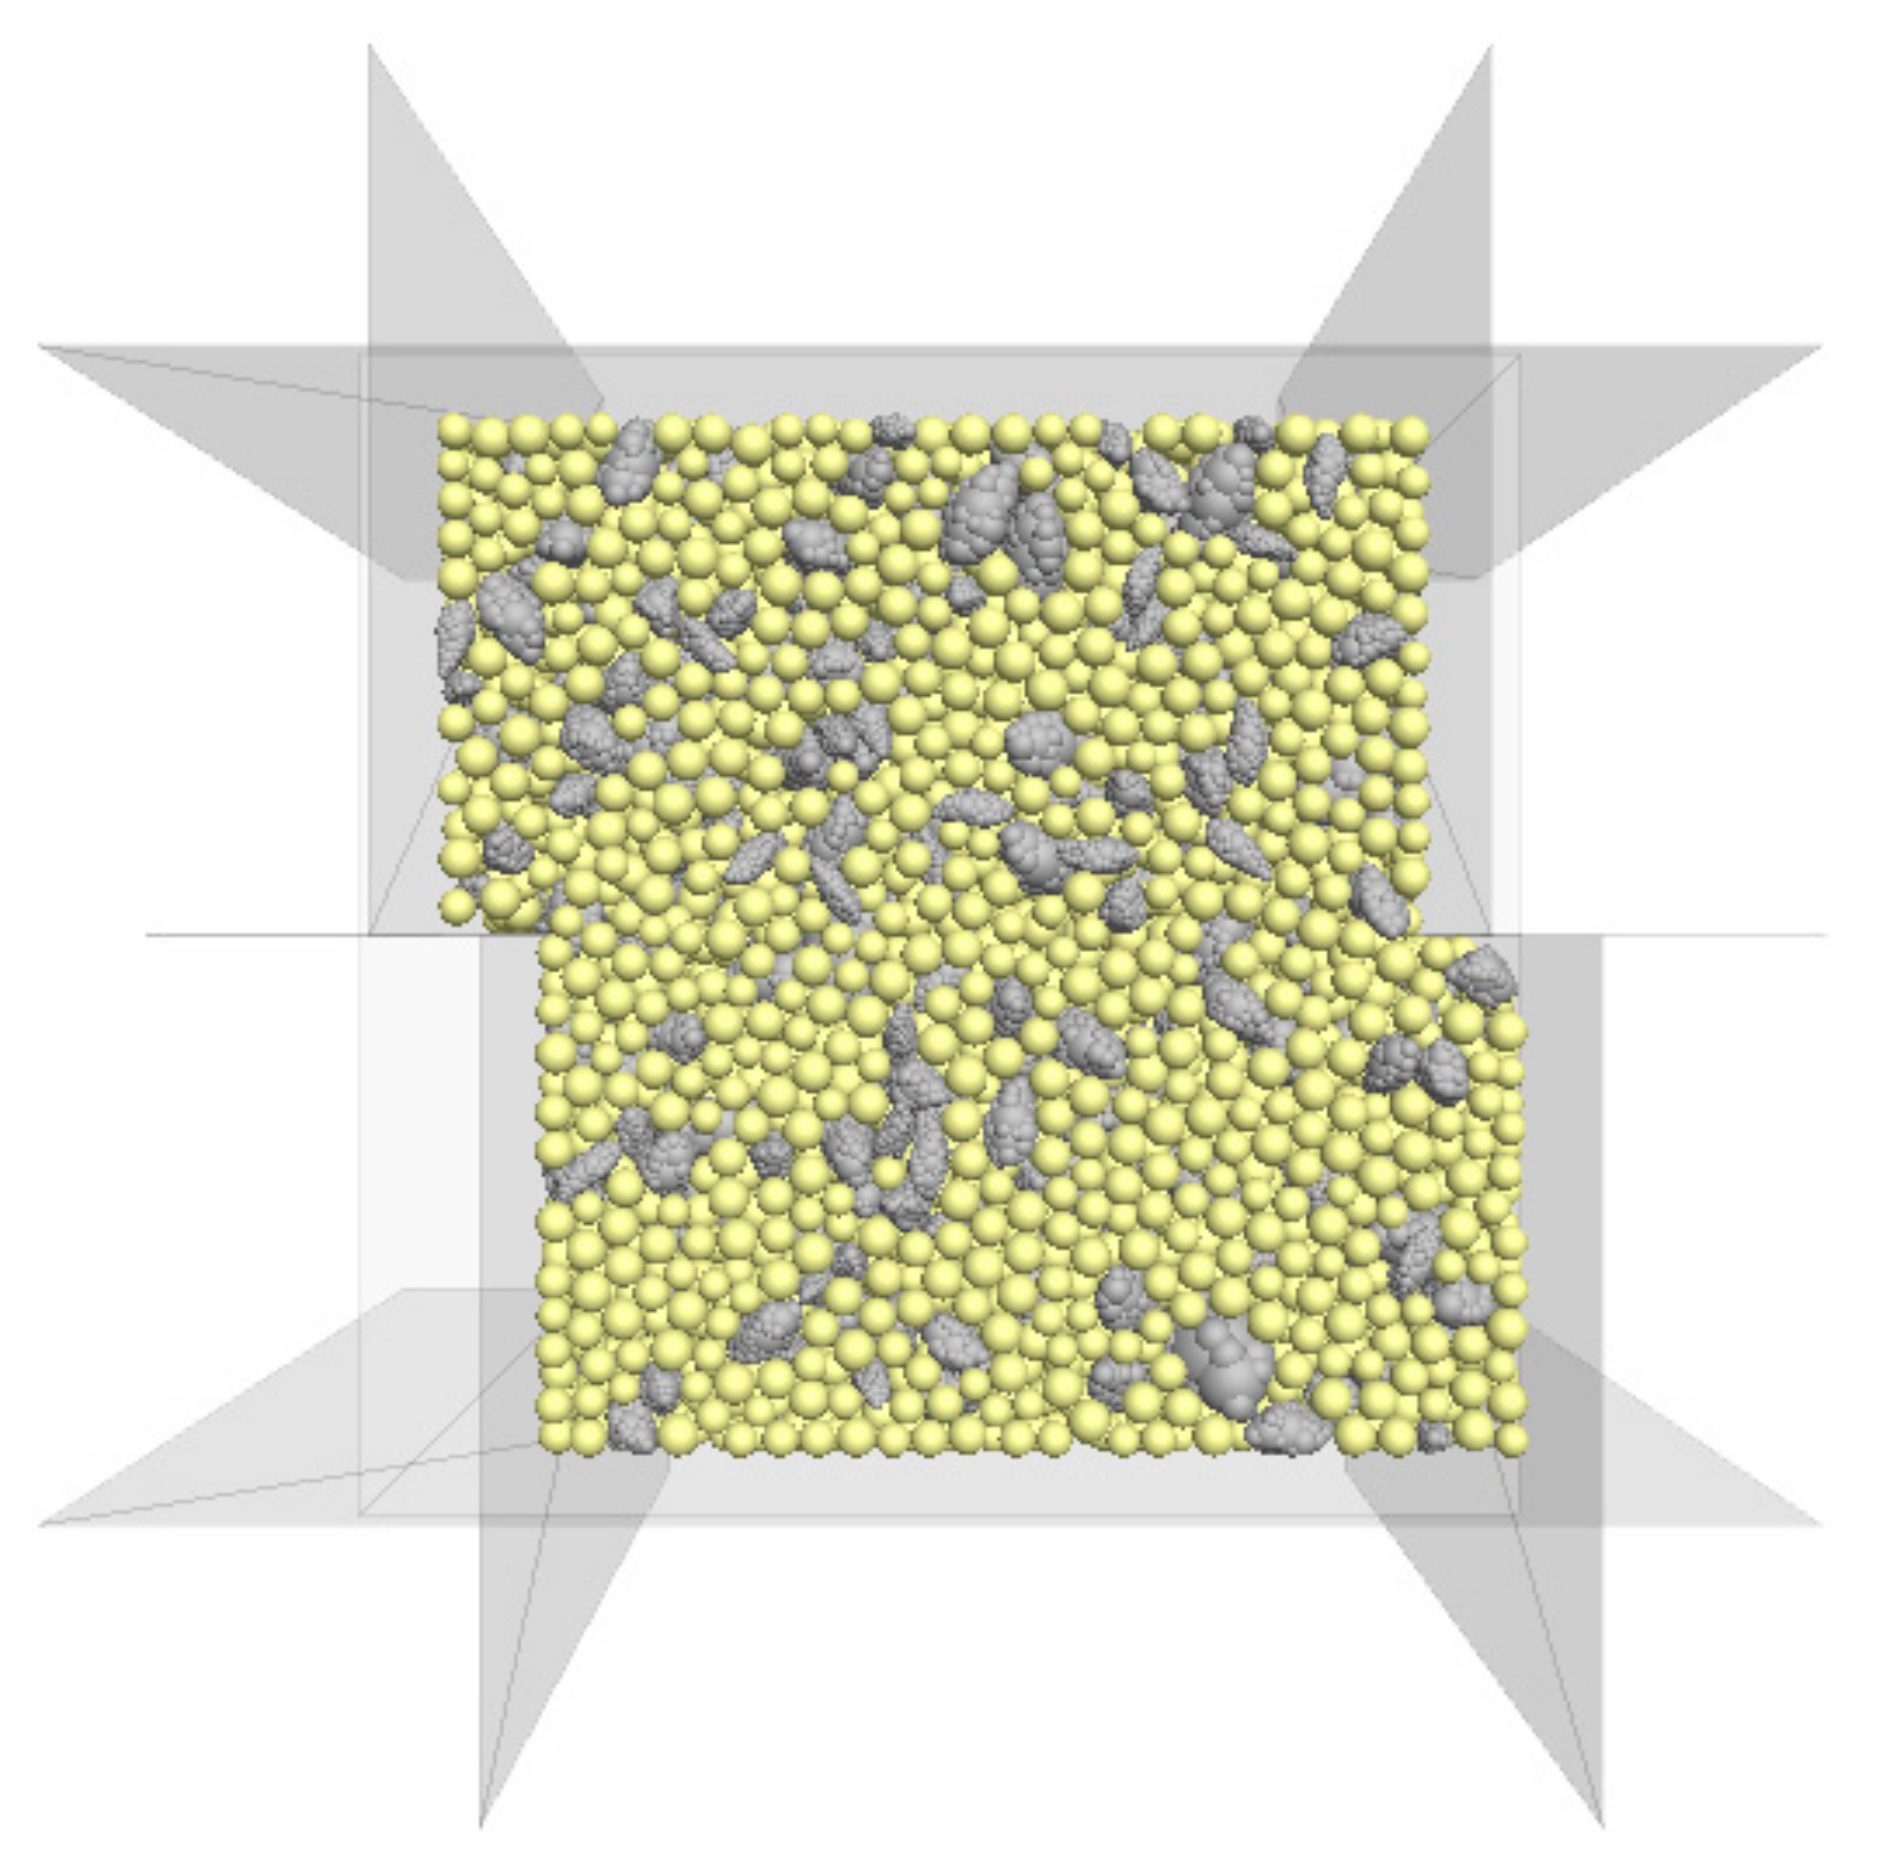
3.2. Numerical Direct Shear Model
3.3. Contact Model and Micro-Parameters
4. Results Analyses
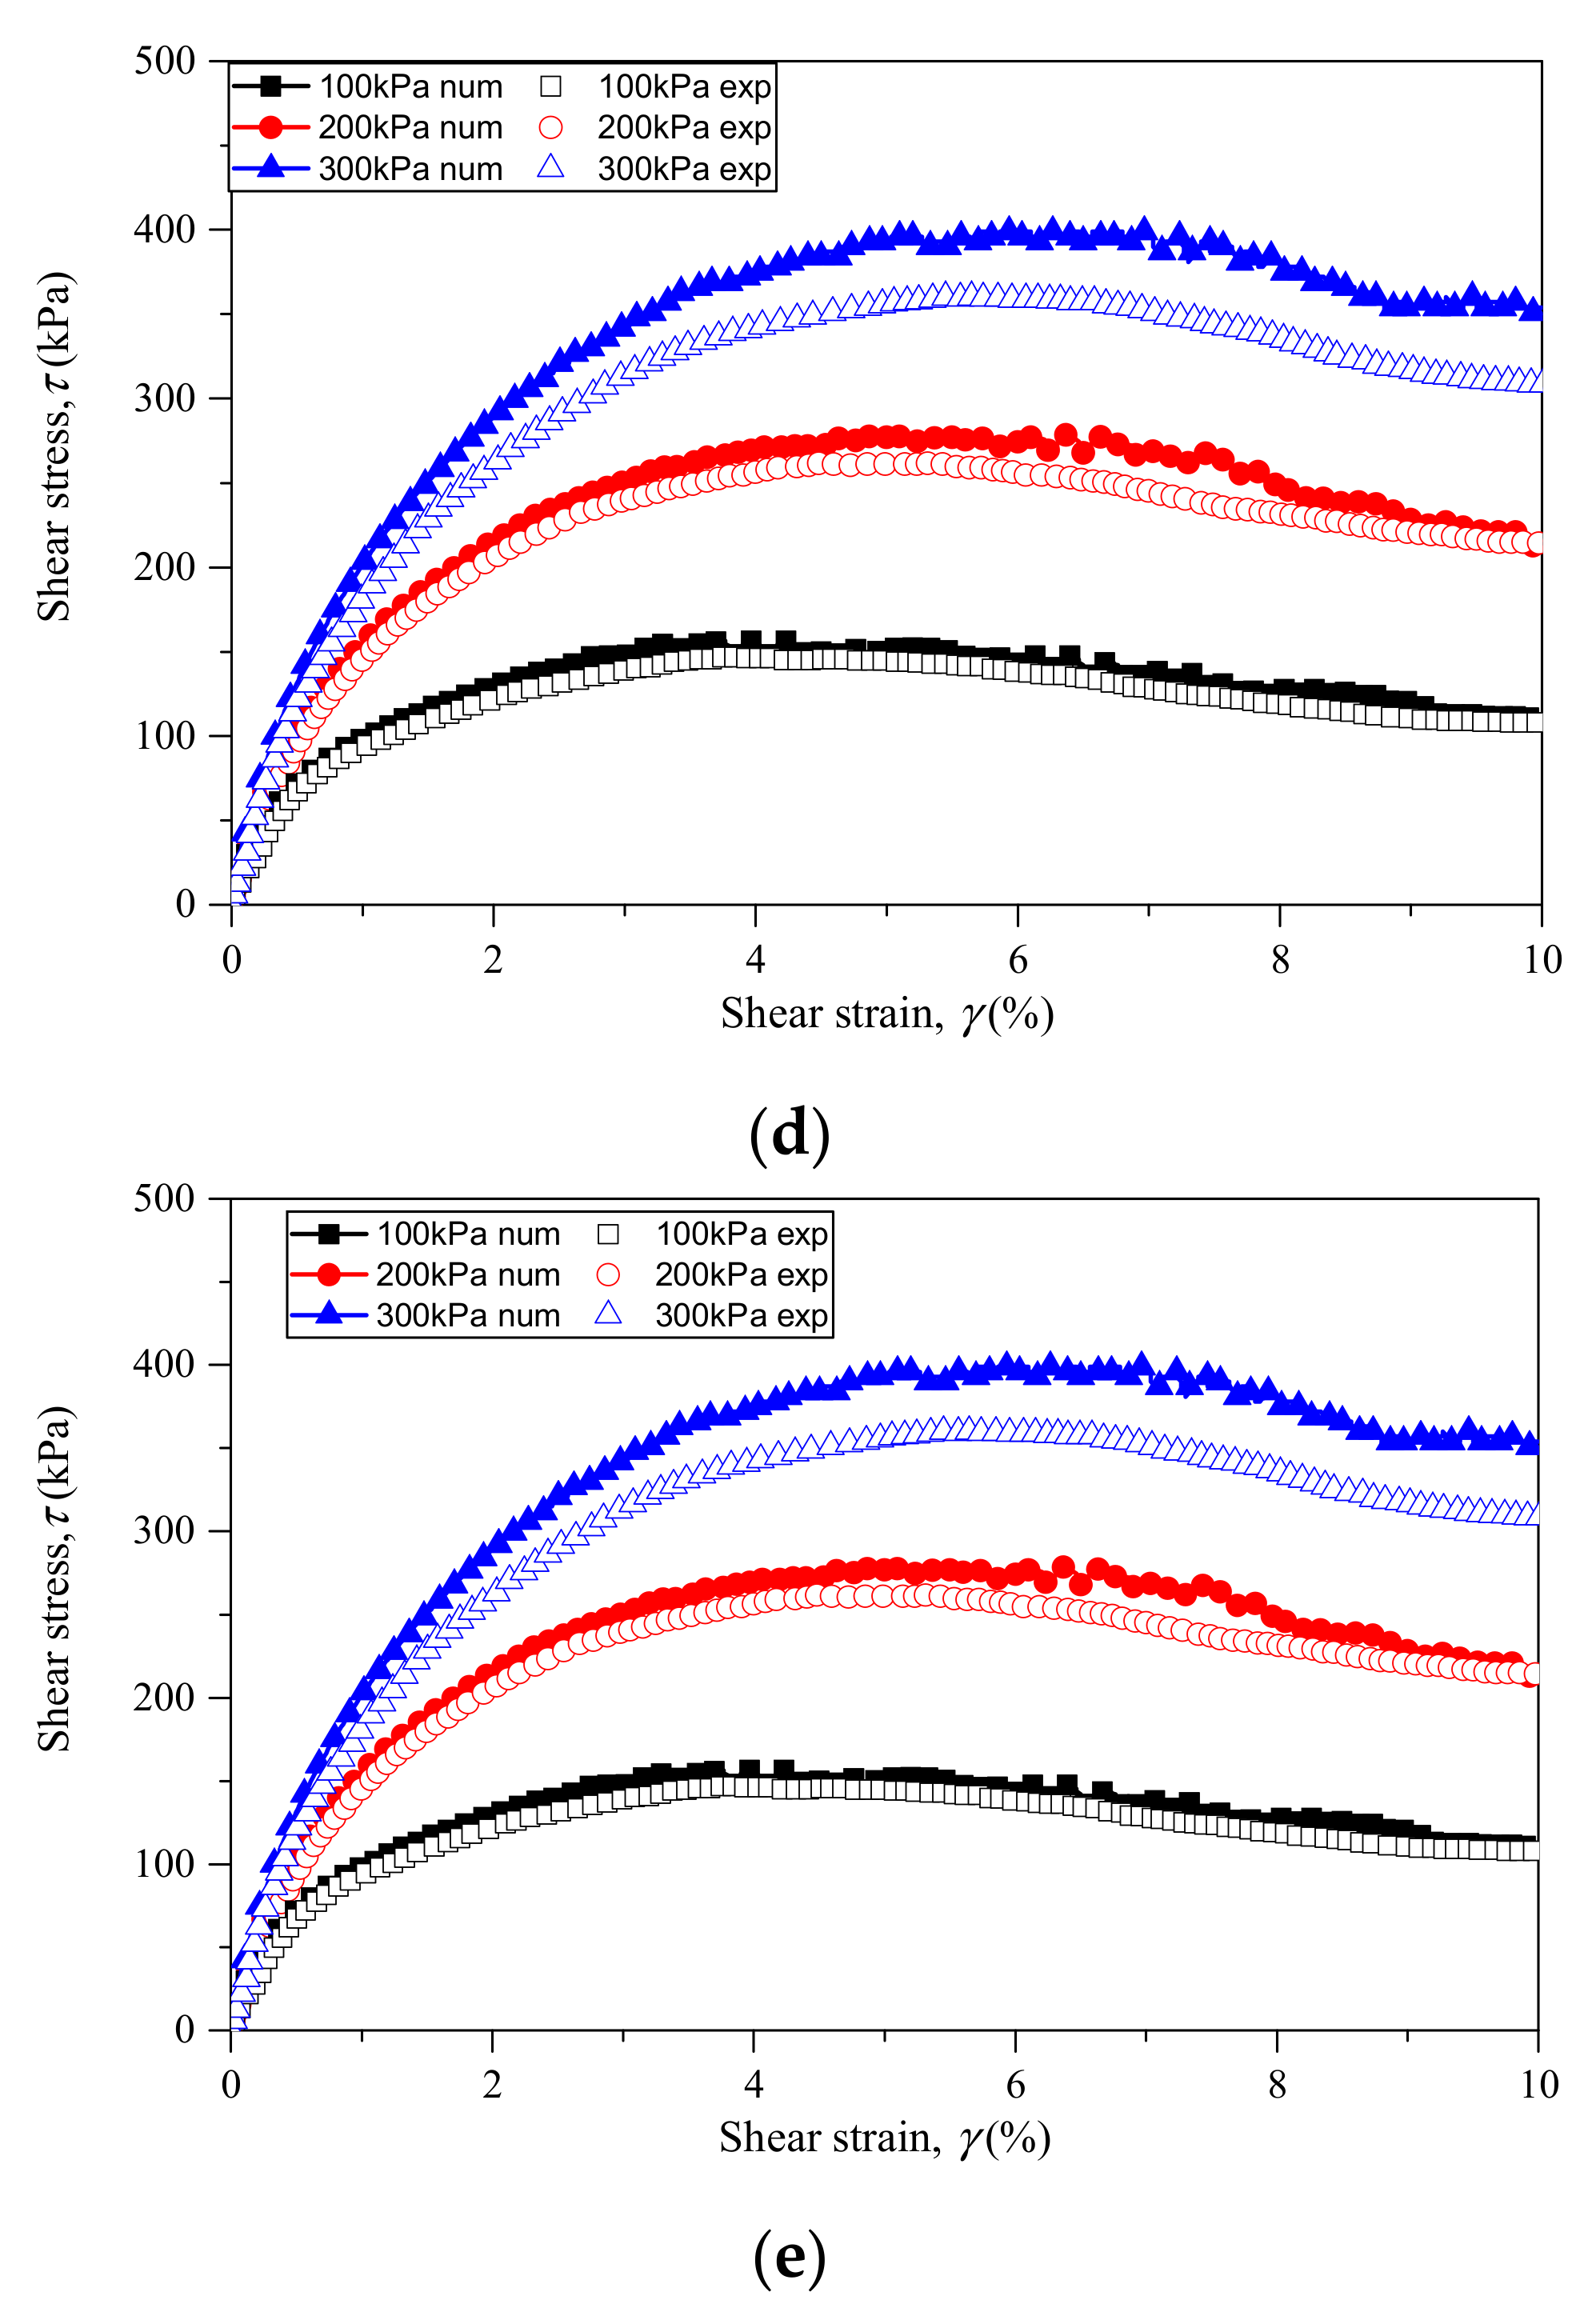
4.1. Macroscopic Behavior
4.2. Microscopic Behavior
4.2.1. Coordination Number
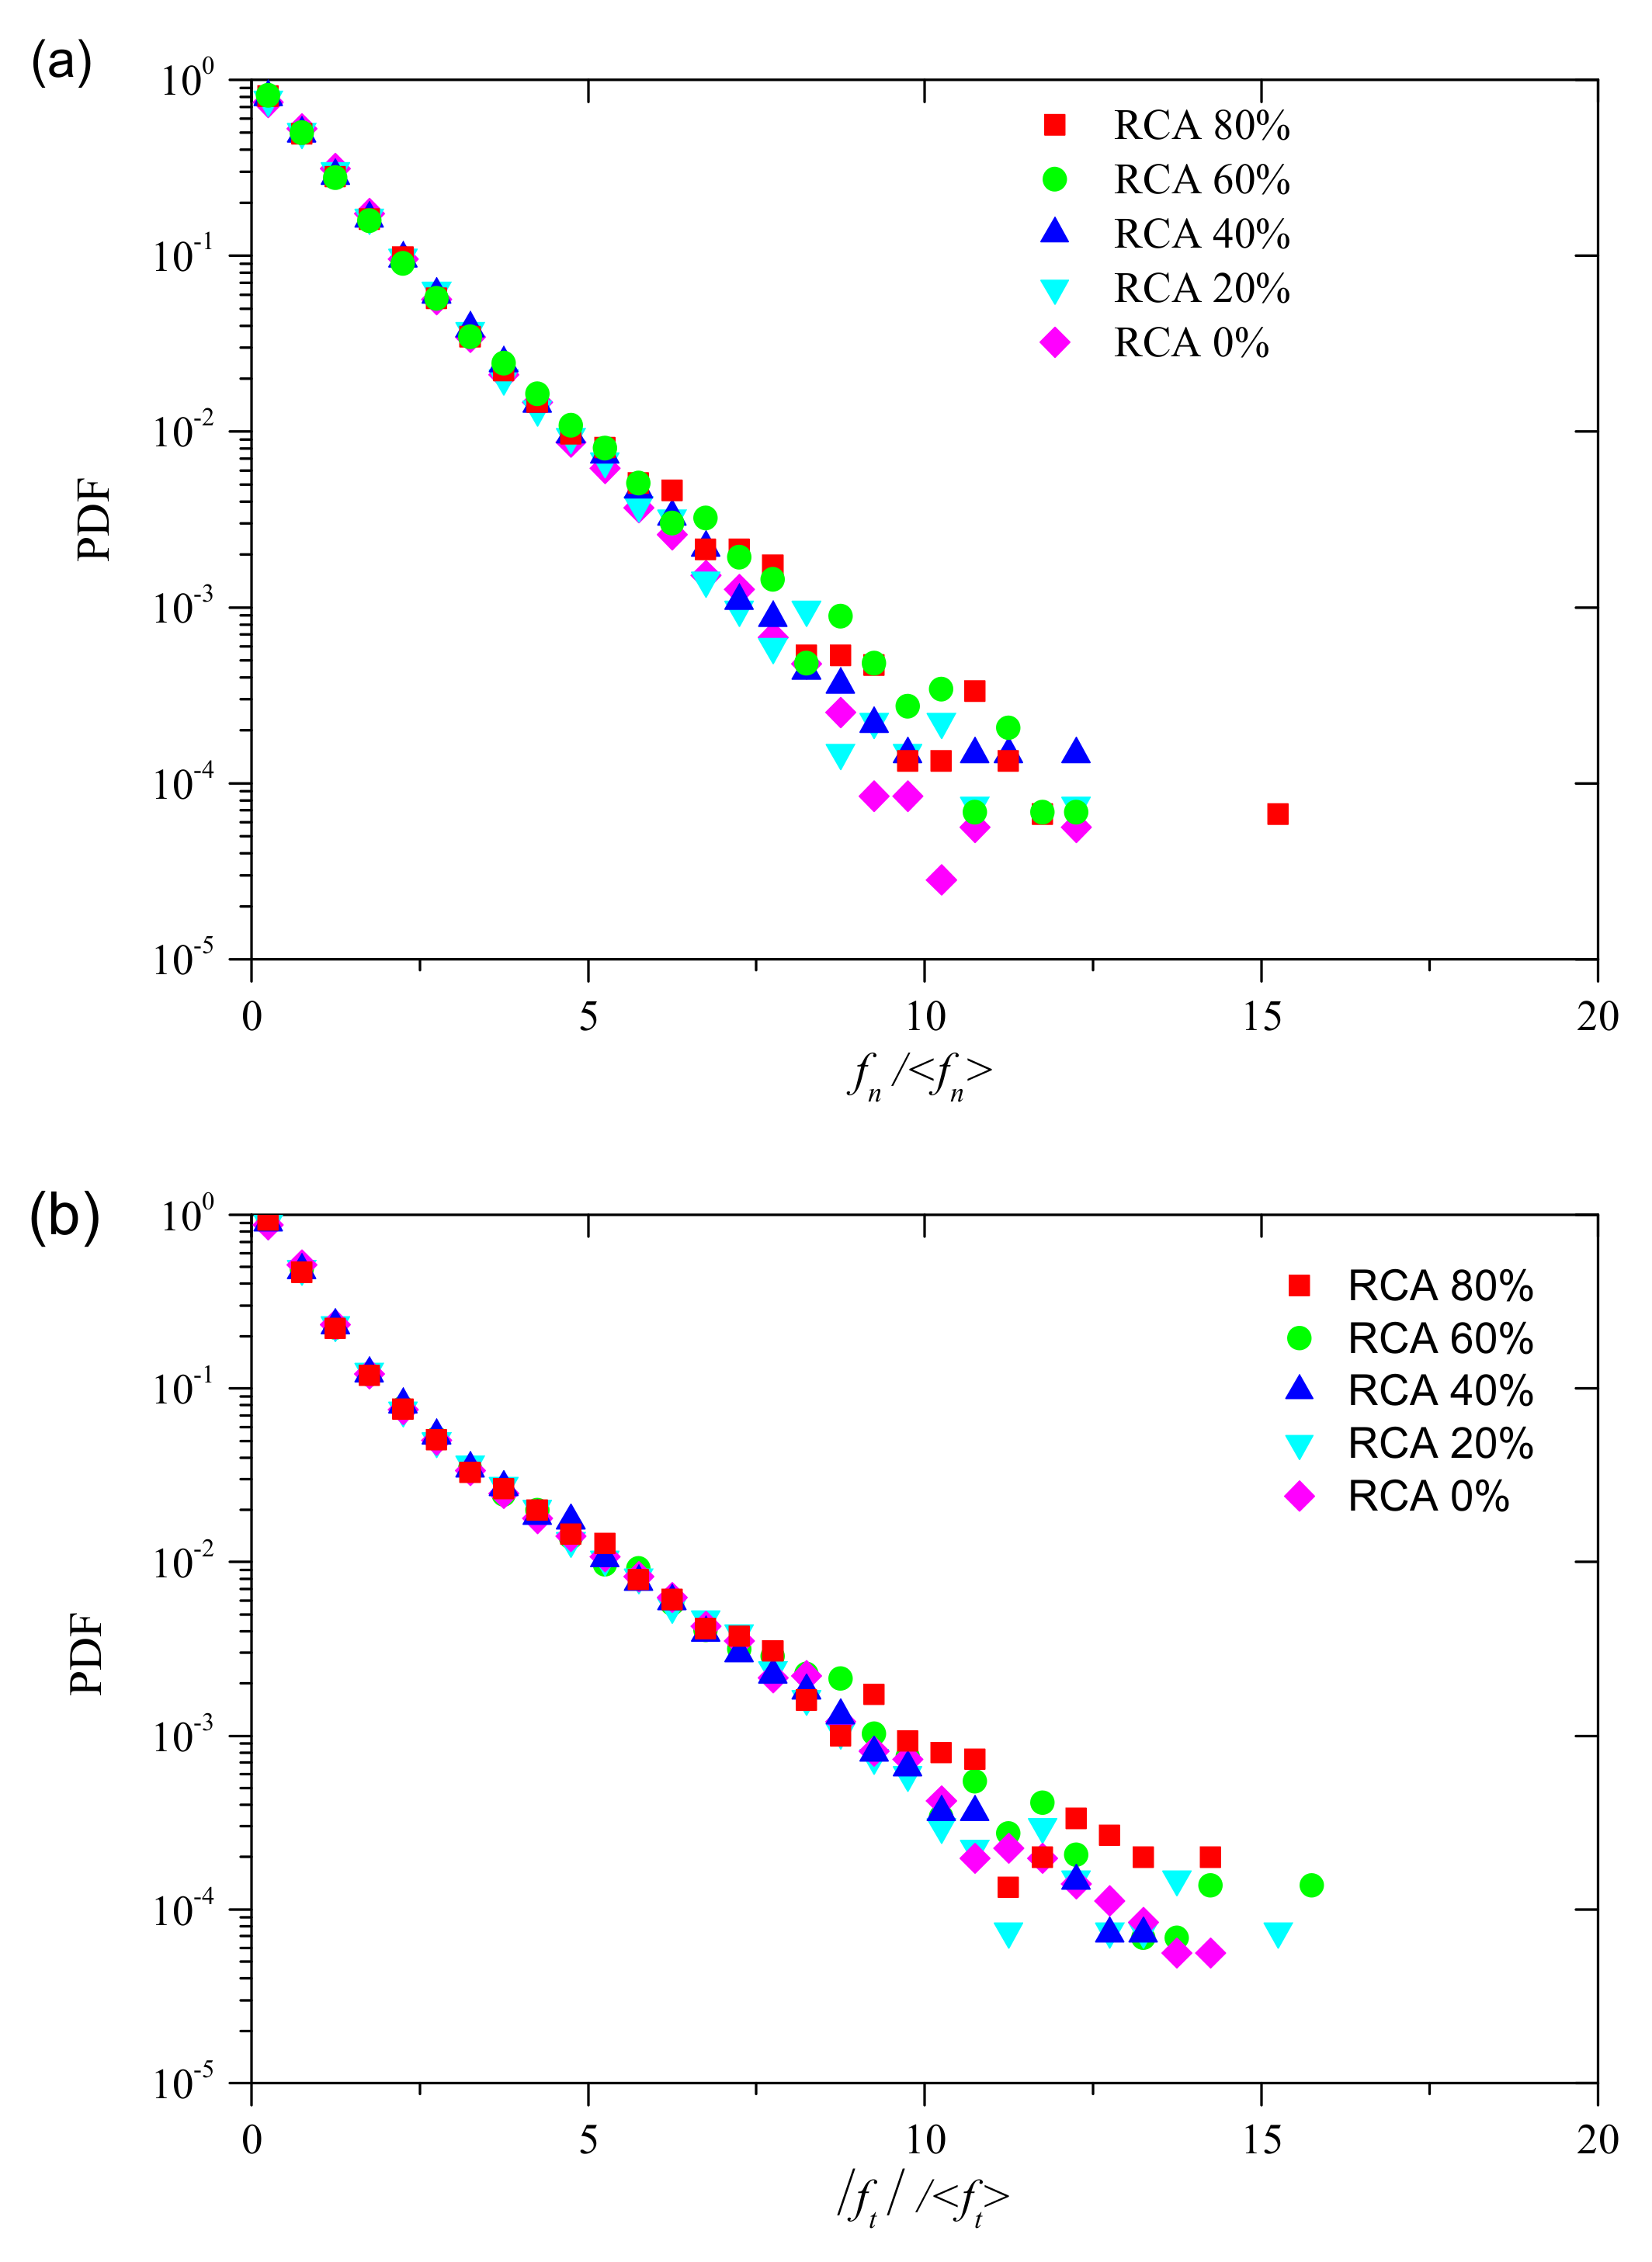
4.2.2. Contact Forces in the Peak State
4.2.3. Contact Force Anisotropy
5. Conclusions
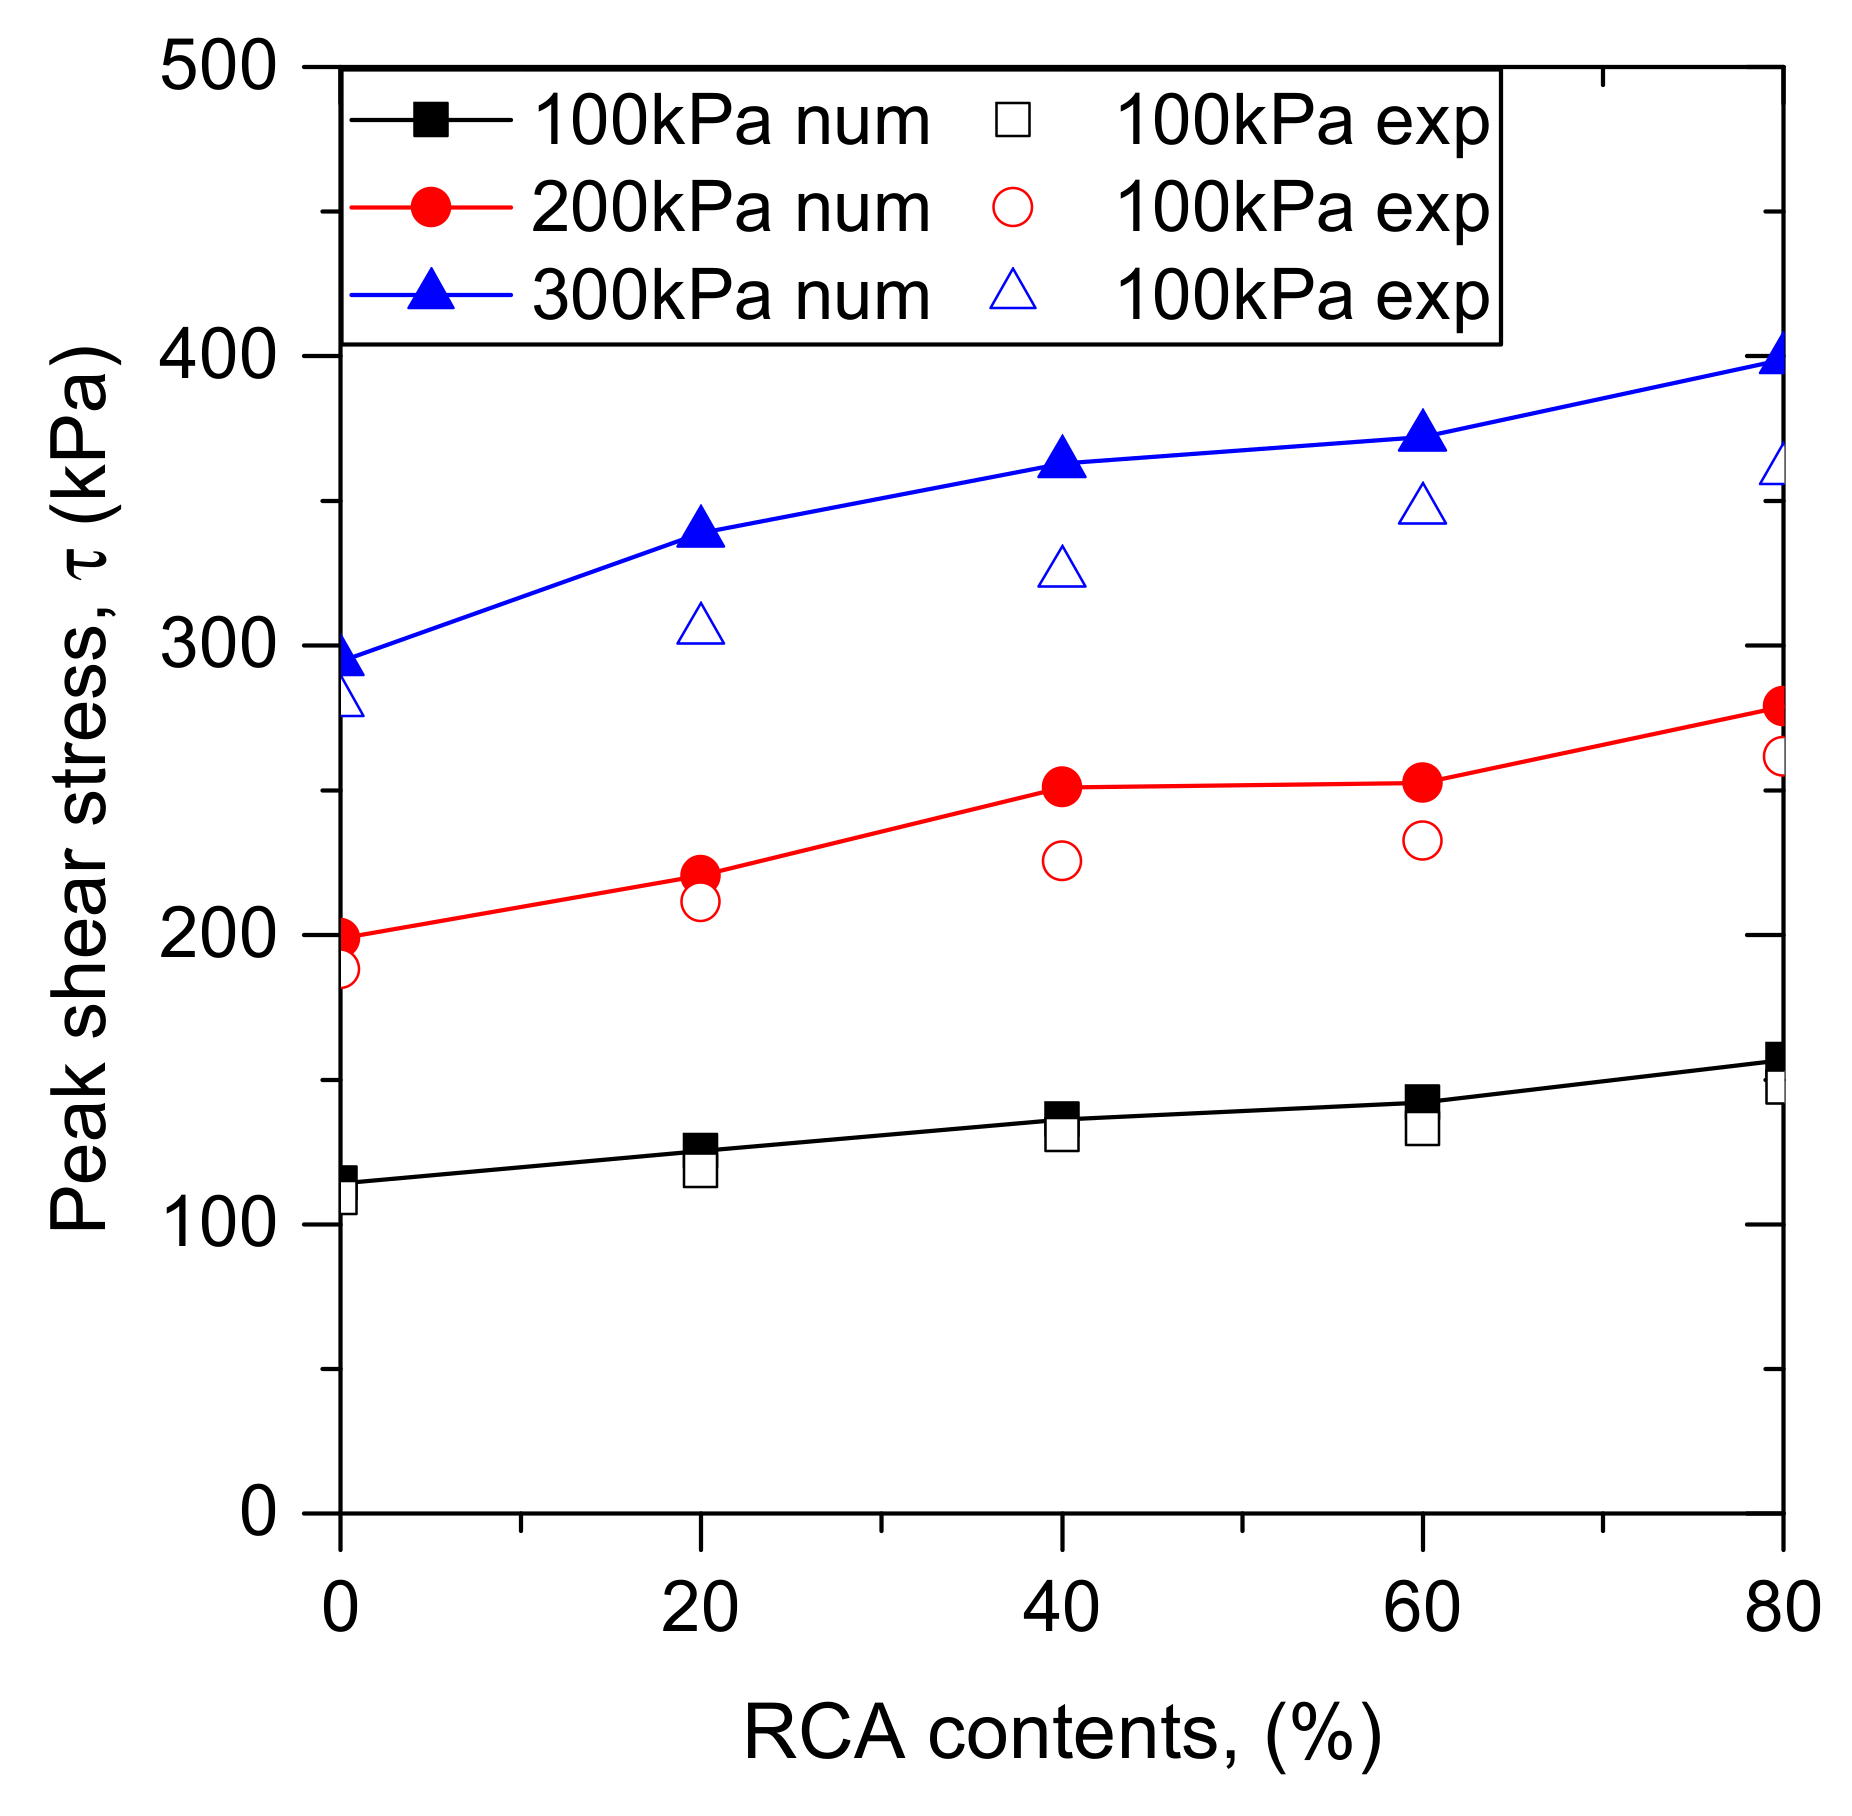
- The RCA content plays an important role in the mechanical performance of RCA–sand mixtures. Both the laboratory test and numerical simulation results show that the shear strength increases after adding RCA to sand, and, with the increase of the RCA content, the shear strength of the RCA–sand mixtures increases.
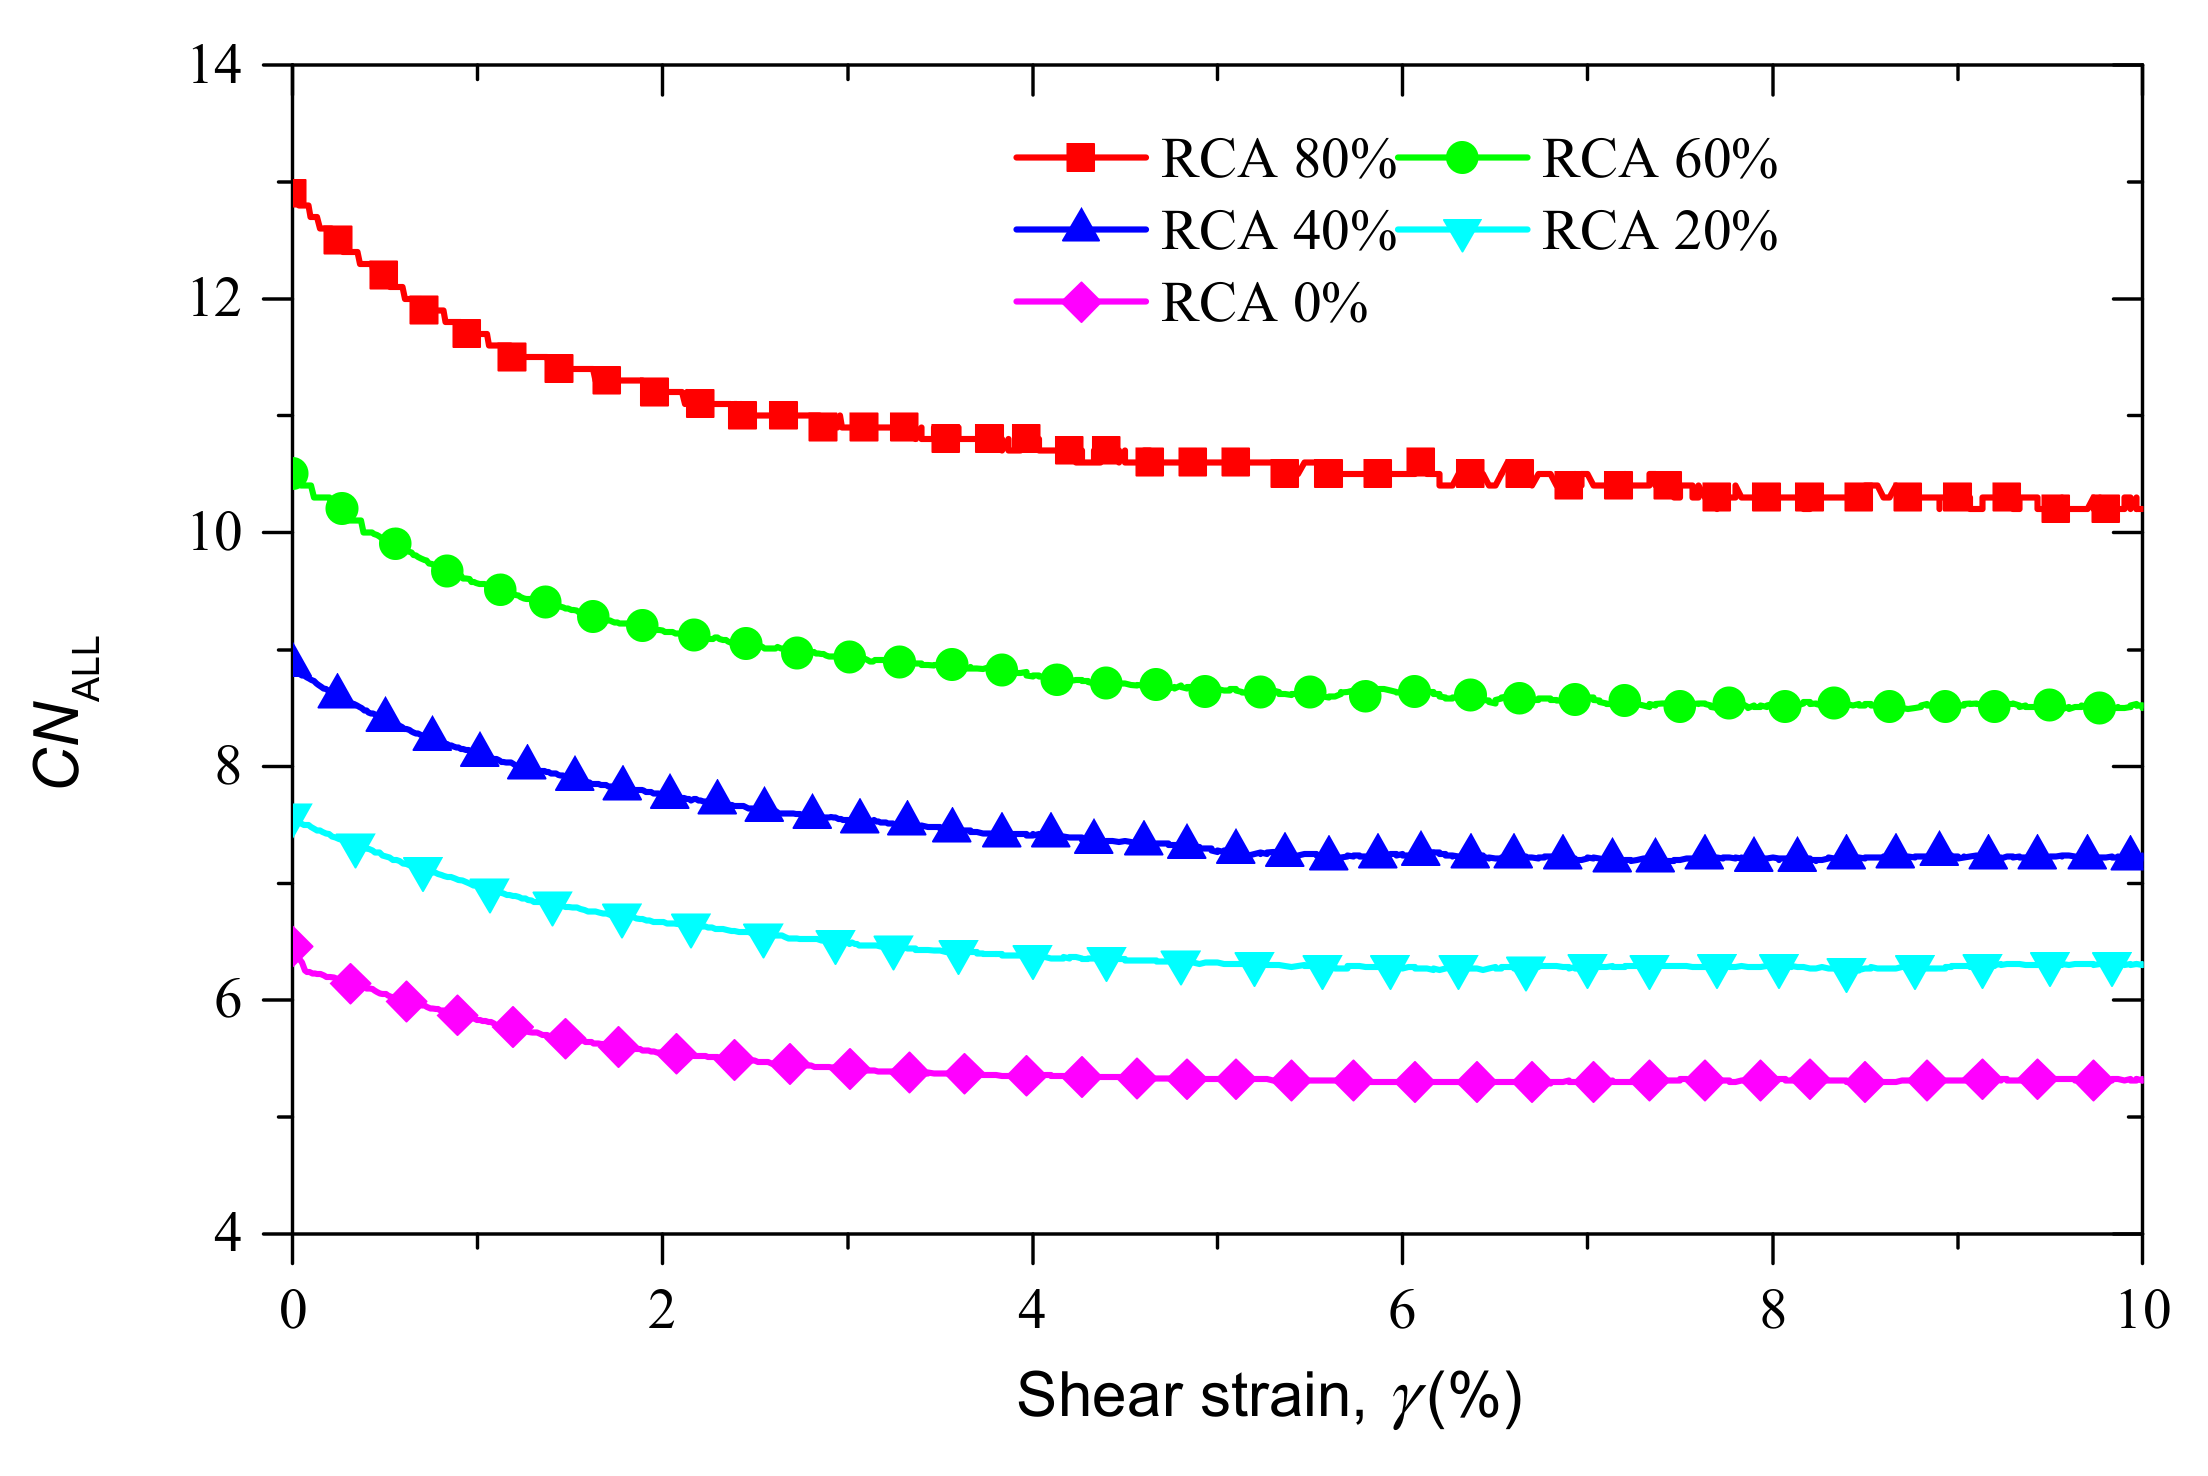
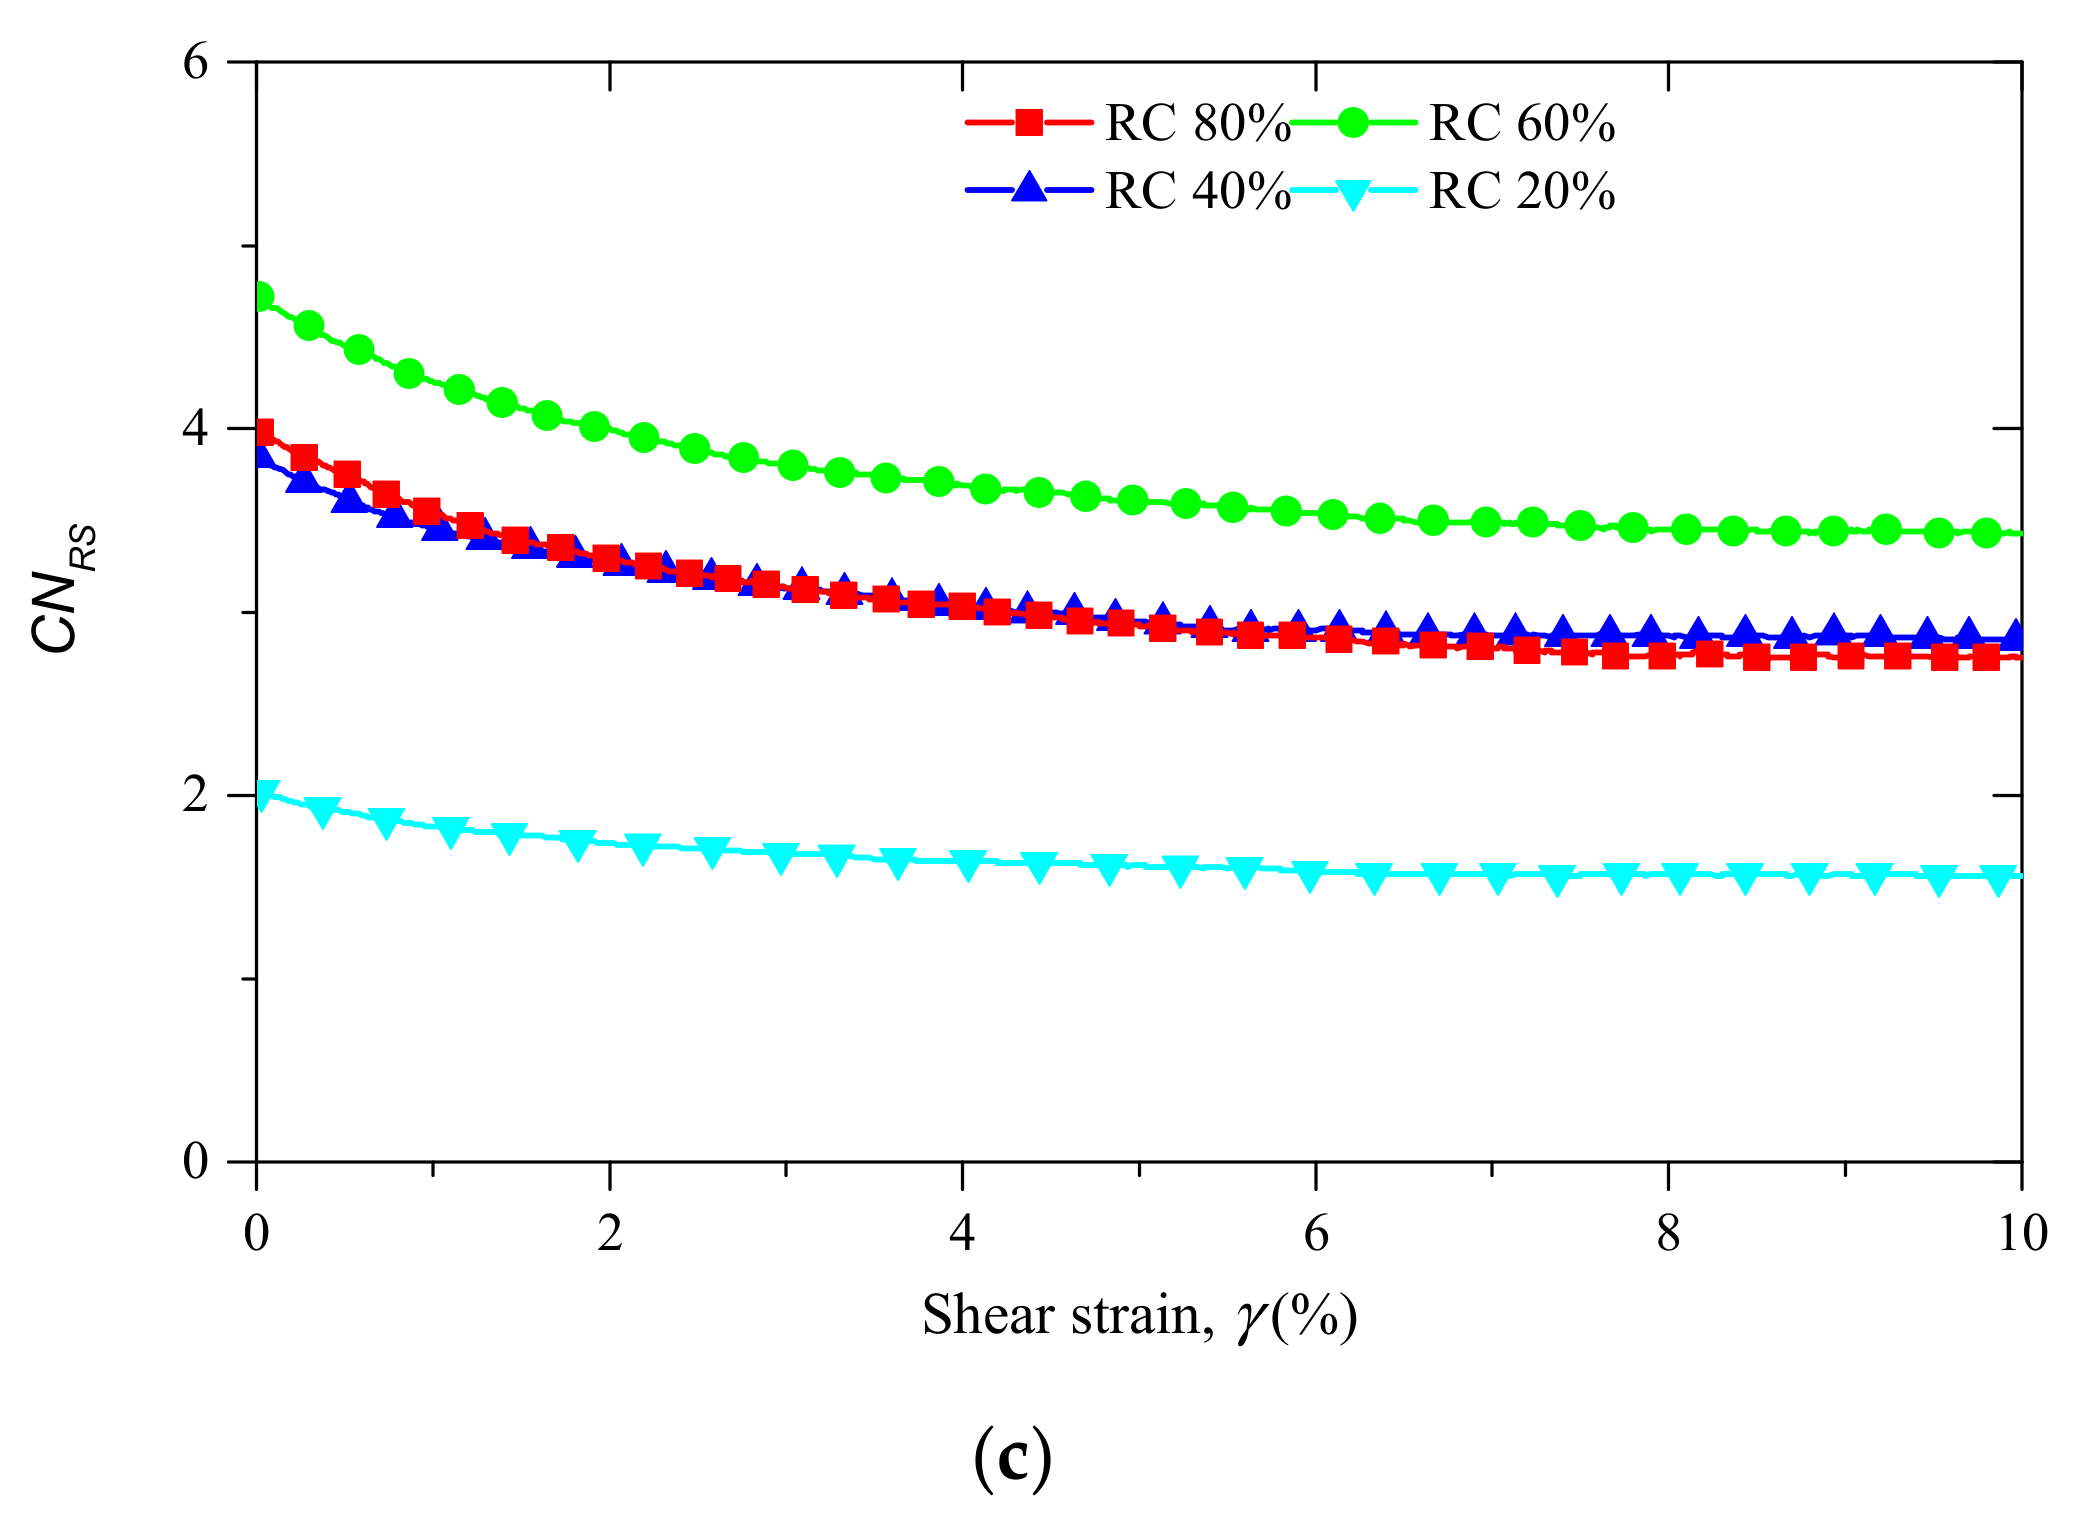
- The coordination number of all contacts increases with the RCA content. For specific contacts, the decreases and the increases with RCA content, while the has an increasing trend with the RCA content increasing from 20% to 60%, and then it decreases as the RCA content increases to 80%.
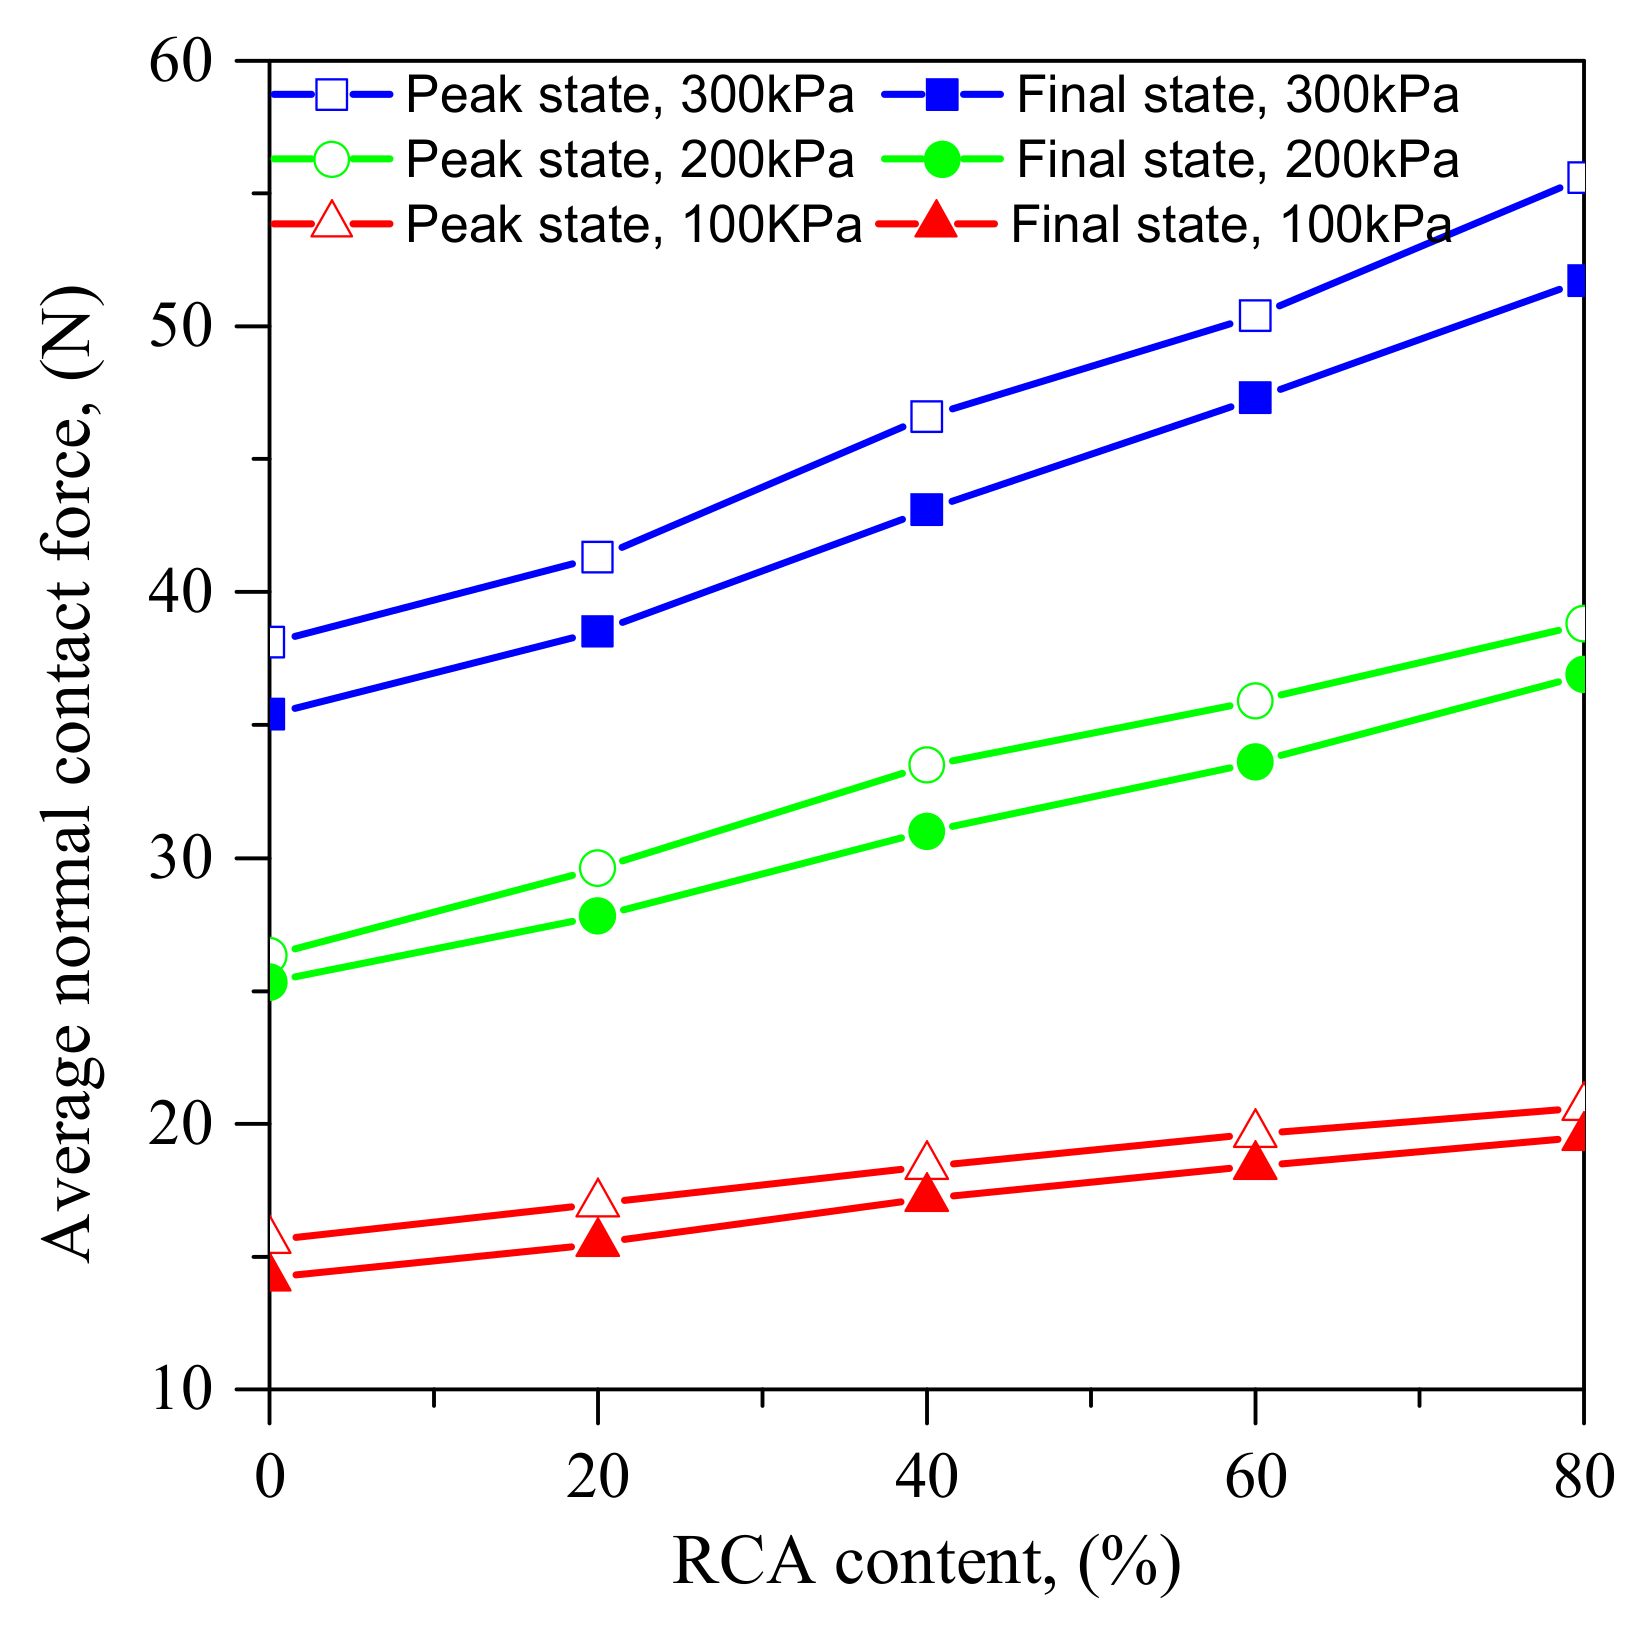
- The distribution of contact force can be significantly affected by the RCA content. An increase in the RCA content leads to an increase in the average contact force. Analyses of the PDFs of contact forces show that RCA tends to have a more significant effect on the occurrence of large contact forces.
- The RCA content can significantly affect the anisotropies of normal contact forces. The rotation of the normal contact force anisotropy decreases with the RCA content. Meanwhile, the anisotropies of the shear contact forces seem to be much less affected by the RCA content, while the rotation of the shear contact force anisotropy was found to be independent of the RCA content.
Author Contributions
Funding
Institutional Review Board Statement
Informed Consent Statement
Data Availability Statement
Conflicts of Interest
References
- Rao, A.; Jha, K.N.; Misra, S. Use of aggregates from recycled construction and demolition waste in concrete. Resour. Conserv. Recycl. 2007, 50, 71–81. [Google Scholar] [CrossRef]
- Cardoso, R.; Silva, R.V.; de Brito, J.; Dhir, R. Use of recycled aggregates from construction and demolition waste in geotechnical applications: A literature review. Waste Manag. 2016, 49, 131–145. [Google Scholar] [CrossRef] [PubMed]
- Wu, H.; Zuo, J.; Yuan, H.; Zillante, G.; Wang, J. A review of performance assessment methods for construction and demolition waste management. Resour. Conserv. Recycl. 2019, 150, 104407. [Google Scholar] [CrossRef]
- Wu, H.; Zuo, J.; Yuan, H.; Zillante, G.; Wang, J. Cross-regional mobility of construction and demolition waste in Australia: An exploratory study. Resour. Conserv. Recycl. 2020, 156, 104710. [Google Scholar] [CrossRef]
- Arulrajah, A.; Mohammadinia, A.; D’Amico, A.; Horpibulsuk, S. Cement kiln dust and fly ash blends as an alternative binder for the stabilization of demolition aggregates. Constr. Build. Mater. 2017, 145, 218–225. [Google Scholar] [CrossRef]
- Vieira, C.S.; Pereira, P.M. Use of recycled construction and demolition materials in geotechnical applications: A review. Resour. Conserv. Recycl. 2015, 103, 192–204. [Google Scholar] [CrossRef]
- Yazdani, M.; Kabirifar, K.; Frimpong, B.E.; Shariati, M.; Mirmozaffari, M.; Boskabadi, A. Improving construction and demolition waste collection service in an urban area using a simheuristic approach: A case study in Sydney, Australia. J. Clean. Prod. 2021, 280, 124138. [Google Scholar] [CrossRef]
- Kianimehr, M.; Shourijeh, P.T.; Binesh, S.M.; Mohammadinia, A.; Arulrajah, A. Utilization of recycled concrete aggregates for light-stabilization of clay soils. Constr. Build. Mater. 2019, 227, 116792. [Google Scholar] [CrossRef]
- Nagataki, S.; Gokce, A.; Saeki, T.; Hisada, M. Assessment of recycling process induced damage sensitivity of recycled concrete aggregates. Cem. Concr. Res. 2004, 34, 965–971. [Google Scholar] [CrossRef]
- Soleimanbeigi, A.; Tanyu, B.F.; Aydilek, A.H.; Florio, P.; Abbaspour, A.; Dayioglu, A.Y.; Likos, W.J. Evaluation of recycled concrete aggregate backfill for geosynthetic-reinforced MSE walls. Geosynth. Int. 2019, 26, 396–412. [Google Scholar] [CrossRef]
- De Juan, M.S.; Gutiérrez, P.A. Study on the influence of attached mortar content on the properties of recycled concrete aggregate. Constr. Build. Mater. 2009, 23, 872–877. [Google Scholar] [CrossRef]
- Soleimanbeigi, A.; Edil, T.B. Compressibility of Recycled Materials for Use As Highway Embankment Fill. J. Geotech. Geoenviron. Eng. 2015, 141, 04015011. [Google Scholar] [CrossRef]
- Bai, G.; Zhu, C.; Liu, C.; Liu, B. An evaluation of the recycled aggregate characteristics and the recycled aggregate concrete mechanical properties. Constr. Build. Mater. 2020, 240, 117978. [Google Scholar] [CrossRef]
- Arulrajah, A.; Imteaz, M.; Horpibulsuk, S.; Du, Y.J.; Shen, J.S.L. Recycled concrete aggregate/municipal glass blends as a low-carbon resource material for footpaths. Road Mater. Pavement Des. 2018, 19, 727–740. [Google Scholar] [CrossRef]
- Leite, F.D.C.; Motta, R.D.S.; Vasconcelos, K.L.; Bernucci, L. Laboratory evaluation of recycled construction and demolition waste for pavements. Constr. Build. Mater. 2011, 25, 2972–2979. [Google Scholar] [CrossRef]
- Ossa, A.; García, J.L.; Botero, E. Use of recycled construction and demolition waste (CDW) aggregates: A sustainable alternative for the pavement construction industry. J. Clean. Prod. 2016, 135, 379–386. [Google Scholar] [CrossRef]
- Perera, S.; Arulrajah, A.; Wong, Y.; Maghool, F.; Horpibulsuk, S. Evaluation of shear strength properties of unbound PET plastic in blends with demolition wastes. Constr. Build. Mater. 2020, 262, 120545. [Google Scholar] [CrossRef]
- Soleimanbeigi, A.; Likos, W. Mechanical Properties of Recycled Concrete Aggregate and Recycled Asphalt Pavement Reinforced with Geosynthetics. Rest. VA Am. Soc. Civ. Eng. 2019, 284–292. [Google Scholar] [CrossRef]
- Zhang, J.; Gu, F.; Zhang, Y. Use of building-related construction and demolition wastes in highway embankment: Laboratory and field evaluations. J. Clean. Prod. 2019, 230, 1051–1060. [Google Scholar] [CrossRef]
- Yaghoubi, E.; Arulrajah, A.; Wong, Y.C.; Horpibulsuk, S. Stiffness Properties of Recycled Concrete Aggregate with Polyethylene Plastic Granules in Unbound Pavement Applications. J. Mater. Civ. Eng. 2017, 29, 04016271. [Google Scholar] [CrossRef]
- Li, L.H.; Wen, B.; Hu, Z.; Shi, A.N.; Yu, C.D.; Zhang, J. Research on the reinforced shear properties of construction waste filler and geosynthetics. J. Wuhan Univ. Eng. Sci. Ed. 2019, 52, 4. [Google Scholar]
- Kuenza, K.; Towhata, I.; Orense, R.P.; Wassan, T.H. Undrained torsional shear tests on gravelly soils. Landslides 1 2004, 185–194. [Google Scholar] [CrossRef]
- Zhao, H.F.; Zhang, L.M. Effect of coarse content on shear behavior of unsaturated coarse granular soils. Can. Geotech. J. 2013, 51, 1371–1383. [Google Scholar] [CrossRef]
- Wang, Y.; Li, X.; Zheng, B.; Zhang, B.; Wang, J.B. Real-time ultrasonic experiments and mechanical properties of soil and rock mixture during triaxial deformation. Geotech. Lett. 2015, 5, 281–286. [Google Scholar] [CrossRef]
- Strahler, A.; Stuedlein, A.W.; Arduino, P.W. Stress-Strain Response and Dilatancy of Sandy Gravel in Triaxial Compression and Plane Strain. J. Geotech. Geoenviron. Eng. 2016, 142, 4015098. [Google Scholar] [CrossRef]
- Li, C.S.; Zhang, D.; Du, S.S.; Shi, B. Computed tomography based numerical simulation for triaxial test of soil-rock mixture. Comput. Geotech. 2016, 73, 179–188. [Google Scholar] [CrossRef]
- Simoni, A.; Houlsby, G.T. The direct shear strength and dilatancy of sand-gravel mixtures. Geotech. Geol. Eng. 2006, 24, 523–549. [Google Scholar] [CrossRef]
- Wen-Jie, X.; Qiang, X.; Rui-Lin, H. Study on the shear strength of soil-rock mixture by large scale direct shear test. Int. J. Rock Mech. Min. Sci. 2011, 48, 1235–1247. [Google Scholar] [CrossRef]
- Chang, W.J.; Phantachang, T. Effects of gravel content on shear resistance of gravelly soils. Eng. Geol. 2016, 207, 78–90. [Google Scholar] [CrossRef]
- Xu, D.; Tang, Z.; Zhang, L. Interpretation of coarse effect in simple shear behavior of binary sand-gravel mixture by DEM with authentic particle shape. Constr. Build. Mater. 2019, 195, 292–304. [Google Scholar] [CrossRef]
- Cundall, P.A.; Strack, O.D.L. A discrete numerical model for granular assemblies. Geotechnique 1979, 29, 47–65. [Google Scholar] [CrossRef]
- Bagi, K. An algorithm to generate random dense arrangements for discrete element simulations of granular assemblies. Granul. Matter. 2005, 7, 31–43. [Google Scholar] [CrossRef]
- Salazar, A.; Sáez, E.; Pardo, G. Modeling the direct shear test of a coarse sand using the 3D Discrete Element Method with a rolling friction model. Comput. Geotech. 2015, 67, 83–93. [Google Scholar] [CrossRef]
- Gong, H.; Song, W.; Huang, B.; Shu, X.; Han, B.; Wu, H.; Zou, J. Direct shear properties of railway ballast mixed with tire derived aggregates: Experimental and numerical investigations. Constr. Build. Mater. 2019, 200, 465–473. [Google Scholar] [CrossRef]
- Xu, D.S.; Tang, J.Y.; Zou, Y.; Rui, R.; Liu, H.B. Macro and micro investigation of gravel content on simple shear behavior of sand-gravel mixture. Constr. Build. Mater. 2019, 221, 730–744. [Google Scholar] [CrossRef]
- Zhang, T.; Zhang, C.; Zou, J.; Wang, B.; Song, F.; Yang, W. DEM exploration of the effect of particle shape on particle breakage in granular assemblies. Comput. Geotech. 2020, 122, 103542. [Google Scholar] [CrossRef]
- Zhou, B.; Wang, J. Generation of a realistic 3D sand assembly using X-ray micro-computed tomography and spherical harmonic-based principal component analysis. Int. J. Numer. Anal. Methods Geomech. 2017, 41, 93–109. [Google Scholar] [CrossRef]
- Afshar, T.; Disfani, M.M.; Arulrajah, A.; Narsilio, G.A.; Emam, S. Impact of particle shape on breakage of recycled construction and demolition aggregates. Powder Technol. 2017, 308, 1–12. [Google Scholar] [CrossRef]
- Zhou, B.; Wang, J. Random generation of natural sand assembly using micro X-ray tomography and spherical harmonics. Geotech. Lett. 2015, 5, 6–11. [Google Scholar] [CrossRef]
- Zhou, B.; Wang, J.; Zhao, B. Micromorphology characterization and reconstruction of sand particles using micro X-ray tomography and spherical harmonics. Eng. Geol. 2015, 184, 126–137. [Google Scholar] [CrossRef]
- Hasan, A.; Alshibli, K.A. Experimental assessment of 3D particle-to-particle interaction within sheared sand using synchrotron microtomography. Geotechnique 2010, 60, 369–379. [Google Scholar] [CrossRef]
- Rothenburg, L.; Kruyt, N.P. Critical state and evolution of coordination number in simulated granular materials. Int. J. Solids Struct. 2004, 41, 5763–5774. [Google Scholar] [CrossRef]
- Thornton, C. Numerical simulations of deviatoric shear deformation of granular media. Geotechnique 2000, 50, 43–53. [Google Scholar] [CrossRef]
- Minh, N.H.; Cheng, Y.P. A DEM investigation of the effect of particle-size distribution on one-dimensional compression. Geotechnique 2013, 63, 44–53. [Google Scholar] [CrossRef]
- Rothenburg, L.; Bathurst, R.J. Analytical study of induced anisotropy in idealized granular materials. Geotechnique 1989, 39, 601–614. [Google Scholar] [CrossRef]


| RCA Content | 0% | 20% | 40% | 60% | 80% |
|---|---|---|---|---|---|
| Density (kg/m3) | 1720 | 1742 | 1764 | 1786 | 1808 |
| Parameters | RCA | Sand | Wall |
|---|---|---|---|
| Density, ρ (kg/m3) | 2500 | 2700 | - |
| Normal stiffness, kn (N/m) | 5 × 10⁵ | 5 × 10⁵ | 5 × 10⁶ |
| Tangential stiffness, ks (N/m) | 5 × 10⁵ | 5 × 10⁵ | 5 × 10⁶ |
| Internal friction coefficient, μ | 0.7 | 0.5 | - |
| Rolling friction coefficient, μr | - | 1.0 | - |
| Local damping | 0.7 | 0.7 | - |
| 0% | 33,210.01 | 0.68 | 89.75 | 41,752.45 | 0.87 | 52.79 | 38,021.11 | 0.81 | 61.58 |
| 20% | 31,801.40 | 0.65 | 89.87 | 40,257.75 | 0.84 | 51.91 | 36,889.23 | 0.78 | 58.64 |
| 40% | 30,605.90 | 0.64 | 89.63 | 39,432.10 | 0.82 | 48.12 | 35,397.66 | 0.76 | 57.03 |
| 60% | 28,967.13 | 0.64 | 90.04 | 37,088.46 | 0.82 | 47.48 | 33,504.11 | 0.76 | 56.17 |
| 80% | 26,722.61 | 0.62 | 89.33 | 36,247.77 | 0.87 | 45.25 | 32,291.18 | 0.77 | 55.69 |
| 0% | 172.15 | 0.39 | 129.14 | 4867.23 | 0.92 | 115.15 | 3012.45 | 0.83 | 118.42 |
| 20% | 164.06 | 0.38 | 130.41 | 4811.37 | 0.94 | 116.48 | 2890.46 | 0.82 | 118.03 |
| 40% | 134.97 | 0.46 | 126.18 | 4878.95 | 0.95 | 117.59 | 2714.54 | 0.85 | 118.91 |
| 60% | 149.17 | 0.41 | 127.07 | 4857.70 | 0.96 | 118.18 | 2793.37 | 0.83 | 119.15 |
| 80% | 152.78 | 0.49 | 130.08 | 5241.15 | 0.98 | 118.86 | 2675.40 | 0.84 | 117.21 |
Publisher’s Note: MDPI stays neutral with regard to jurisdictional claims in published maps and institutional affiliations. |
© 2021 by the authors. Licensee MDPI, Basel, Switzerland. This article is an open access article distributed under the terms and conditions of the Creative Commons Attribution (CC BY) license (https://creativecommons.org/licenses/by/4.0/).
Share and Cite
Liu, Y.; Huang, S.; Li, L.; Xiao, H.; Chen, Z.; Mao, H. Experimental and Numerical Studies on the Direct Shear Behavior of Sand–RCA (Recycled Concrete Aggregates) Mixtures with Different Contents of RCA. Materials 2021, 14, 2909. https://doi.org/10.3390/ma14112909
Liu Y, Huang S, Li L, Xiao H, Chen Z, Mao H. Experimental and Numerical Studies on the Direct Shear Behavior of Sand–RCA (Recycled Concrete Aggregates) Mixtures with Different Contents of RCA. Materials. 2021; 14(11):2909. https://doi.org/10.3390/ma14112909
Chicago/Turabian StyleLiu, Yiming, Shiqiang Huang, Lihua Li, Henglin Xiao, Zhi Chen, and Haijun Mao. 2021. "Experimental and Numerical Studies on the Direct Shear Behavior of Sand–RCA (Recycled Concrete Aggregates) Mixtures with Different Contents of RCA" Materials 14, no. 11: 2909. https://doi.org/10.3390/ma14112909
APA StyleLiu, Y., Huang, S., Li, L., Xiao, H., Chen, Z., & Mao, H. (2021). Experimental and Numerical Studies on the Direct Shear Behavior of Sand–RCA (Recycled Concrete Aggregates) Mixtures with Different Contents of RCA. Materials, 14(11), 2909. https://doi.org/10.3390/ma14112909