
Investigation of Changes in Fatigue Damage Caused by Mean Load under Block Loading Conditions


Abstract
1. Introduction
- After the first phase of loading, the second phase of testing is carried out to obtain the criterion of sample failure.
- The sequence of cycles n1 and n2 is determined, and this load sequence is repeated until the criterion of sample failure is not reached.
2. Stress–Strain Analysis Model
3. Analytical Simulation
- -
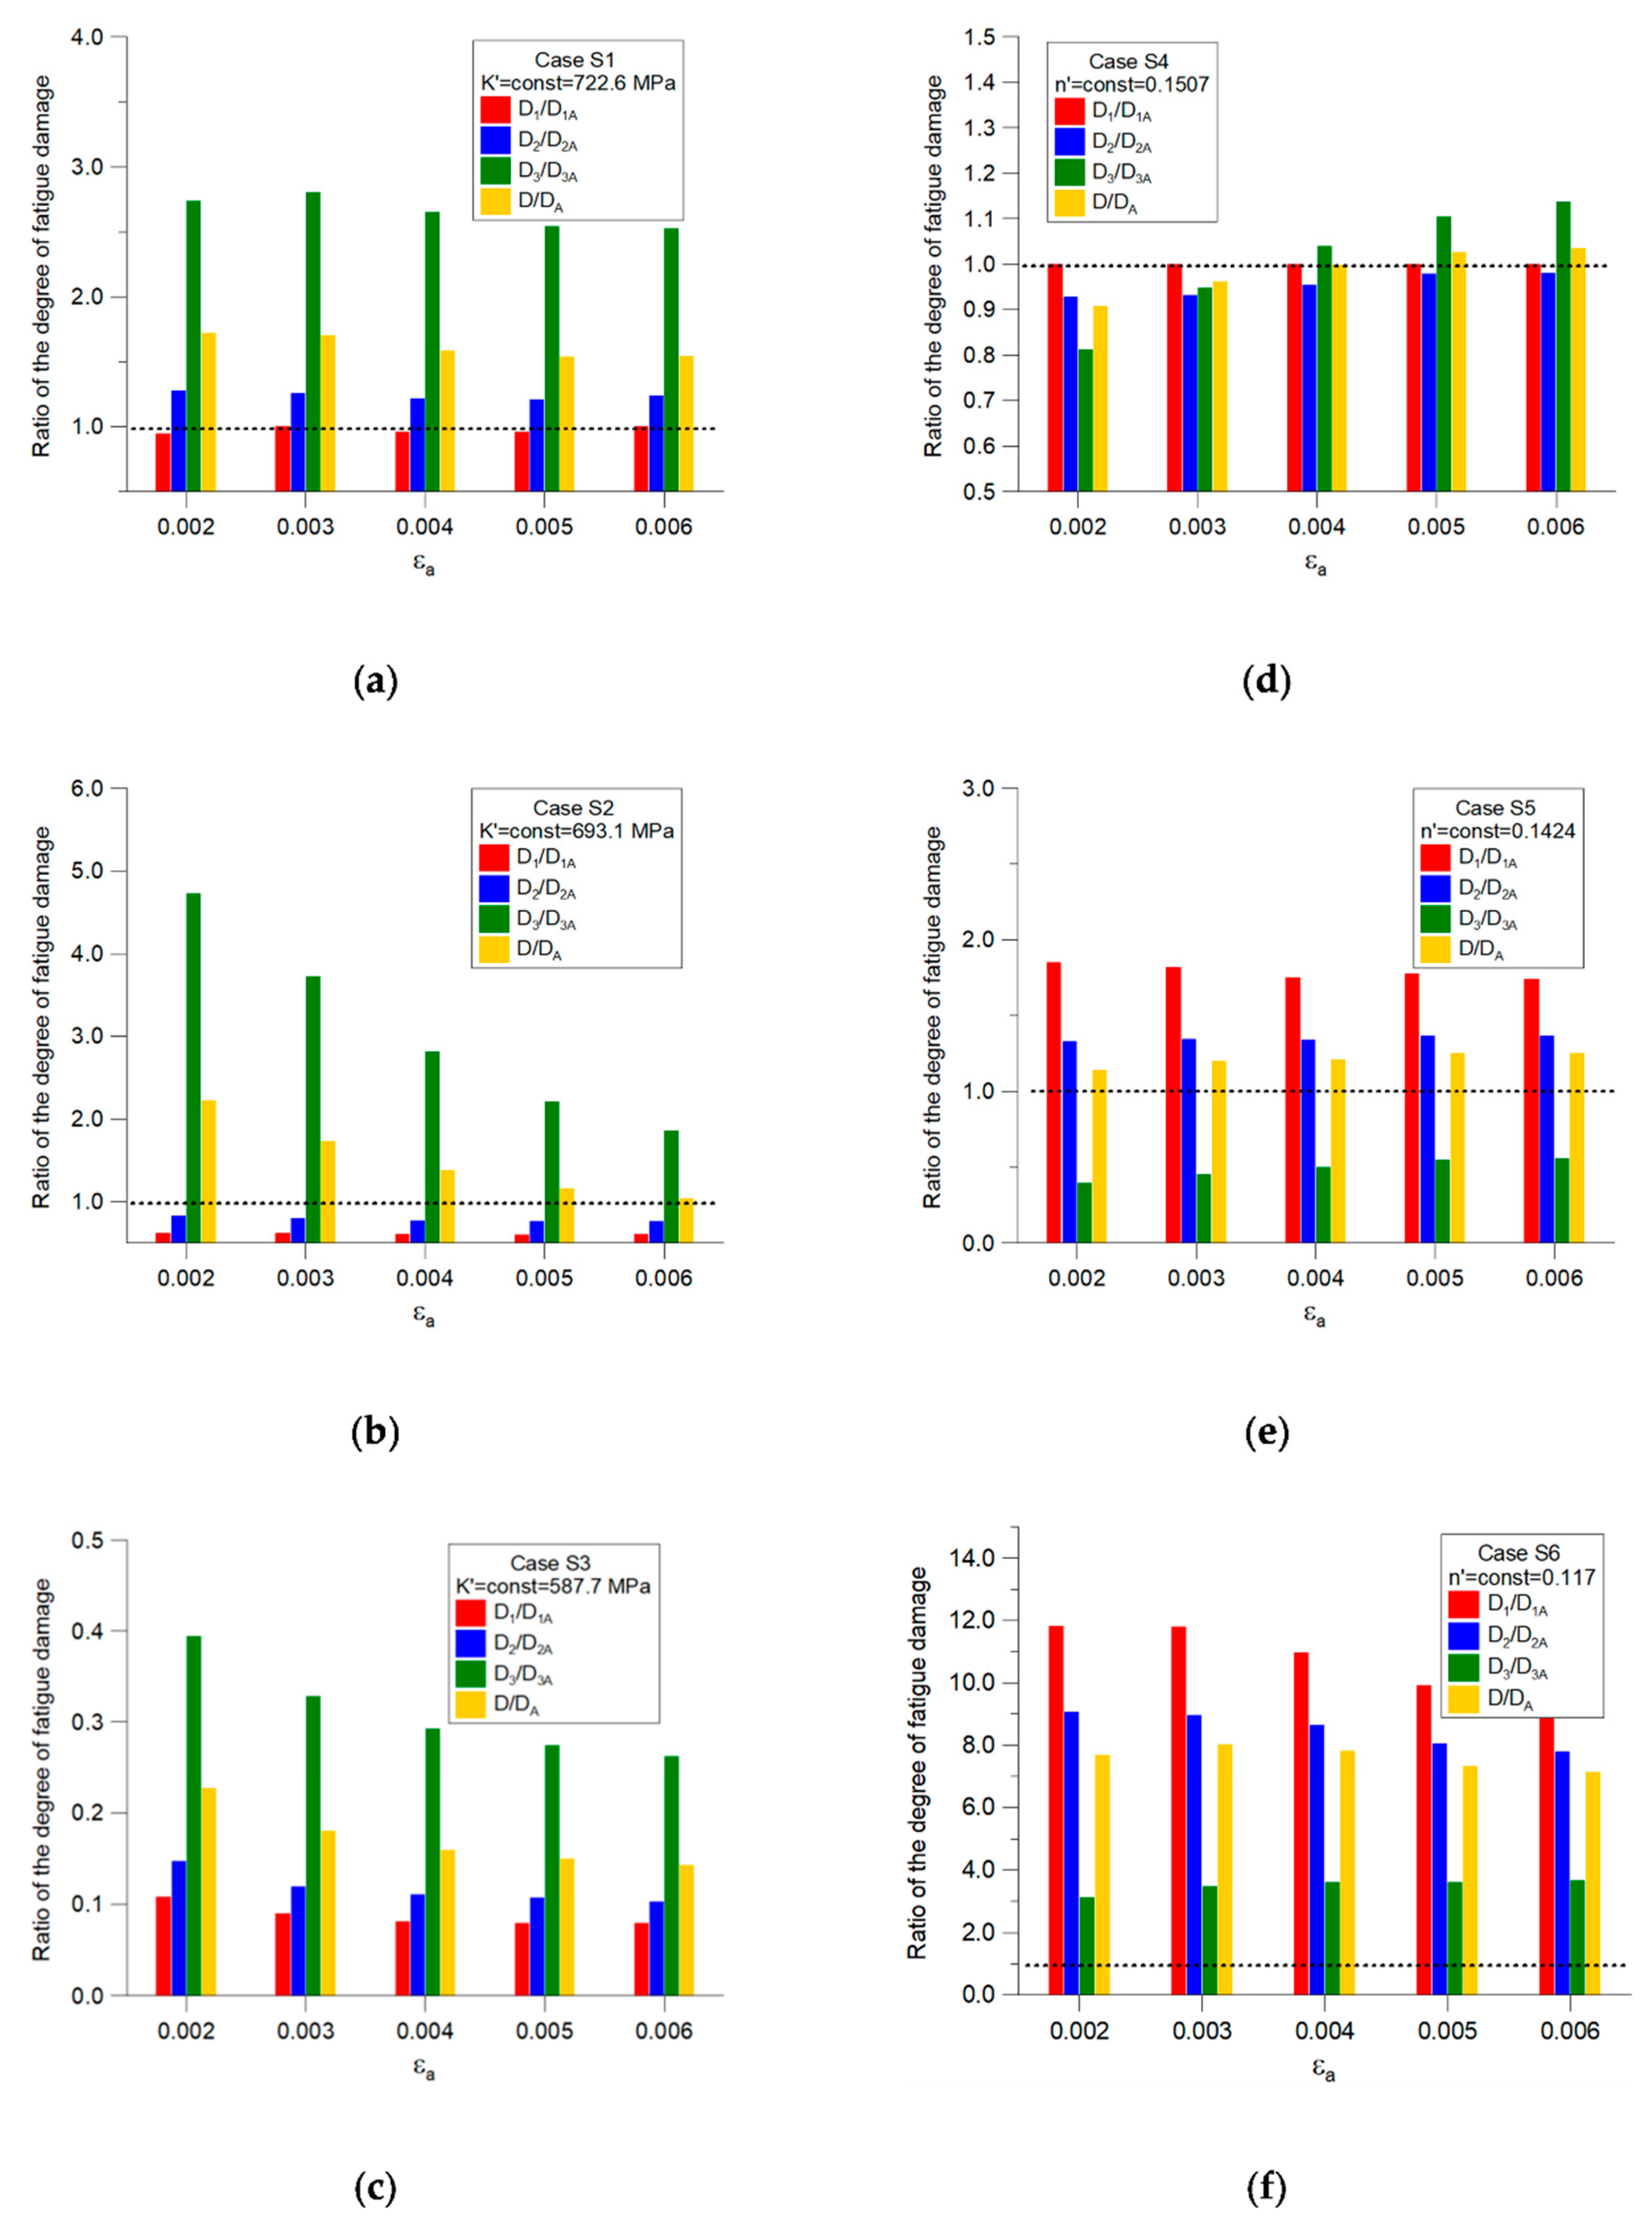
- Case A, where the change in K′ and n′ parameters was taken into account for different values of the mean strain em,
- -
- Case B, where the influence of mean strain em on the values of the coefficients K ‘and n′ was omitted, assuming their values to be em = 0.
4. Summary and Conclusions
- -
- When neglecting the effect of the mean strain value on the K′ and n′ parameters and considering only the parameters of the cyclic deformation curve for εm = 0 (symmetric loads), the ratio of the total degree of fatigue damage varied from 10% for εa = 0.2% to 3.5% for εa = 0.6%. The largest differences in the calculation of the ratio of the partial degrees of fatigue damage in relation to the reference case were observed for sequence block n3, where εm = 0.4%.
- -
- When assuming the independence of parameter K′ from the mean strain value, the worst calculation results in relation to the reference Case A were obtained for K′ = 587.7 MPa, where the total degree of fatigue damage was, on average, four times lower than the reference case. For these simulations, the largest calculation inaccuracy was also related to the n3 block load sequence, where the mean strain value was the largest (0.4%).
- -
- When considering the independence of parameter n′ from the mean strain value, the best results in terms of the degree of fatigue damage calculation were achieved for n′ = 0.1507 (obtained for a symmetric load, εm = 0). The differences in the ratios of partial and total degrees of fatigue damage compared to the reference case were in the range of −20% to 4%. Similar results were obtained for Case B, where parameters K′ and n′ characterized the cyclic strain curve for symmetric loads.
- -
- It can be concluded that the third sequence n3, where the biggest mean strain value was applied (εm = 0.4%), led to the largest inaccuracy. A higher value of mean strains, thus, increases the sensitivity of the algorithm toward applied parameters K′ and n′.
Author Contributions
Funding
Institutional Review Board Statement
Informed Consent Statement
Data Availability Statement
Conflicts of Interest
References
- Mrozinski, S.; Piotrowski, M. Effect of strain level on cyclic properties of S355 steel. AIP Conf. Proc. 2016, 1780, 020005. [Google Scholar]
- Golanski, G.; Mrozinski, S. Low cycle fatigue and cyclic softening behaviour of martensitic cast steel. Eng. Fail. Anal. 2013, 35, 692–702. [Google Scholar] [CrossRef]
- Jiang, Y.; Kurath, P. Characteristics of the Armstrong-Frederick type plasticity models. Int. J. Plast. 1996, 12, 387–415. [Google Scholar] [CrossRef]
- Jiang, Y.; Sehitoglu, H. Comments on the Mróz multiple surface type plasticity models. Int. J. Solids Struct. 1996, 33, 1053–1068. [Google Scholar] [CrossRef]
- Meggiolaro, M.; Castro, J.; Wu, H. On the applicability of multi-surface, two-surface and non-linear kinematic hardening models in multiaxial fatigue. Fract. Struct. Integr. 2015, 33, 357–367. [Google Scholar]
- Garud, Y. A new approach to the evaluation of fatigue under multiaxial loadings. J. Press. Vessel Technol. 1981, 103, 118–125. [Google Scholar] [CrossRef]
- Manson, S.; Halford, G. Practical implementation of the double linear damage rule and damage curve approach for treating cumulative fatigue damage. Int. J. Fract. 1981, 17, 169–192. [Google Scholar] [CrossRef]
- Fatemi, A.; Yang, L. Cumulative fatigue damage and life prediction theories: A survey of the state of the art for homogeneous materials. Int. J. Fatigue. 1998, 20, 9–34. [Google Scholar] [CrossRef]
- Zhiqiang, L. A modified nonlinear fatigue damage accumulation model. Int. J. Damage Mech. 2015, 24, 168–181. [Google Scholar]
- Mrozinski, S. Energy-based method of fatigue damage cumulation. Int. J. Fatigue 2019, 121, 73–83. [Google Scholar] [CrossRef]
- Bohm, E.; Kurek, M.; Łagoda, T.; Łagoda, K. The use a power law function for fatigue life estimation for block loads. Solid State Phenom. 2016, 250, 1–9. [Google Scholar] [CrossRef]
- Bohm, E.; Kurek, M.; Łagoda, T. Fatigue Damage Accumulation Model of 6082-T6 Aluminum Alloy in Conditions of Block Bending and Torsion. J. Test. Eval. 2019, 48, 4416–4434. [Google Scholar] [CrossRef]
- Memon, I.; Zhang, X.; Cui, D. Fatigue life prediction of 3-D problems by damage mechanics with two-block loading. Int. J. Fatigue 2002, 24, 9–37. [Google Scholar]
- Gołos, K.; Debski, D. The influence of mean strain under two-step High-Low loading on cumulative fatigue damage in St5 steel. Mach. Dyn. Res. 2013, 37, 35-41. [Google Scholar]
- Pawliczek, R. Influence of the mean load value in fatigue block loading on strains. Key Eng. Mater. 2014, 598, 195–200. [Google Scholar] [CrossRef]
- Pawliczek, R.; Prazmowski, M. Study on material property changes of mild steel S355 caused by block loads with varying mean stress. Int. J. Fatigue 2015, 80, 171–177. [Google Scholar] [CrossRef]
- Pawliczek, R.; Lachowicz, C. Modelling of the stress-strain relationship for specimens made of S355J0 steel subjected to bending block loading with mean load. Fract. Struct. Integr. 2017, 42, 30–39. [Google Scholar]
- Pawliczek, R. Evaluation of fatigue damage degree for specimens made of S355J0 steel subjected to bending block loads with mean load value. AIP Conf. Proc. 2018, 2028, 020015. [Google Scholar]
- Chiou, Y.; Yip, M. Effect of mean strain level on the cyclic stress-strain behaviour of AISI 316 stainless steel. Mater. Sci. Eng. 2003, A354, 270–278. [Google Scholar] [CrossRef]
- Lei, H.; Akebono, H.; Kato, M.; Sugeta, A. Fatigue life prediction method for AISI 316 stainless steel under variable-amplitude loading considering low-amplitude loading below the endurance limit in the ultrahigh cycle regime. Int. J. Fatigue 2017, 101, 18–26. [Google Scholar]


| Step No. | Description of Operation | Equation |
|---|---|---|
| 1. | Material properties: E, Young’s modulus; K′, cyclic strength coefficient; n′, cyclic strain-hardening exponent. | |
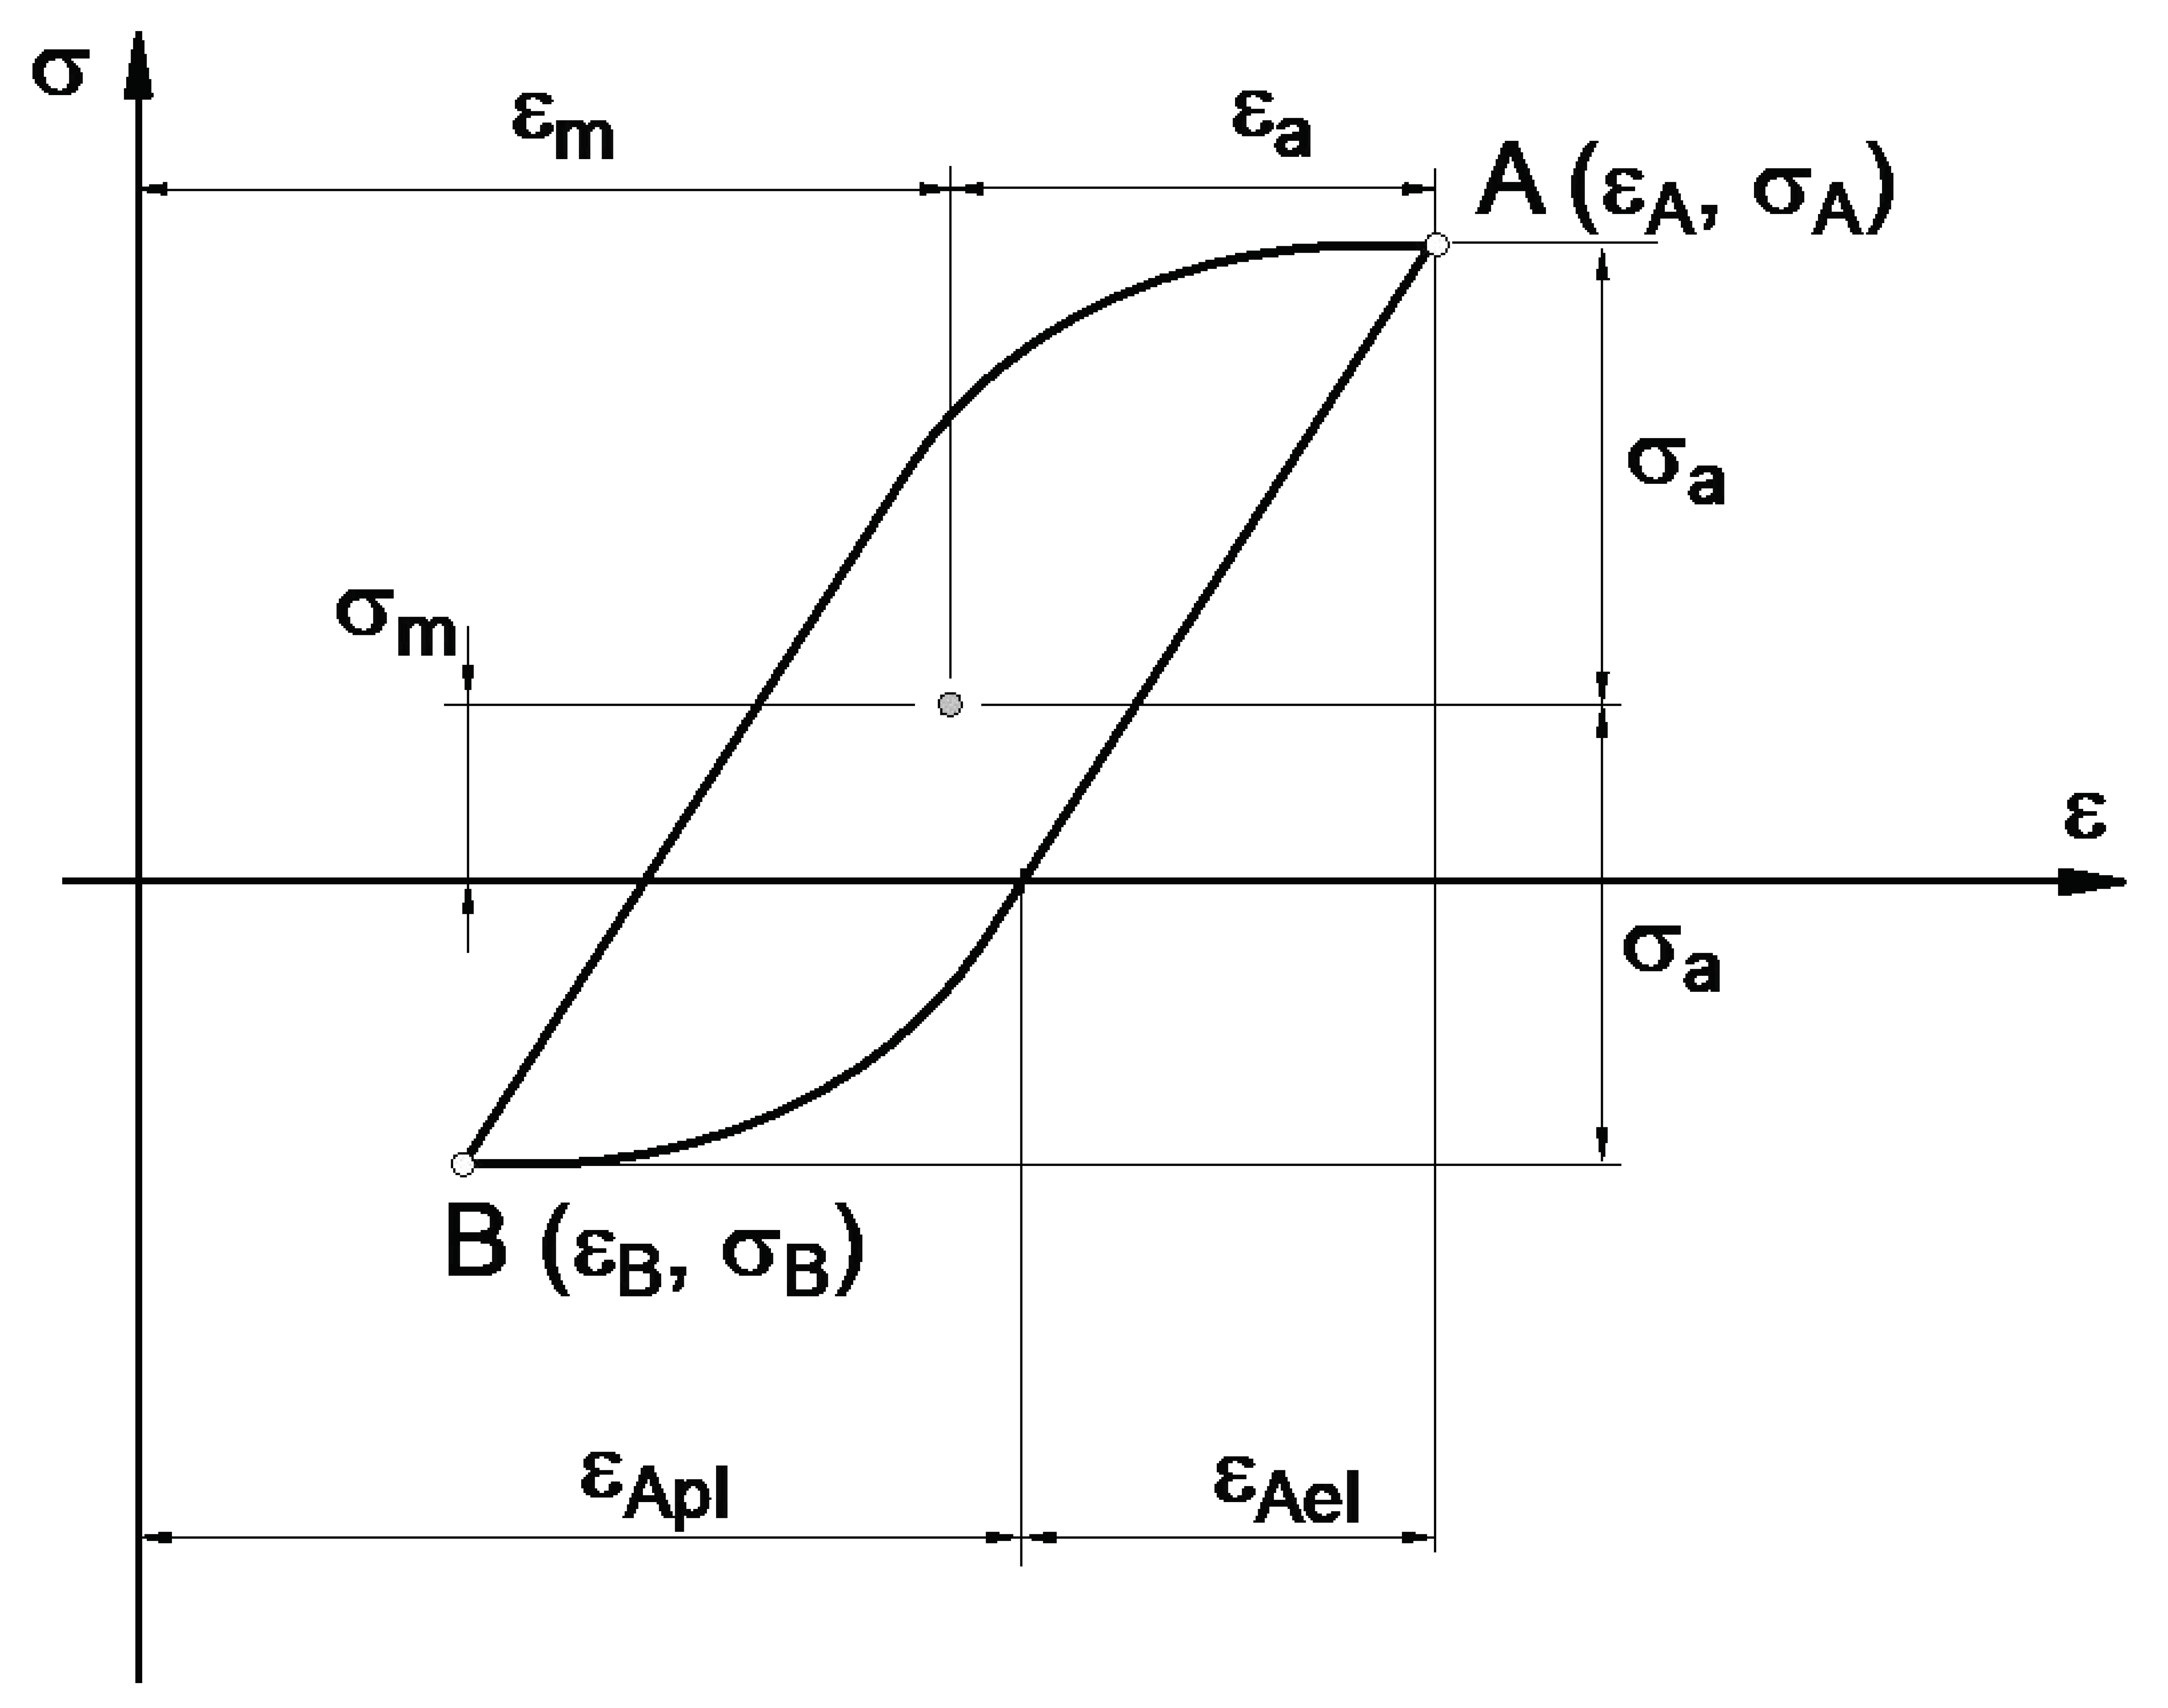
| 2. | Input data: εA, εB, εa, and εm | |
| 3. | alculation of σA for given K′ and n′ (*) | |
| (*) Values of the coefficients K′ and n′ depend on the current values of the average strain εm. However, this requires additional tests to determine the functions K′ = f (εm) and n′ = f (εm). | ||
| 4. | alculation of εApl | |
| 5. | alculation of σa for given K and n obtained for εm = 0 | |
| 6. | alculation of εapl | |
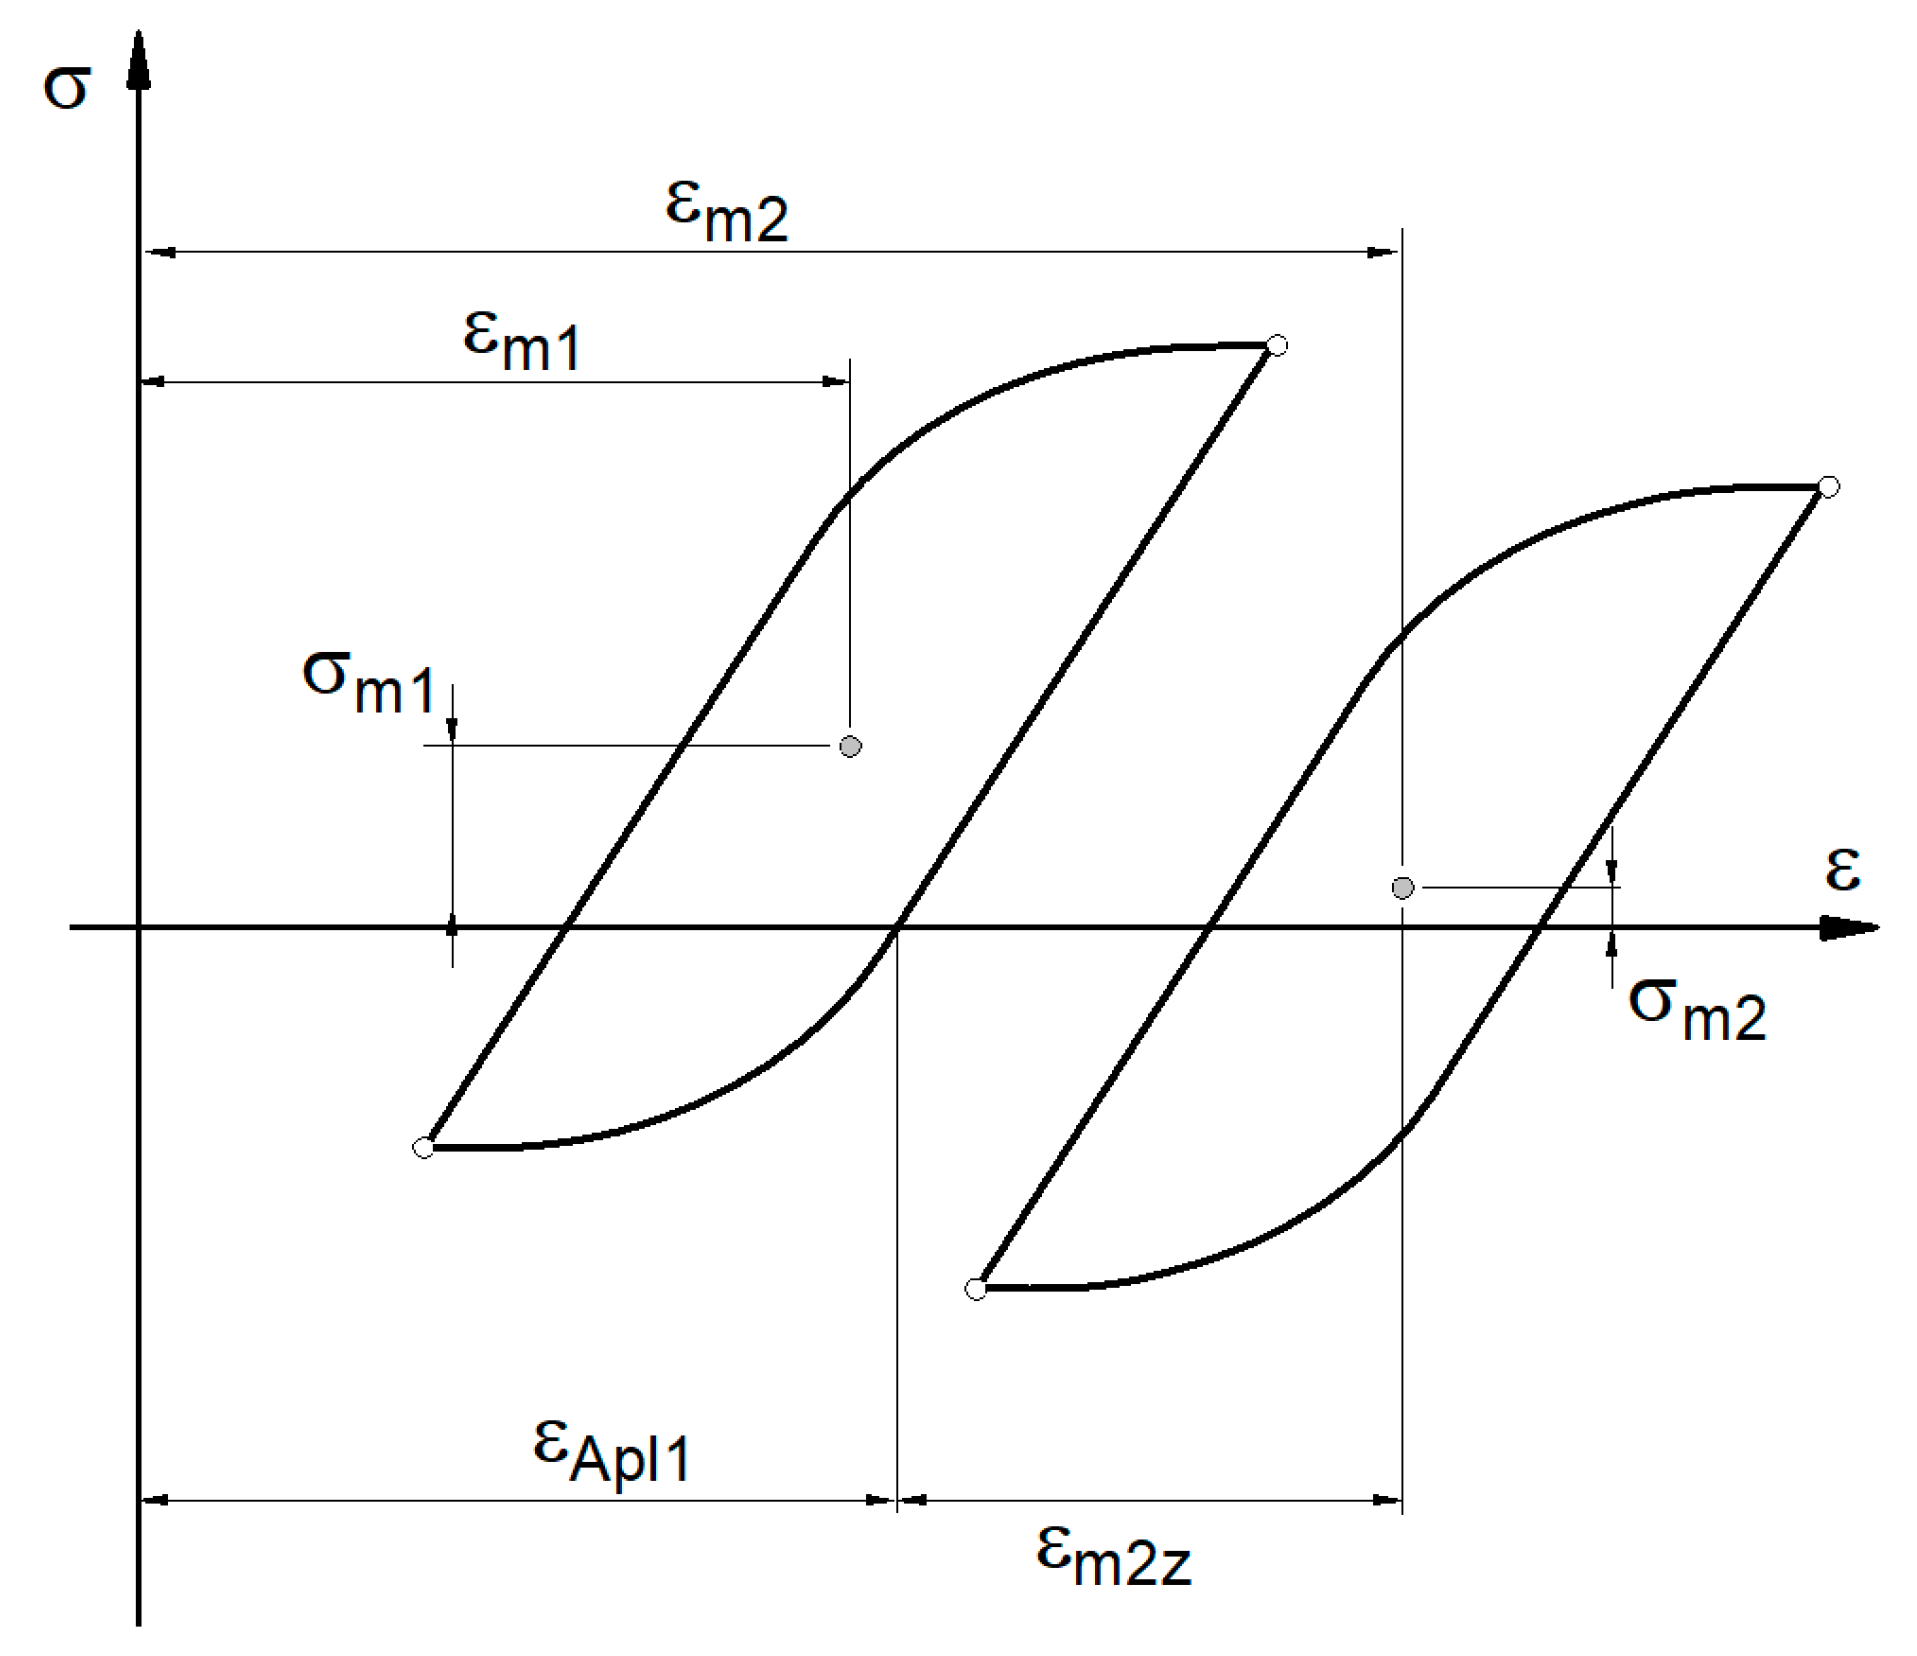
| 7. | Calculation of mean stress σm | i refers to the next load sequence |
| 8. | Resulting parameters (σa, σm) | |
| εm (%) | 0 | 0.2 | 0.4 |
| K′ (MPa) | 722.6 | 693.1 | 587.7 |
| n′ | 0.1507 | 0.1424 | 0.117 |
| εa | σa1 (MPa) | σa2 (MPa) | σm2 (MPa) | σa3 (MPa) | σm3 (MPa) | D1A | D2A | D3A | DA |
|---|---|---|---|---|---|---|---|---|---|
| 0.0020 | 246 | 249 | 3 | 253 | 7 | 0.0026 | 0.0028 | 0.0032 | 0.0086 |
| 0.0030 | 275 | 278 | 3 | 277 | 2 | 0.0109 | 0.0117 | 0.0115 | 0.0341 |
| 0.0040 | 294 | 296 | 2 | 292 | −2 | 0.0258 | 0.0270 | 0.0248 | 0.0776 |
| 0.0050 | 308 | 309 | 1 | 303 | −5 | 0.0470 | 0.0480 | 0.0426 | 0.1376 |
| 0.0060 | 319 | 320 | 1 | 312 | −7 | 0.0739 | 0.0753 | 0.0650 | 0.2142 |
| εa | σa1 (MPa) | σa2 (MPa) | σm2 (MPa) | σa3 (MPa) | σm3 (MPa) | D1B | D2B | D3B | DB |
|---|---|---|---|---|---|---|---|---|---|
| 0.0020 | 246 | 246 | 0 | 246 | 0 | 0.0026 | 0.0026 | 0.0026 | 0.0078 |
| 0.0030 | 275 | 275 | 0 | 275 | 0 | 0.0109 | 0.0109 | 0.0109 | 0.0328 |
| 0.0040 | 294 | 294 | 0 | 294 | 0 | 0.0258 | 0.0258 | 0.0258 | 0.0775 |
| 0.0050 | 308 | 308 | 0 | 308 | 0 | 0.0470 | 0.0470 | 0.0470 | 0.1411 |
| 0.0060 | 319 | 319 | 0 | 319 | 0 | 0.0739 | 0.0739 | 0.0739 | 0.2218 |
Publisher’s Note: MDPI stays neutral with regard to jurisdictional claims in published maps and institutional affiliations. |
© 2021 by the authors. Licensee MDPI, Basel, Switzerland. This article is an open access article distributed under the terms and conditions of the Creative Commons Attribution (CC BY) license (https://creativecommons.org/licenses/by/4.0/).
Share and Cite
Pawliczek, R.; Lagoda, T. Investigation of Changes in Fatigue Damage Caused by Mean Load under Block Loading Conditions. Materials 2021, 14, 2738. https://doi.org/10.3390/ma14112738
Pawliczek R, Lagoda T. Investigation of Changes in Fatigue Damage Caused by Mean Load under Block Loading Conditions. Materials. 2021; 14(11):2738. https://doi.org/10.3390/ma14112738
Chicago/Turabian StylePawliczek, Roland, and Tadeusz Lagoda. 2021. "Investigation of Changes in Fatigue Damage Caused by Mean Load under Block Loading Conditions" Materials 14, no. 11: 2738. https://doi.org/10.3390/ma14112738
APA StylePawliczek, R., & Lagoda, T. (2021). Investigation of Changes in Fatigue Damage Caused by Mean Load under Block Loading Conditions. Materials, 14(11), 2738. https://doi.org/10.3390/ma14112738