Experimental and Numerical Study of Fracture Behavior of Rock-Like Material Specimens with Single Pre-Set Joint under Dynamic Loading


Abstract
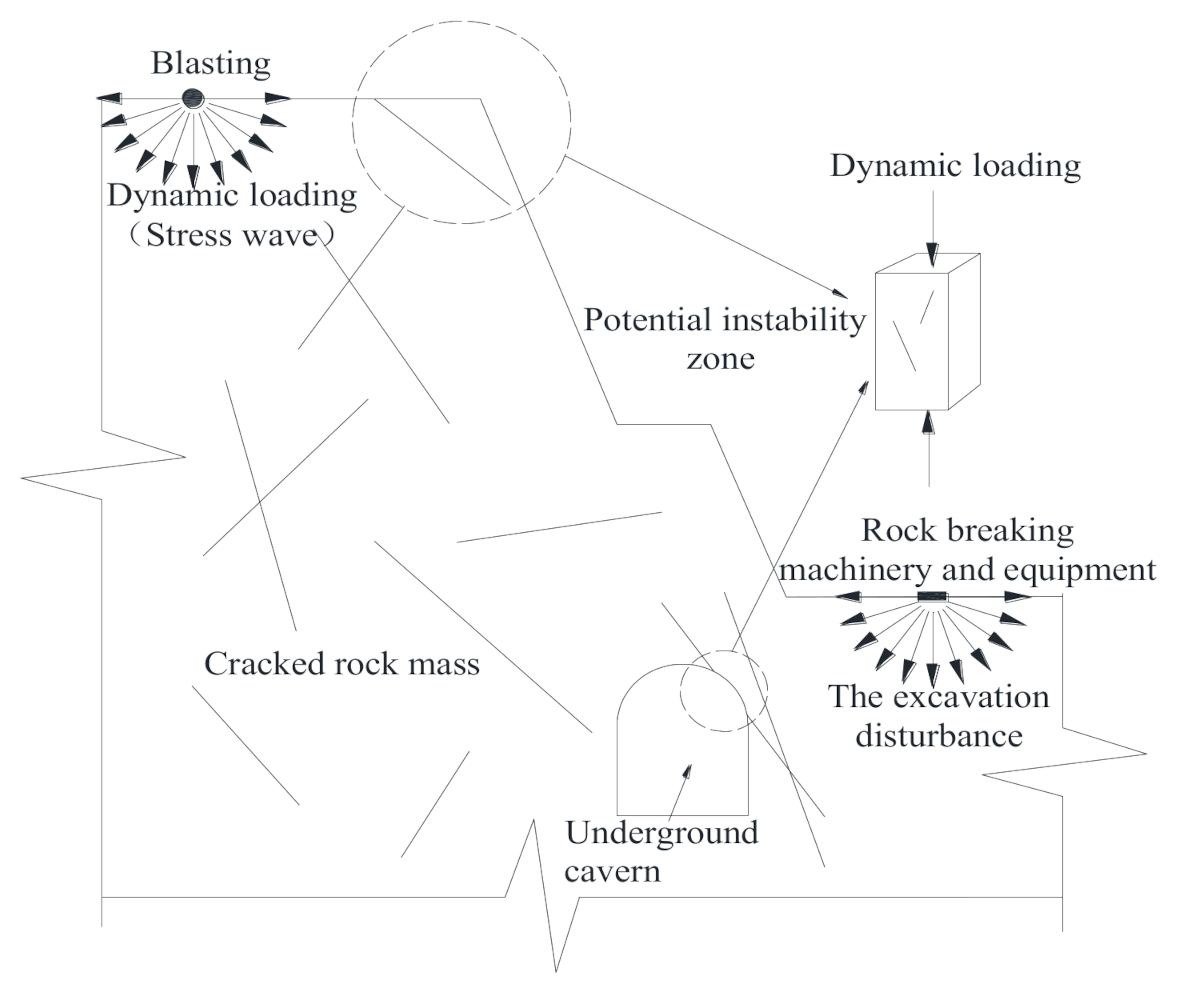
1. Introduction
2. Materials and Methods
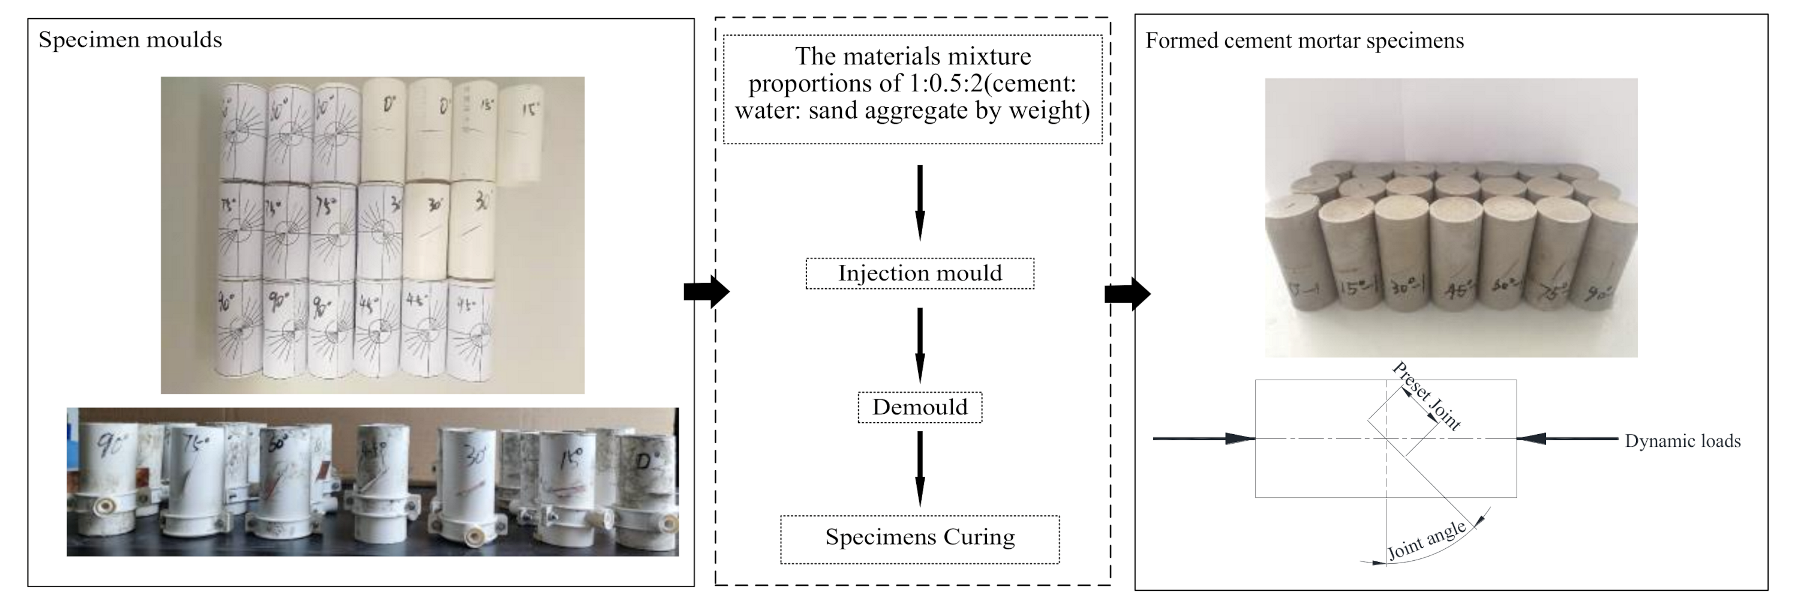
2.1. Specimen Preparation
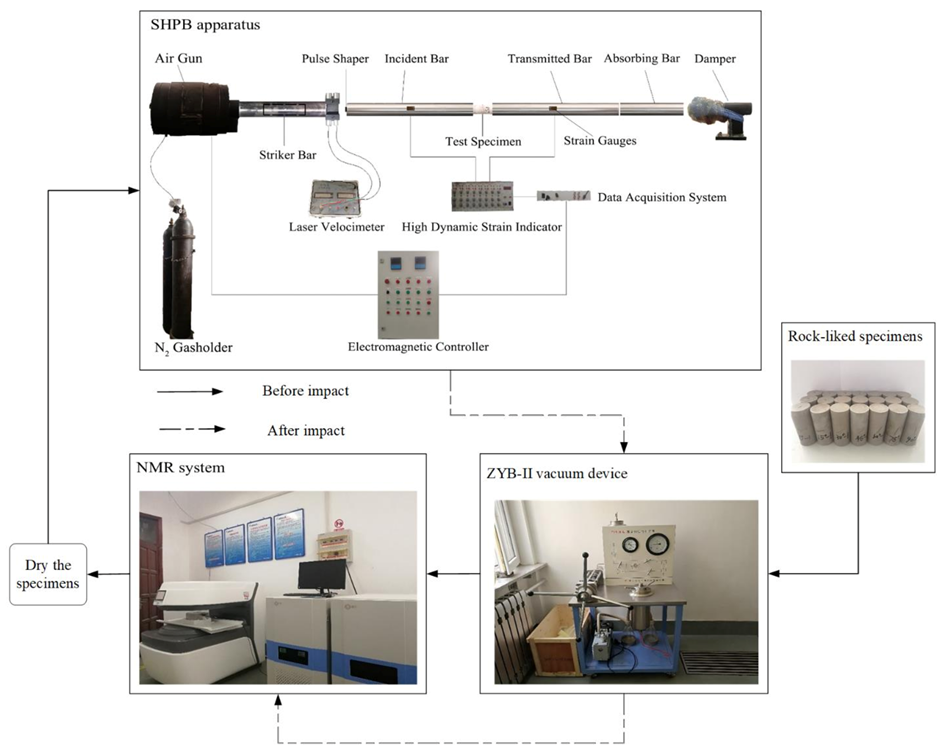
2.2. Test Program
3. Results and Discussion
3.1. Influence of Joint Angle on Energy Dissipation
3.1.1. Energy Density per Unit Time
3.1.2. Analysis of Energy Dissipation
3.1.3. Analysis of Energy Density per Unit Time
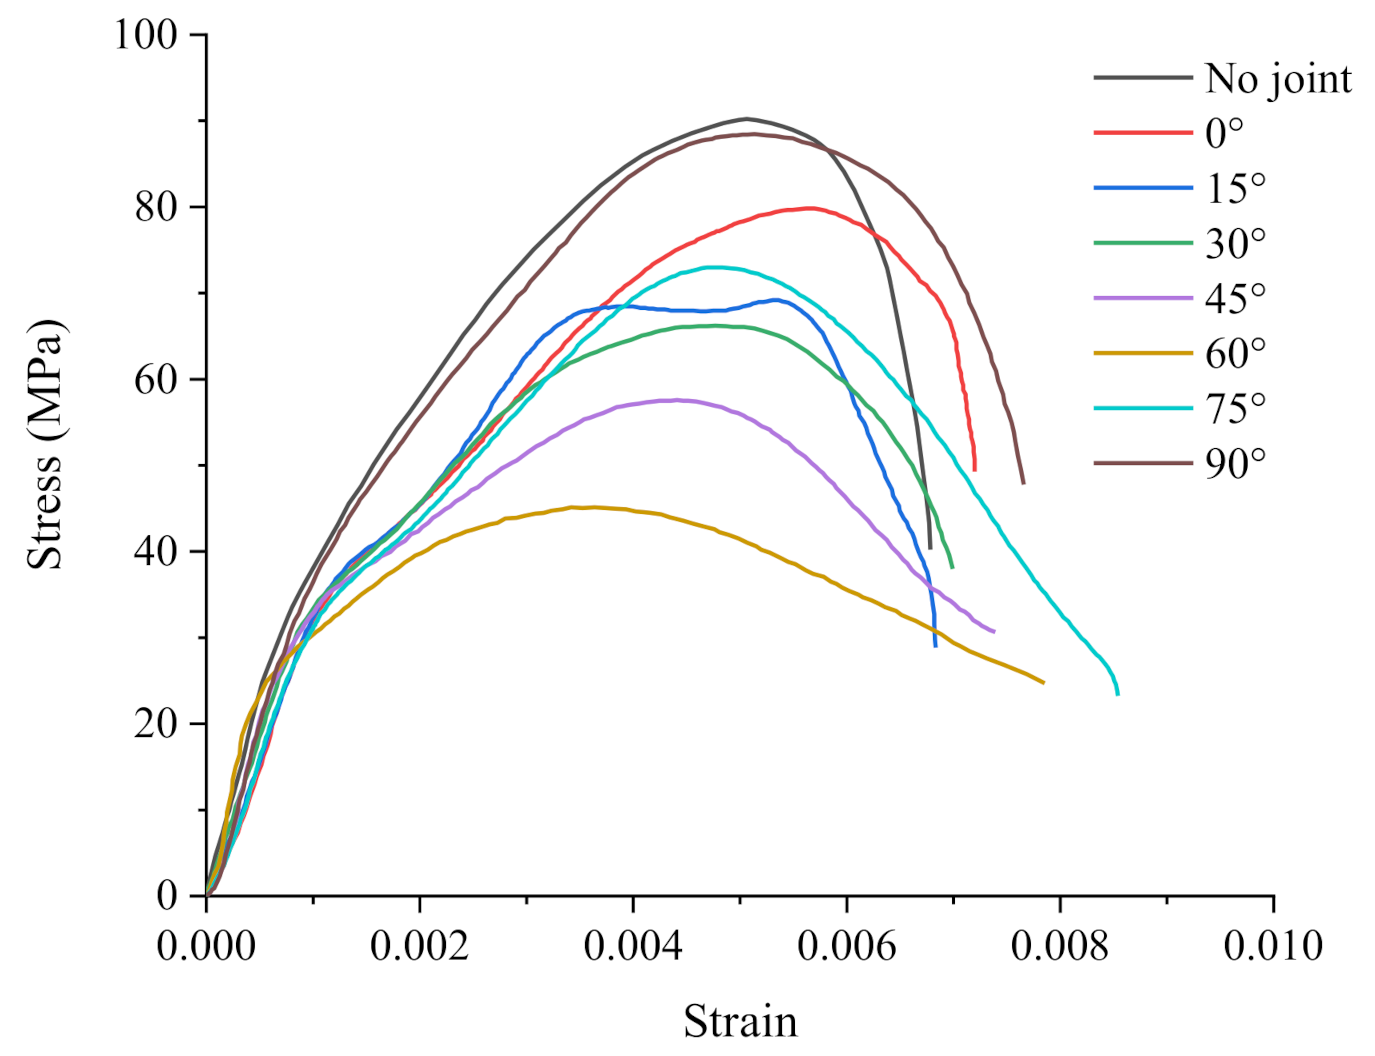
3.2. Analysis on Crack Propagation of Specimens with Different Joint Angles
3.3. Analysis of Crack Propagation Process
3.3.1. Model Selection and Parameter Determination
3.3.2. Model Establishment and Result Analysis
4. Discussion
4.1. Relationship Between Joint Angle and Crack Initiation Angle
4.2. Analysis of Dynamic Penetration Ration
4.3. Analysis of Numerical Simulation Stress and Test Stress
5. Summary and Conclusions
Author Contributions
Funding
Institutional Review Board Statement
Informed Consent Statement
Data Availability Statement
Conflicts of Interest
References
- Wong, R.H.C.; Chau, K.T. Crack coalescence in a rock-like material containing two cracks. Int. J. Rock Mech. Min. Sci. 1998, 38, 147–164. [Google Scholar] [CrossRef]
- Cai, M.; Kaiser, P.K.; Tasaka, Y.; Maejima, T.; Minami, M. Generalized crack initiation and crack damage stress thresholds of brittle rock masses near underground excavations. Int. J. Rock Mech. Min. Sci. 2004, 41, 833–847. [Google Scholar] [CrossRef]
- Chiu, C.C.; Weng, M.C.; Huang, T.H. Modeling rock joint behavior using a rough-joint model. Int. J. Rock Mech. Min. Sci. 2016, 89, 14–25. [Google Scholar] [CrossRef]
- Jaeger, J.C. Fundamentals of Rock Mechanics; Chapman and Hall: London, UK, 1976. [Google Scholar]
- Yan, Z.; Dai, F.; Liu, Y.; Du, H. Experimental investigations of the dynamic mechanical properties and fracturing behavior of cracked rocks under dynamic loading. Bull. Eng. Geol. Environ. 2020, 79, 5535–5552. [Google Scholar] [CrossRef]
- Zhang, L.M.; Lv, S.R.; Liu, H.Y. Test Study on Dynamic Mechanical Property of Jointed Rock Mass. Adv. Mater. Res. 2013, 868, 282–286. [Google Scholar] [CrossRef]
- Feng, P.; Dai, F.; Liu, Y.; Du, H.B. Mechanical behaviors of rock-like specimens with two non-coplanar fissures subjected to coupled static-dynamic loads. Eng. Fract. Mech. 2018, 199, 692–704. [Google Scholar] [CrossRef]
- Liu, H.Y.; Huang, Y.S.; Lü, S.Y.; Xing, C. A compression damage constitutive model of jointed rock mass based on deformation components. J. Cent. South Univ. 2014, 45, 2014–2020. [Google Scholar]
- Liu, H.Y.; Liu, Y.; Xing, C.F.; Zhang, L.M. Test study of damage failure of jointed rock mass under freezing-thawing cycles. Rock Soil Mech. 2014, 35, 1547–1554. [Google Scholar]
- He, Q.; Suorineni, F.T.; Ma, T.; Oh, J. Effect of discontinuity stress shadows on hydraulic fracture re-orientation. Int. J. Rock Mech. Min. Sci. 2017, 91, 179–194. [Google Scholar] [CrossRef]
- Urata, Y.; Yamashita, F.; Fukuyama, E.; Noda, H.; Mizoguchi, K. Apparent Dependence of Rate- and State-Dependent Friction Parameters on Loading Velocity and Cumulative Displacement Inferred from Large-Scale Biaxial Friction Experiments. Pure Appl. Geophys. 2017, 174, 2217–2237. [Google Scholar] [CrossRef]
- Latha, G.M.; Garaga, A. Elasto-plastic analysis of jointed rocks using discrete continuum and equivalent continuum approaches. Int. J. Rock Mech. Min. Sci. 2012, 53, 56–63. [Google Scholar] [CrossRef]
- Kim, M.K.; Kim, S.E.; Oh, K.H.; Kim, W.J. A study on the behavior of rock mass subjected to blasting using modified distinct element method. Int. J. Rock Mech. Min. Sci. 1997, 34, e1–e156. [Google Scholar] [CrossRef]
- Bahaaddini, M.; Sharrock, G.; Hebblewhite, B.K. Numerical direct shear tests to model the shear behaviour of rock joints. Comput. Geotech. 2013, 51, 101–115. [Google Scholar] [CrossRef]
- Guo, S.; Qi, S.; Zhan, Z.; Zheng, B. Plastic-strain-dependent strength model to simulate the cracking process of brittle rocks with an existing non-persistent joint. Eng. Geol. 2017, 231, 114–125. [Google Scholar] [CrossRef]
- Zhao, W.; Huang, R.; Yan, M. Study on the deformation and failure modes of rock mass containing concentrated parallel joints with different spacing and number based on smooth joint model in PFC. Arab. J. Geosci. 2015, 8, 7887–7897. [Google Scholar] [CrossRef]
- Sarfarazi, V.; Haeri, H.; Marji, M.F. Fracture Mechanism of Brazilian Discs with Multiple Parallel Notches Using PFC2D. Period. Polytech. Civ. Eng. 2017, 61. [Google Scholar] [CrossRef]
- Qiu, H.; Zhu, Z.; Wang, F.; Wang, M.; Zhou, C.; Luo, C.; Wang, X.; Mao, H. Dynamic behavior of a running crack crossing mortar-rock interface under impacting load. Eng. Fract. Mech. 2020, 240, 107202. [Google Scholar] [CrossRef]
- Wang, D.H.; Zhang, H.Y.; Zhang, W. Numerical Simulation of SHPB Experimental Process Based on ANSYS Software. Int. J. Mech. Res. 2019, 8, 39–46. [Google Scholar] [CrossRef]
- Li, B.; Lan, J.; Si, G.; Lin, G.; Hu, L. NMR-based damage characterisation of backfill material in host rock under dynamic loading. Int. J. Min. Sci. Technol. 2020, 30, 329–335. [Google Scholar] [CrossRef]
- Yang, Z.; Fan, C.; Lan, T.; Li, S.; Wang, G.; Luo, M.; Zhang, H. Dynamic Mechanical and Microstructural Properties of Outburst-Prone Coal Based on Compressive SHPB Tests. Energies 2019, 12, 4236. [Google Scholar] [CrossRef]
- Weng, L.; Wu, Z.; Li, X. Mesodamage Characteristics of Rock with a Pre-cut Opening Under Combined Static—Dynamic Loads: A Nuclear Magnetic Resonance (NMR) Investigation. Rock Mech. Rock Eng. 2018, 51, 2339–2354. [Google Scholar] [CrossRef]
- Gray, G.T. Classic split-Hopkinson pressure bar testing. In ASM Handbook; Mechanical Testing and Evaluation; ASM International: Detroit, MI, USA, 2000; Volume 8, pp. 1027–1067. [Google Scholar]
- Li, X. Rock Dynamics: Fundamentals and Applications; Science Press: Beijing, China, 2014; pp. 258–287. [Google Scholar]
- Wang, M.; Wang, H.; Zong, Q. Experimental study on energy dissipation of mudstone in coal mine under impact loading. J. China Coal Soc. 2019, 44, 1716–1725. [Google Scholar]
- Li, Y.X.; Liu, J.F.; Qin, L. Experimental Study on Rule of Energy Dissipation of Stress Wave across Rock Joint. J. Exp. Mech. 2011, 26, 85–90. [Google Scholar]
- Ju, Y.; Li, Y.X.; Xie, H.P.; Song, Z.D.; Tian, L.L. Stress wave propagation and energy dissipation in jointed rocks. Chin. J. Rock Mech. Eng. 2006, 25, 2426–2434. [Google Scholar]
- Antonio, B. The initiation of secondary cracks in compression. Eng. Fract. Mech. 2000, 66, 187–219. [Google Scholar]
- Polanco-Loria, M.; Hopperstad, O.S.; Borvik, T.; Nerstad, T. Numerical predictions of ballistic limits for concrete slabs using a modified version of the HJC concrete model. Int. J. Impact Eng. 2008, 35, 290–303. [Google Scholar] [CrossRef]
- Rong, Z.D.; Sun, W. Experimental and numerical investigation on the dynamic tensile behavior of ultra-high performance cement based composites. Constr. Build. Mater. 2012, 31, 168–173. [Google Scholar] [CrossRef]
- Kong, X.Z.; Fang, Q.; Wu, H.; Peng, Y. Numerical predictions of cratering and scabbing in concrete slabs subjected to projectile impact using a modified version of HJC material model. Int. J. Impact Eng. 2016, 95, 61–71. [Google Scholar] [CrossRef]
- Zhou, Q.; Qi, L. Analysis and comparison of 5 different common anti-explosion concrete material models of LS-DYNA software. Concrete 2019, 11, 43–49. [Google Scholar]
- Fang, Q.; Kong, X.Z.; Wu, H.; Gong, Z.M. Determination of Holmquist-Johnson-Cook Constitutive Model Parameters of Rock. Eng. Mech. 2014, 31, 197–204. [Google Scholar]
- Zhang, S.R.; Song, R.; Wang, C.; Shang, C.; Wei, P. Modification of a dynamic constitutive model-HJC model for roller-compacted concrete and numerical verification. J. Vib. Shock 2019, 38, 25–31. [Google Scholar]
- Wang, C.; Song, R.; Wang, G.; Zhang, S. Modifications of the HJC (Holmquist–Johnson–Cook) Model for an Improved Numerical Simulation of Roller Compacted Concrete (RCC) Structures Subjected to Impact Loadings. Materials 2020, 13, 1361. [Google Scholar] [CrossRef]
- Haeri, H.; Hedayat, A.; Sarfarazi, V.; Hedayat, A. A review paper about experimental investigations on failure behaviour of non-persistent joint. Geomech. Eng. 2017, 13, 535–570. [Google Scholar]
- Imani, M.; Nejati, H.R.; Goshtasbi, K. Dynamic response and failure mechanism of Brazilian disk specimens at high strain rate. Soil Dyn. Earthq. Eng. 2017, 100, 261–269. [Google Scholar] [CrossRef]


| No. | Density (Kg·m−3) | Compressive Strength (MPa) | Elastic Modulus (GPa) | Poisson’s Ratio | ||||
|---|---|---|---|---|---|---|---|---|
| Actual | Average | Actual | Average | Actual | Average | Actual | Average | |
| B-1 | 2112.65 | 2140.11 | 30.59 | 31.65 | 23.89 | 24.36 | 0.31 | 0.30 |
| B-2 | 2166.12 | 28.78 | 22.84 | 0.33 | ||||
| B-3 | 2141.56 | 35.58 | 26.34 | 0.27 | ||||
| Test Type | Group | Joint Angle | Impact Pressure (MPa) | Quantity (nos.) |
|---|---|---|---|---|
| Static test | B | No joint | — | 3 |
| Impact pressure determination | A | No joint | 0.09 0.11 0.13 | 3 |
| Impact test without joint | C | No joint | 0.11 | 3 |
| Impact test with joint angle difference | 0° | 0° | 0.11 | 3 |
| 15° | 15° | 0.11 | 3 | |
| 30° | 30° | 0.11 | 3 | |
| 45° | 45° | 0.11 | 3 | |
| 60° | 60° | 0.11 | 3 | |
| 75° | 75° | 0.11 | 3 | |
| 90° | 90° | 0.11 | 3 |
| Serial Number | Dissipated Energy ED (J) | Specimen Volume VS (cm3) | Reflected Wave Time TR (µs) |
|---|---|---|---|
| 0°-1 | 19.26 | 165.92 | 364.1 |
| 0°-2 | 18.45 | 167.61 | 339.3 |
| 0°-3 | 21.25 | 166.93 | 372.9 |
| 15°-1 | 21.11 | 165.10 | 367.6 |
| 15°-2 | 24.42 | 165.65 | 339.3 |
| 15°-3 | 22.13 | 164.57 | 341.1 |
| 30°-1 | 22.37 | 166.36 | 364.1 |
| 30°-2 | 25.60 | 168.73 | 307.5 |
| 30°-3 | 21.47 | 167.36 | 312.8 |
| 45°-1 | — | — | — |
| 45°-2 | 34.66 | 167.30 | 341.1 |
| 45°-3 | 26.44 | 166.28 | 307.5 |
| 60°-1 | 25.88 | 166.26 | 307.5 |
| 60°-2 | 30.97 | 163.62 | 341.1 |
| 60°-3 | 28.11 | 163.68 | 319.9 |
| 75°-1 | 20.47 | 165.94 | 293.4 |
| 75°-2 | 28.77 | 167.87 | 293.4 |
| 75°-3 | 20.76 | 167.49 | 339.3 |
| 90°-1 | 25.46 | 167.68 | 372.9 |
| 90°-2 | 28.70 | 164.49 | 323.4 |
| 90°-3 | 20.34 | 169.49 | 401.2 |
| E (GPa) | G(GPa) | T (MPa) | μc | μl |
|---|---|---|---|---|
| 24.36 | 9.37 | 3.488 | 0.000345 | 0.07985 |
Publisher’s Note: MDPI stays neutral with regard to jurisdictional claims in published maps and institutional affiliations. |
© 2021 by the authors. Licensee MDPI, Basel, Switzerland. This article is an open access article distributed under the terms and conditions of the Creative Commons Attribution (CC BY) license (https://creativecommons.org/licenses/by/4.0/).
Share and Cite
Pan, B.; Wang, X.; Xu, Z.; Guo, L.; Wang, X. Experimental and Numerical Study of Fracture Behavior of Rock-Like Material Specimens with Single Pre-Set Joint under Dynamic Loading. Materials 2021, 14, 2690. https://doi.org/10.3390/ma14102690
Pan B, Wang X, Xu Z, Guo L, Wang X. Experimental and Numerical Study of Fracture Behavior of Rock-Like Material Specimens with Single Pre-Set Joint under Dynamic Loading. Materials. 2021; 14(10):2690. https://doi.org/10.3390/ma14102690
Chicago/Turabian StylePan, Bo, Xuguang Wang, Zhenyang Xu, Lianjun Guo, and Xuesong Wang. 2021. "Experimental and Numerical Study of Fracture Behavior of Rock-Like Material Specimens with Single Pre-Set Joint under Dynamic Loading" Materials 14, no. 10: 2690. https://doi.org/10.3390/ma14102690
APA StylePan, B., Wang, X., Xu, Z., Guo, L., & Wang, X. (2021). Experimental and Numerical Study of Fracture Behavior of Rock-Like Material Specimens with Single Pre-Set Joint under Dynamic Loading. Materials, 14(10), 2690. https://doi.org/10.3390/ma14102690