
Crack Propagation Analysis of Compression Loaded Rolling Elements

 , , , , and
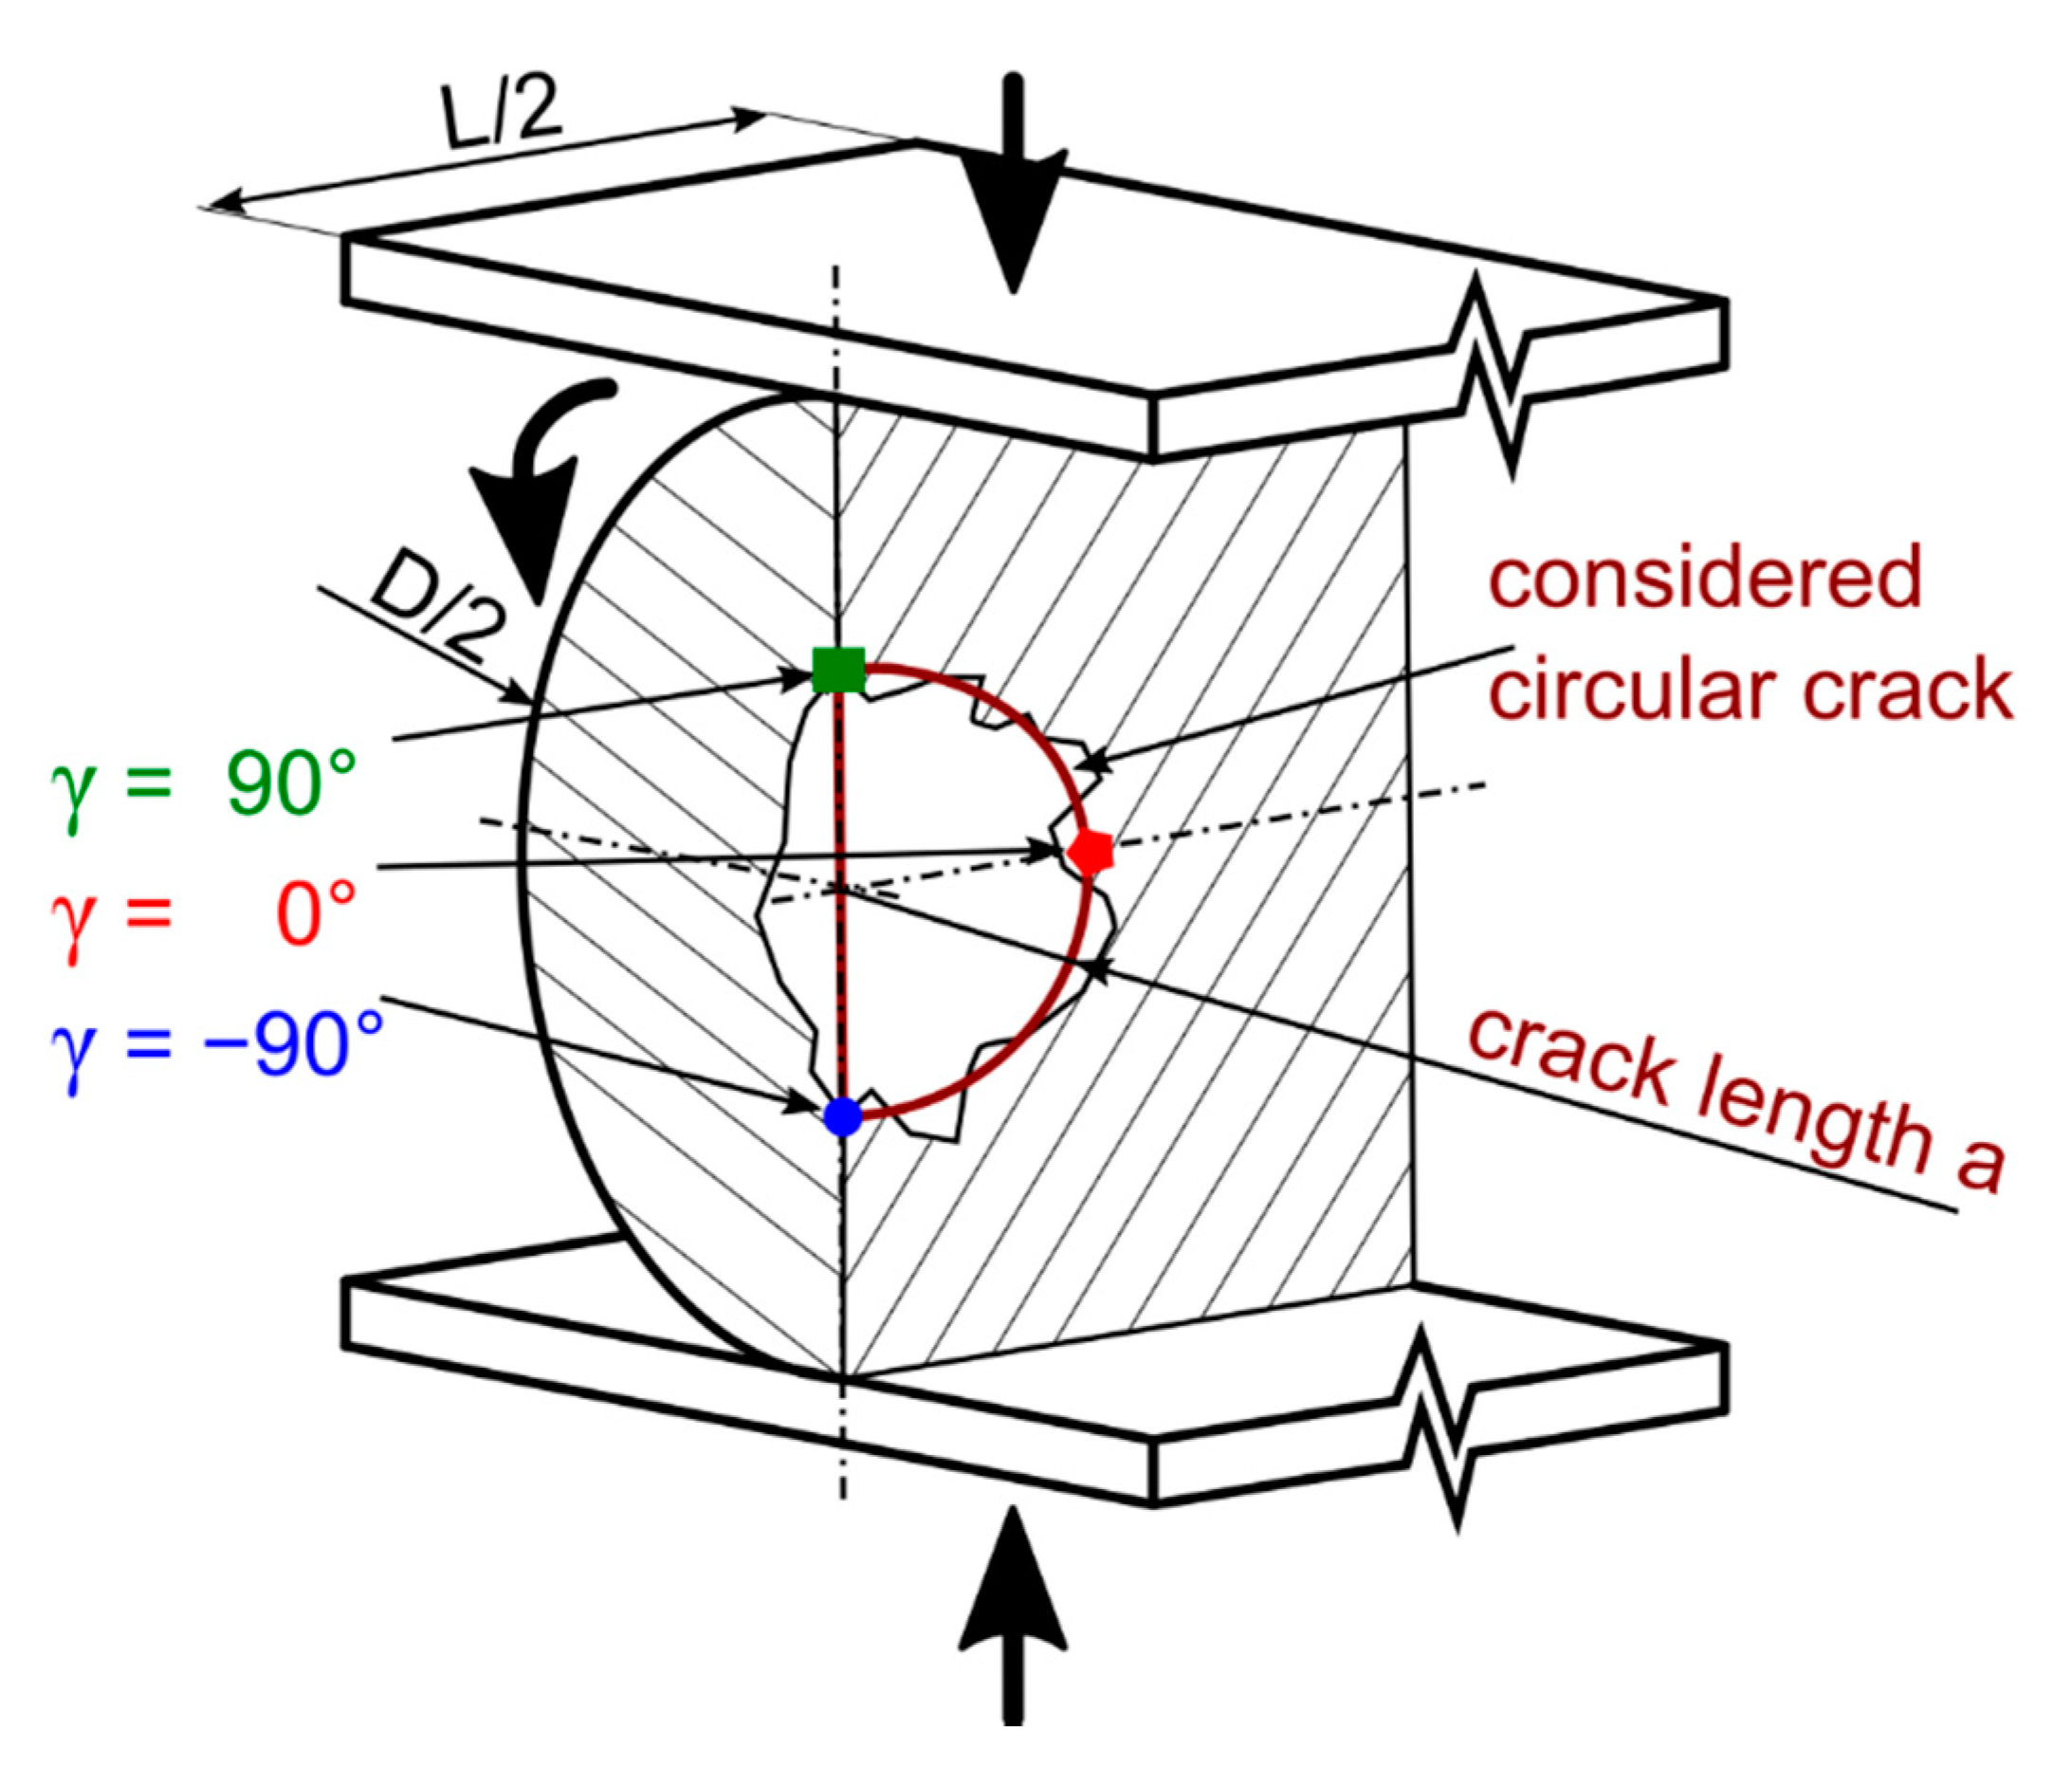
Abstract
1. Introduction
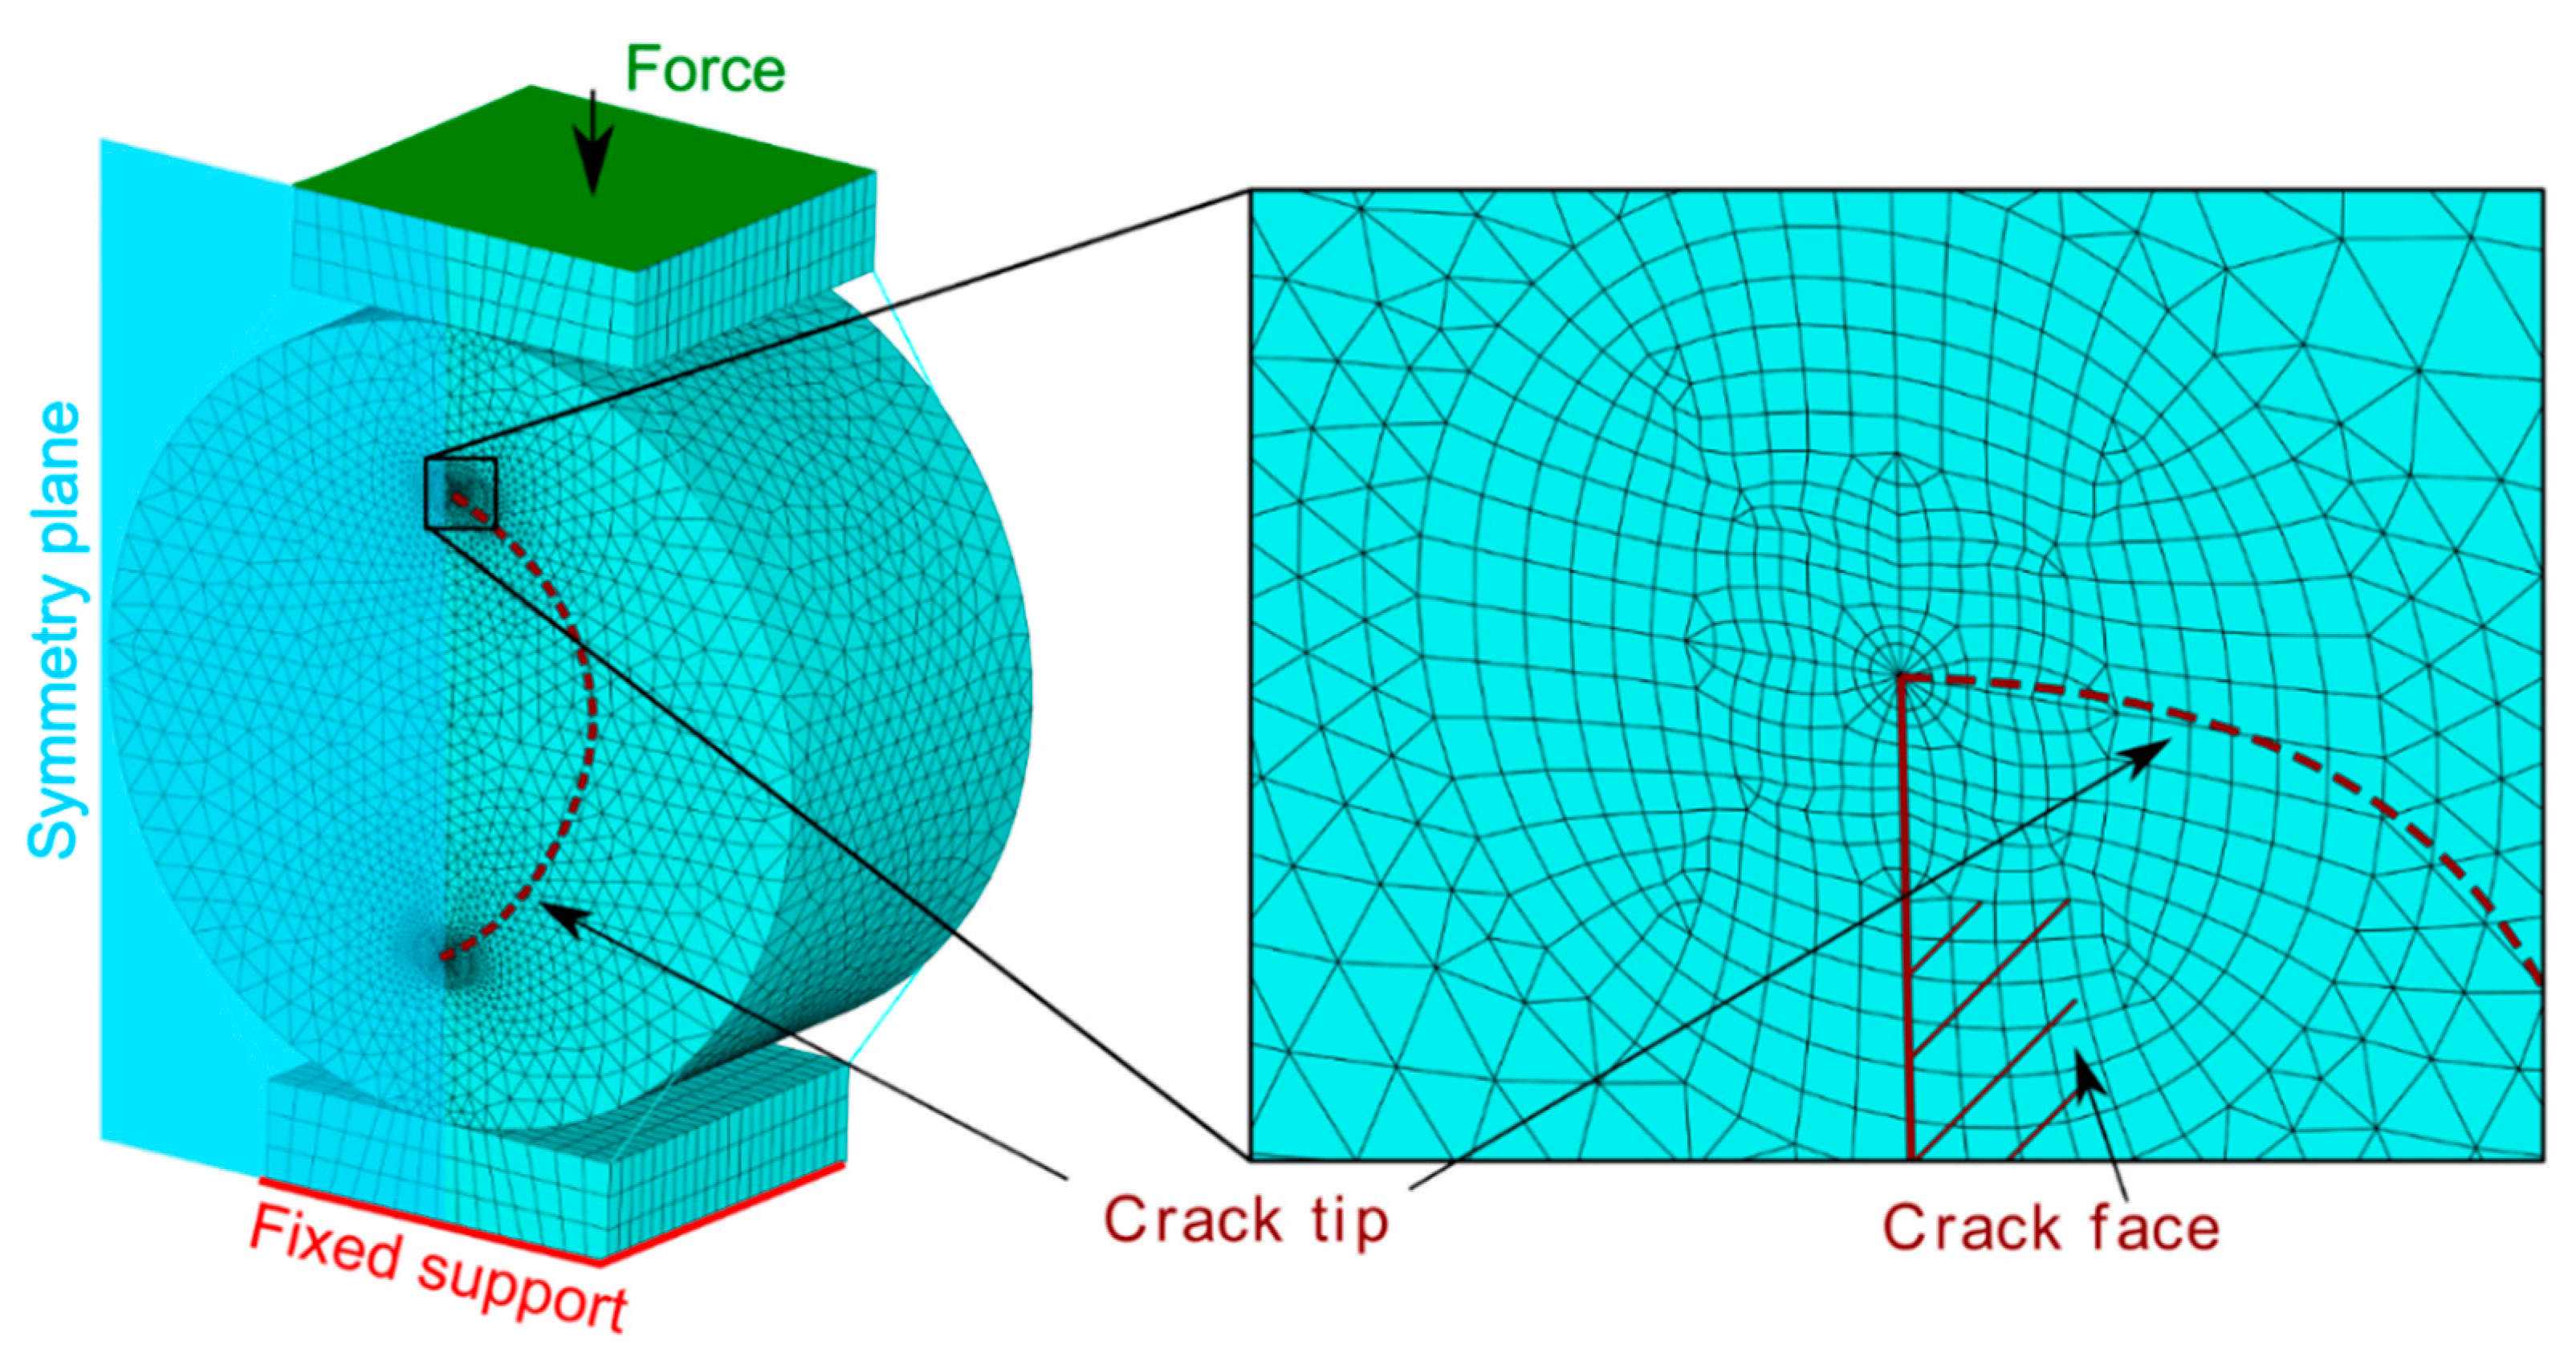
2. Numerical Models
- Basic model with a flat crack—model of a cylinder compressed between two steel plates, that contains one circular flat crack in the middle. Although the faces of the crack can come in contact, no friction is considered between the faces. Different combinations of dimensions were considered.
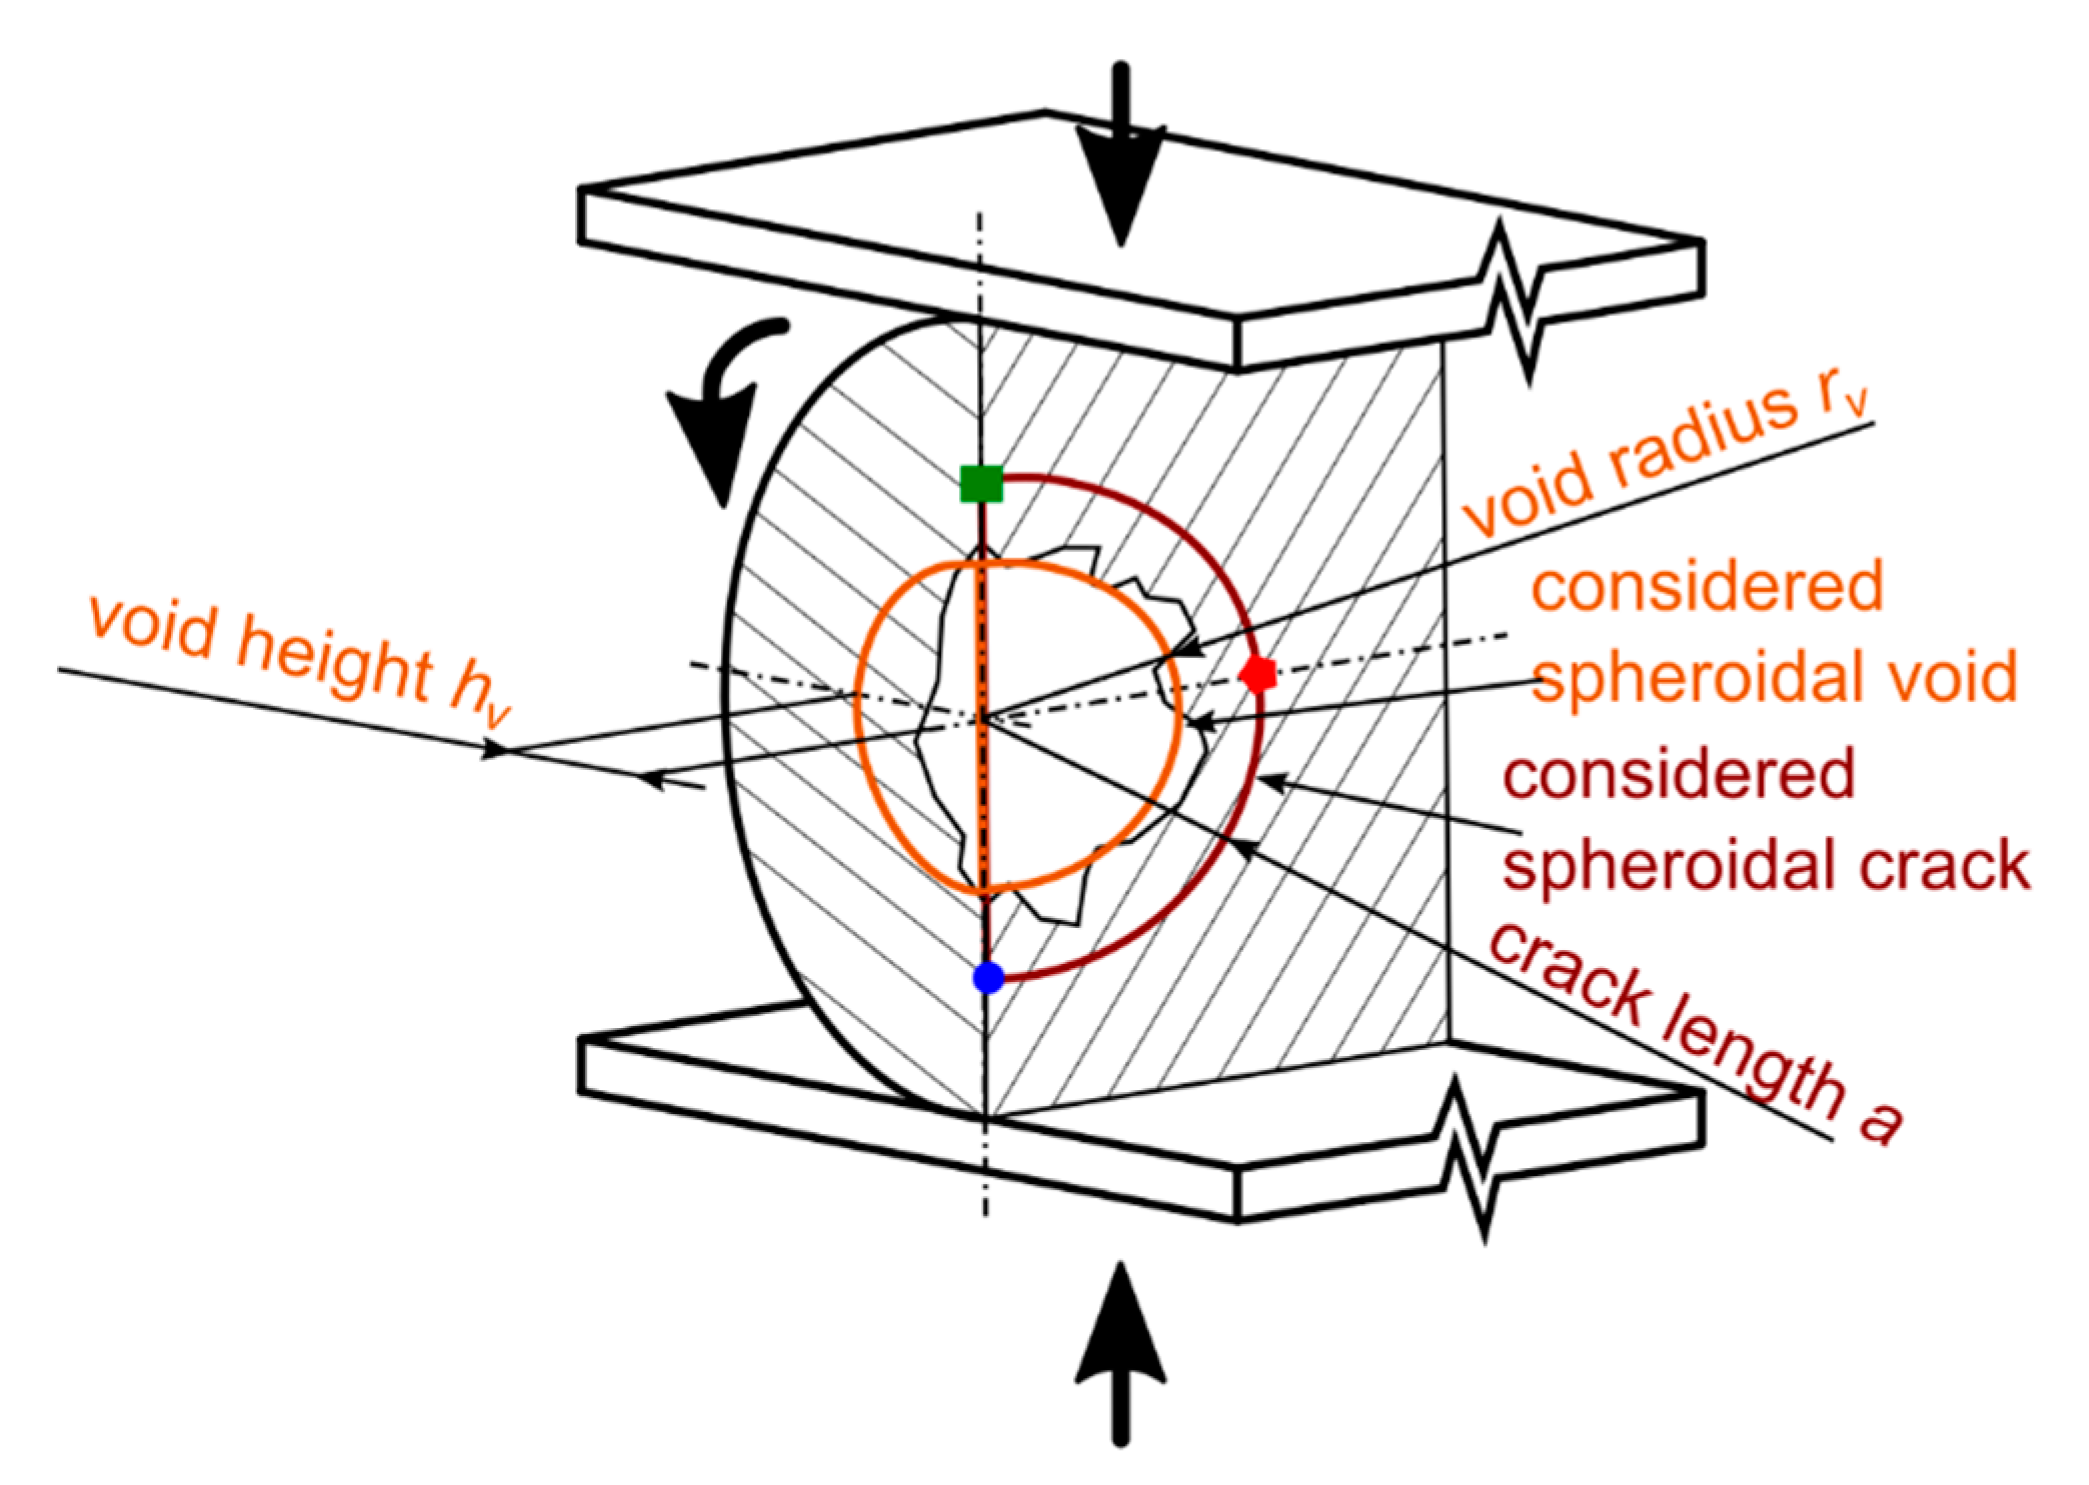
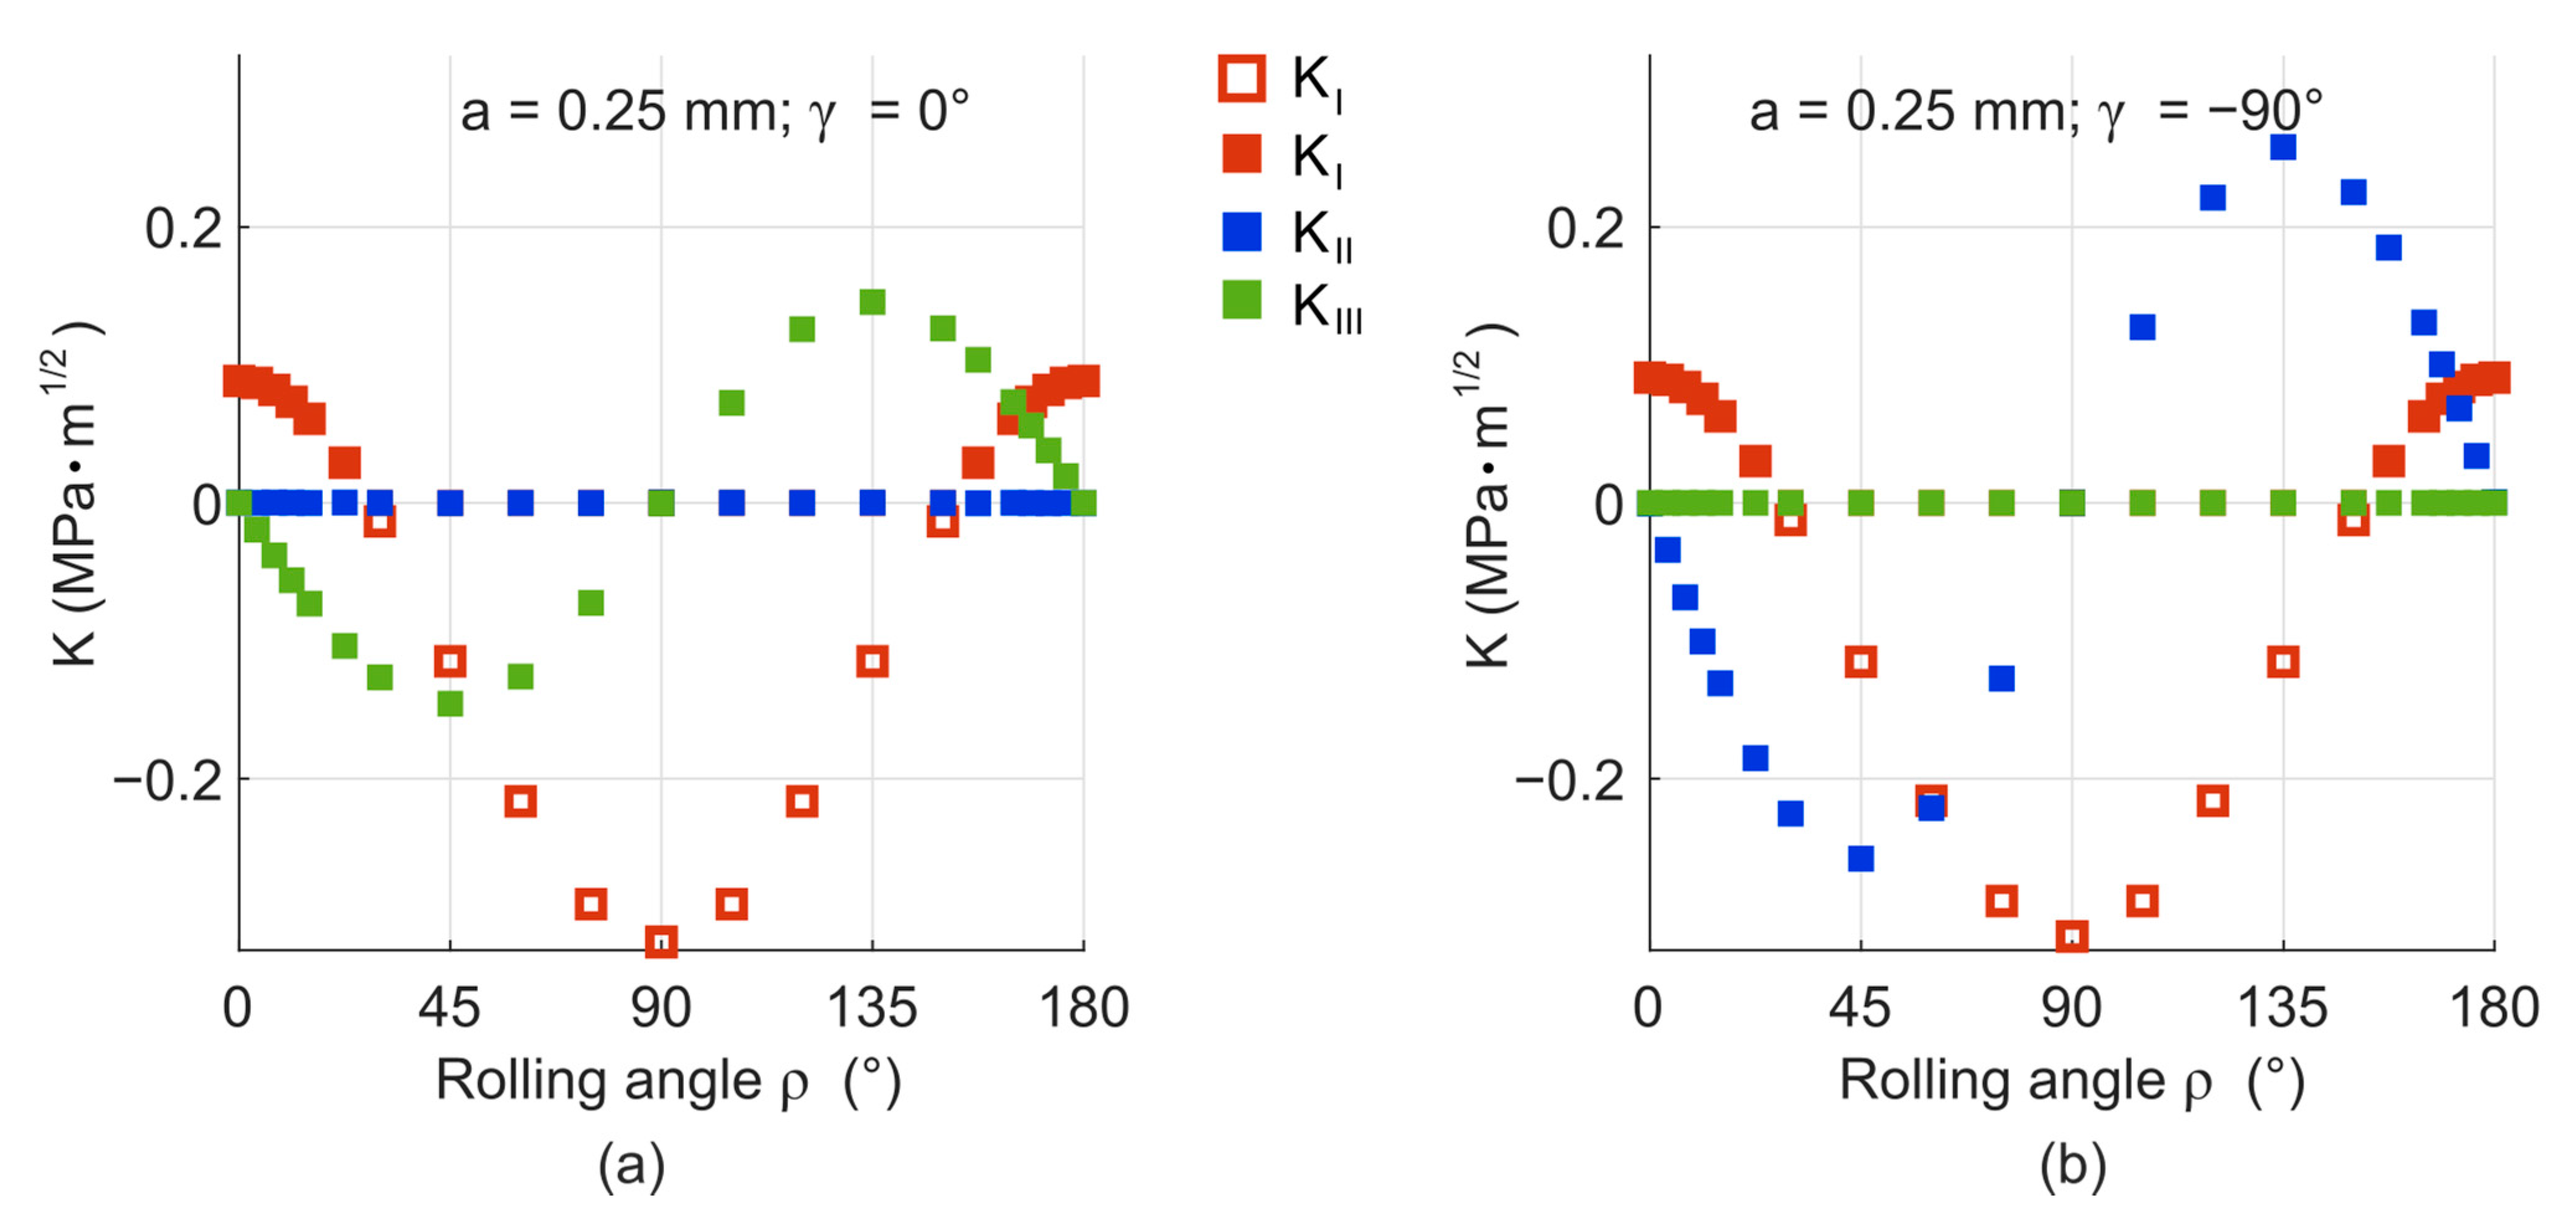
- Model with a void—the crack in this model is not flat from the start, but it starts from a three-dimensional void in the middle of the cylinder. Although it starts from the void, the crack is still considered flat and circular.
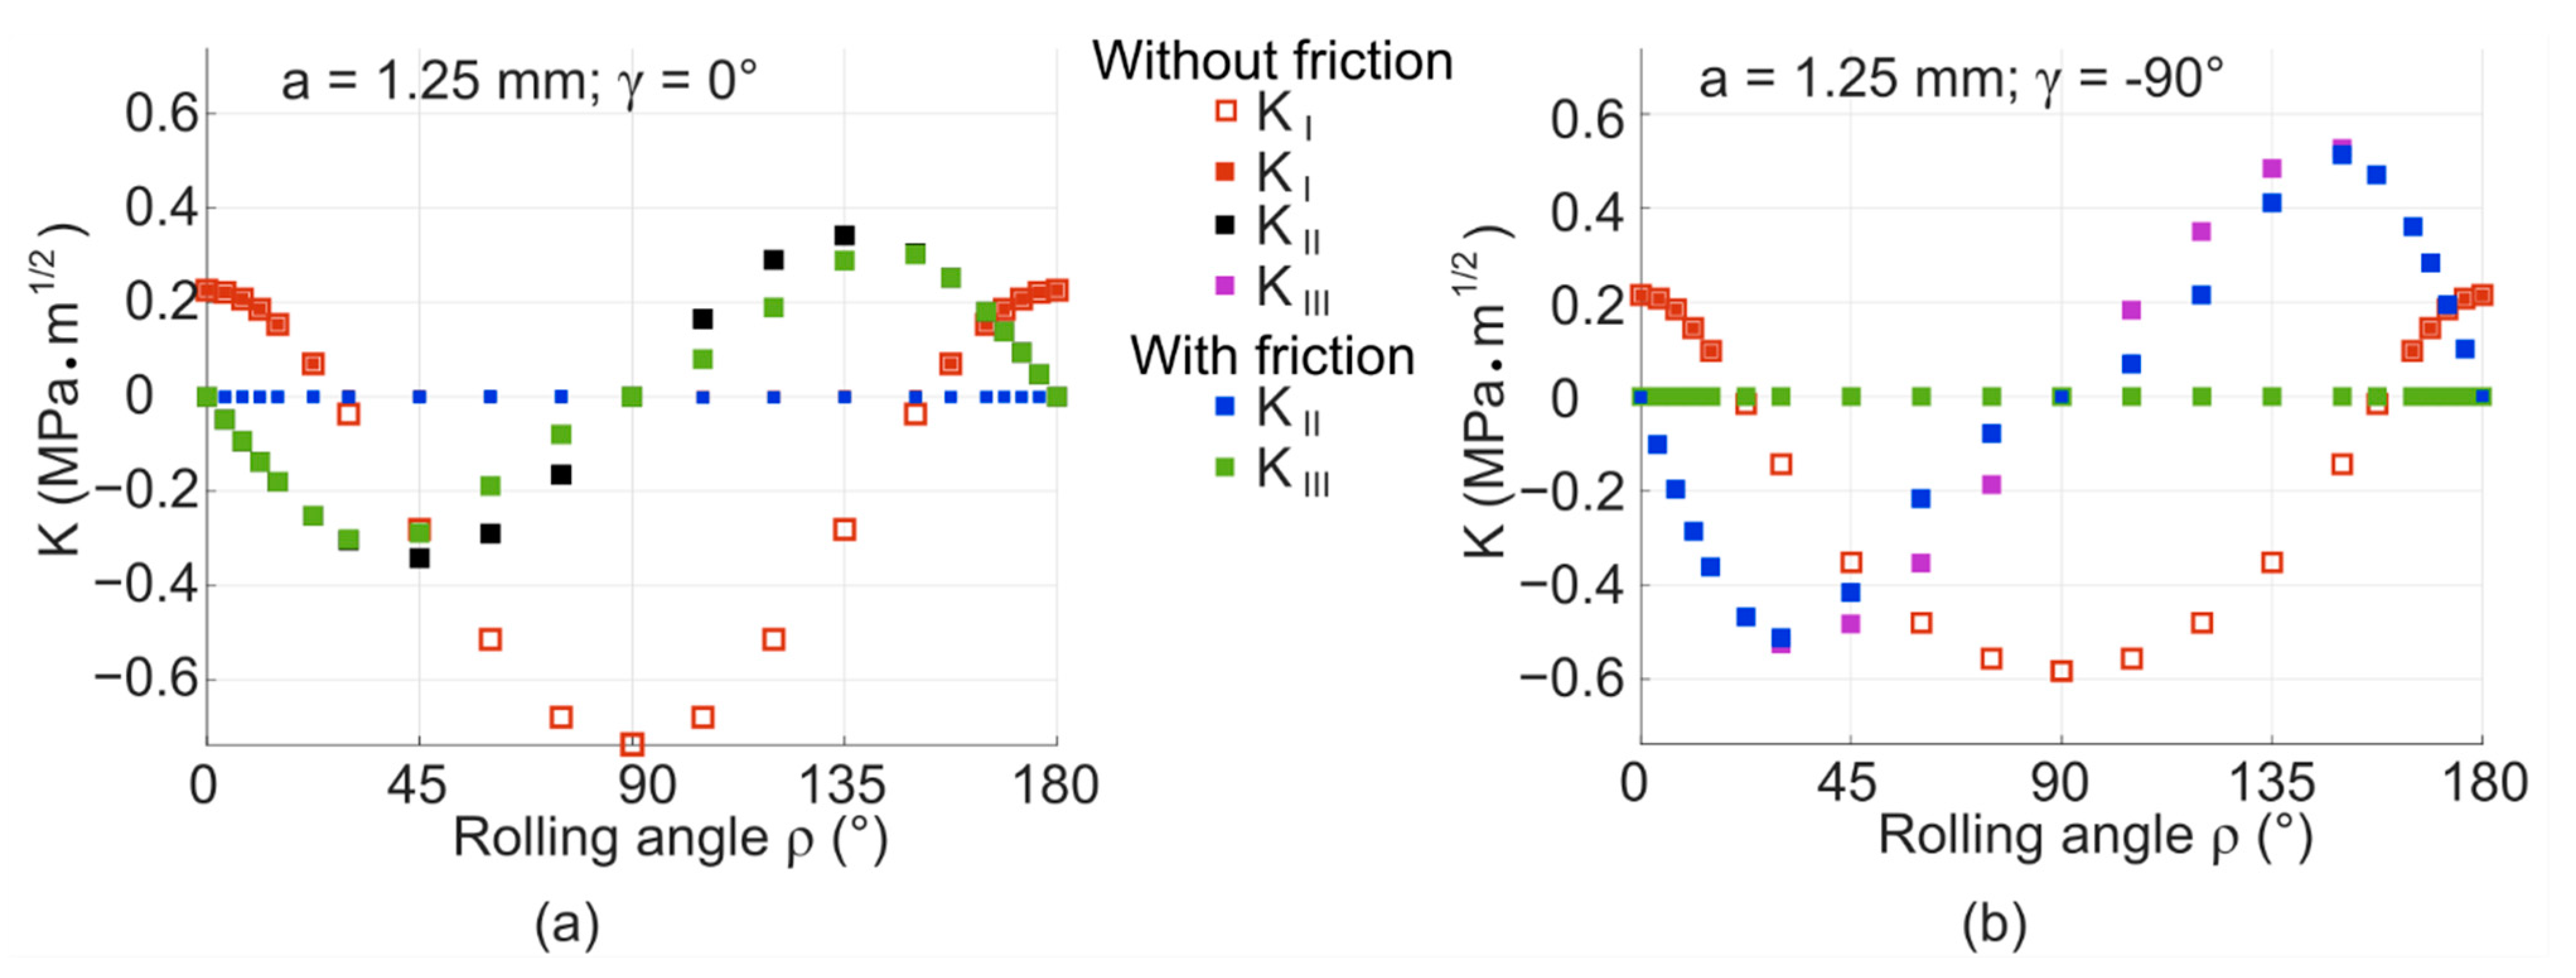
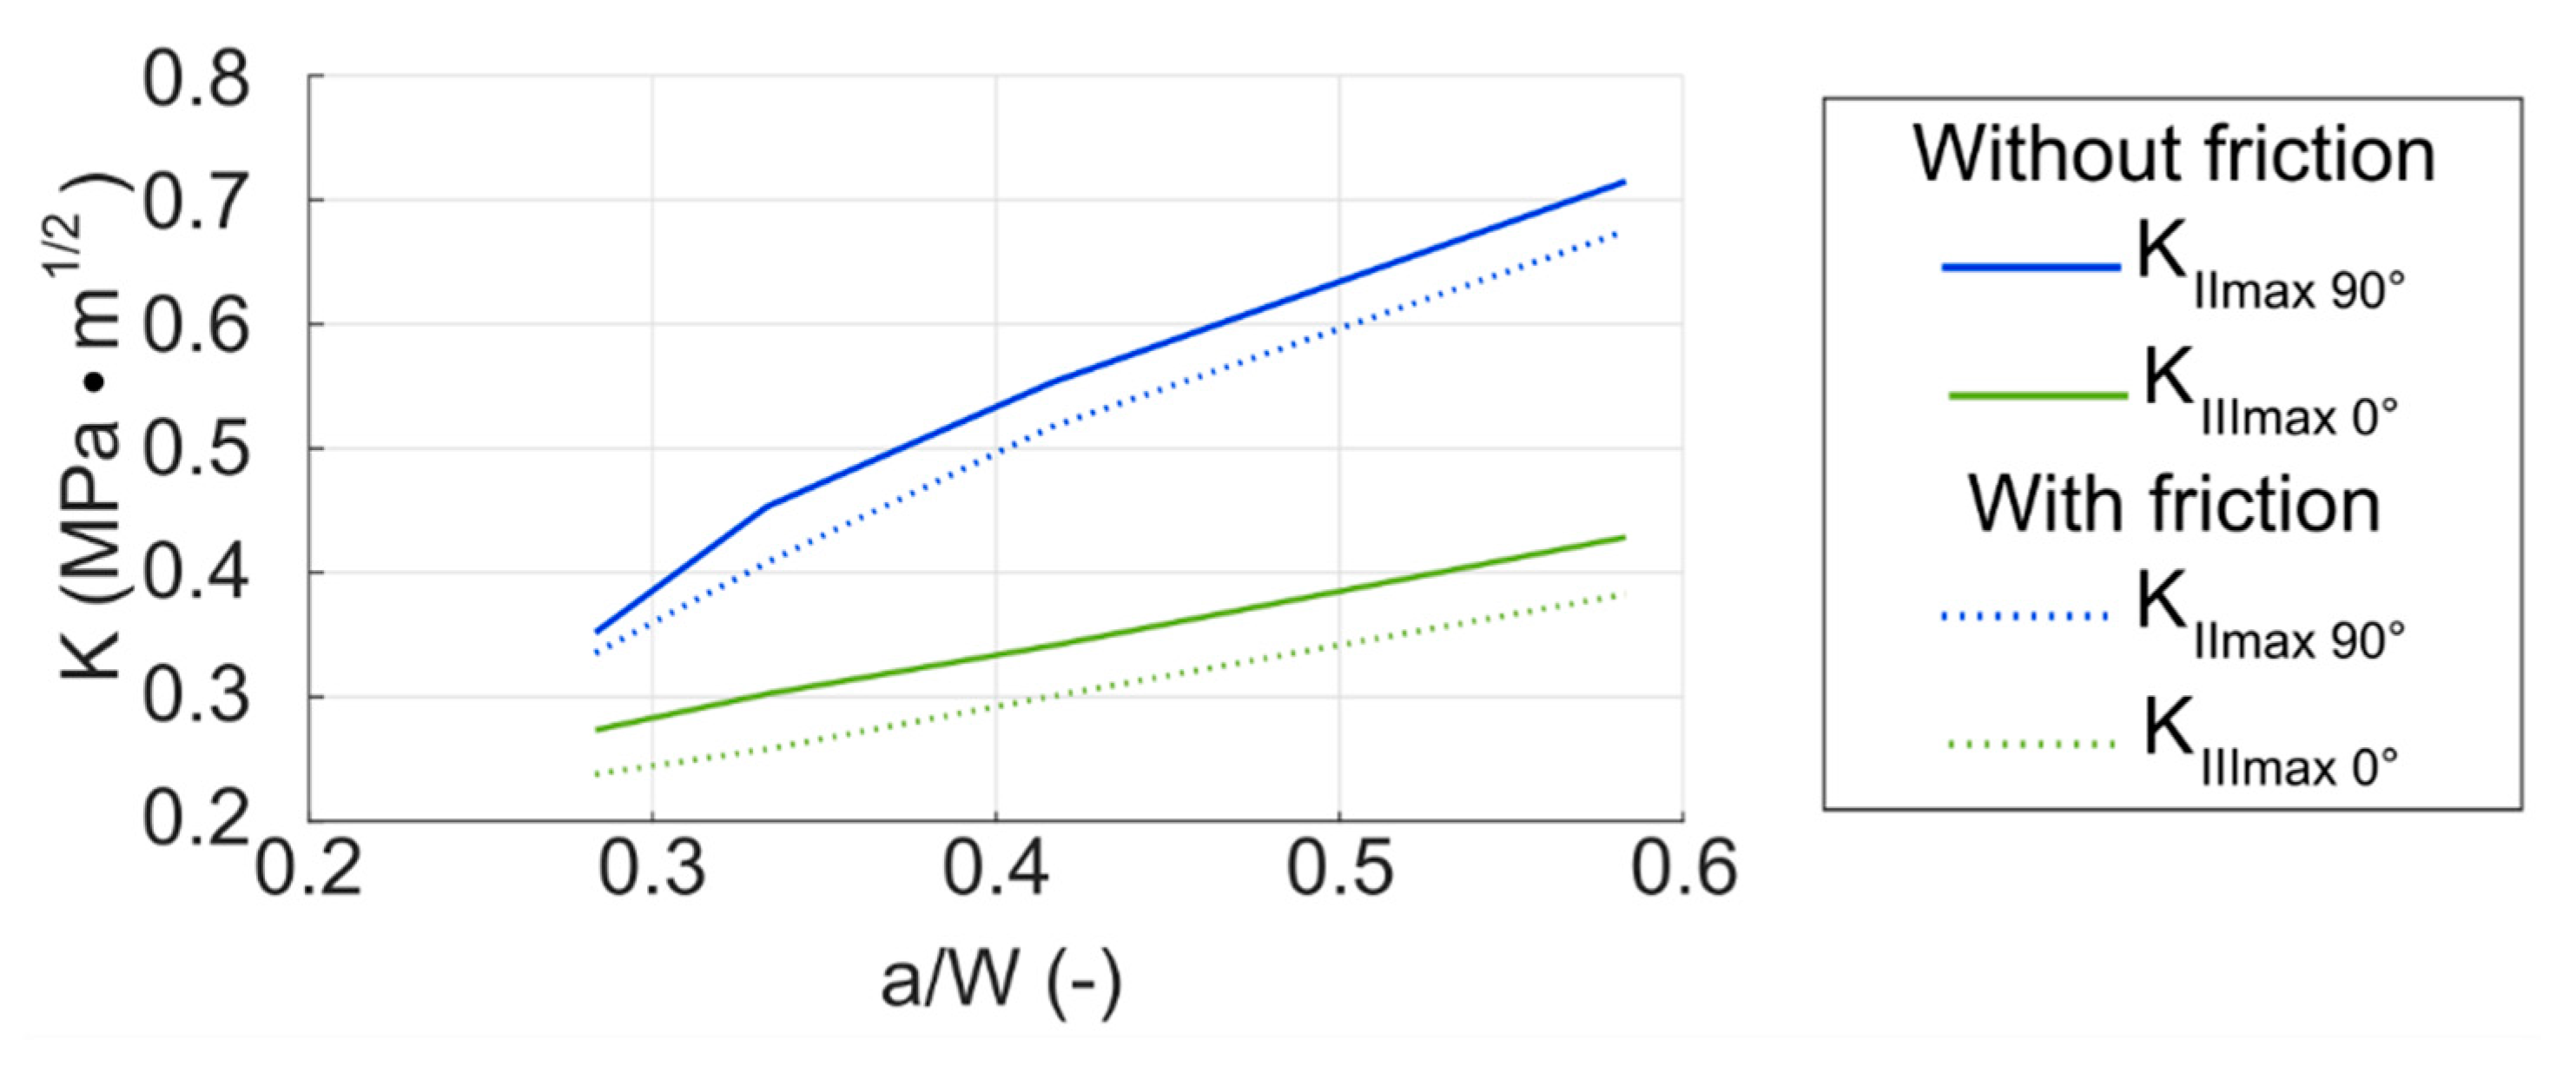
- Model with a void and friction—the same as the model with a void, but friction is considered between the faces of the crack.
2.1. Basic Model with a Flat Crack
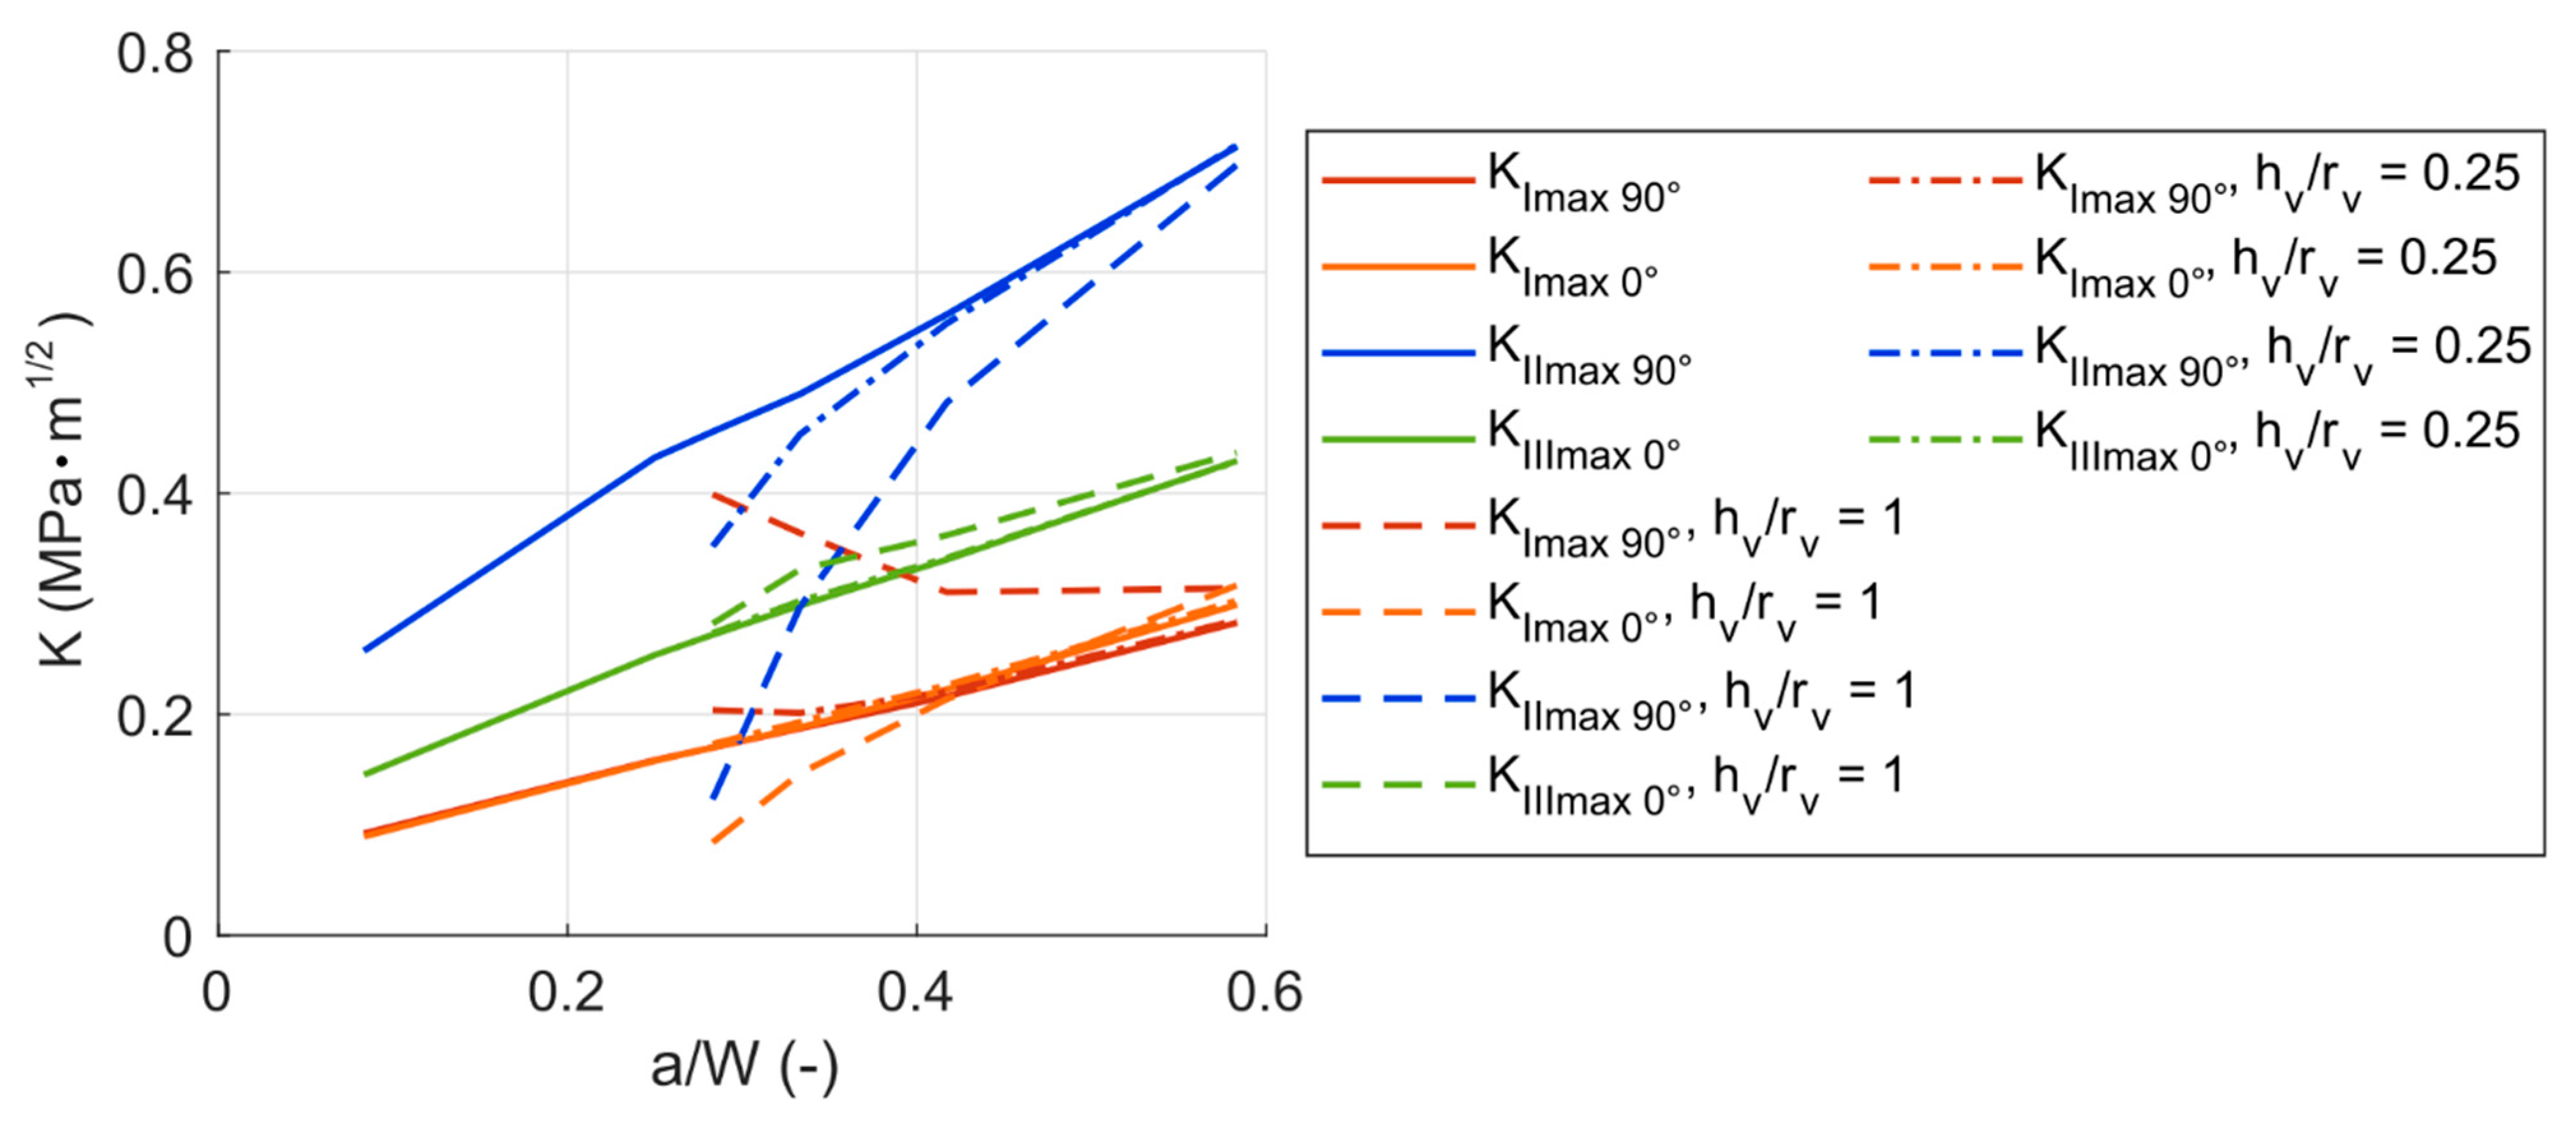
2.2. Models with a Void and Friction
3. Results and Discussion
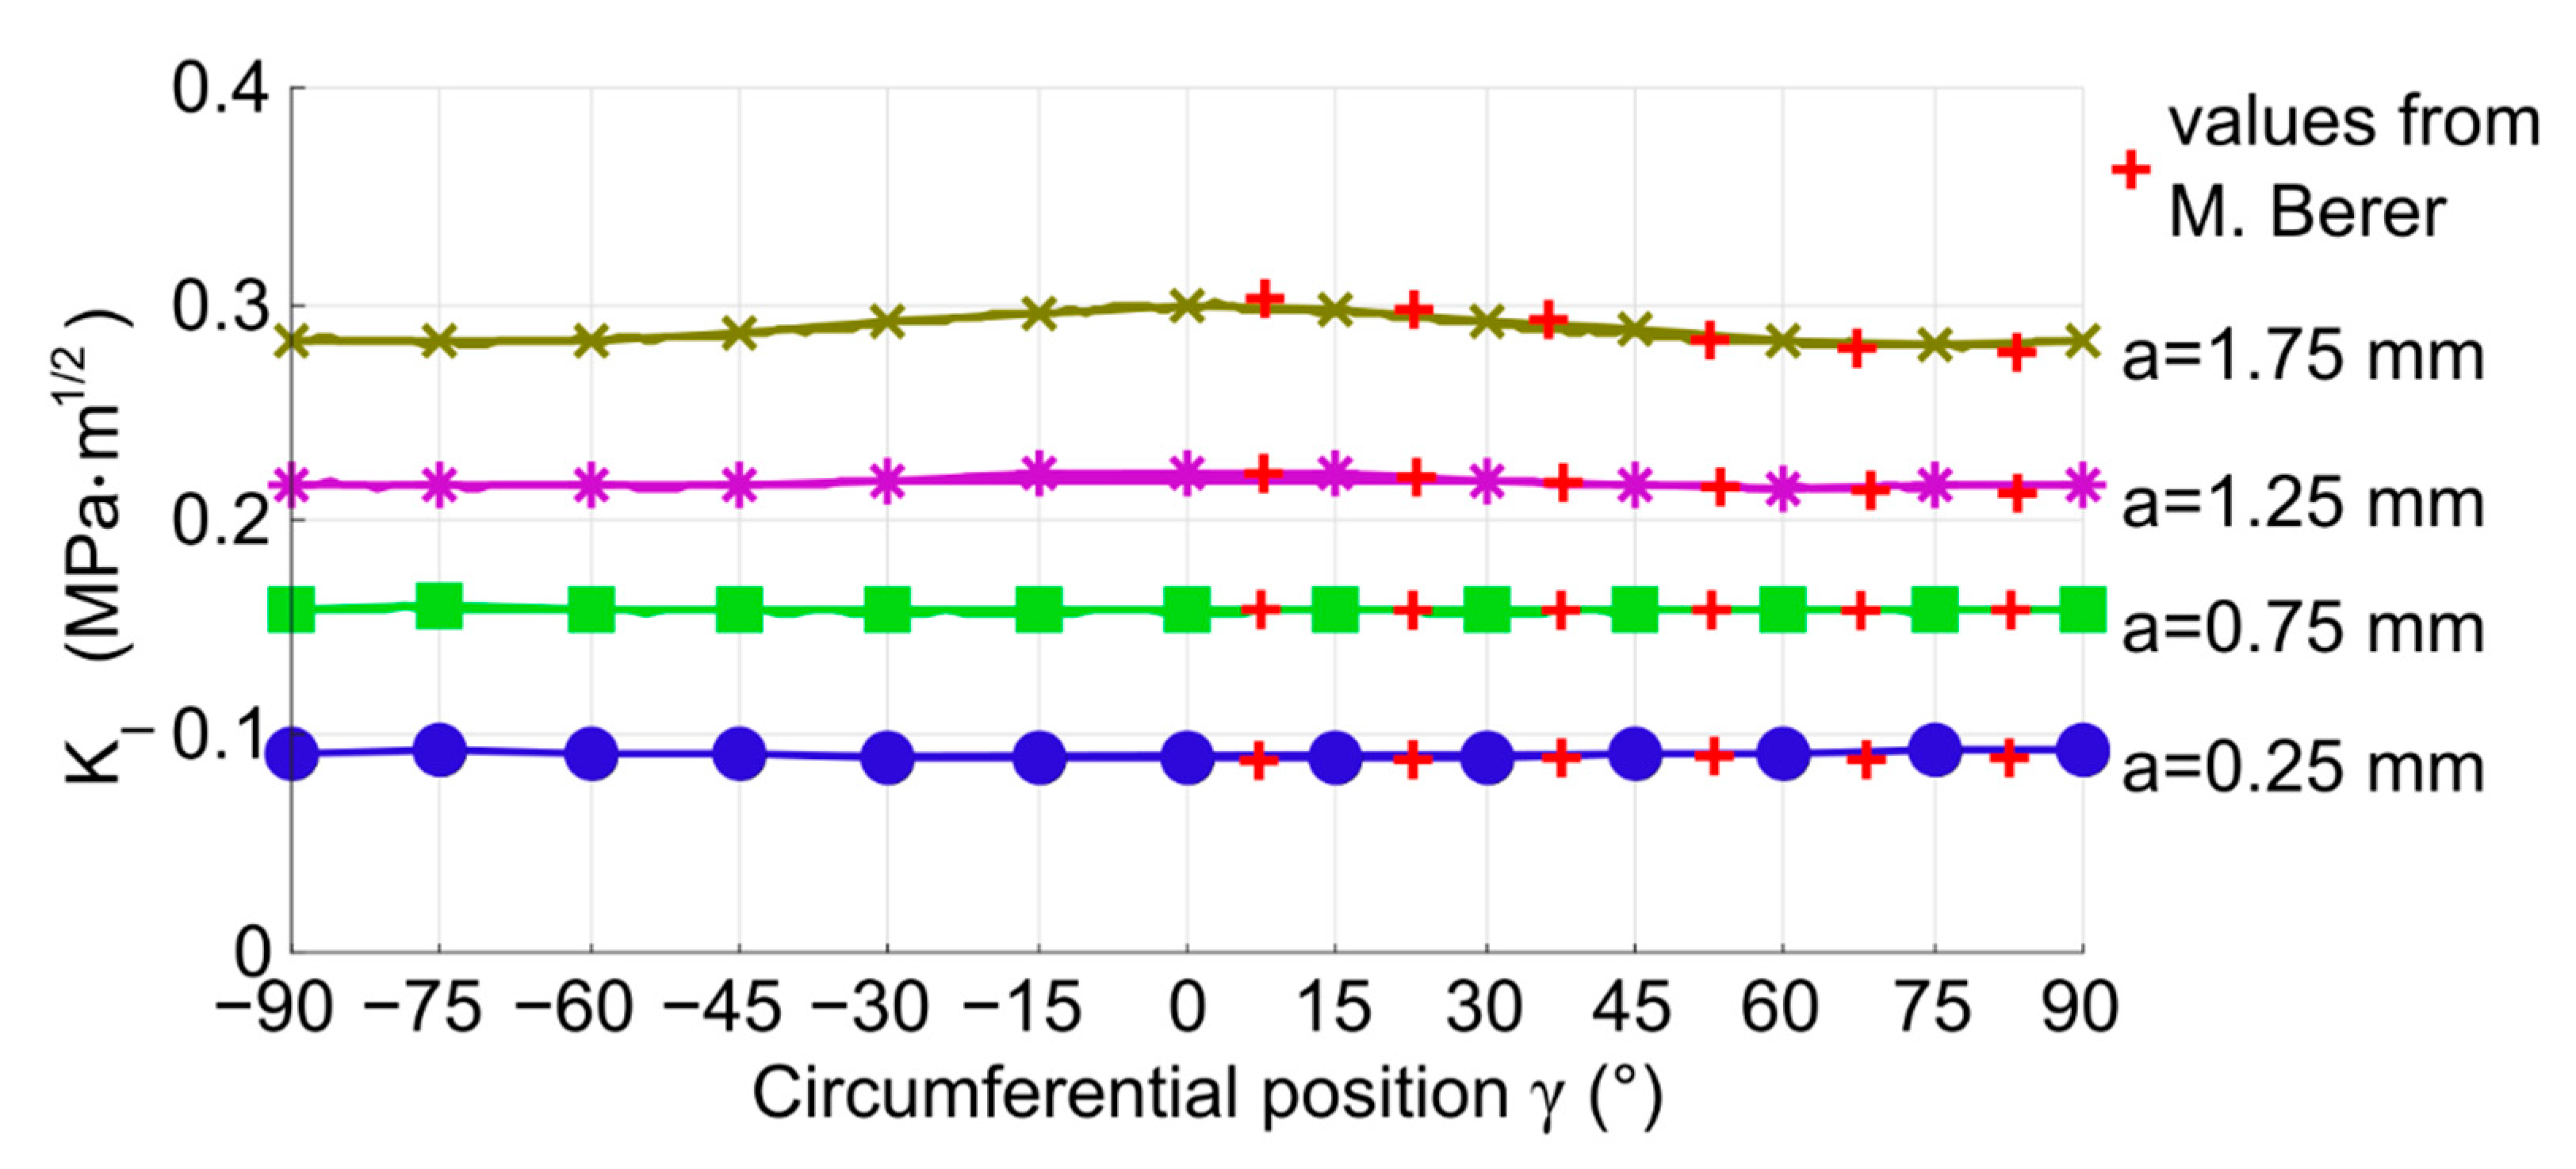
3.1. Model with a Flat Crack—Results and Discussion
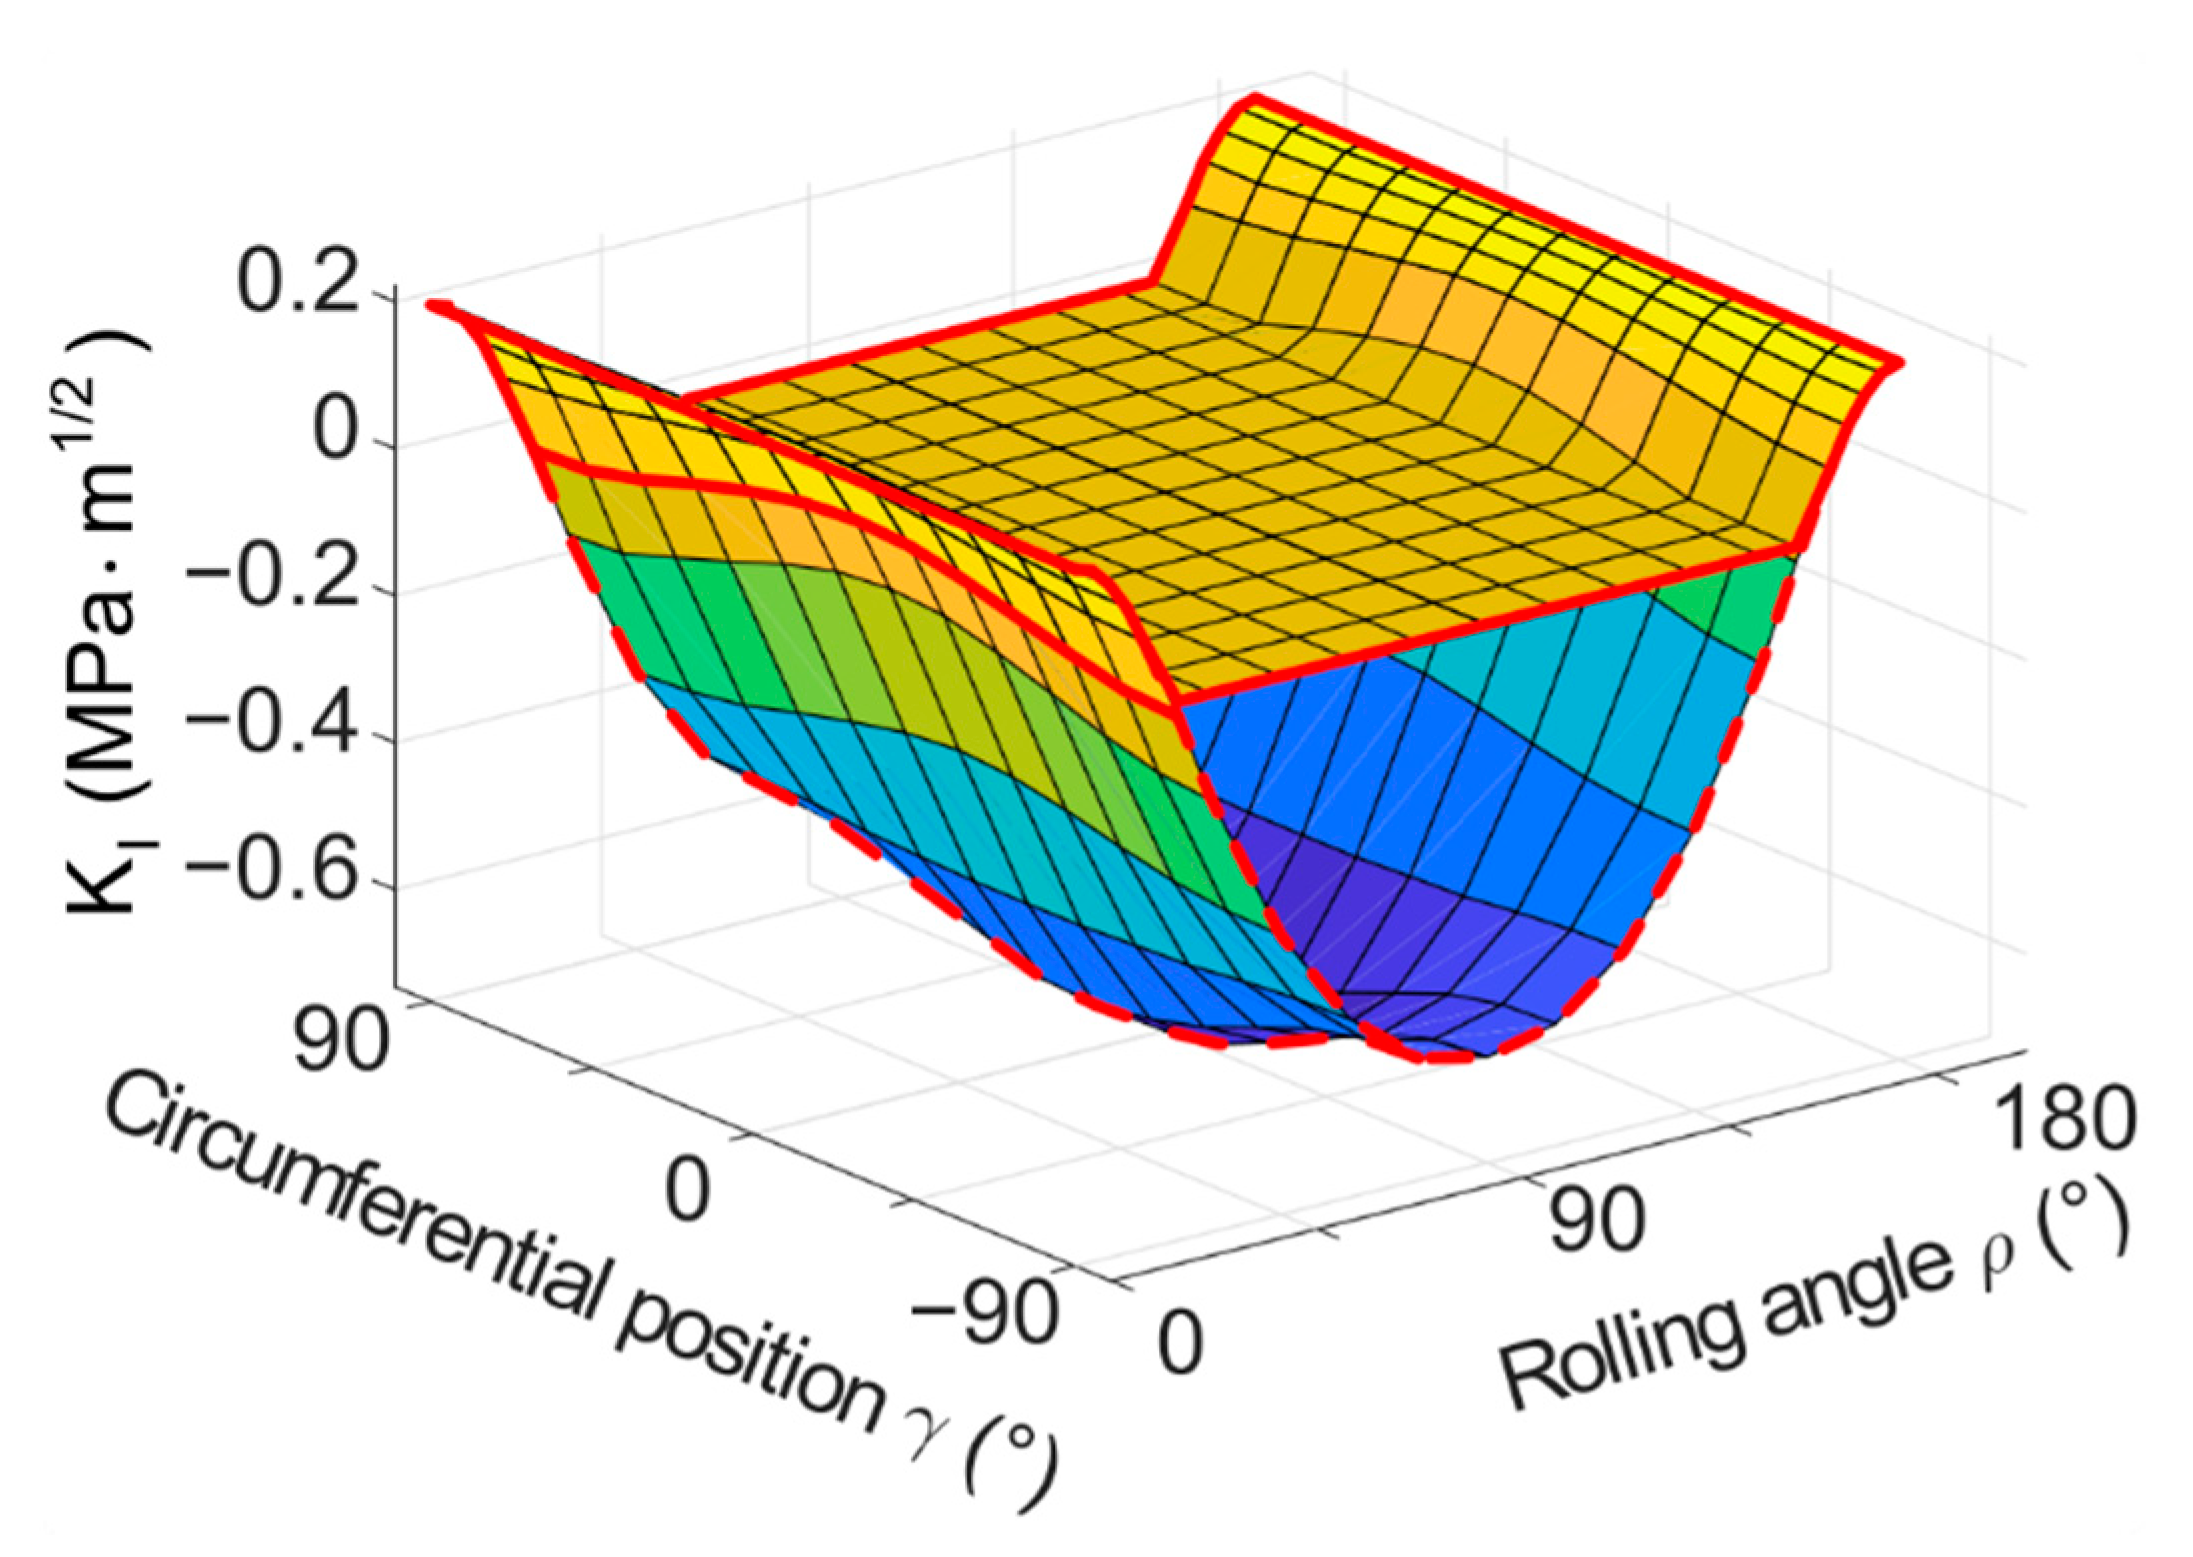
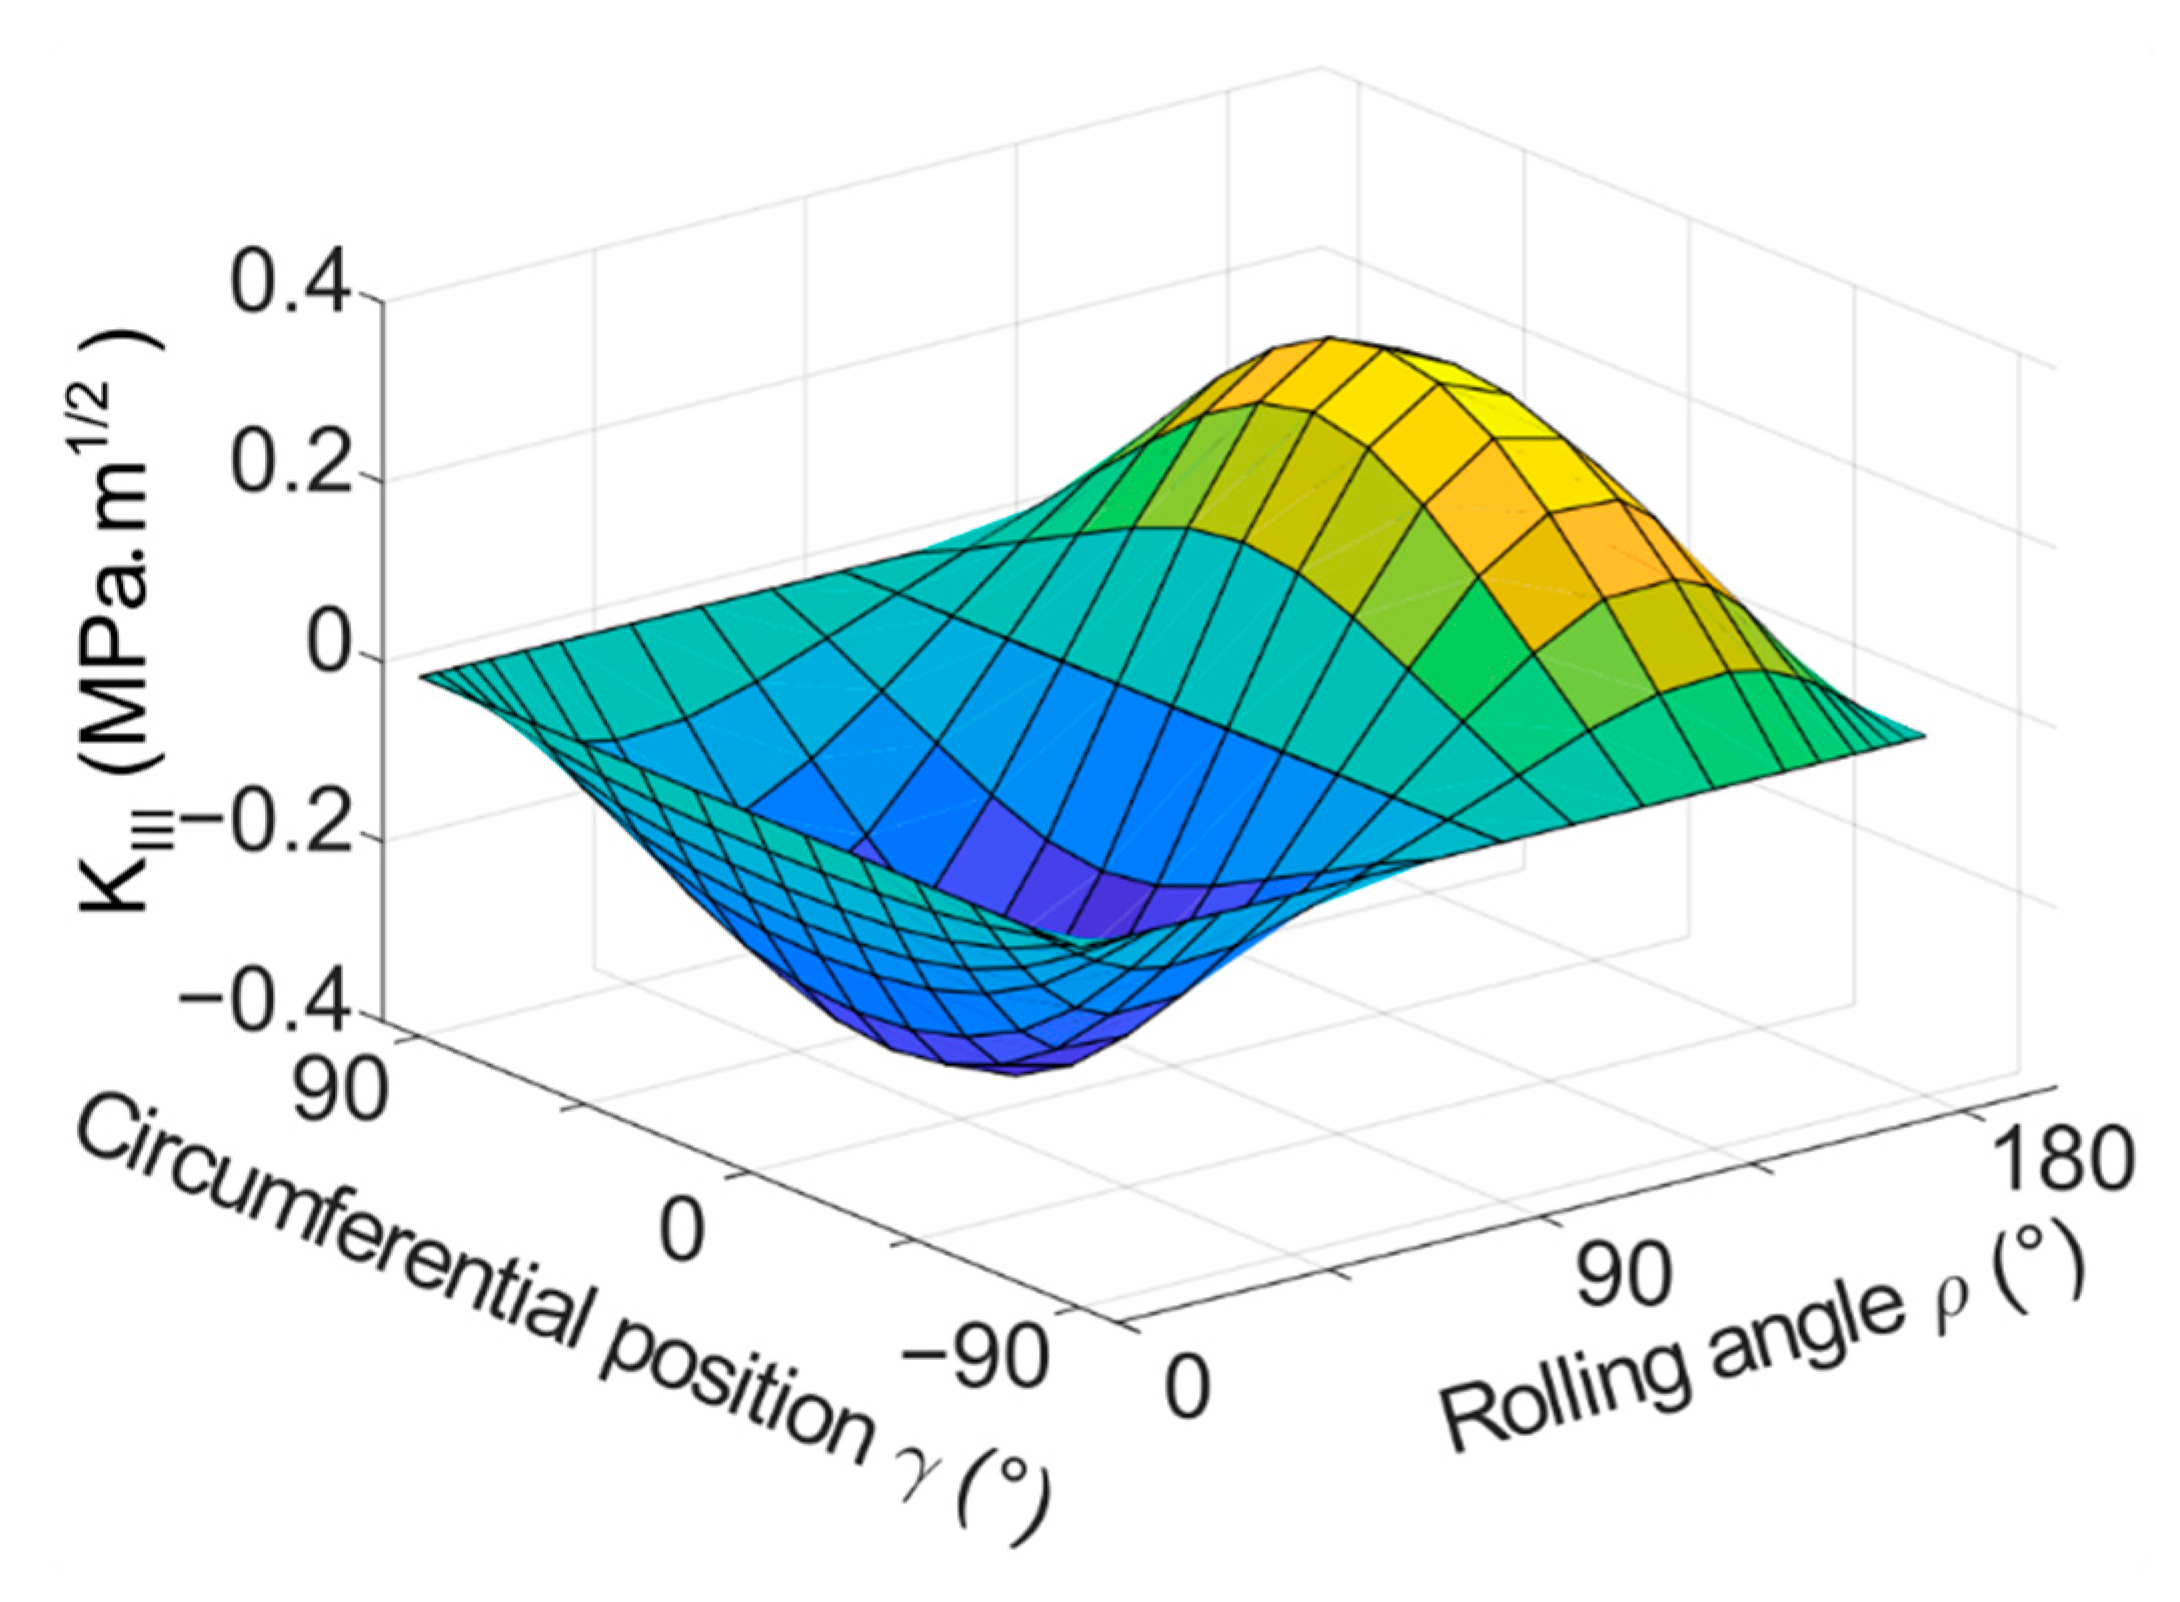
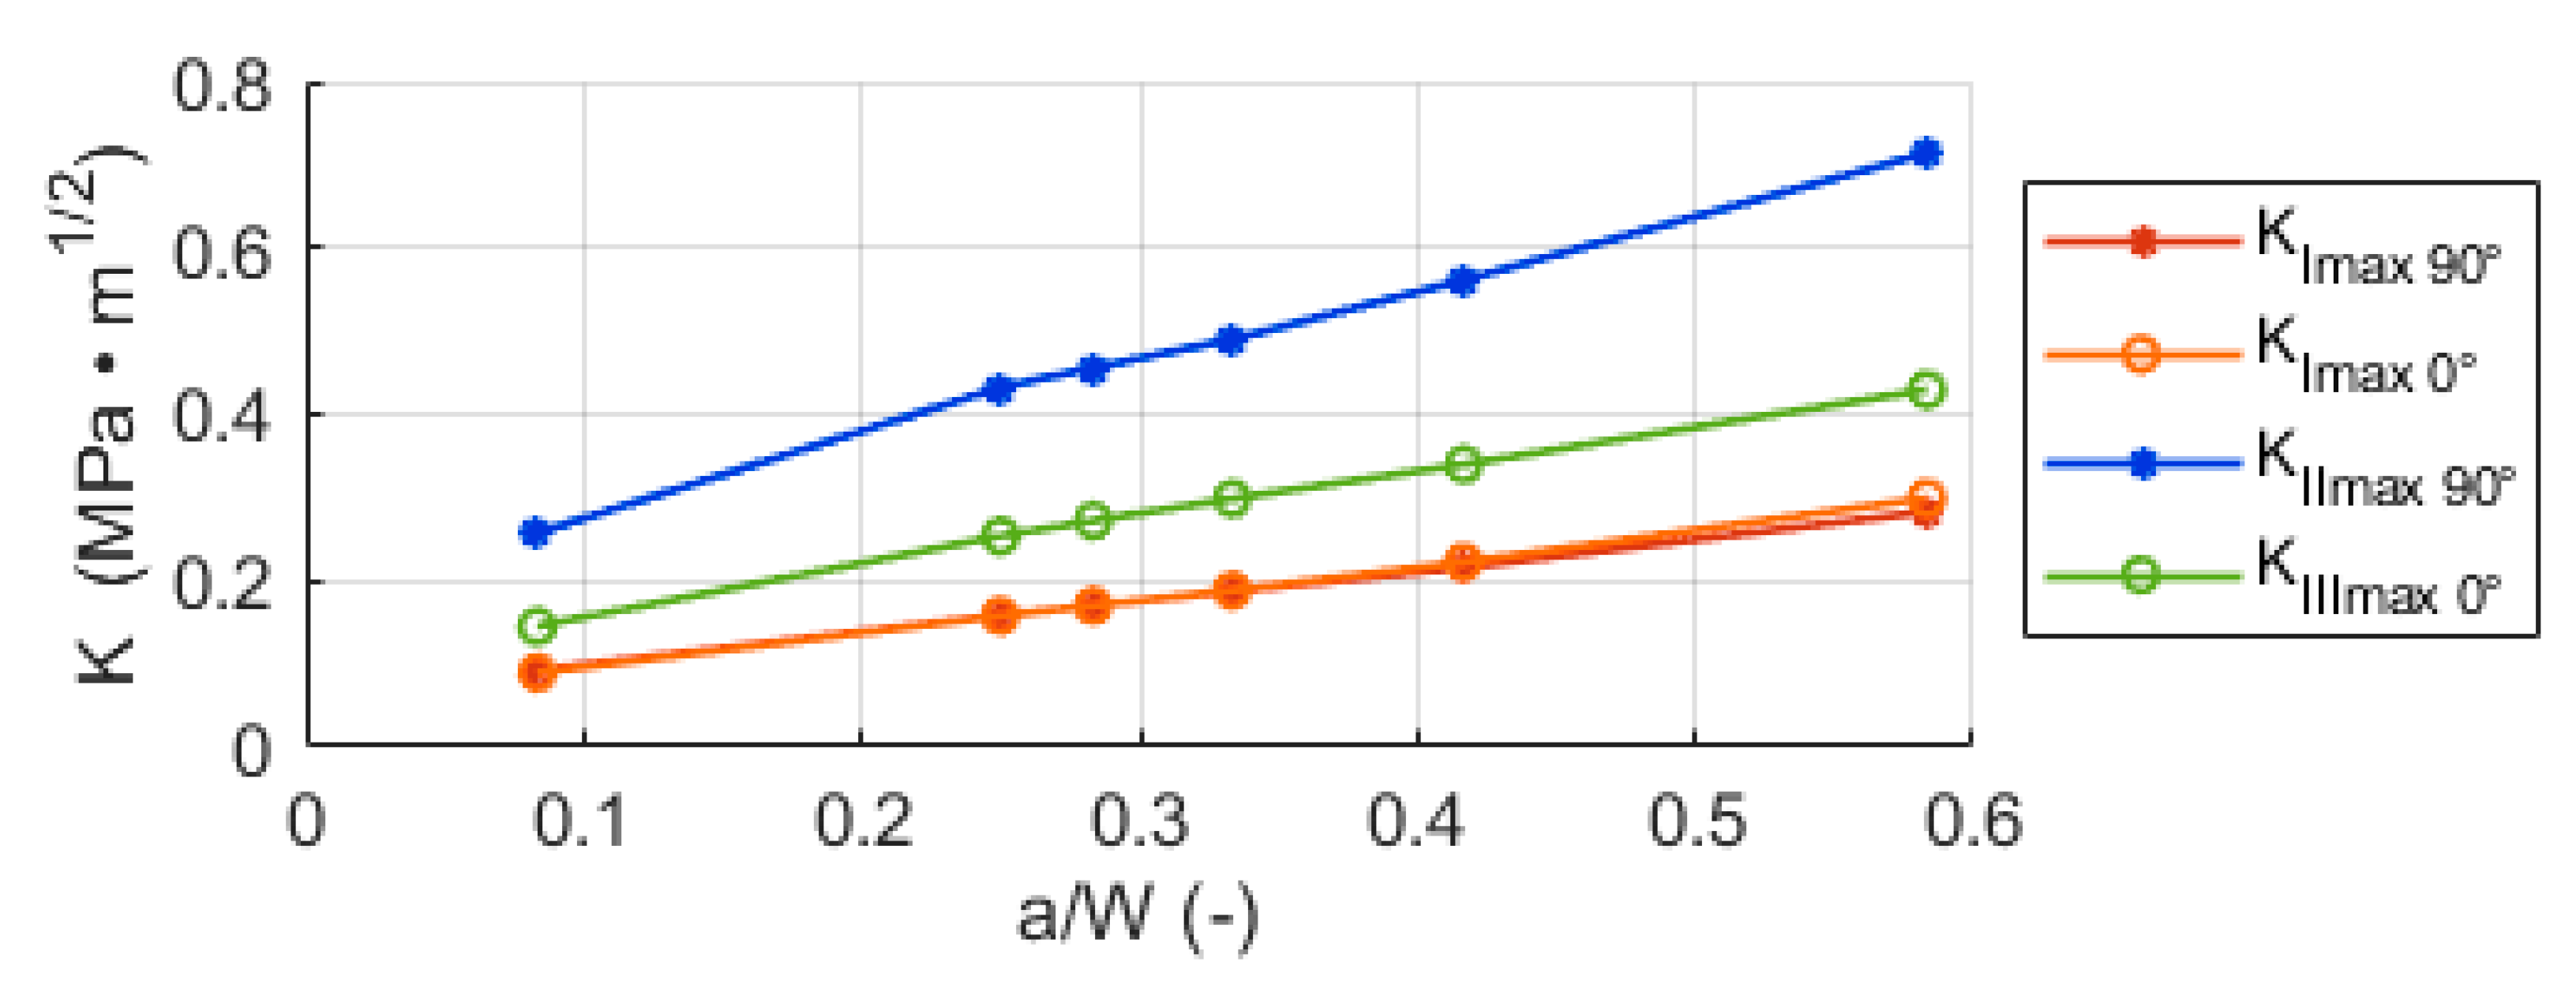
3.2. Models with Voids and Friction—Results and Discussion
4. Conclusions
Author Contributions
Funding
Institutional Review Board Statement
Informed Consent Statement
Data Availability Statement
Conflicts of Interest
Appendix A


Appendix B


References
- Avalle, M.; Romanello, E. Tribological characterization of modified polymeric blends. Procedia Struct. Integr. 2018, 8, 239–255. [Google Scholar] [CrossRef]
- Harrass, M.; Friedrich, K.; Almajid, A. Tribological behavior of selected engineering polymers under rolling contact. Tribol. Int. 2010, 43, 635–646. [Google Scholar] [CrossRef]
- Berer, M.; Mitev, I.; Pinter, G. Finite element study of mode I crack opening effects in compression-loaded cracked cylinders. Eng. Fract. Mech. 2017, 175, 1–14. [Google Scholar] [CrossRef]
- Berer, M.; Major, Z. Characterization of the global deformation behaviour of engineering plastics rolls. Int. J. Mech. Mater. Des. 2010, 6, 1–9. [Google Scholar] [CrossRef]
- Berer, M.; Major, Z. Characterisation of the Local Deformation Behaviour of Engineering Plastics Rolls. Strain 2011, 48, 225–234. [Google Scholar] [CrossRef]
- Bonniot, T.; Doquet, V.; Mai, S.H. Mixed mode II and III fatigue crack growth in a rail steel. Int. J. Fatigue 2018, 115, 42–52. [Google Scholar] [CrossRef]
- Bold, P.; Brown, M.; Allen, R. Shear mode crack growth and rolling contact fatigue. Wear 1991, 144, 307–317. [Google Scholar] [CrossRef]
- Liu, H. Material Modelling for Structural Analysis of Polyethylene. Master’s Thesis, University of Waterloo, Waterloo, ON, Canada, 2007. [Google Scholar]
- Liu, Y.; Stratman, B.; Mahadevan, S. Fatigue crack initiation life prediction of railroad wheels. Int. J. Fatigue 2006, 28, 747–756. [Google Scholar] [CrossRef]
- Avanzini, A.; Donzella, G.; Mazzù, A.; Petrogalli, C. Wear and rolling contact fatigue of PEEK and PEEK composites. Tribol. Int. 2013, 57, 22–30. [Google Scholar] [CrossRef]
- Kadin, Y.; Rychahivskyy, A. Modeling of surface cracks in rolling contact. Mater. Sci. Eng. A 2012, 541, 143–151. [Google Scholar] [CrossRef]
- Berer, M.; Major, Z.; Pinter, G. Elevated pitting wear of injection molded polyetheretherketone (PEEK) rolls. Wear 2013, 297, 1052–1063. [Google Scholar] [CrossRef]
- Koike, H.; Kida, K.; Honda, T.; Mizobe, K.; Oyama, S.; Rozwadowska, J.; Kashima, Y.; Kanemasu, K. Observation of Crack Propagation in PEEK Polymer Bearings under Water-Lubricated Conditions. Adv. Mater. Res. 2012, 566, 109–114. [Google Scholar] [CrossRef]
- Berer, M.; Pinter, G. Determination of crack growth kinetics in non-reinforced semi-crystalline thermoplastics using the linear elastic fracture mechanics (LEFM) approach. Polym. Test. 2013, 32, 870–879. [Google Scholar] [CrossRef]
- Berer, M.; Pinter, G.; Feuchter, M. Fracture mechanical analysis of two commercial polyoxymethylene homopolymer resins. J. Appl. Polym. Sci. 2014, 131, 1–15. [Google Scholar] [CrossRef]
- Furmanski, J.; Pruitt, L.A. Peak stress intensity dictates fatigue crack propagation in UHMWPE. Polymer 2007, 48, 3512–3519. [Google Scholar] [CrossRef]
- Favier, V.; Giroud, T.; Strijko, E.; Hiver, J.; G’Sell, C.; Hellinckx, S.; Goldberg, A. Slow crack propagation in polyethylene under fatigue at controlled stress intensity. Polymer 2002, 43, 1375–1382. [Google Scholar] [CrossRef]
- Pruitt, L.; Sreekanth, P.R.; Badgayan, N.; Sahoo, S. Fatigue of Polymers. In Reference Module in Materials Science and Materials Engineering; Elsevier BV: Amsterdam, The Netherlands, 2017; pp. 1–15. [Google Scholar]
- Harris, J.S.; Ward, I.M. Fatigue-crack propagation in vinyl urethane polymers. J. Mater. Sci. 1973, 8, 1655–1665. [Google Scholar] [CrossRef]
- Kanters, M.J.; Kurokawa, T.; Govaert, L.E. Competition between plasticity-controlled and crack-growth controlled failure in static and cyclic fatigue of thermoplastic polymer systems. Polym. Test. 2016, 50, 101–110. [Google Scholar] [CrossRef]
- Kanters, M.J.; Stolk, J.; Govaert, L.E. Direct comparison of the compliance method with optical tracking of fatigue crack propagation in polymers. Polym. Test. 2015, 46, 98–107. [Google Scholar] [CrossRef]
- Arbeiter, F.; Spoerk, M.; Wiener, J.; Gosch, A.; Pinter, G. Fracture mechanical characterization and lifetime estimation of near-homogeneous components produced by fused filament fabrication. Polym. Test. 2018, 66, 105–113. [Google Scholar] [CrossRef]
- Hutař, P.; Ševčík, M.; Náhlík, L.; Pinter, G.; Frank, A.; Mitev, I. A numerical methodology for lifetime estimation of HDPE pressure pipes. Eng. Fract. Mech. 2011, 78, 3049–3058. [Google Scholar] [CrossRef]
- Frank, A.; Arbeiter, F.J.; Berger, I.J.; Hutař, P.; Náhlík, L.; Pinter, G. Fracture Mechanics Lifetime Prediction of Polyethylene Pipes. J. Pipeline Syst. Eng. Pr. 2019, 10, 04018030. [Google Scholar] [CrossRef]
- Frank, A.; Hutař, P.; Pinter, G. Numerical Assessment of PE 80 and PE 100 Pipe Lifetime Based on Paris-Erdogan Equation. Macromol. Symp. 2012, 311, 112–121. [Google Scholar] [CrossRef]
- Benhamena, A.; Bouiadjra, B.B.; Amrouche, A.; Mesmacque, G.; Benseddiq, N.; Benguediab, M. Three finite element analysis of semi-elliptical crack in high density poly-ethylene pipe subjected to internal pressure. Mater. Des. 2010, 31, 3038–3043. [Google Scholar] [CrossRef]
- Arbeiter, F.; Trávníček, L.; Petersmann, S.; Dlhý, P.; Spoerk, M.; Pinter, G.; Hutař, P. Damage tolerance-based methodology for fatigue lifetime estimation of a structural component produced by material extrusion-based additive manufacturing. Addit. Manuf. 2020, 36, 101730. [Google Scholar] [CrossRef]
- Puigoriol-Forcada, J.M.; Alsina, A.; Salazar-Martín, A.G.; Gomez-Gras, G.; Pérez, M.A. Flexural fatigue properties of polycarbonate fused-deposition modelling specimens. Mater. Des. 2018, 155, 414–421. [Google Scholar] [CrossRef]
- Jones, R.; Kinloch, A.; Michopoulos, J.; Brunner, A.; Phan, N. Delamination growth in polymer-matrix fibre composites and the use of fracture mechanics data for material characterisation and life prediction. Compos. Struct. 2017, 180, 316–333. [Google Scholar] [CrossRef]
- Evans, J.W.; Sinha, K. Applications of fracture mechanics to quantitative accelerated life testing of plastic encapsulated microelectronics. Microelectron. Reliab. 2018, 80, 317–327. [Google Scholar] [CrossRef]
- Gosch, A.; Berer, M.; Hutař, P.; Slávik, O.; Vojtek, T.; Arbeiter, F.J.; Pinter, G. Mixed Mode I/III fatigue fracture characterization of Polyoxymethylene. Int. J. Fatigue 2020, 130, 105269. [Google Scholar] [CrossRef]
- Gosch, A.; Arbeiter, F.J.; Berer, M.; Vojtek, T.; Hutař, P.; Pinter, G. Fatigue characterization of polyethylene under mixed mode I/III conditions. Int. J. Fatigue 2021, 145, 106084. [Google Scholar] [CrossRef]
- Schrader, P.; Gosch, A.; Berer, M.; Marzi, S. Fracture of Thin-Walled Polyoxymethylene Bulk Specimens in Modes I and III. Materials 2020, 13, 5096. [Google Scholar] [CrossRef]
- ANSYS Help Release 2020 R2; ANSYS Inc.: Canonsburg, PA, USA, 2020.
- Shih, C.F.; Moran, B.; Nakamura, T. Energy release rate along a three-dimensional crack front in a thermally stressed body. Int. J. Fract. 1986, 30, 79–102. [Google Scholar] [CrossRef]
- Ingraffea, A.R.; Manu, C. Stress-intensity factor computation in three dimensions with quarter-point elements. Int. J. Numer. Methods Eng. 1980, 15, 1427–1445. [Google Scholar] [CrossRef]
- Lind, J.; Lindholm, P.; Qin, J.; Kassman, R. Friction and wear studies of some peek materials. Tribologia 2015, 33, 20–28. [Google Scholar]
- Chaudri, A.M.; Suvanto, M.; Pakkanen, T.T. Non-lubricated friction of polybutylene terephthalate (PBT) sliding against polyoxymethylene (POM). Wear 2015, 342–343, 189–197. [Google Scholar] [CrossRef]
- Chen, J.; Cao, Y.; Li, H. Investigation of the friction and wear behaviors of polyoxymethylene/linear low-density polyethylene/ethylene-acrylic-acid blends. Wear 2006, 260, 1342–1348. [Google Scholar] [CrossRef]
- Hoskins, T.; Dearn, K.; Chen, Y.; Kukureka, S. The wear of PEEK in rolling–sliding contact—Simulation of polymer gear applications. Wear 2014, 309, 35–42. [Google Scholar] [CrossRef]
- Chen, Y.T.; Liu, K.X. Crack propagation in viscoplastic polymers: Heat generation in near-tip zone and viscoplastic cohesive model. Appl. Phys. Lett. 2015, 106, 061908. [Google Scholar] [CrossRef]


Publisher’s Note: MDPI stays neutral with regard to jurisdictional claims in published maps and institutional affiliations. |
© 2021 by the authors. Licensee MDPI, Basel, Switzerland. This article is an open access article distributed under the terms and conditions of the Creative Commons Attribution (CC BY) license (https://creativecommons.org/licenses/by/4.0/).
Share and Cite
Dlhý, P.; Poduška, J.; Berer, M.; Gosch, A.; Slávik, O.; Náhlík, L.; Hutař, P. Crack Propagation Analysis of Compression Loaded Rolling Elements. Materials 2021, 14, 2656. https://doi.org/10.3390/ma14102656
Dlhý P, Poduška J, Berer M, Gosch A, Slávik O, Náhlík L, Hutař P. Crack Propagation Analysis of Compression Loaded Rolling Elements. Materials. 2021; 14(10):2656. https://doi.org/10.3390/ma14102656
Chicago/Turabian StyleDlhý, Pavol, Jan Poduška, Michael Berer, Anja Gosch, Ondrej Slávik, Luboš Náhlík, and Pavel Hutař. 2021. "Crack Propagation Analysis of Compression Loaded Rolling Elements" Materials 14, no. 10: 2656. https://doi.org/10.3390/ma14102656
APA StyleDlhý, P., Poduška, J., Berer, M., Gosch, A., Slávik, O., Náhlík, L., & Hutař, P. (2021). Crack Propagation Analysis of Compression Loaded Rolling Elements. Materials, 14(10), 2656. https://doi.org/10.3390/ma14102656