Controlled Reduction of Graphene Oxide Using Sulfuric Acid

 ,
,
Abstract
1. Introduction
2. Experimental Section
2.1. Synthesis of GO and RGO
2.2. Characterization
3. Results and Discussion
4. Conclusions
Supplementary Materials
Author Contributions
Funding
Institutional Review Board Statement
Informed Consent Statement
Data Availability Statement
Acknowledgments
Conflicts of Interest
References
- Gómez-Navarro, C.; Meyer, J.C.; Sundaram, R.S.; Chuvilin, A.; Kurasch, S.; Burghard, M.; Kern, K.; Kaiser, U. Atomic structure of reduced graphene oxide. Nano Lett. 2010, 10, 1144–1148. [Google Scholar] [CrossRef] [PubMed]
- Zhao, M.; Reda, A.T.; Zhang, D. Reduced Graphene Oxide/ZIF-67 Aerogel Composite Material for Uranium Adsorption in Aqueous Solutions. ACS Omega 2020, 5, 8012–8022. [Google Scholar] [CrossRef] [PubMed]
- Yao, T.; Xin, G.; Scott, S.M.; Gong, B.; Lian, J. Thermally-Conductive and Mechanically-Robust Graphene Nanoplatelet Reinforced UO2 Composite Nuclear Fuels. Sci. Rep. 2018, 8, 2–10. [Google Scholar] [CrossRef]
- Lozada-Hidalgo, M.; Zhang, S.; Hu, S.; Esfandiar, A.; Grigorieva, I.V.; Geim, A.K. Scalable and efficient separation of hydrogen isotopes using graphene-based electrochemical pumping. Nat. Commun. 2017, 8, 15215. [Google Scholar] [CrossRef] [PubMed]
- Mancillas-Salas, S.; Barroso-Flores, J.; Villaurrutia, R.; García-Montalvo, V.; López-Honorato, E. Production of few-layer graphene by wet media milling using organic solvents and different types of graphite. Ceram. Int. 2019, 46, 2413–2420. [Google Scholar] [CrossRef]
- Teng, C.; Xie, D.; Wang, J.; Yang, Z.; Ren, G.; Zhu, Y. Ultrahigh Conductive Graphene Paper Based on Ball-Milling Exfoliated Graphene. Adv. Funct. Mater. 2017, 27, 1700240. [Google Scholar] [CrossRef]
- Zhao, W.; Fang, M.; Wu, F.; Wu, H.; Wang, L.; Chen, G. Preparation of graphene by exfoliation of graphite using wet ball milling. J. Mater. Chem. 2010, 20, 5817–5819. [Google Scholar] [CrossRef]
- Kim, D.; Yang, S.J.; Kim, Y.S.; Jung, H.; Park, C.R. Simple and cost-effective reduction of graphite oxide by sulfuric acid. Carbon N. Y. 2012, 50, 3229–3232. [Google Scholar] [CrossRef]
- Stankovich, S.; Dikin, D.A.; Piner, R.D.; Kohlhaas, K.A.; Kleinhammes, A.; Jia, Y.; Wu, Y.; Nguyen, S.B.T.; Ruoff, R.S. Synthesis of graphene-based nanosheets via chemical reduction of exfoliated graphite oxide. Carbon N. Y. 2007, 45, 1558–1565. [Google Scholar] [CrossRef]
- Chen, W.; Yan, L.; Bangal, P.R. Chemical Reduction of Graphene Oxide to Graphene by Sulfur-Containing Compounds. J. Phys. Chem. C 2010, 114, 19885–19890. [Google Scholar] [CrossRef]
- Su, Y.; Gao, X.; Zhao, J. Reaction mechanisms of graphene oxide chemical reduction by sulfur-containing compounds. Carbon N. Y. 2014, 67, 146–155. [Google Scholar] [CrossRef]
- Pei, S.; Zhao, J.; Du, J.; Ren, W.; Cheng, H. Direct reduction of graphene oxide films into highly conductive and flexible graphene films by hydrohalic acids. Carbon N. Y. 2010, 48, 4466–4474. [Google Scholar] [CrossRef]
- Gallegos-Pérez, W.R.; Reynosa-Martínez, A.C.; Soto-Ortiz, C.; Álvarez-Lemus, M.A.; Barroso-Flores, J.; García-Montalvo, V.; López-Honorato, E. Effect of UV radiation on the structure of graphene oxide in water and its impact on cytotoxicity and As(III) adsorption. Chemosphere 2020, 249, 126160. [Google Scholar] [CrossRef] [PubMed]
- Tien, H.N.; Luan, V.H.; Lee, T.K.; Kong, B.-S.; Chung, J.S.; Kim, E.J. Enhanced solvothermal reduction of graphene oxide in a mixed solution of sulfuric acid and organic solvent. Chem. Eng. J. 2012, 211–212, 97–103. [Google Scholar] [CrossRef]
- Marcano, D.C.; Kosynkin, D.V.; Berlin, J.M.; Sinitskii, A.; Sun, Z.; Slesarev, A.; Alemany, L.B.; Lu, W.; Tour, J.M. Improved synthesis of graphene oxide. ACS Nano 2010, 4, 4806–4814. [Google Scholar] [CrossRef] [PubMed]
- Reynosa-Martínez, A.C.; Navarro-Tovar, G.; Gallegos, W.R.; Rodríguez-Melendez, H.; Torres-Cadena, R.; Mondragón-Solórzano, G.; Barroso-Flores, J.; Alvares-Lemus, M.A.; García-Montalvo, V.; López-Honorato, E. Effect of the degree of oxidation of graphene oxide on As(III) adsorption. J. Hazard. Mater. 2020, 382, 121440. [Google Scholar] [CrossRef]
- Fairley, N. 2.3.13 Introduction to XPS and AES. In CasaXPS Manual; Casa Software Ltd.: Teignmouth, UK, 2009; pp. 1–177. [Google Scholar]
- Perrozzi, F.; Croce, S.; Treossi, E.; Palermo, V.; Santucci, S.; Fioravanti, G.; Ottaviano, L. Reduction dependent wetting properties of graphene oxide. Carbon N. Y. 2014, 77, 473–480. [Google Scholar] [CrossRef]
- Stankovich, S.; Piner, R.D.; Chen, X.; Wu, N.; Nguyen, S.T.; Ruoff, R.S. Stable aqueous dispersions of graphitic nanoplatelets via the reduction of exfoliated graphite oxide in the presence of poly(sodium 4-styrenesulfonate). J. Mater. Chem. 2006, 16, 155–158. [Google Scholar] [CrossRef]
- Ganguly, A.; Sharma, S.; Papakonstantinou, P.; Hamilton, J. Probing the Thermal Deoxygenation of Graphene Oxide Using High-Resolution In Situ X-ray-Based Spectroscopies. J. Phys. Chem. 2011, 115, 17009–17019. [Google Scholar] [CrossRef]
- Ren, P.; Yan, D.; Ji, X.; Chen, T. Temperature dependence of graphene oxide reduced by hydrazine hydrate. Nanotechnology 2011, 22, 055705. [Google Scholar] [CrossRef]
- Smith, M.W.; Dallmeyer, I.; Johnson, T.J.; Brauer, C.S.; Mcewen, S.; Espinal, J.F.; Garcia-perez, M. Structural analysis of char by Raman spectroscopy: Improving band assignments through computational calculations from first principles. Carbon N. Y. 2016, 100, 678–692. [Google Scholar] [CrossRef]
- Liu, Z.; Duan, X.; Zhou, X.; Qian, G.; Zhou, J.; Yuan, W. Controlling and formation mechanism of oxygen-containing groups on graphite oxide. Ind. Eng. Chem. Res. 2014, 53, 253–258. [Google Scholar] [CrossRef]
- Ţucureanu, V.; Matei, A.; Avram, A.M. FTIR Spectroscopy for Carbon Family Study. Crit. Rev. Anal. Chem. 2016, 46, 502–520. [Google Scholar] [CrossRef] [PubMed]
- Mkhoyan, K.A.; Contryman, A.W.; Silcox, J.; Stewart, D.A.; Eda, G.; Mattevi, C.; Miller, S.; Chhowalla, M. Atomic and electronic structure of graphene-oxide. Nano Lett. 2009, 9, 1058–1063. [Google Scholar] [CrossRef]
- López-Honorato, E.; Meadows, P.J.; Xiao, P. Fluidized bed chemical vapor deposition of pyrolytic carbon—I. Effect of deposition conditions on microstructure. Carbon N. Y. 2009, 47, 396–410. [Google Scholar] [CrossRef]
- Moon, I.K.; Lee, J.; Ruoff, R.S.; Lee, H. Reduced graphene oxide by chemical graphitization. Nat. Commun. 2010, 1, 73. [Google Scholar] [CrossRef]
- Sadezky, A.; Muckenhuber, H.; Grothe, H.; Niessner, R.; Pöschl, U. Raman microspectroscopy of soot and related carbonaceous materials: Spectral analysis and structural information. Carbon N. Y. 2005, 43, 1731–1742. [Google Scholar] [CrossRef]
- Ferrari, A.C. Raman spectroscopy of graphene and graphite: Disorder, electron-phonon coupling, doping and nonadiabatic effects. Solid State Commun. 2007, 143, 47–57. [Google Scholar] [CrossRef]
- Sethuraman, V.A.; Hardwick, L.J.; Srinivasan, V.; Kostecki, R. Surface structural disordering in graphite upon lithium intercalation/deintercalation. J. Power Source 2010, 195, 3655–3660. [Google Scholar] [CrossRef]
- Claramunt, S.; Varea, A.; López-Díaz, D.; Velázquez, M.M.; Cornet, A.; Cirera, A. The importance of interbands on the interpretation of the raman spectrum of graphene oxide. J. Phys. Chem. C 2015, 119, 10123–10129. [Google Scholar] [CrossRef]
- Krishnamoorthy, K.; Veerapandian, M.; Yun, K.; Kim, S.J. The chemical and structural analysis of graphene oxide with different degrees of oxidation. Carbon N. Y. 2013, 53, 38–49. [Google Scholar] [CrossRef]
- Schüpfer, D.B.; Badaczewski, F.; Peilst, J.; Guerra-castro, J.M.; Shim, H.; Firoozabadi, S.; Beyer, A.; Volz, K.; Presser, V.; Heiliger, C.; et al. Monitoring the thermally induced transition from sp3-hybridized into sp2-hybridized carbons. Carbon N. Y. 2020, 172, 214–227. [Google Scholar] [CrossRef]
- Ferrari, A.C.; Robertson, J. Interpretation of Raman spectra of disordered and amorphous carbon. Phys. Rev. B 2000, 61, 95–107. [Google Scholar] [CrossRef]
- Yoshida, A.; Kaburagi, Y.; Hishiyama, Y. Full width at half maximum intensity of the G band in the first order Raman spectrum of carbon material as a parameter for graphitization. Carbon N. Y. 2006, 44, 2333–2335. [Google Scholar] [CrossRef]
- Shin, Y.; Jung, S.; Jeon, I.; Baek, J. The oxidation mechanism of highly ordered pyrolytic graphite in a nitric acid/sulfuric acid mixture. Carbon N. Y. 2019, 52, 493–498. [Google Scholar] [CrossRef]


| Bond | GO | 1.5 M | 5 M | 12 M | Fuming 12 M | 74 μW/cm2 120 h |
|---|---|---|---|---|---|---|
| % | % | % | % | % | % | |
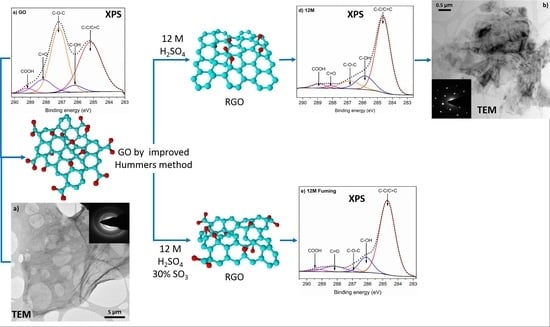
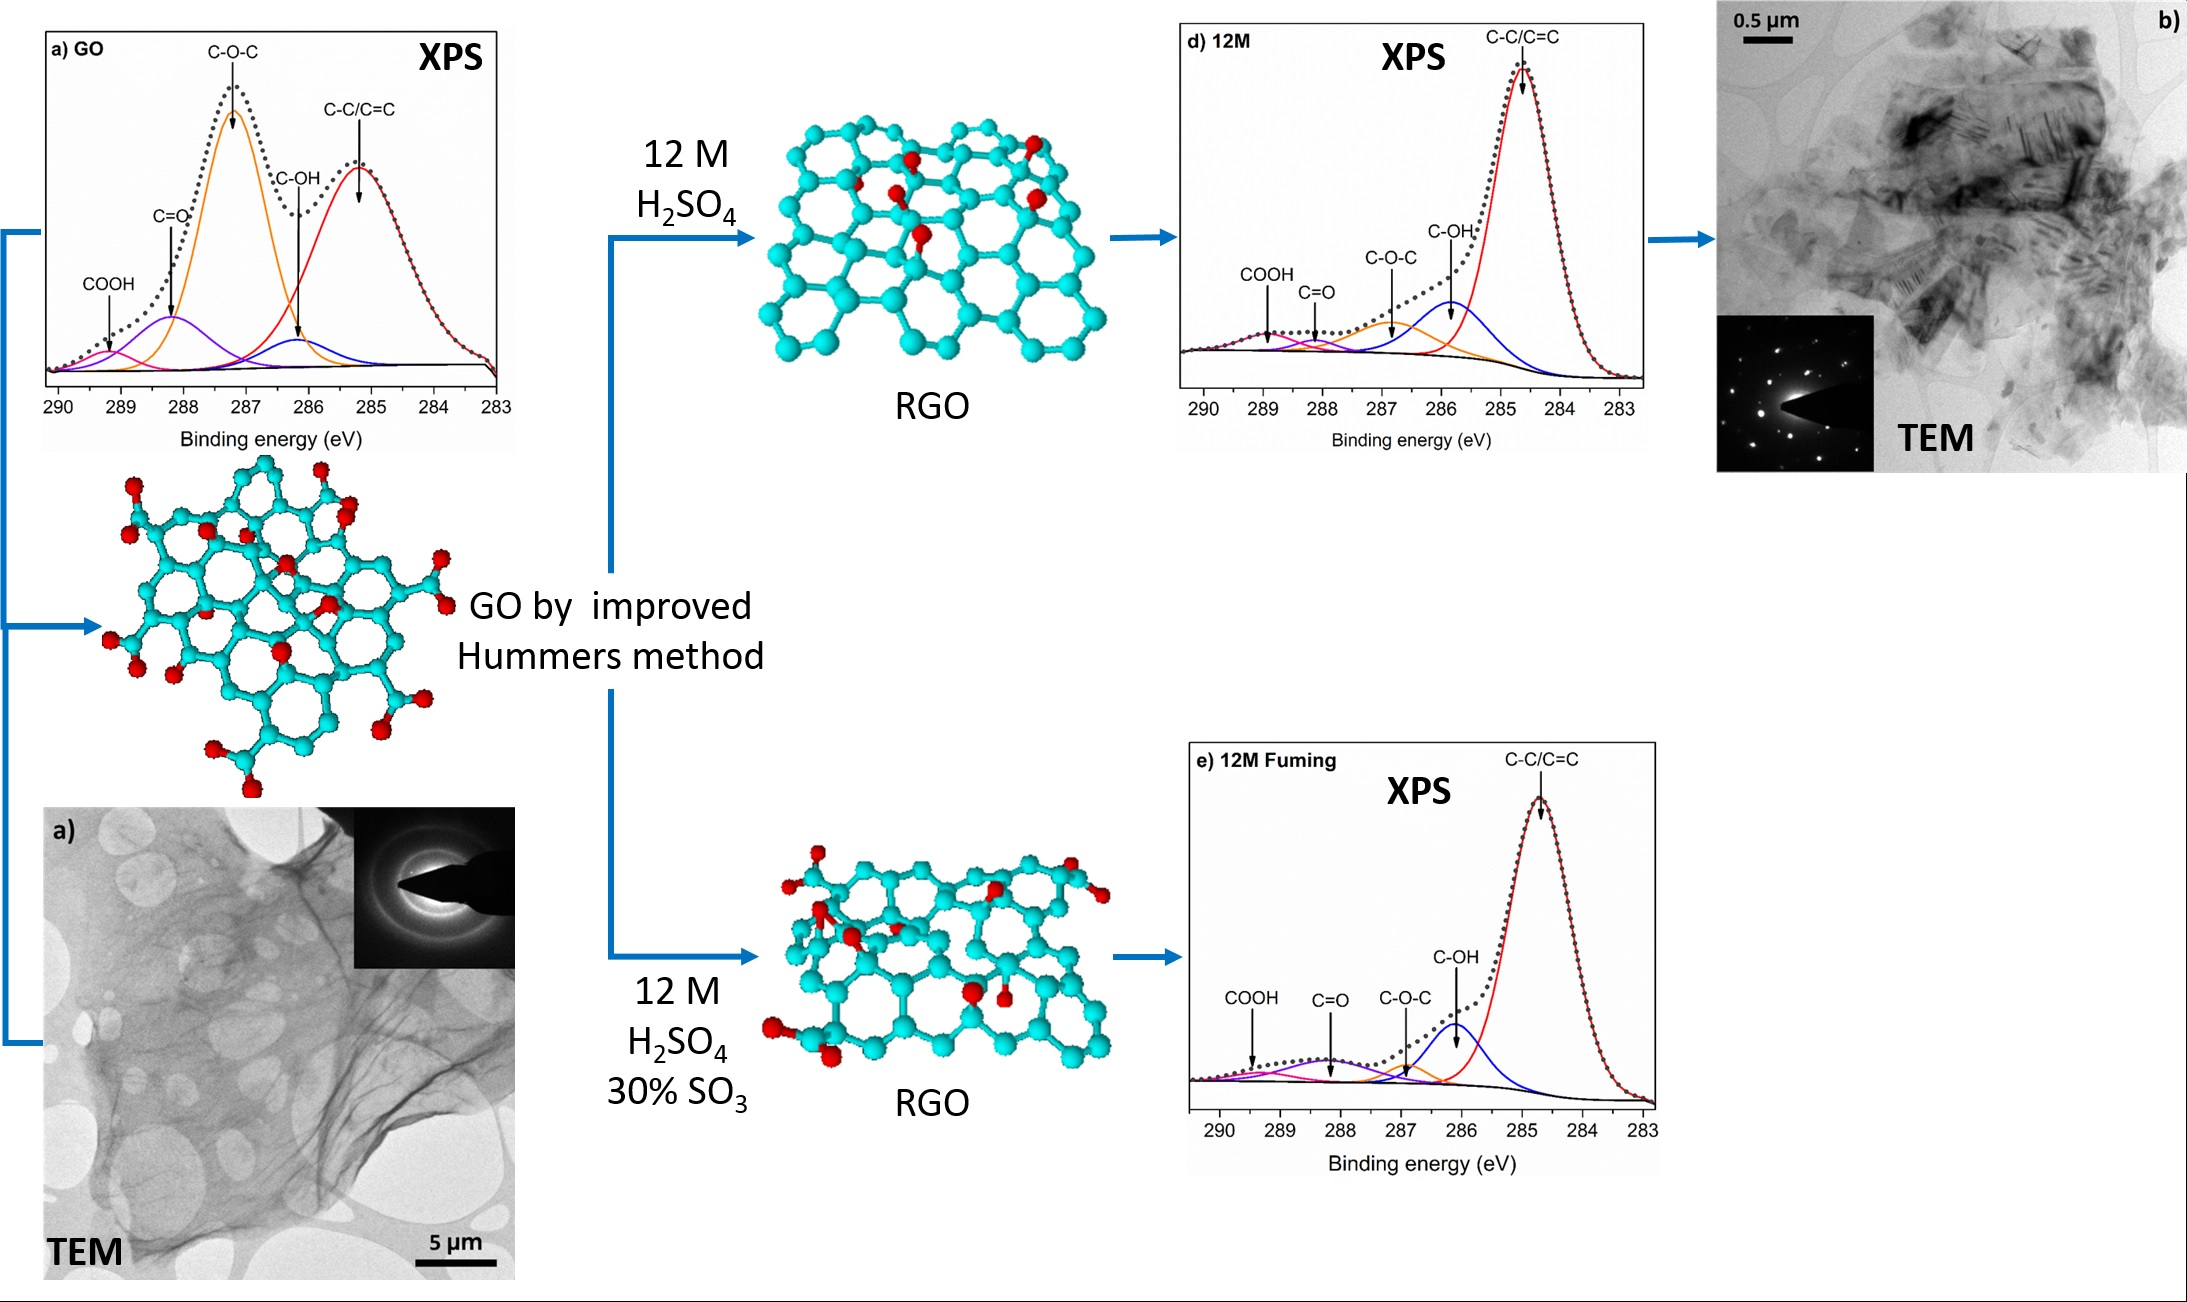
| C-C/C=C | 43.3 | 48.6 | 55.8 | 69.8 | 74 | 61.4 |
| C-OH | 4.3 | 5.5 | 1.9 | 15.1 | 13.4 | 6 |
| C-O-C | 40.4 | 25.2 | 29.7 | 9.7 | 2.9 | 22.9 |
| C=O | 9.6 | 16.4 | 9.0 | 1.8 | 7.5 | 8.6 |
| COOH | 2.3 | 3.7 | 3.6 | 3.6 | 2.2 | 1.1 |
| Carbon At. % | 56.1 | 70.1 | 71.9 | 79.9 | 77.8 | 64.9 |
| Oxygen At. % | 41.3 | 29.9 | 28.1 | 20.1 | 20.9 | 29.8 |
| C/O | 1.4 | 2.3 | 2.6 | 4.0 | 3.7 | 2.2 |
Publisher’s Note: MDPI stays neutral with regard to jurisdictional claims in published maps and institutional affiliations. |
© 2020 by the authors. Licensee MDPI, Basel, Switzerland. This article is an open access article distributed under the terms and conditions of the Creative Commons Attribution (CC BY) license (http://creativecommons.org/licenses/by/4.0/).
Share and Cite
Reynosa-Martínez, A.C.; Gómez-Chayres, E.; Villaurrutia, R.; López-Honorato, E. Controlled Reduction of Graphene Oxide Using Sulfuric Acid. Materials 2021, 14, 59. https://doi.org/10.3390/ma14010059
Reynosa-Martínez AC, Gómez-Chayres E, Villaurrutia R, López-Honorato E. Controlled Reduction of Graphene Oxide Using Sulfuric Acid. Materials. 2021; 14(1):59. https://doi.org/10.3390/ma14010059
Chicago/Turabian StyleReynosa-Martínez, Ana Cecilia, Erika Gómez-Chayres, Rafael Villaurrutia, and Eddie López-Honorato. 2021. "Controlled Reduction of Graphene Oxide Using Sulfuric Acid" Materials 14, no. 1: 59. https://doi.org/10.3390/ma14010059
APA StyleReynosa-Martínez, A. C., Gómez-Chayres, E., Villaurrutia, R., & López-Honorato, E. (2021). Controlled Reduction of Graphene Oxide Using Sulfuric Acid. Materials, 14(1), 59. https://doi.org/10.3390/ma14010059