Cyclic Tests of Smooth and Notched Specimens Subjected to Bending and Torsion Taking into Account the Effect of Mean Stress


Abstract
1. Introduction
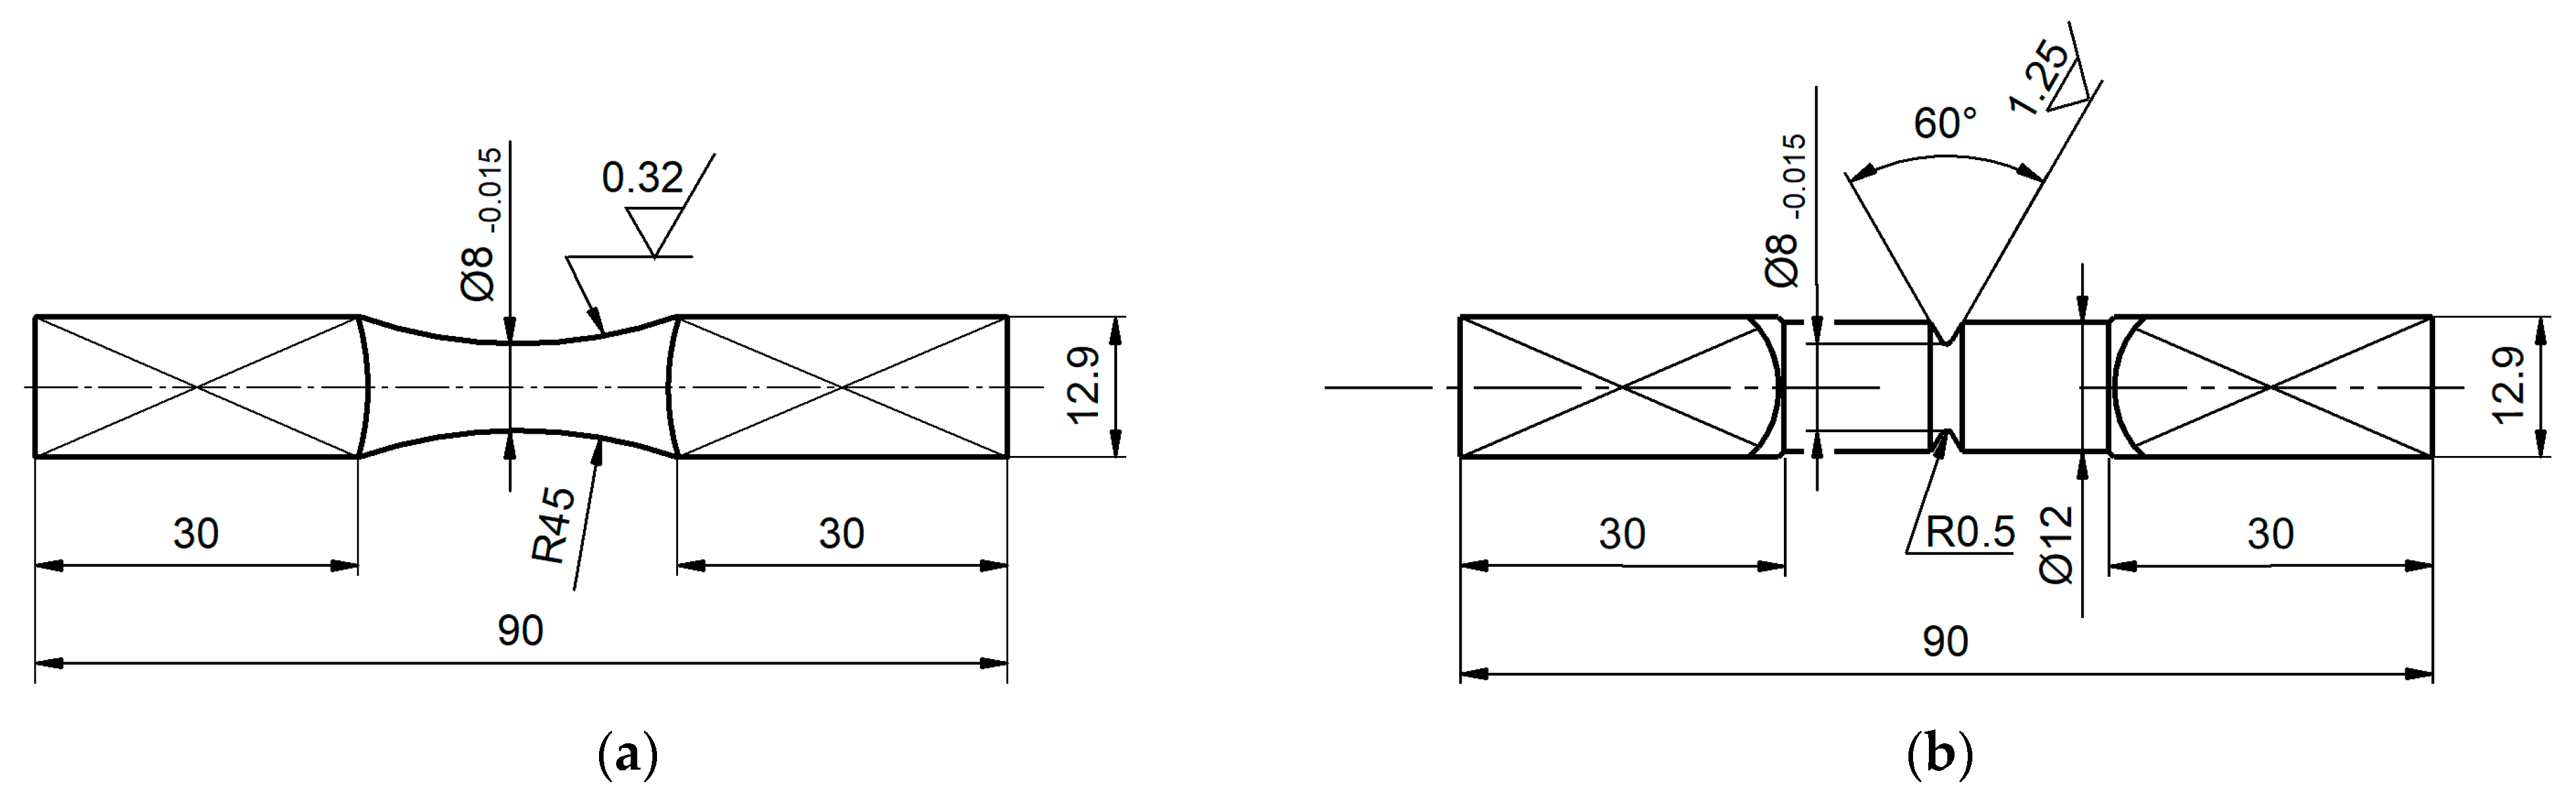
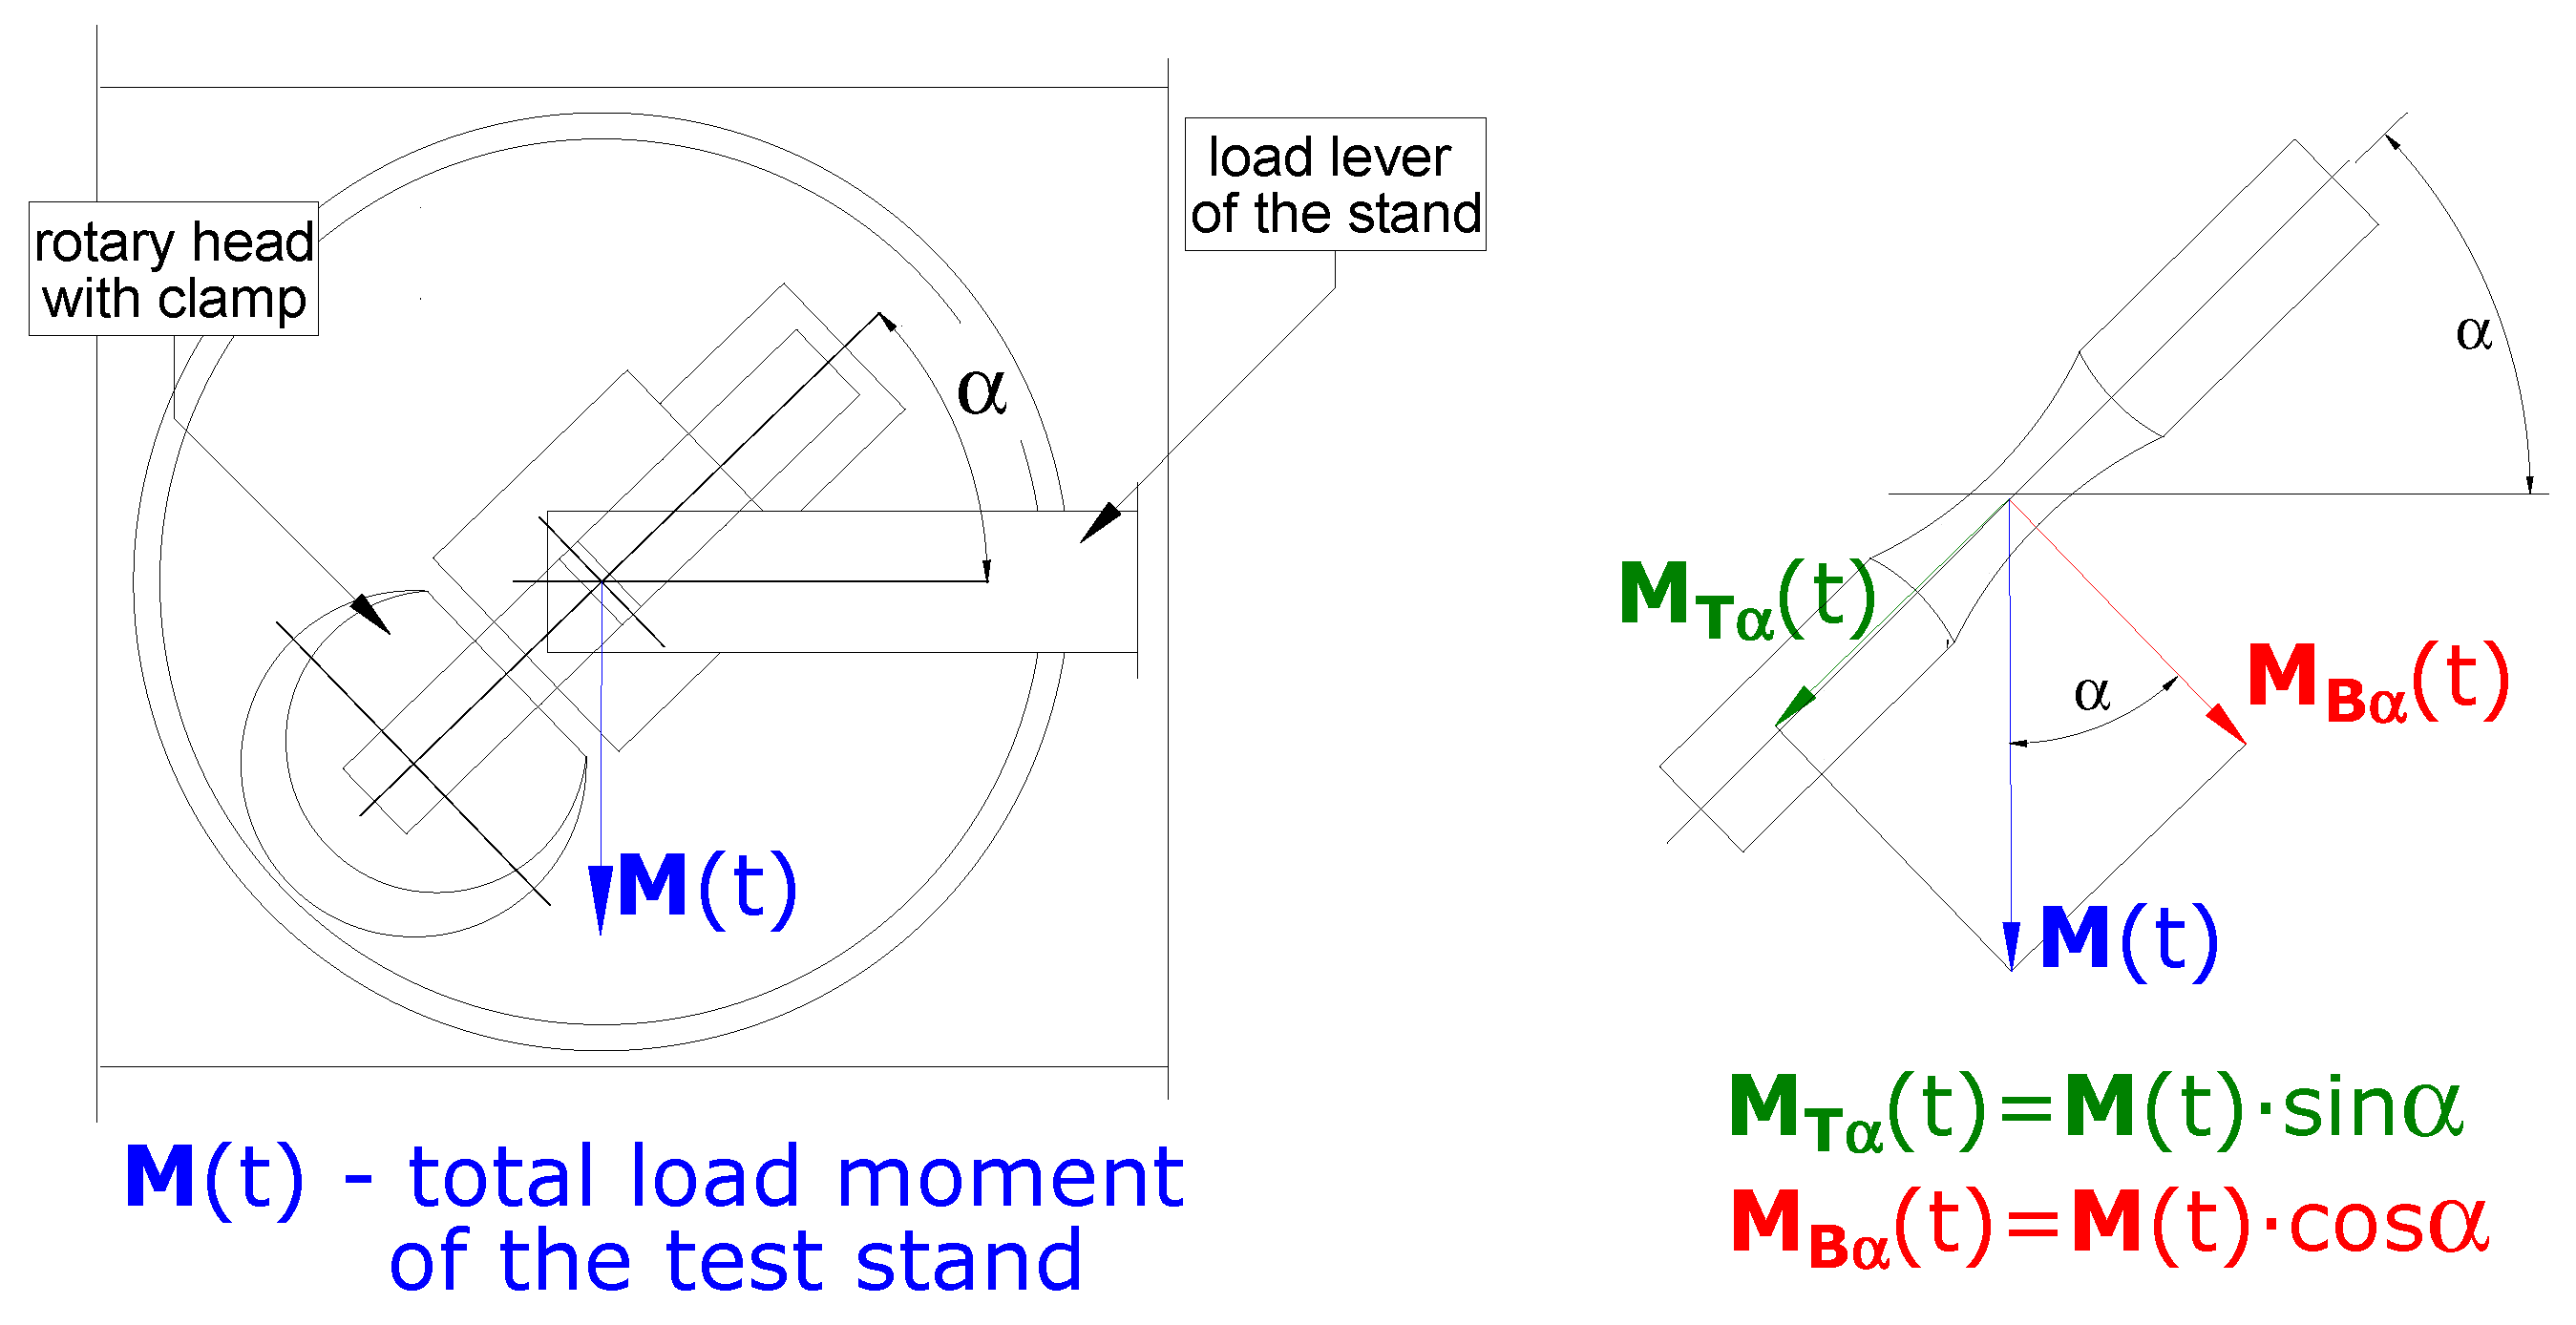
2. Materials and Fatigue Test Stand
3. The Terms of Fatigue Tests
- (a)
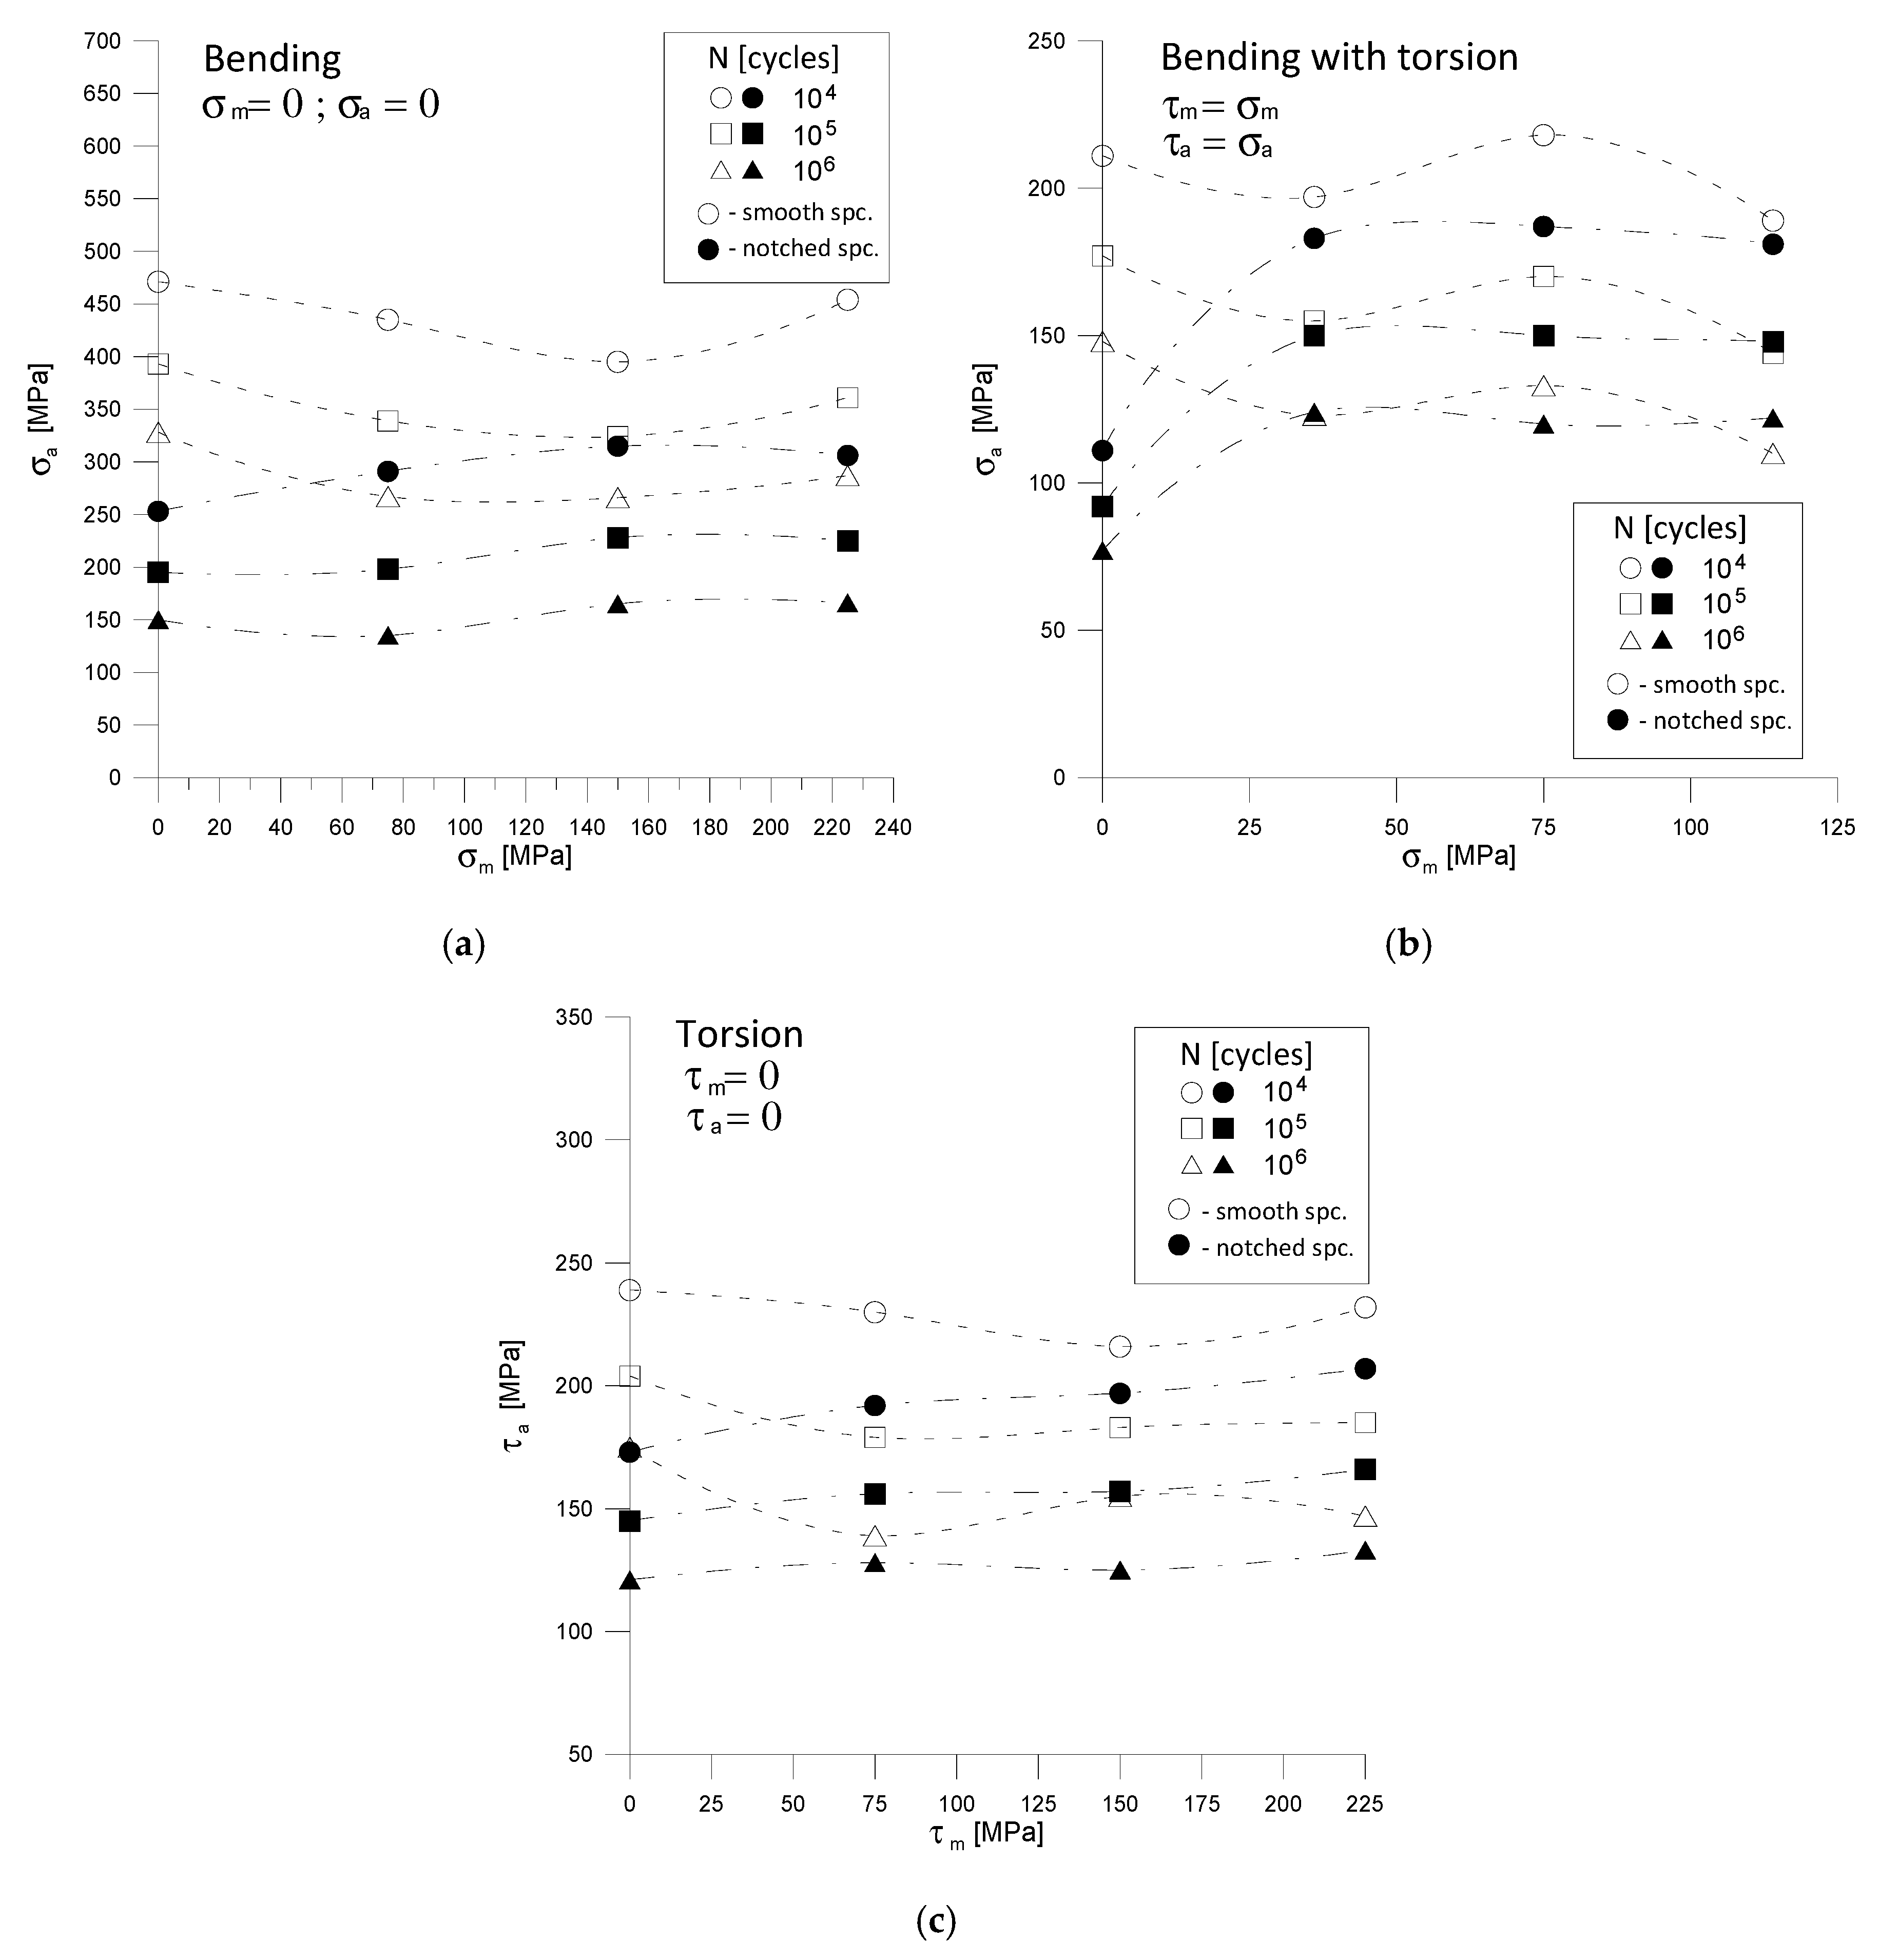
- α = 0 rad (bending),σm = 0 MPa,σm = 75 MPa,σm = 150 MPa,σm = 225 MPa.
- (b)
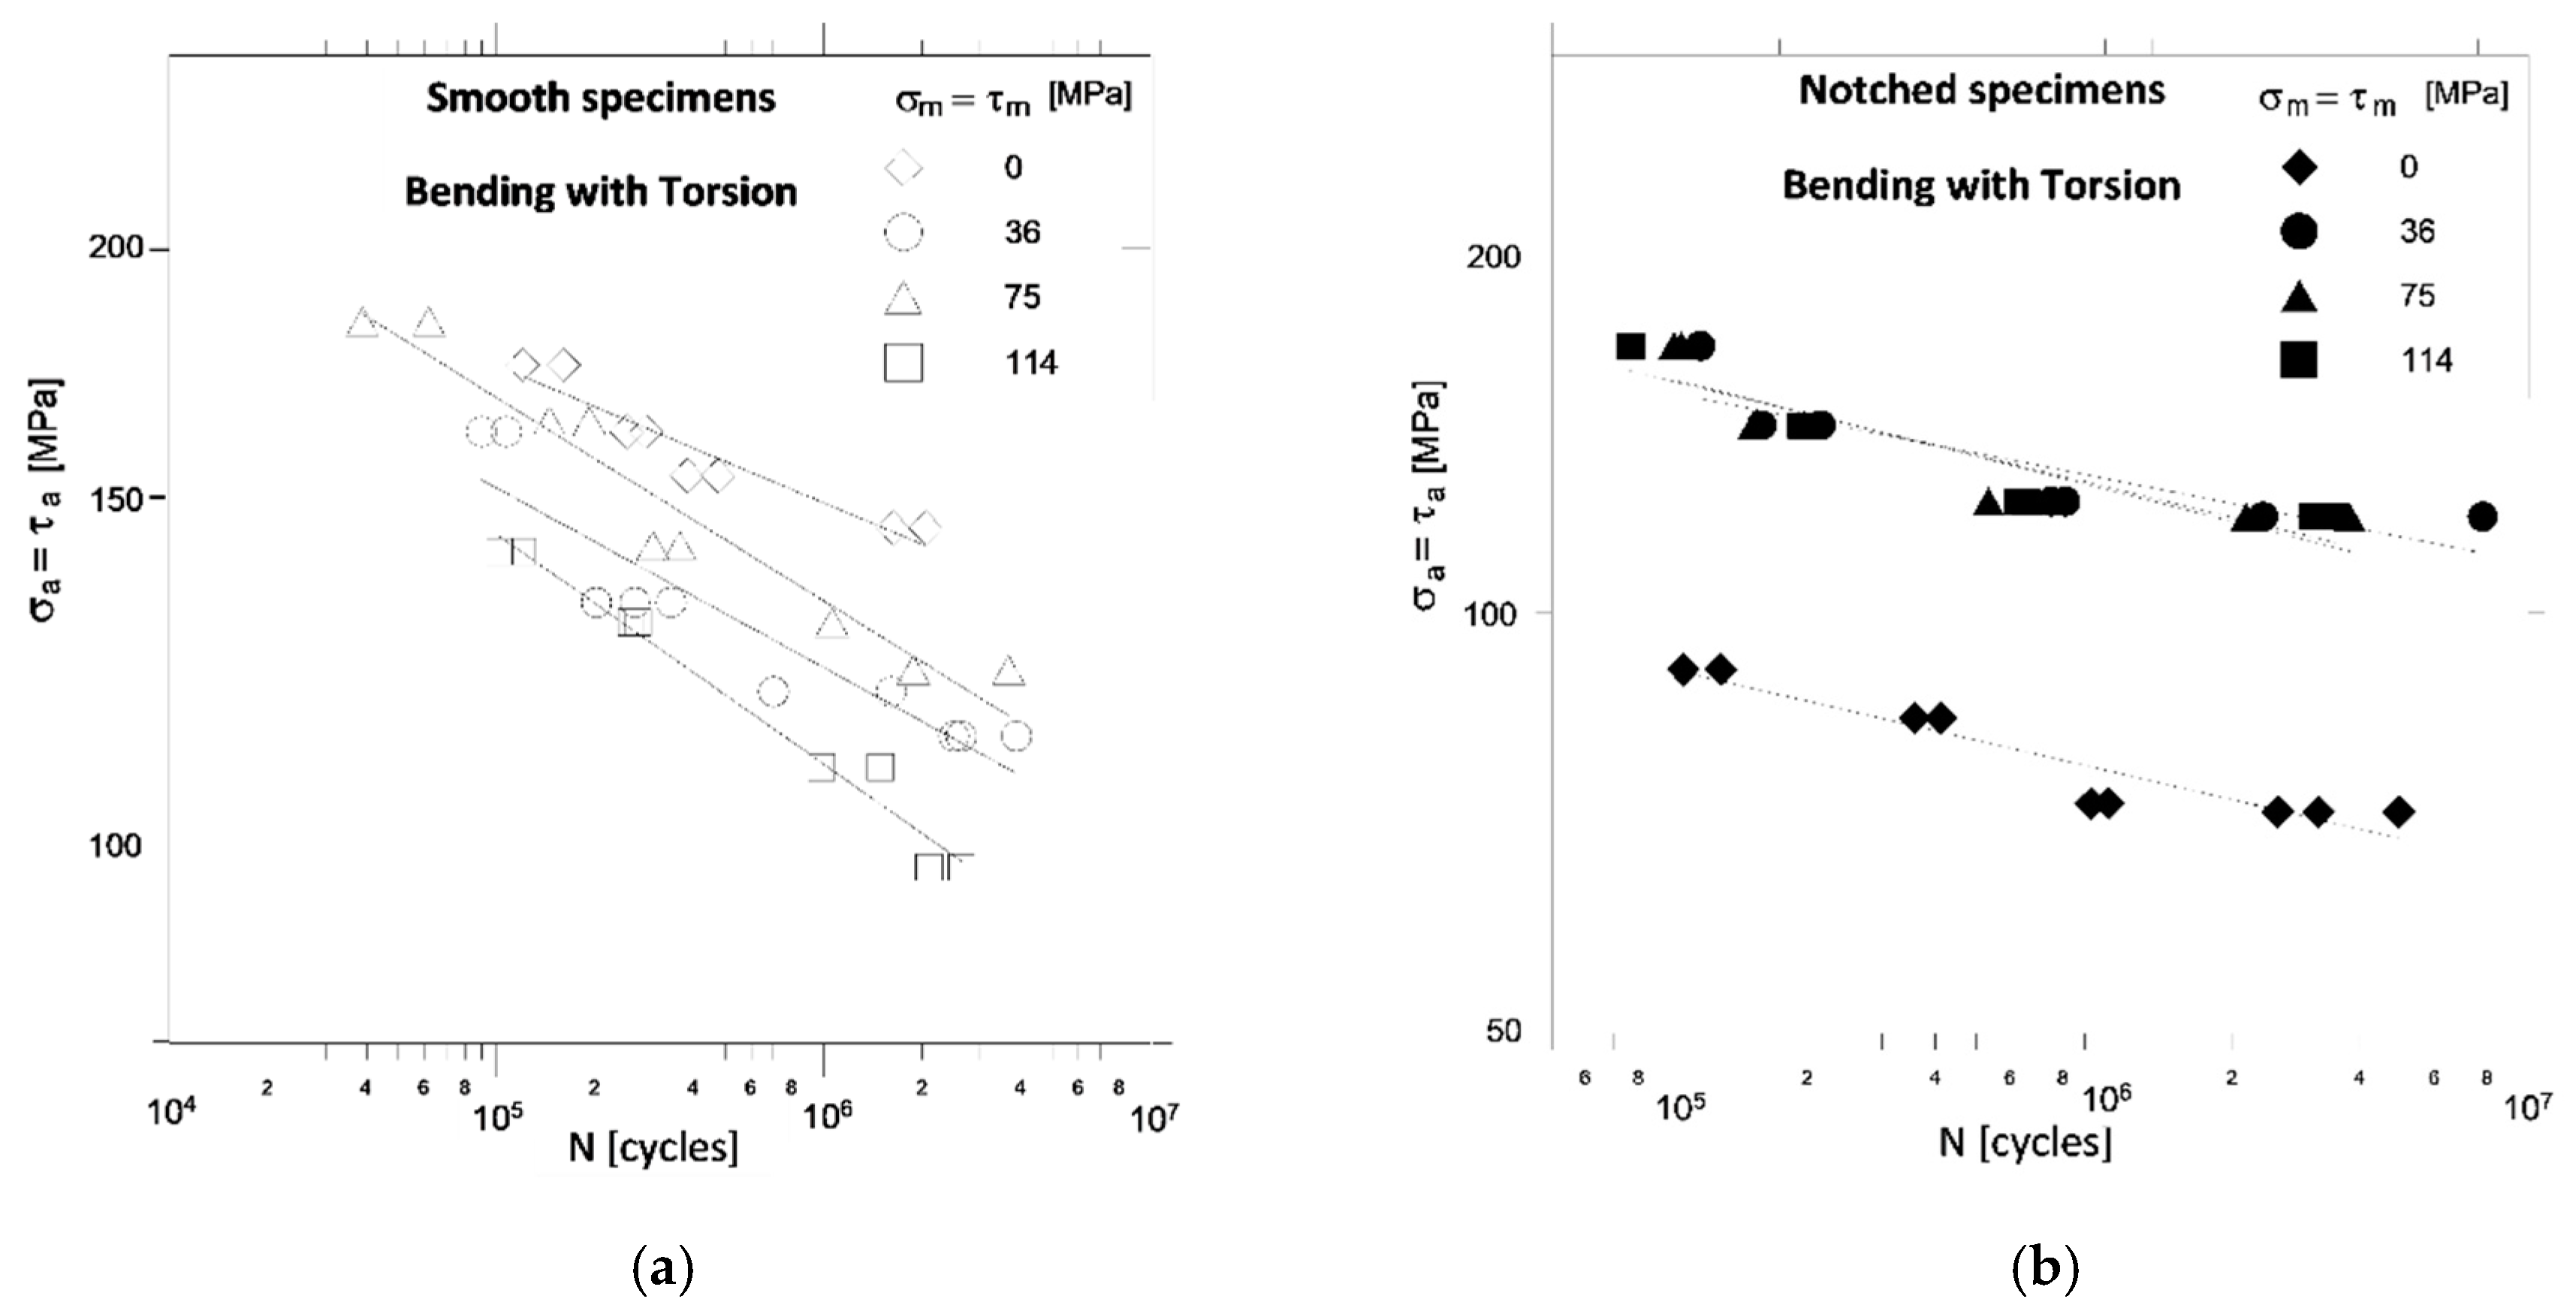
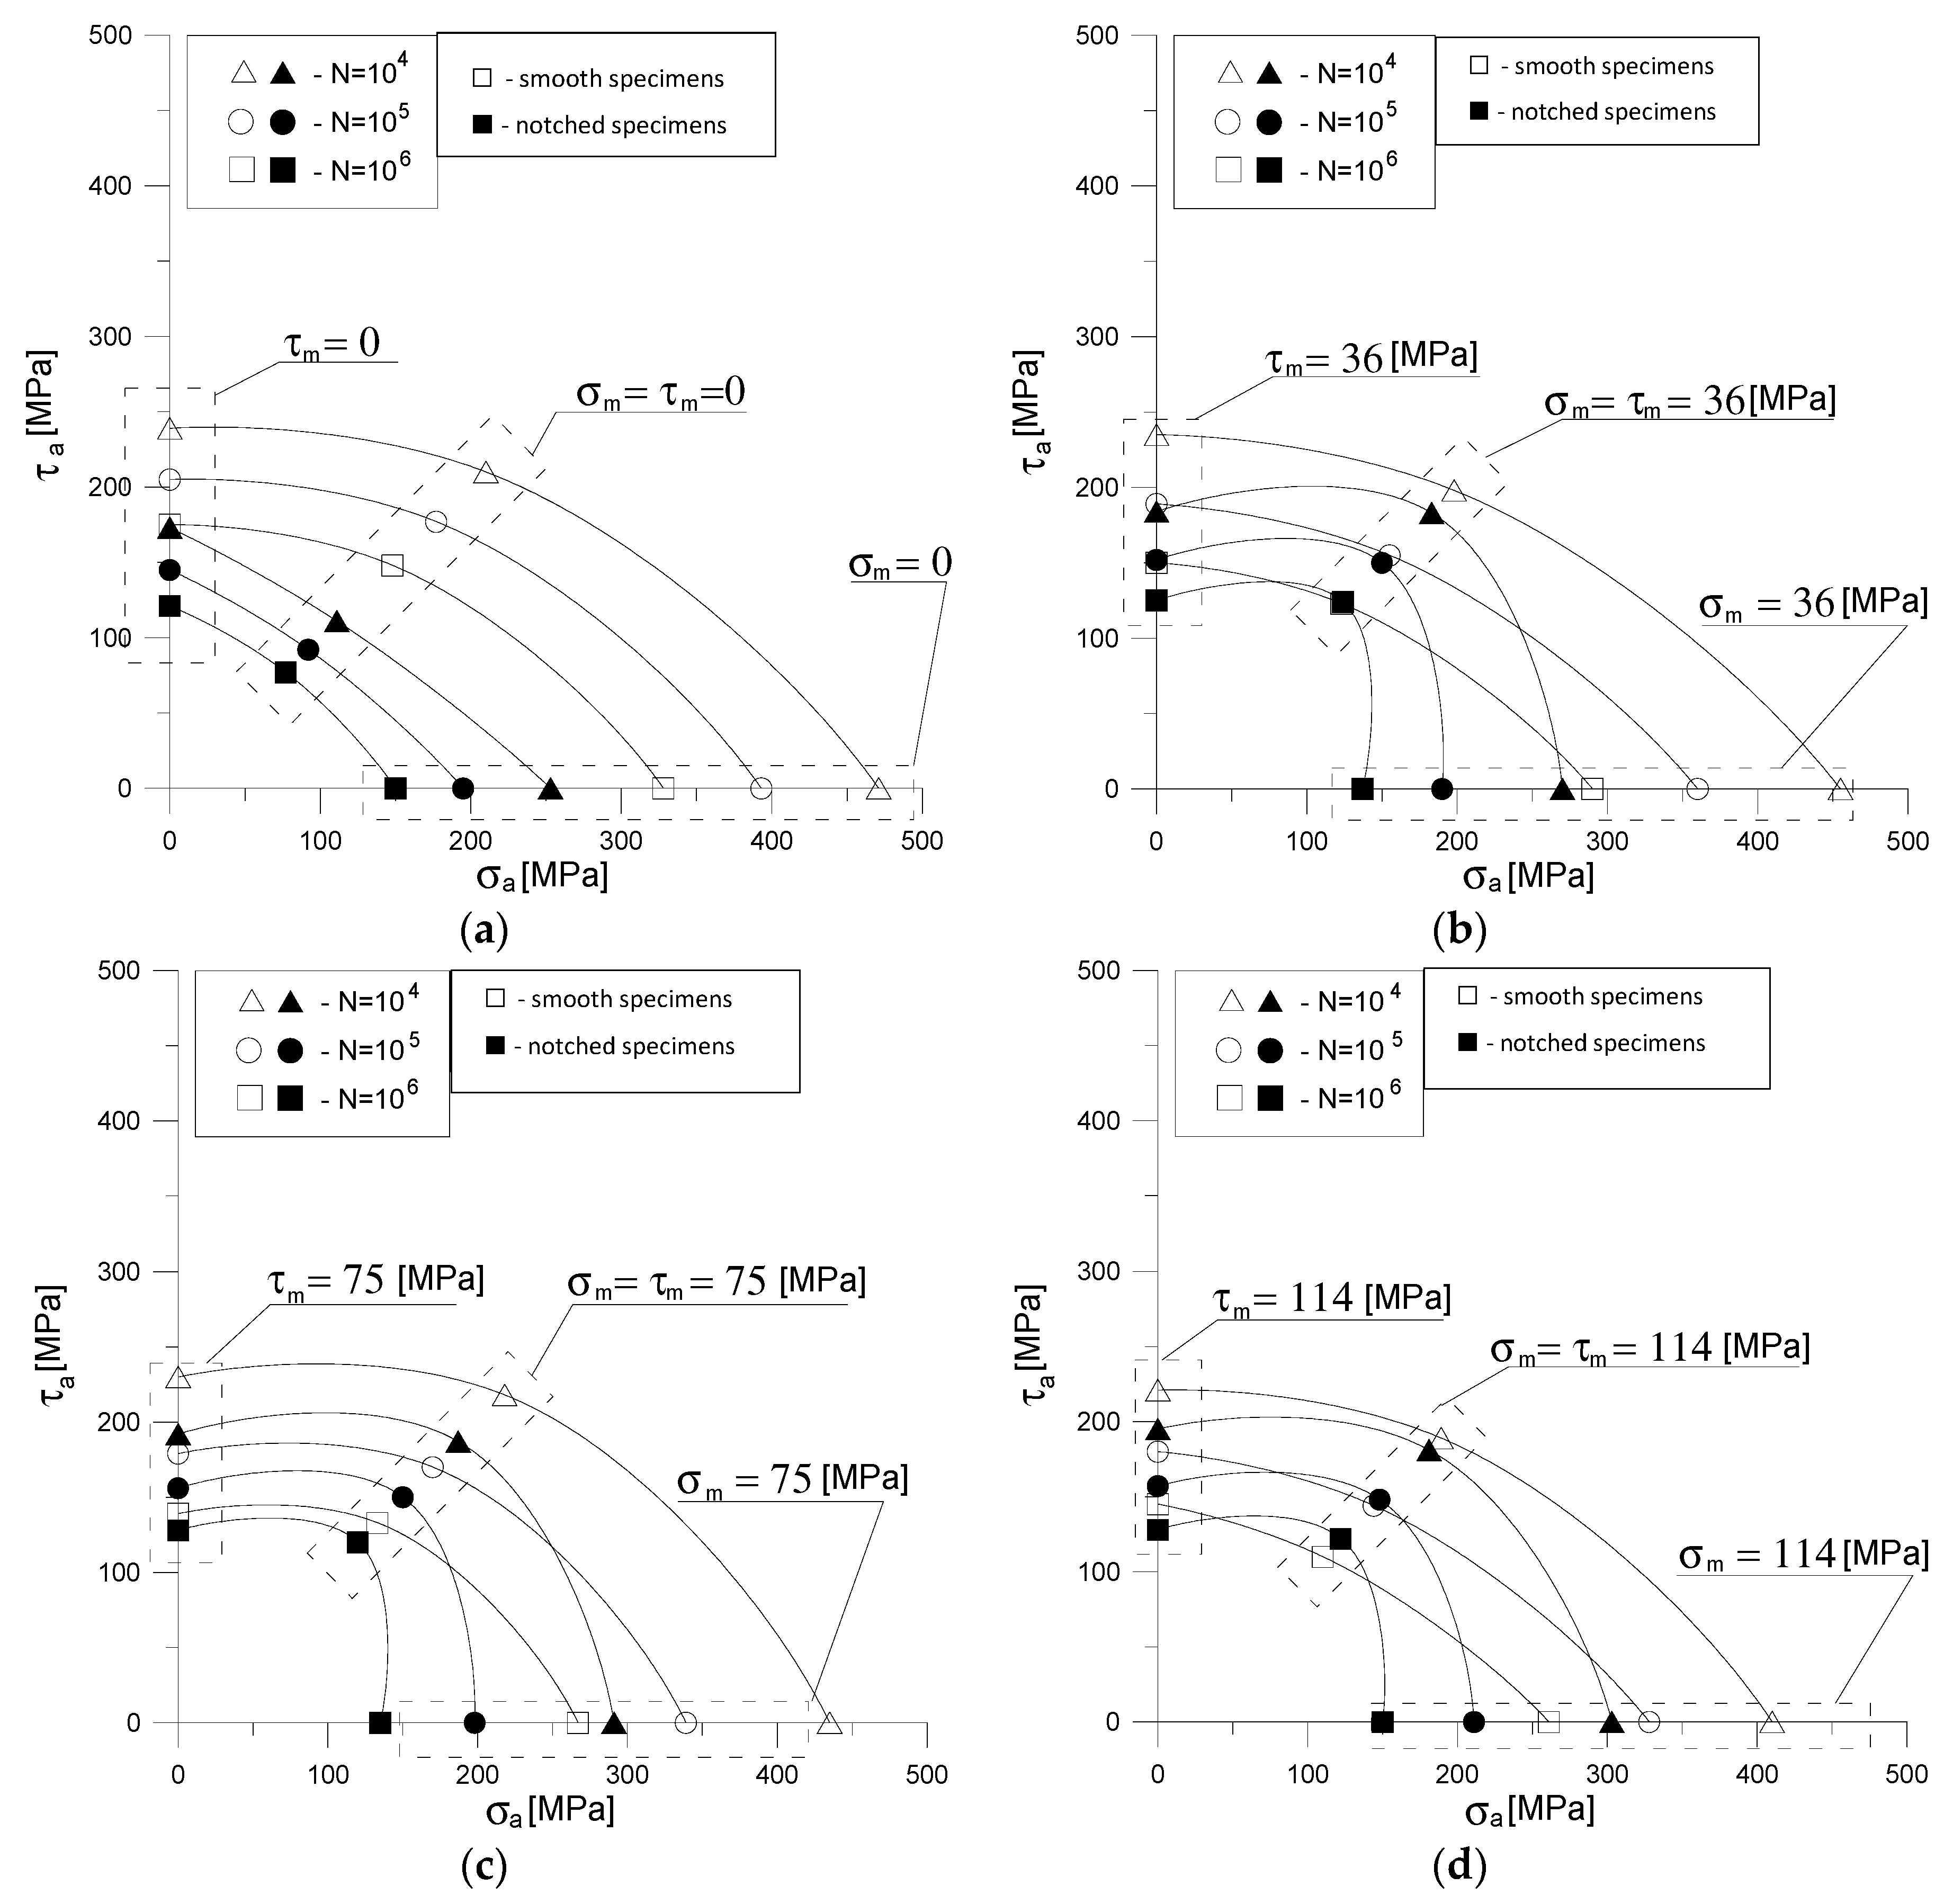
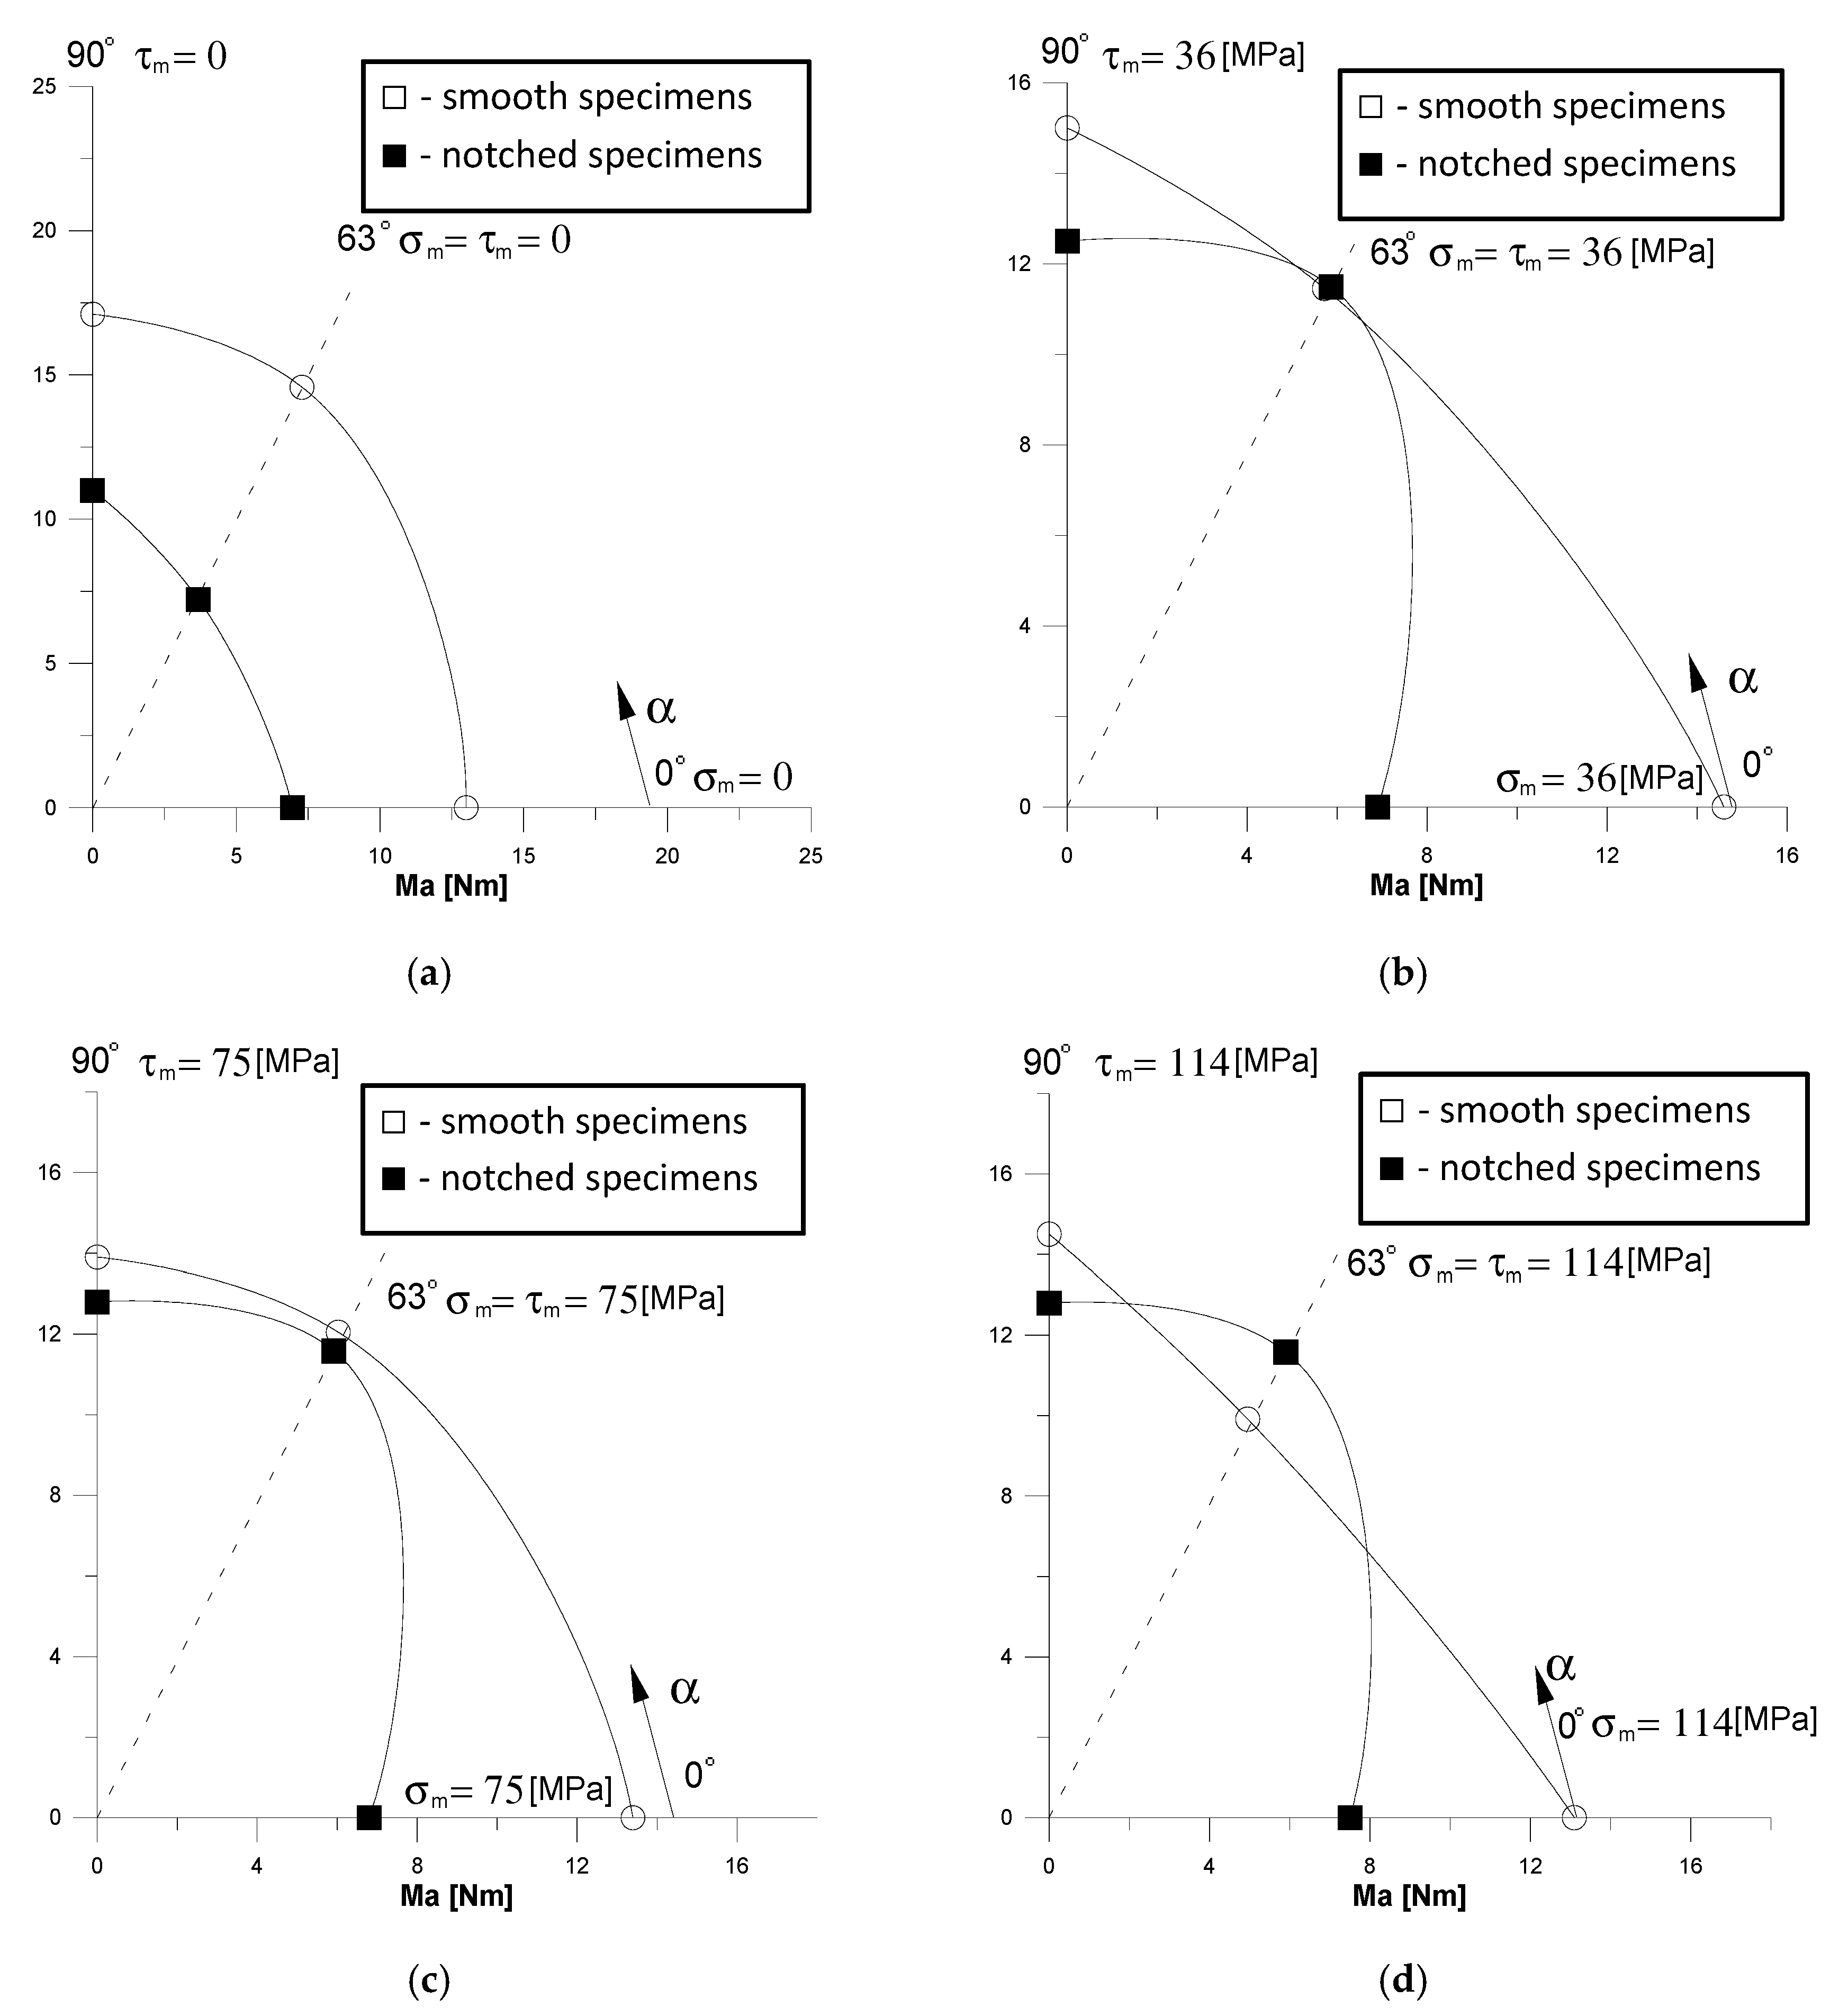
- α = 1.107 rad (63.5°) (bending with torsion)σm = τm = 0 MPa,σm = τm = 36 MPa,σm = τm = 75 MPa,σm = τm = 114 MPa.
- (c)
- α = π/2 rad (torsion)τm = 0 MPa,τm = 75 MPa,τm = 150 MPa,τm = 225 MPa.
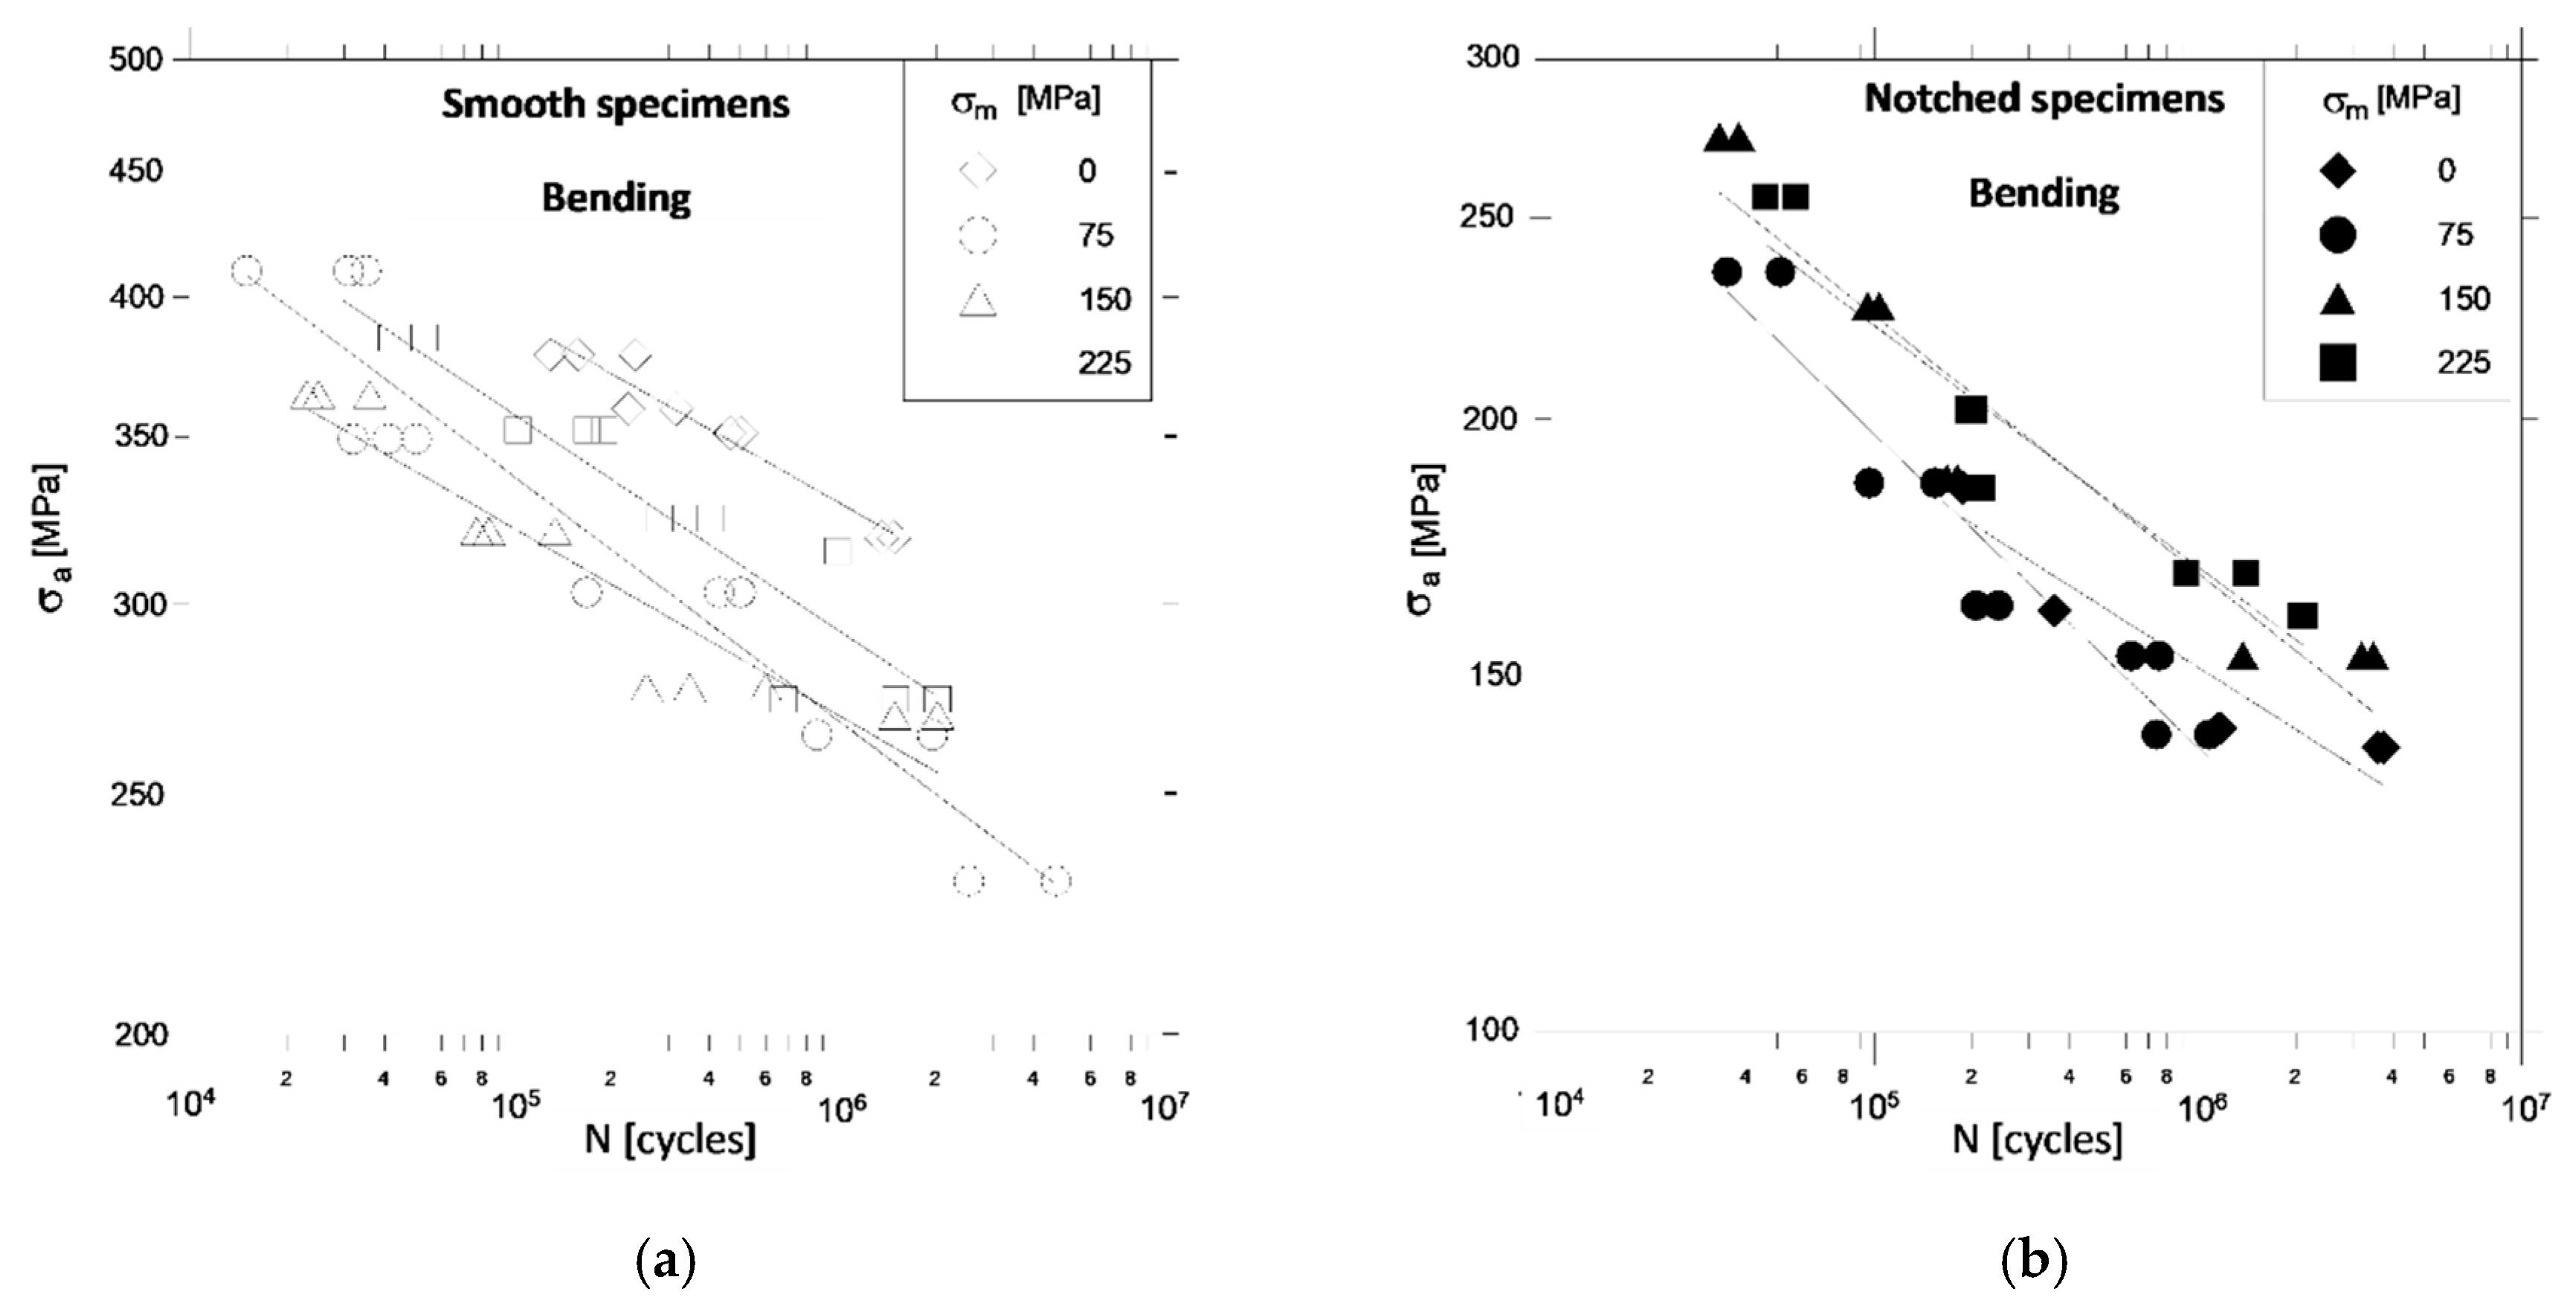
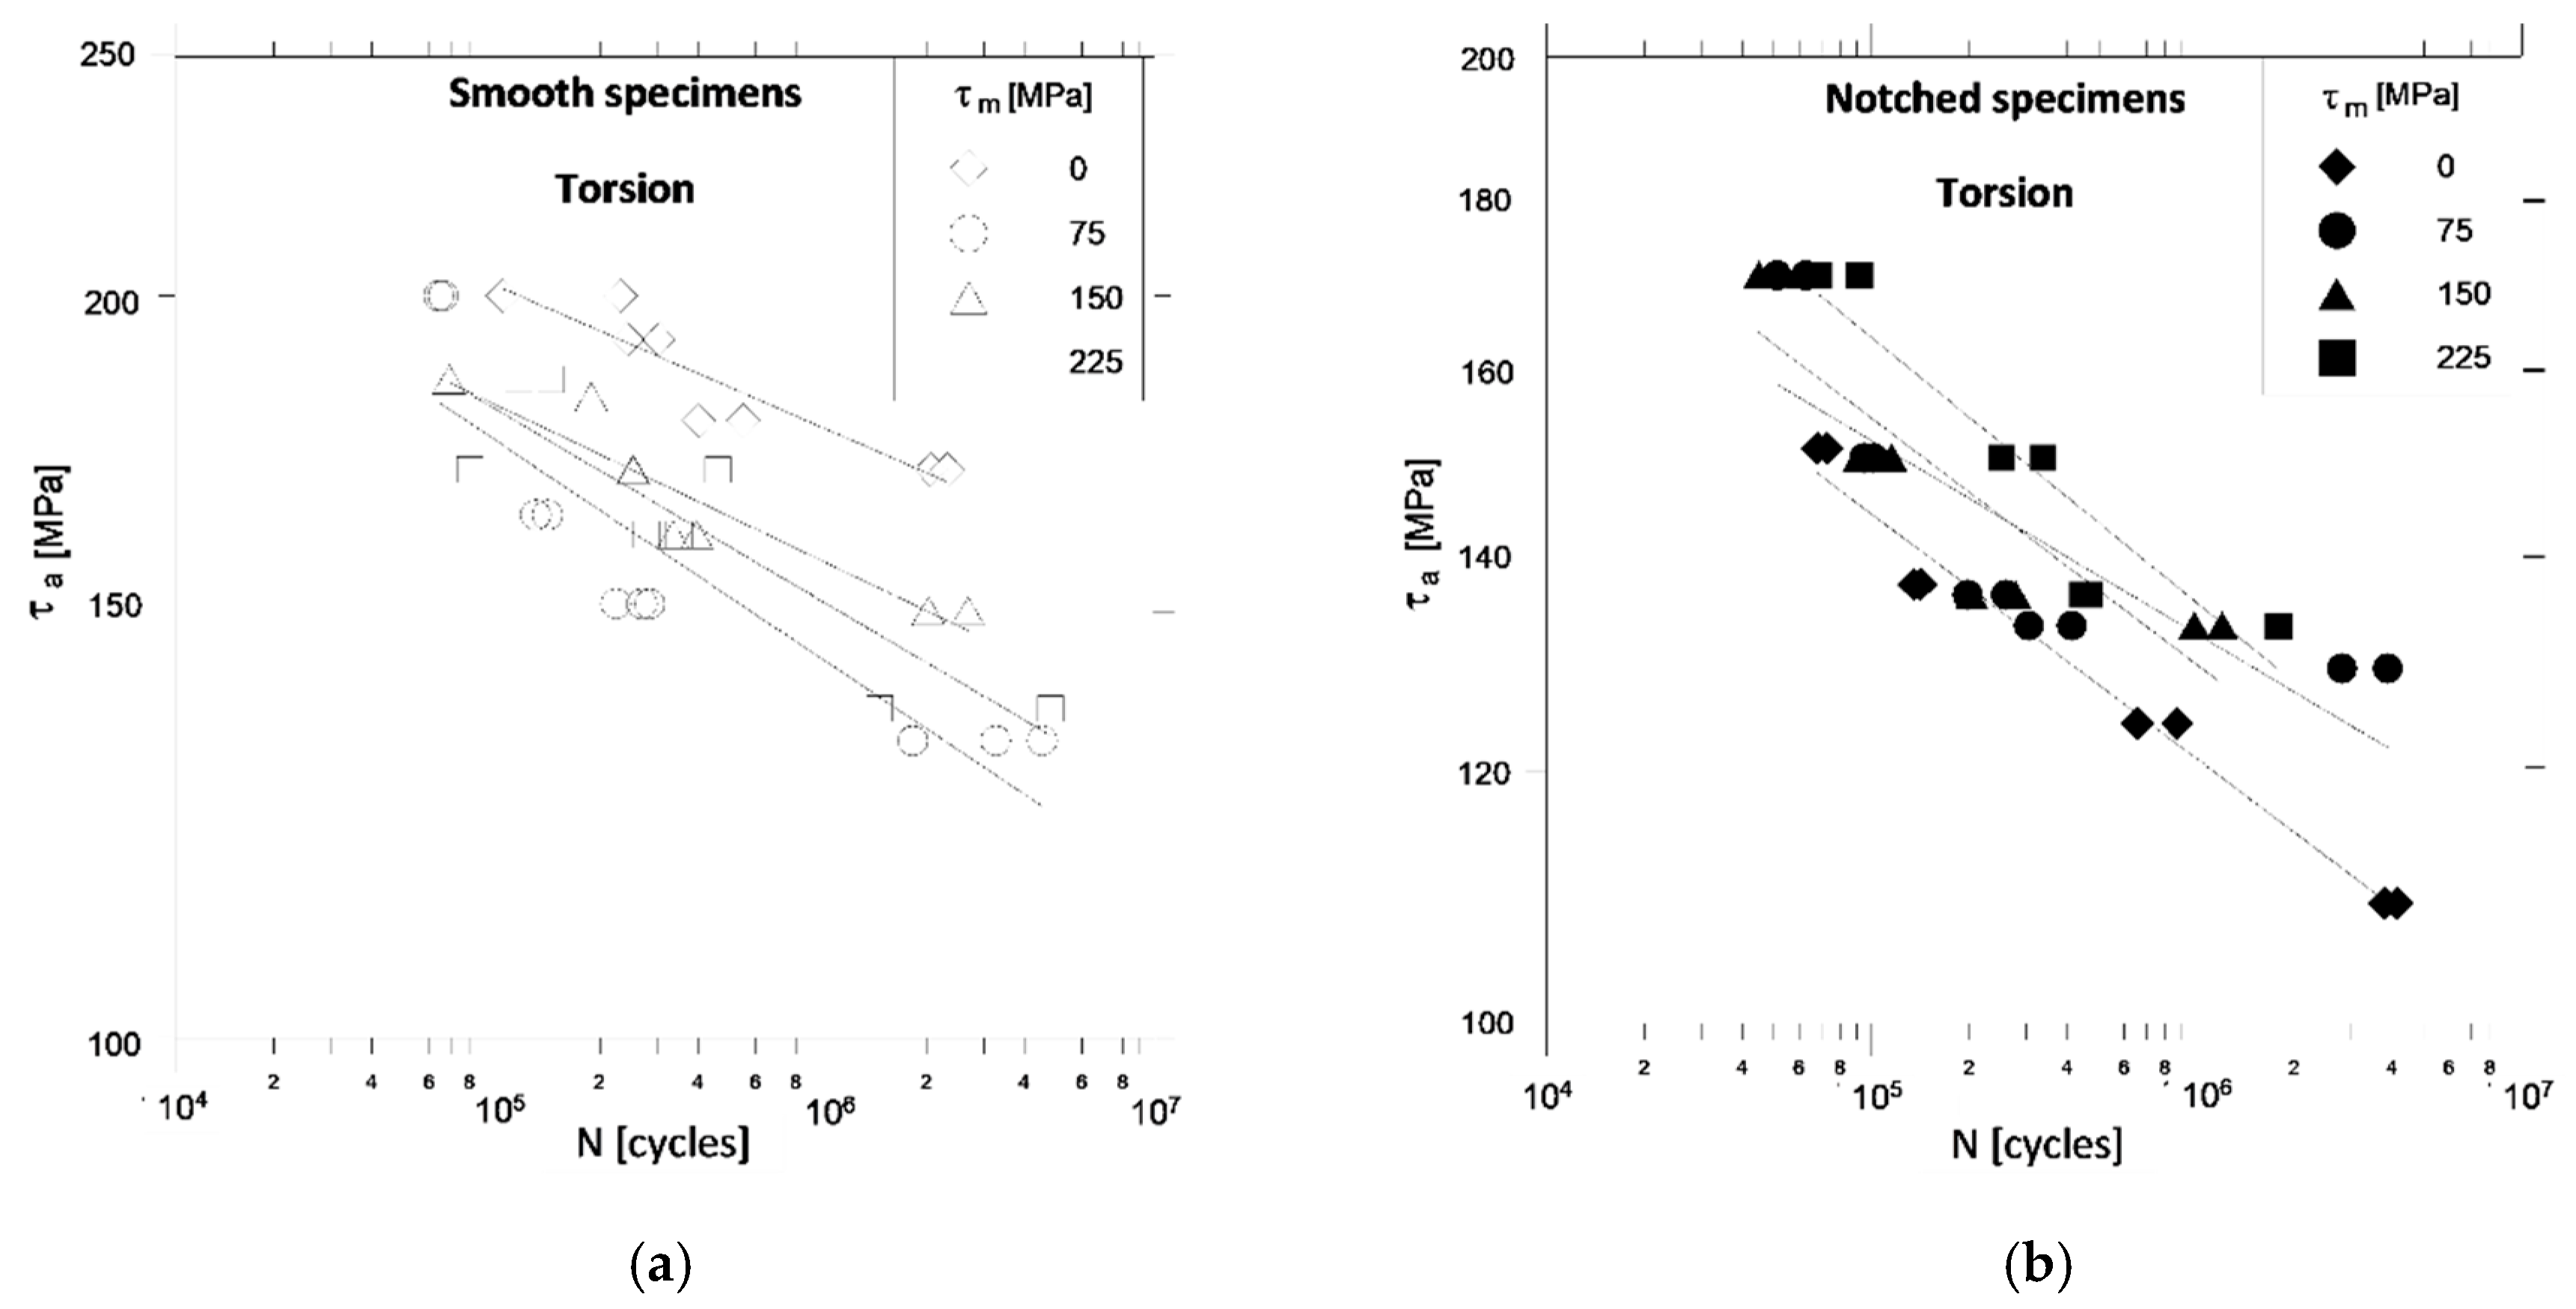
4. Fatigue Characteristics of the Material
5. Conclusions and Finding
- 1
- Notch significantly reduces the allowable nominal stress amplitudes in the case of pure bending and pure torsion, while the effect is smaller in the combination of bending and torsion. These observations confirm the typical behavior of structural steels in machine elements where stress concentrations occur.
- 2
- The greatest effect of the notch on fatigue strength compared to smooth specimens is observed at symmetrical loads. At unsymmetrical loads with non-zero values of mean stress, this effect clearly weakens or disappears and incidentally turned out to be unexpectedly opposite to the general trend in a large number of cycles.
- 3
- In smooth specimens with sufficiently high mean stresses (σm = τm = 225 MPa) and for significantly lower mean stress levels (σm = τm = 36 MPa) in notched specimens there appears the effect of strengthening the material, which indicates the presence of significant plastic deformations.
- 4
- The calculation models proposed for assessing the fatigue life of 10HNAP steel under bending, torsion and combination of bending with torsion taking into account the value of mean stresses and the presence of notches should take into account the appearance of significant local plastic strains, cyclic strengthening of the material and the occurrence of stress gradients in the cross-sections of the rods. Proposals for such models will be the subject of a separate publication by the authors.
Author Contributions
Funding
Conflicts of Interest
References
- Papuga, J. A survey on evaluating the fatigue limit under multiaxial loading. Int. J. Fatigue 2011, 33, 153–165. [Google Scholar] [CrossRef]
- Carpinteri, A.; Spagnoli, A.; Vantadori, S. A review of multiaxial fatigue criteria for random variable amplitude loads. Fatigue Fract. Eng. Mater. Struct. 2017, 40, 1007–1036. [Google Scholar] [CrossRef]
- Lesiuk, G.; Correia, J.; Smolnicki, M.; De Jesus, A.; Duda, M.; Montenegro, P.; Calcada, R. Fatigue crack growth rate of the long term operated puddle iron from the eiffel bridge. Metals 2019, 9, 53. [Google Scholar] [CrossRef]
- Kluger, K.; Pawliczek, R. Assessment of validity of selected criteria of fatigue life prediction. Materials 2019, 12, 2310. [Google Scholar] [CrossRef] [PubMed]
- Pawliczek, R. Influence of the mean load value in fatigue block loading on strains. Key Eng. Mater. 2014, 598, 195–200. [Google Scholar] [CrossRef]
- Glinka, G.; Shen, G.; Plumtree, A. A multiaxial fatigue strain energy density parameter related to the critical fracture plane. Fatigue Fract. Eng. Mater. Struct. 1995, 18, 37–46. [Google Scholar] [CrossRef]
- Rozumek, D.; Marciniak, Z.; Lesiuk, G.; Correia, J.A.; de Jesus, A.M. Experimental and numerical investigation of mixed mode I + II and I + III fatigue crack growth in S355J0 steel. Int. J. Fatigue 2018, 113, 160–170. [Google Scholar] [CrossRef]
- Smaga, M.; Boemke, A.; Daniel, T.; Skorupski, R.; Sorich, A.; Beck, T. Fatigue behavior of metastable austenitic stainless steels in LCF, HCF and VHCF regimes at ambient and elevated temperatures. Metals 2019, 9, 704. [Google Scholar] [CrossRef]
- Atzori, B.; Meneghetti, G.; Susmel, L. Estimation of the fatigue strength of light alloy welds by an equivalent notch stress analysis. Int. J. Fatigue 2002, 24, 591–599. [Google Scholar] [CrossRef]
- McDiarmid, D.L. The effect of mean stress and stress concentration on fatigue under combined bending and twisting. Fatigue Fract. Eng. Mater. Struct. 1985, 8, 1–12. [Google Scholar] [CrossRef]
- Rozumek, D.; Marciniak, Z.; Lachowicz, C.T. The energy approach in the calculation of fatigue lives under non-proportional bending with torsion. Int. J Fatigue 2010, 32, 1343–1350. [Google Scholar] [CrossRef]
- Karolczuk, A.; Macha, E. Critical planes in multiaxial fatigue of materials, monograph. In Fortschritt-Berichte VDI, Mechanik/Bruchmechanik; VDI Verlag: Dusseldorf, Germany, 2005; p. 204. [Google Scholar]
- Rozumek, D.; Marciniak, Z. Fatigue crack growth in AlCu4Mg1 under non-proportional bending with torsion loading. Mater. Sci. 2011, 46, 685–694. [Google Scholar] [CrossRef]
- Standard practice for statistical analysis of linearized stress-life (S-N) and strain-life (ε-N) fatigue data. In Annual Book of ASTM Standards; ASTM E 739-80; ASTM International: Philadelphia, PA, USA, 1989.
- Noda, N.A.; Sera, M.; Takase, Y. Stress concentration factors for round and flat test specimens with notches. Int. J. Fatigue 1995, 17, 163–178. [Google Scholar] [CrossRef]
- Pawliczek, R. Evaluation of fatigue life of specimens made of S355J0 steel under block loading with mean value. AIP Conf. Proc. 2016, 1780, 020006. [Google Scholar]
- Pawliczek, R.; Rozumek, D. The effect of mean load for S355J0 steel with increased strength. Metals 2020, 10, 209. [Google Scholar] [CrossRef]
- Achtelik, H.; Kurek, M.; Kurek, A.; Kluger, K.; Pawliczek, R.; Łagoda, T. Non-standard fatigue stands for material testing under bending and torsion loadings. AIP Conf. Proc. 2018, 2029, 020001. [Google Scholar]
- Kocańda, S.; Szala, J. Basics of Fatigue Calculations; PWN Wars: Warsaw, Poland, 1985; p. 288. [Google Scholar]
- Achtelik, H. Fatigue Strength of Cast Iron at Synchronously Variable Bending and Torsional Load with Different Stress Ratio. Ph.D.Thesis, WSI Opole, Opole, Poland, 1991. (In Polish). [Google Scholar]
- Metallic Materials—Fatigue Testing—Variable Amplitude Fatigue Testing—Part 1: General Principles, Test Method and Reporting Requirements; International Organization for Standardization: Genève, Switzerland, 2013; EN ISO 12110-1:2013.
- Pallarés-Santasmartas, L.; Albizuri, J.; Avilés, A.; Saintier, N.; Merzeau, J. Influence of mean shear stress on the torsional fatigue behaviour of 34CrNiMo6 steel. Int. J. Fatigue 2018, 113, 54–68. [Google Scholar] [CrossRef]
- Gasiak, G.; Pawliczek, R. Application of an energetic model for fatigue life prediction of the construction steels under bending, torsion and synchronous bending and torsion. Int. J. Fatigue 2003, 25, 1339–1346. [Google Scholar] [CrossRef]


| C-0.115 | Mn-0.52 | Si-0.26 | P-0.098 |
| S-0.016 | Cr-0.65 | Ni-0.35 | Cu-0.26 |
| Yeld Strength σY, MPa | Ultimate Strength σU, MPa | Young Modulus E, GPa | Poisson’s Ratio ν |
|---|---|---|---|
| 418 | 566 | 215 | 0.29 |
| Parameters of Regression Equations | Bending | Bending with Torsion | Torsion | |||
|---|---|---|---|---|---|---|
| α = 0° | α = 63.5° (τa = σa) (τm = σm) | α = 90° | ||||
| A | σm = 0 | 38.03 | σm = 0 | 34.62 | τm = 0 | 39.28 |
| σm = 75 | 28.41 | σm = 36 | 26.17 | τm = 75 | 25.50 | |
| σm = 150 | 34.30 | σm = 75 | 25.63 | τm = 150 | 36.45 | |
| σm = 225 | 30.78 | σm = 114 | 23.31 | τm = 225 | 28.00 | |
| m | σm = 0 | −12.73 | σm = 0 | −13.18 | τm = 0 | −14.83 |
| σm = 75 | −9.25 | σm = 36 | −9.66 | τm = 75 | −9.10 | |
| σm = 150 | −11.67 | σm = 75 | −9.25 | τm = 150 | −13.90 | |
| σm = 225 | −10.08 | σm = 114 | −8.48 | τm = 225 | −10.15 | |
| correlation coefficient r | σm = 0 | −0.97 | σm = 0 | −0.95 | τm = 0 | −0.92 |
| σm = 75 | −0.96 | σm = 36 | −0.93 | τm = 75 | −0.90 | |
| σm = 150 | −0.94 | σm = 75 | −0.97 | τm = 150 | −0.94 | |
| σm = 225 | −0.94 | σm = 114 | −0.99 | τm = 225 | −0.89 | |
| variance μlogN | σm = 0 | 9.30 × 10⁻³ | σm = 0 | 2.13 × 10⁻² | τm = 0 | 3.81 × 10⁻² |
| σm = 75 | 6.07 × 10⁻² | σm = 36 | 5.34 × 10⁻² | τm = 75 | 1.01 × 10⁻¹ | |
| σm = 150 | 5.50 × 10⁻² | σm = 75 | 2.86 × 10⁻² | τm = 150 | 3.90 × 10⁻² | |
| σm = 225 | 4.56 × 10⁻² | σm = 114 | 8.22 × 10⁻³ | τm = 225 | 8.67 × 10⁻² | |
| Parameters of Regression Equations | Bending | Bending with Torsion | Torsion | |||
|---|---|---|---|---|---|---|
| α = 0° | α = 63.5° (τa = σa) (τm = σm) | α = 90° | ||||
| A | σm = 0 | 25.13 | σm = 0 | 29.84 | τm = 0 | 32.74 |
| σm = 75 | 18.73 | σm = 36 | 30.45 | τm = 75 | 29.84 | |
| σm = 150 | 21.81 | σm = 75 | 27.74 | τm = 150 | 27.26 | |
| σm = 225 | 22.72 | σm = 114 | 30.34 | τm = 225 | 28.2 | |
| m | σm = 0 | −8.79 | σm = 0 | −12.64 | τm = 0 | −12.84 |
| σm = 75 | −5.98 | σm = 36 | −11.69 | τm = 75 | −11.32 | |
| σm = 150 | −7.13 | σm = 75 | −10.45 | τm = 150 | −10.14 | |
| σm = 225 | −7.53 | σm = 114 | −11.67 | τm = 225 | −10.45 | |
| correlation coefficient r | σm = 0 | −0.94 | σm = 0 | −0.94 | τm = 0 | −0.99 |
| σm = 75 | −0.96 | σm = 36 | −0.89 | τm = 75 | −0.83 | |
| σm = 150 | −0.95 | σm = 75 | −0.90 | τm = 150 | −0.88 | |
| σm = 225 | −0.94 | σm = 114 | −0.93 | τm = 225 | −0.93 | |
| variance μlogN | σm = 0 | 3.64 × 10⁻² | σm = 0 | 4.67 × 10⁻² | τm = 0 | 1.29 × 10⁻² |
| σm = 75 | 2.48 × 10⁻² | σm = 36 | 1.18 × 10⁻¹ | τm = 75 | 1.49 × 10⁻¹ | |
| σm = 150 | 7.06 × 10⁻² | σm = 75 | 8.38 × 10⁻² | τm = 150 | 7.27 × 10⁻² | |
| σm = 225 | 4.61 × 10⁻² | σm = 114 | 6.89 × 10⁻² | τm = 225 | 4.31 × 10⁻² | |
| σm, MPa | Smooth Specimens | Notched Specimens | ||
|---|---|---|---|---|
| Bending | Torsion | Bending | Torsion | |
| 0 | 298 | 169 | 137 | 109 |
| 75 | 229 | 130 | 137 | 124 |
| 150 | 266 | 138 | 161 | 129 |
| 225 | 261 | 134 | 161 | 129 |
© 2020 by the authors. Licensee MDPI, Basel, Switzerland. This article is an open access article distributed under the terms and conditions of the Creative Commons Attribution (CC BY) license (http://creativecommons.org/licenses/by/4.0/).
Share and Cite
Pawliczek, R.; Rozumek, D. Cyclic Tests of Smooth and Notched Specimens Subjected to Bending and Torsion Taking into Account the Effect of Mean Stress. Materials 2020, 13, 2141. https://doi.org/10.3390/ma13092141
Pawliczek R, Rozumek D. Cyclic Tests of Smooth and Notched Specimens Subjected to Bending and Torsion Taking into Account the Effect of Mean Stress. Materials. 2020; 13(9):2141. https://doi.org/10.3390/ma13092141
Chicago/Turabian StylePawliczek, Roland, and Dariusz Rozumek. 2020. "Cyclic Tests of Smooth and Notched Specimens Subjected to Bending and Torsion Taking into Account the Effect of Mean Stress" Materials 13, no. 9: 2141. https://doi.org/10.3390/ma13092141
APA StylePawliczek, R., & Rozumek, D. (2020). Cyclic Tests of Smooth and Notched Specimens Subjected to Bending and Torsion Taking into Account the Effect of Mean Stress. Materials, 13(9), 2141. https://doi.org/10.3390/ma13092141