Abstract
Exterior car-body parts are made of steel or aluminum sheets. Their formability and appearance after painting depends not only on the mechanical properties but also on their surface texture. The surface roughness characteristics, the roughness average Ra and the peak count Pc per centimeter depend on the texture of rolling mill’s finishing rollers, their wear and the degree of removal by the rolling mill. The research was carried out on heat-treated finishing rollers on the surface of which a controlled texture was created by changing the electro-discharge texturing (EDT) parameters. Parameters and the number of electro-discharge texturing experiments were optimized using full four-factor experiment techniques at the upper and lower levels of the parameters in the form of 24. The significance of the impact of individual EDT parameters and their interactions was identified based on the variance results. The ANOVA variance analysis results confirmed that the roughness Ra and the peak count Pc depend primarily on peak current (Ip), discharge peak voltage (Up), pulse on time (Pont) and pulse off time (Pofft). Optimization of the effect of the above parameters on the target roughness RaT,FR values and the peak count PcT,FR of finishing rollers was performed by the response surface methodology (RSM). Obtained regression models describe relationships between the input parameters of the electro-discharge texturing of finishing rollers and the output characteristics of the RaT,FR and the PcT,FR texture to a very high degree. The reliability of the electro-discharge texturing process of working rollers was assessed using the process capability index Cpk.
1. Introduction
When presented with a choice of similar products sold at a similar price on the market, the customer often makes a choice based on their quality. The concept of quality is very broad and largely depends on the customer’s individual requirements. As the quantity of goods on offer increases, the quality requirements become more and more objective. The quality of products is characterized by a set of measurable features, which allow it to be monitored and controlled. For example, in the case of sheets for the car-body panels, not only are the mechanical properties of the sheets emphasized, the texture of their surfaces also receives due attention to guarantee the formability and appearance of the body parts after painting. The regulated texture of the sheet metal surfaces helps to retain the lubricant on the tool’s contact surfaces during the forming processes and thus contributes to improve their formability and final appearance of body parts after painting [1,2,3].
The sheets for the car-body parts are manufactured in a special mode on the galvanizing line, which includes more thorough strip input control (cleanliness, geometry, surface defects, etc.), annealing speed, galvanizing bath parameters, rolling mill parameters and finishing roller texture parameters (RaFR roughness and peak count PcFR). During the finishing rolling, the texture of rolling mill’s finishing rollers is transferred to the surface of the steel sheet. Transfer of the texture from rollers to the sheet surface depends largely on removal done by the rolling mill, the texture of finishing rollers and the wear of finishing rollers. The wear of finishing rollers also depends on the texturing technology. When the texture is done by shot blasting technology (SBD) the wear is up to 38%, for electro-discharge technology (EDT) the wear is up to 32%, for hard chromed electro-discharged texture (EDT Hard Chrome) the wear is up to 23% and for Topocrom technology the wear is up to 8% [4,5].
Individual car manufacturers require different target values of sheet metal texture. Hence, Skoda Auto requires for the steel sheets when used for the outside car body parts the arithmetic mean roughness value Ra = 1.1–1.6 µm and the peak count Pc ≥ 40 cm−1; Ford requires the arithmetic mean roughness value Ra = 1.1–1.7 µm and the peak count Pc ≥ 50 cm−1 and Volkswagen requires the arithmetic mean roughness value Ra = 1.1–1.6 µm and the peak count Pc ≥ 60 cm−1 [4,5]. The desired texture values of the sheet metal surfaces cannot be achieved by rolling mills with rollers mechanically blasted with fine-grain shots (SBT—shot blast texturing). Mechanical blasting of working rollers results in a stochastic texture creation, which cannot be controlled. For these reasons, use of stochastic systems of texturing finishing rollers by the method of shot blast texturing has been abandoned in favor of deterministic texturing systems: electric discharge texturing (EDT), laser beam texturing (LBT), electron beam texturing (EBT) or the Topocrom method [4,5,6,7].
In application of electro-discharge texturing, the material is removed by repeated discharges that cause local melting or evaporation of material from the surface of the heat-treated roller [8]. The resulting texture of working rollers depends on the size of craters, or on the amount of material removed Qvi.
where the amount of energy of a single discharge
where k is the proportionality factor for the anode and cathode; f is the discharge frequency (s−1); r is the electric discharge efficiency (%); ke is the generator efficiency (%); Ei is the single discharge energy (J); t is the length of discharge duration—Pont (µs); UP is the discharge voltage (V) and IP is the peak current (A).
Laser beam texturing (LBM) allows for creation of a regular or pseudo stochastic surface texture with crater overlay and increased wear resistance of the working rollers. Electro-discharge texturing (EDT) can produce a wide range of RaFR roughness from 0.5 to 10 μm with a PcFR peak count up to 150 cm−1, with a uniform microrelief surface, good reproducibility of the surface texture of the finishing roller and its transfer to the sheet surface [7]—Table 1. Likewise, electron beam texturing (EBT) opens a large window into creating surfaces with a wide range of RaFR parameters. However, the texture obtained is not the most desirable in terms of tribological conditions on contact surfaces of the die, since worsened sheet formability can be expected as a result.

Table 1.
Comparison of selected parameters for texturing methods.
Topocrom texturing of the working rollers is based on the elimination of chrome hemispherical segments on the surface of the finishing rollers. The number and dimensions of hemispherical segments (RaFR roughness and the PcFR texture peak count) can be varied to a large extent with a small scatter along the entire length of the finishing roller by changing parameters of electrolytic deposition. Long service life is typical for finishing rollers made by the Topocrom technology [5].
EDT, LBT, EBT and Topocrom working roller processes are progressive, but considerably complicated. Setting these process parameters by trial and error techniques is ineffective. By optimizing the input parameters of these processes, it is possible to control the process of texturing the finishing rollers to meet the ever-increasing surface quality requirements of sheets intended for bodywork parts.
Studies related to the EDM have shown that the process performance can be considerably improved by properly selecting the process material and operating parameters. Since the EDM process has a very complex nature due to the complicated discharge mechanisms and their interactions, parameter optimization appears to be a hot research area [9]. In [10] authors optimized process parameters after die-sinking EDM of tool steel. They suggested mathematical models for the determination of the optimal combination of significant technological parameters in order to minimize microhardness and total HAZ depth variations of tool steel EN X32CrMoV12-28 after die-sinking EDM with a SF-Cu electrode. Optimization of EDM machining parameters of Inconel 600 was presented in [11]. They analytically modeled the energy density, which is being absorbed by the workpiece and the electrode, and experimentally confirmed that the negative polarity leads to a higher material removal rate, higher electrode wear and higher surface roughness. The effect of pulse current and pulse duration in die-sinking EDM on the machining characteristics of Ti-6Al-4V alloy was studied in [12]. Authors used an electrode wear ratio, the material removal rate and the surface roughness to measure the effect of machining and control charts for controlling the process. EDM process parameters were optimized also for the shape-memory alloy NiTi 60 [13] by applying Taguchi‘s method considering an orthogonal array of L27 and using Minitab software. In [14] authors used the Taguchi method when studying the effect of the peak current, pulse on time and feed rate on the material removal rate at the EDM of tool steel H−13. In [15] authors used the design of experiment to investigate surface layers properties including roughness 3D parameters, the thickness of the white layer, heat affected zone, tempered layer and occurring micro cracks at EDM of tool steel. Besides, a new method of the EDM process, such as ultrasonic vibration assisted EDM process was developed and optimized [16].
Design of experiments (DoE) techniques provide powerful tools for optimizing process parameters. The design of experiment plan lies in understanding the effect of different variable factors and their interactions. The design of experiment (DoE) is based on different settings of input parameters and observation of corresponding output response. The aim of the designed experiment is to find the relation between independent variables xi and dependent variable yi in mathematical terminology, or the cause and effect relationship. Optimized input parameters obtained by means of design of experiment techniques (DoE) make it possible to take effective measures related to texture control [17,18,19].
2. Design of Experiments, Materials and Methods
At the beginning of the experiment design, input EDT parameters (factors) were defined: peak current Ip, voltage discharge voltage Up, pulse-on time (pulse length) Pont and pulse-off time (the length of a technological pause) Pofft and other electro-discharge texturing factors (roller speed, feed rate, shape and surface area of electrodes used, material of electrodes used), which may have an effect on the monitored target values of finishing rollers RaT,FR and PcT,FR [9,20,21,22].
The draft design of the experiment sequence was based on Volkswagen’s requirements for the texture characteristics of the sheet steel surfaces intended for bodywork auto body parts. We drew on an assumption that the texture of rolling mill’s finishing rollers was transferred to the steel sheet’s surface during cold rolling as a function of removal and wear of the rollers, or it depends on the number of sheets rolled. This means that the final values of surface texture characteristics RaSS and PcSS of steel sheets can be controlled by controlling the removal made by the rolling mill. The greater the removal, the greater the contouring (transfer) of texture to the sheet surface. For example, a 30–40% improvement in texture transfer was noted upon the change in removal from 0.7% to 1.1%. Transfer of texture from the roller to the sheet surface is limited by the maximum possible removal value. As aforementioned, in rollers prepared by the EDT in combination with chrome plating, a reduction in roughness transmission of RaFR by approximately 25% was due to the roller wear. From these assumptions, the mean value of the target roughness of finishing rollers was established to be 1.6 times the upper roughness value required by Volkswagen on the RaUCL sheet metal surface (RaUCL,SS = 1.6 μm − upper control line for steel sheet roughness). Thus, the assumed mean target roughness value of finishing rollers RaT,CL,FR = 1.6 × RaUCL,SS ≈ 2.5 μm. The lower limit of the target roughness value of the designed experiment was set at 2/3 of the upper zone of the maximum roughness value of the sheet metal surface required by the automaker Volkswagen [22,23], i.e., RaT,CL,FR = RaUCL,SS − 1/3TSS,Ra = 1.53 µm. The upper limit of the target roughness value of the designed experiment was designed to be 3.8 µm (RaUCL,FR = 3.8 µm) also taking into account the roughness tolerance of the working rollers TFR,Ra. As mentioned, the required roughness values of the sheets intended for the body parts of the car bodies range from 1.1 to 1.7 µm or the surface roughness tolerance of sheets intended for body surface parts is TSS,Ra = ±0.25 µm. For each target roughness value, estimated PcFR peak counts were calculated according to Equation (3) [6]:
According to Equation (3), the target roughness value of the finishing rollers RaT,FR1 = 1.538 μm will correspond to the peak count PcT,FR1,min = 144 cm−1, RaT,FR2 = 2.5 μm will correspond to the peak count PcT,FR2,min = 94 cm−1 and RaT,CUL = 3.8 μm will correspond to the peak count PcT,FR3,min = 67 cm−1. Texturing was performed on the EDT 2100/4500 device in BP250 oil dielectric with 8 copper electrodes at three different levels of electro-discharge texturing input parameters—Table 2.
Table 2.
Input parameters of the electro-discharge texturing process.
Sixteen finishing rollers for each level were subjected to observation. Table 3 shows values measured on the monitored surface texture characteristics (responses) of the finishing rollers RaT,FR and PcT,FR at the individual EDT parameter levels. The average value (AV) of the investigated output characteristic RaT,FRi, or PcT,FRi was calculated for each data group and so was the standard deviation SD. Finishing roller texture characteristics obtained at three levels of input parameters were evaluated by the Hommel Tester T1000 roughness meter (JENOPTIK Industrial metrology, Villingen-Schwenningen, Germany) along the entire roller length at 9 locations (at three locations at the left edge of the roller, at three locations at the right edge of the roller, and at three locations at the center of the roller) in the respective planes when the roller got turned by 0°, 90°, 180° and 270° according to DIN EN ISO 12085 [24]. Cut-off length was lr = 0.8 mm and ln = 4.0 mm as specified by the device producer for expected Ra values up to 4 µm. Ra and Pc values were measured parallel to the roller axis.
Table 3.
Measured target roughness RaT,FRi and peak count values PcT,FRi at individual EDM parameter level settings.
Mean values and standard deviations of the observed texture characteristics were calculated from repeated experiments at individual target value levels of designed experiments. The texture characteristics were investigated based on the proposed full Type 24 Factor Plan, varying the Ip, Up, Pont and Pofft EDT (factor) settings of input parameters. After starting the process, the input parameters changed only at the upper and lower levels. In its individual lines, the experiment design shows the conditions under which the experiments were carried out in random order—Table 4.
Table 4.
Setting the upper and lower levels of the electro-discharge texture parameters and the full experiment design response 24.
Evaluation of the experimental results was carried out using the statistical software Minitab 16. Conversion of natural to dimensionless variables ai was done using the coding relationship (4):
where the baseline i-th factor xoi = (xHi + xDi)/2 and i-th factor variation interval ∆xi = (xHi − xDi)/2 [25,26].
Using statistical methods of the designed experiment in Minitab 16 makes it possible to:
- Mathematically describe the dependence of the texture characteristics of the finishing rollers RaFRi and PcFRi on the input factors Ip, UP, Pont and Pofft;
- Find the optimal combination of input factor settings,
- Filter out noise factors or their interaction in carrying out a minimum number of experiments [25,26].
3. Analysis of the results obtained
The calculated mean values of the target roughness values RaT,FR1 = 1.5358 µm, RaT,FW2 = 2.5 µm and RaT,TW3 = 3.8 µm were plotted in control charts—Figure 1 and Figure 2. In control charts, central lines (central line CLRa) have been indicated, the values of which equal the target values of the analyzed characteristics RaT,FRi and PcT,FRi for each range level. Subsequently, control limits, i.e., the lower control limit (LCLRa—lower control limit) and the upper control limit (UCLRa—upper control limit) were indicated, the values of which were calculated from target values of monitored texture characteristics of working rollers and their tolerances—Figure 2. In establishing the LCLRa and UCLRa control limits, we assumed that the texture of the finishing rollers is transferred to the surface of the steel sheet during cold rolling as a function of removal and the number of the sheets rolled (wear of the working rollers).
then
and the EDT process capability index:
where is the mean value of the monitored output characteristics RaT,FRi and PcT,Fri,min in individual groups [27].
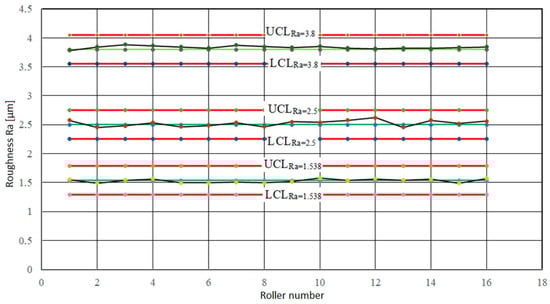
Figure 1.
Control charts for target roughness values RaT,Fri.
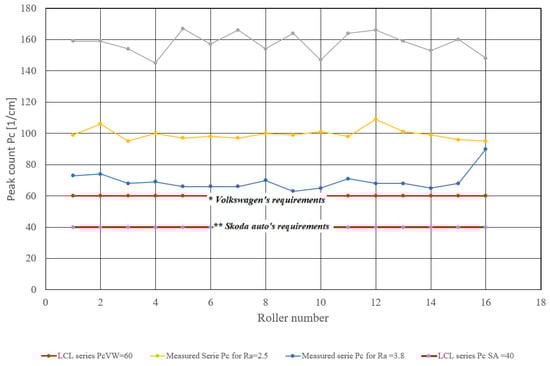
Figure 2.
Control charts of the minimum peak count Pcmin.
Figure 1 shows that the 1–16 roller roughness values with the RaT,FRi roughness values were in the first band (1/3 of the tolerance) of the control boundaries. The calculated Cpk values in all three cases were greater than 1.33. This means that the EDT work procedures applied to each target group were capable of repeatedly achieving the desired target roughness values RaT,FRi.
As mentioned in previous research, automakers require different minimum values for the peak count PcSS,min per centimeter, ranging between 40 and 60 cm−1 in sheets intended for the bodywork parts. If the minimum value of the monitored output characteristic is required, it is indicated in the control charts as LCLPc as it is shown in Figure 2:
The position of the central line in control charts was:
where TPc is the peak count tolerance Tn = SDPc,max = 7 cm−1 or 3 cm−1 as it is shown in Table 3.
Figure 2 shows that the process of roller texturing should be capable of repeatedly creating a texture with target roughness values RaT,FR1 = 1.538 and RaT,FR2 = 2.5 µm with PcT,VW,min = 60 cm−1 as required by the Volkswagen. Since the measured peak count values were above the lower LCLPc = PcVW limit and the process capability index was greater than 1.33—see Table 3. Peak counts for target roughness values RaT,FR3 = 3.8 µm were below the lower limit of the required minimum peak count, and Cpk,Pc capability indices were less than 1.33—see Figure 2 and Table 3. This means that the process of texturing the finishing rollers with the target value RaT,FR3 = 3.8 µm was not capable of repeatedly achieving the texture with the peak count greater than 60 cm−1. When setting the EDT process parameters of the finishing rollers listed in Table 2, it can be assumed that for the required values of RaT,FR = 2.5 µm and RaT,FR = 3.8 µm, requirements of both Ford and Skoda could also be met (PcT,SA,min = 40 cm−1). For target roughness values ranging from 1.538 to 3.5 µm and a minimum peak count greater than 40, the process capability index Cpk,Pc > 1.33—see Table 3.
3.1. Testing the Significance by a t-Test
Based on the above results, further research focused on finding an input parameter setting that would make it possible to obtain the RaFRi values ranging between 1.538 and 3.5 µm while maintaining the peak count of PcF,WV,min > 60 cm−1 or PcF,SA,min > 40 cm−1. In order to achieve this goal, the results were analyzed using a complete factor experiment 24, with the application of mathematical-statistical methods in the environment of Minitab 16—see Table 5, Table 6, Table 7 and Table 8. The F-test and the t-test, respectively were used to test the significance of the influence of parameters applied to the EDT process levels on the roughness RaT,FRi and the peak count of PcT,FR,min. The results of the ANOVA analysis done in Minitab 16 software at a significance level of 95% using the t-test and the F-test were processed graphically and tabularly—Table 5, Table 6, Table 7 and Table 8 and Figure 3 and Figure 4.
Table 5.
Estimated effects and coefficients for roughness (coded units).
Table 6.
Estimated effects and coefficients for the number of peaks (coded units).
Table 7.
Regression analysis: roughness versus on, off, current and voltage.
Table 8.
Regression analysis: number of peaks versus on, off, current and voltage.
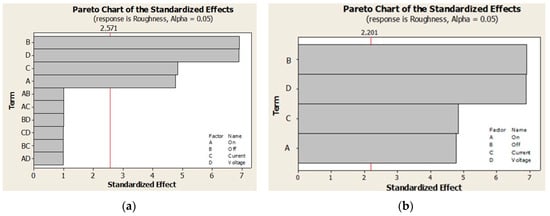
Figure 3.
Effect of individual factors on Ra roughness: (a) with noise and (b) without noise.
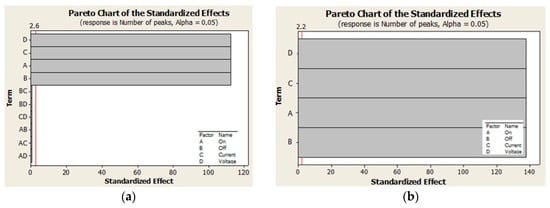
Figure 4.
Effect of individual factors on Pc peak count: (a) with noise and (b) without noise.
The hypothesis tested is the effect of the factors tested or that of their interactions to the surface texture parameters is significant. The statistical significance of individual factors and their interaction was expressed using the p-value. If α ≥ p, the null hypothesis H0 is rejected and the alternative hypothesis H1 is accepted. This means that the effect of factors tested or that of their interactions is significant for a given significance level α. Conversely, if α < p, the null hypothesis H0 must be accepted. This means that the effect of individual factors or their interactions is insignificant [25,26].
The signal-to-noise (S/N) ratio method was used to optimize the selected response variables. Based on the selected response characteristic, a larger-the-better S/N ratio has been used in this research work [27,28]. It follows from the analysis presented in Table 5 and Table 6 that the p-value for individual factors was less than 0.05, therefore the alternative hypothesis H1 was accepted. The average roughness values RaT,FRi at the set levels of factors IP, UP, Pont and Pofft were not equal to each other, therefore, it could be stated that their influence on the significance level α = 0.05 was statistically significant. In case of mutual interactions of the monitored factors, the null hypothesis was not rejected because the p-values of the test criterion were greater than 0.05, their effect on the resulting roughness at the significance level α = 0.05 was statistically insignificant.
On the basis of the calculated regression coefficients shown in Table 5, it is possible to write a model regression equation predicting the RaFRi roughness with the noise taken into account in the following form:
and after neglecting the noise, the model regression equation can be written in a simpler form:
The overall informative level of the prediction Model (12) and Model (13) was given by the multiple determination coefficient R-Sq (adj) = 90.27% and the correlation coefficient R = 0.95. Based on the multiple determination coefficient R-Sq (adj) and the correlation coefficient, it can be stated that Model (12) and Model (13) could predict the roller roughness with a probability of 95%.
Similarly as mentioned for the average roughness values RaT,FRi, the model predicting the peak count based on calculated values of regression coefficients shown in Table 6 can be written in the form:
and after neglecting the noise, the model regression equation can be written in a simpler form:
The value of the multiple regression coefficient R-Sq (adj) model for the PcFR peak count prediction was 100%, and similarly, the correlation coefficient R = 1. Thus, it can be stated that Models (14) and (15) could predict the peak count with 100% probability.
From the analysis of deviations of factors listed in Table 5 and Figure 3 it follows that regardless of the fact whether noise is or is not taken into account, the greatest influence on the RaFR roughness is that of the Pofft factor and the smallest is that of the Pont factor, while their interactions are insignificant. From the analysis of deviations of factors listed in Table 6 and Figure 4 follows that individual factors Pont, Pofft, IP and UP have the same effect on the PcFR peak count, while their mutual interactions are insignificant.
3.2. Testing the Significance by the F-Test
The results obtained from the designed experiment were also tested using the F-test, which is based on the significance of the difference between two variations. The decomposition of total variability into its individual parts makes it possible to find out the main source of variability and factors that show a significant effect on the resulting values of RaFR roughness and the PcFR peak count. The result of the test is a comparison of the critical value of Fα; a−1; N-a with the value of the test criterion F. Similarly to the t-test, the F-test makes it easier and quicker to establish the significance of individual factors using the p-value. Table 9 and Table 10 show that the p-value for each factor was less than 0.05, and Table 11 shows estimated coefficients for roughness and for the number of peaks. This means that the effect of individual factors (Pont, Poft, IP and UP) on the average roughness values of RaFRi was statistically significant. As shown in Table 9 and Table 10, in cases of a mutual interaction of the monitored factors, the null hypothesis could not be rejected, because the p-values of the test criterion were greater than 0.05—the mutual interactions of the factors were insignificant.
Table 9.
Analysis of variance for roughness (coded units).
Table 10.
Analysis of variance for the number of peaks (coded units).
Table 11.
Estimated coefficients for roughness and for the number of peaks using data in uncoded units.
On the basis of the calculated regression coefficients shown in Table 11, it is possible to write a model regression equation predicting the RaFR roughness with the noise taken into account in the following form:
On the basis of the calculated regression coefficients shown in Table 11, it is possible to write a model regression equation predicting the PcFRi roughness with the noise taken into account in the following form:
Figure 5 shows that with increasing values of investigated factors (IP, Pont, Pofft and UP) between the lower and upper levels, the RaFRi roughness increased. In the case of an increase in the RaFRi roughness, the increase was smaller at the lower level of the factors than at the upper level of the factors investigated—Figure 5b. This means that by increasing the EDT parameters at the upper level, a significant improvement in the spark discharge effect was achieved. Depending on the peak count of the individual investigated factors (Figure 6) it follows that with increasing values of investigated factors in the range between the lower and the upper level, the opposite effect was achieved, i.e., with increasing values of the investigated EDT factors, there was a decrease in the number of PcFRi peak count. Greater effect can be expected when changing the parameters of the EDT process in the lower level area of individual factor parameters than in the area of the upper level—Figure 6b.
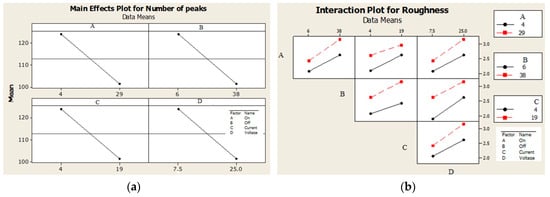
Figure 5.
Plot for RaFR roughness: (a) the main effect and (b) interactions.
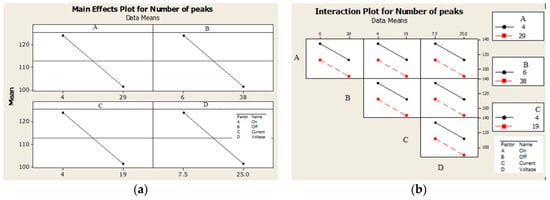
Figure 6.
Plot for PcFR peak count: (a) the main effect and (b) interactions.
The F-test results confirmed that the parameters applied to the roller texturing process should be capable of repeatedly creating the texture with RaT,FR1 = 1.538 µm as well as the texture with RaT,FR2 = 2.5 µm, both fulfilling PcT,FR1,min > 60 cm−1, as required by the automaker Volkswagen. Since the measured peak count values were above the lower LCLPclimit and the process capability index was greater than 1.33. Table 3 and Figure 2 show that the process of texturing the working rollers with the target value RaT,FR3 = 3.8 µm was not capable of repeatedly achieving a texture with a peak count PcT,FR1,min > 60 cm−1, because the CpkPc capability indices were less than 1.33.
When setting the EDT process parameters listed in Table 2, it can be assumed that the texture with RaT,FRi will be repeatedly achieved, ranging between 1.538 and 3.8 µm and, at the same time, the peak count PcT,FR2,min > 40 cm−1, as required by Skoda. At the target roughness values ranging from 1.538 to 3.5 µm, the minimum peak count was greater than 40 and the capability index CpkPC > 1.33—Table 4.
The C-E (Cause and Effects) analysis of errors on the finishing rollers after EDT showed that the rollers are most often damaged by burns, forming strips along the roller circumference and its length. The roller gets burns due to setting of a short technological pause or low speed, which does not eliminate impurities from the dielectric fluid and reforms the arc between the electrode and the finishing roller. This undesirable effect can be avoided by prolonging the technological pause at an interval at which the electric discharge channel regenerates in the spark gap. If this does not correct the error, the roller speed must be increased. The risk of other errors can be eliminated by regular maintenance.
4. Optimization of the EDT Factors’ Effect on Surface Texture Characteristics
Response surface methodology (RSM) was used to optimize the EDT factors’ effect on surface texture characteristics. RSM is a collection of mathematical and statistical techniques useful for analyzing problems in which several independent variables influence a dependent variable or response, and the goal is to optimize this response. In many experimental conditions, it is possible to represent independent factors in the quantitative form [29].
Optimal values of EDT input parameters to achieve the target RaT,FRi roughness values ranging from 1.538 to 3.8 μm and a minimum peak count PcT,FR1,min > 60 cm−1 (Volkswagen requirement) or minimum peak count PcT,FR2,min > 40 cm−1 (Skoda requirement) were established by the response surface methodology (RSM). These two output characteristics RaT,FRi and PcT,FRi,min of the surface of finishing rollers show a contradictory tendency. During optimization, priority was given to achieving the target values of RaT,FR1 = 1.538 μm, RaT,FR2 = 2.5 μm and RaT,FR3 = 3.5 μm. The target roughness values of RaT,FRi, their lower and upper values, their weight and importance were defined at the input and optimized values of the input parameters (Pont, Pofft, IP and UP) were calculated based on these input data. The results of the response optimization for the desired roughness target values RaT,FRi are shown in Table 12, Table 13 and Table 14 and Figure 7. Based on the optimized values of the Pont, Pofft, IP and UP parameters, the values of the peak count were calculated using the regression models (14) and (17)—Table 12, Table 13 and Table 14.
Table 12.
Input and output electro-discharge texturing (EDT) parameters for target roughness RaT,FR1 = 1.538 μm.
Table 13.
Input and output EDT parameters for target roughness RaT,FR2 = 2.5 μm.
Table 14.
Input and output EDT parameters for target roughness RaT,FR3 = 3.5 μm.
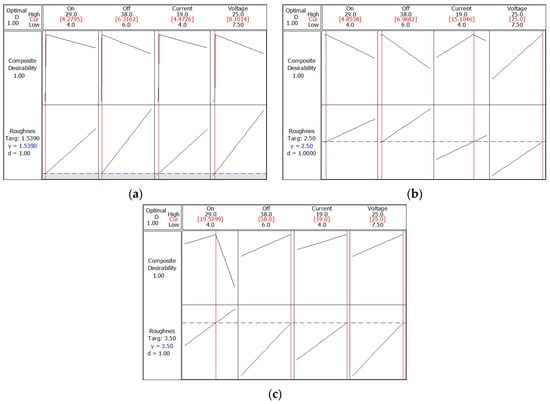
Figure 7.
Optimization of EDT input parameters to achieve the roughness target value: (a) RaT,FR1 = 1.538 μm; (b) RaT,FR2 = 2.5 μm and (c) RaT,FR3 = 3.5 μm.
Figure 7a shows that with the combination of optimized EDT parameters (Pont = 4.29 μs, Pofft = 6.32, IP = 4.47 A and UP = 8.1 V), required target roughness values RaT,FR1 = 1.539 μm were achieved. The total composite desirability when using RSM for predicted responses or the roughness target was at level 1. Thus, the response (RaT,FR1) has reached an ideal state—it is within an acceptable interval. The minimum peak count PcT,FR1 = 156 cm−1 was established by calculation according to the regression Models (14) and (17), at which a coefficient of determination R-Sq (adj) of 99.97% and a coefficient of correlation R = 1 were recorded.
Figure 7b shows that with the combination of the optimized EDT parameters (Pont = 4.86 μs, Pofft = 6.97 μs, IP = 15 A and UP = 25 V), required target roughness values RaT,FR2 = 2.5 μm were achieved. The total composite desirability when using RSM for predicted responses or the roughness target was at level 1. This means that the response (RaT,FR2) has reached an ideal state. The minimum peak count PcT,FR2 = 118 cm−1 was established by calculation according to the regression Model (14) and (17), at which a coefficient of determination R-Sq (adj) of 99.97% and a coefficient of correlation R = 1 were recorded.
Figure 7c shows that with the combination of the optimized EDT parameters (Pont = 19.5 μs, Poft = 38 μs, IP = 19 A and UP =25 V), required target roughness values RaT,FR3 = 3.5 μm were achieved. The total composite desirability when using RSM for predicted responses or the roughness target was at level 1. This means that the RaT,FR3 response had reached an ideal state. The minimum peak count PcT,FR3 = 78 cm−1 was established by calculation according to the regression Model (14) and (17), at which a coefficient of determination R-Sq (adj) of 99.97% and a coefficient of correlation R = 1 were recorded.
Response surface optimization results confirmed that the parameters applied to the roller texturing process should be capable of repeatedly creating a texture with RaT,FR1 = 1.538 µm, RaT,FR2 = 2.5 µm and RaT,FR3 = 3.5 µm with PcT,FR,min > 60 cm−1. When setting the EDT process parameters listed in Table 2, it can be assumed that the texture with RaT,FRi will be repeatedly achieved, ranging between 1.538 and 3.5 µm and, at the same time, the peak count PcT,FRi,min > 40 cm−1, as required by Skoda. At the target roughness values ranging from 1.538 to 3.5 µm, the minimum number of peaks was greater than 40—Table 3.
Optimized parameters of EDT factors were verified to reach the target value of the finishing rollers surface roughness Ra = 2.5 µm. After applying these parameters (Table 13) the roughness values of the finishing rollers were 2.4 ± 0.06 µm.
5. Conclusions
The main aim of this paper was to obtain optimized electro-discharge texturing parameters of rolling mill finishing rollers for surface texture finish values ranging from RaT,FR = 1.539 to RaT,FR = 3.5 μm, while at the same time, the minimum peak count should be greater than 60 according to Volkswagen and larger than 40 cm−1 according to the requirements of Skoda carmakers. The research involved a sample of 48 pieces of finishing rollers (i.e., 16 for each level of parameters), the surface of which was subjected to texturing by the EDT 2100/4500 device in a BP250 oil dielectric with eight copper electrodes at varying levels of input parameters of electro-discharge texturing (EDT), creating textures with the target roughness values RaT,FR1 = 1.538 μm, RaT,FR2 = 2.5 μm and RaT,FR3 = 3.8 μm and the peak count PcFR1 = 158 cm−1, PcFR2 = 99 cm−1 and PcFR3 = 68 cm−1. With the use of control charts and process capability indices Cpk, rollers were selected on which the t-test and the F-test analyses were subsequently performed. The results of the t-test and the F-test show that regression models obtained describe the relationships between the EDT input parameters and the RaFR and PcFR finishing rollers texture characteristics with a very high probability. Significance tests show that at the significance level α = 0.05, a significant effect of the EDT input parameters was noted: the duration of the technological pause Pont, voltage Up, current Ip and the length of the technological pause on the texture characteristics RaFR and PcFR. Influence of mutual interactions of individual input factors on the roughness RaFR and the peak count PcFR at significance level α = 0.05 was not recorded. The Pareto chart shows that the greatest influence on the roller roughness RaFR was that of duration of the technological pause and the lowest was that of the current Ip. In terms of the peak count and PcFR, the effect of individual factors was at the same level. The resulting roughness of the finishing rollers or the amount of material removed depended on the energy of the electric discharge. With very small changes in Pont from 4.29 to 4.86 µs, in Pofft from 6.32 to 6.97 µs but larger current changes Ip from 4.47 to 15.1 A and voltage Up from 8.1 to 25 V there was a change in ΔRaFR by 0.961 µm (from 1.539 to 2.5 µm) and ΔPcFR by 38 cm−1 (from 156 to 118 cm−1). At the same voltage Up = 25 V and current change Ip from 15.1 to 19 A but with major changes in Pont from 4.86 to 19.53 µs, Pofft from 6.97 to 38 µs, a change in roughness ΔRaFR was also achieved by about 1 µm (from RaFR 2.5 to 3.5 µm) and a change in PcFR by 40 peaks per cm (from 118 to 78 cm−1). Thus, based on the results obtained, it could be concluded that a greater effect was achieved by setting the input parameters of EDT at their lower level than at their upper level.
Optimal values of input parameters IP, UP, Pont and Pofft were established by the RSM method. Based on the verification of RSM results, it can be stated that the optimal (ideal) values of the target roughness characteristics have been achieved: RaT,FR = 1.539 µm and, at the same time, the minimum values PcT,FR,min = 156 cm−1 when setting the current IP = 4.47 A, UP = 8.1 V, Pont = 4.29 µs, Pofft = 6.32 µs; RaT,FR = 2.5 µm and, at the same time, the minimum values PcT,FR,min = 118 cm−1 when setting the current IP = 15.1 A, UP = 25, Pont = 4.86 µs and Pofft = 6.97 µs; RaT,FR = 3.5 µm and, at the same time, the minimum values PcT,FR,min = 78 cm−1 when setting the current IP = 19 A, UP = 25 V, Pont = 19.53 µs and Pofft = 38 µs.
The results obtained further show that with increasing roughness RaFR a decrease in the PcFR peak count was observed as was a good correlation between these roller texture characteristics. The obtained set of input parameters can be used to optimize other output characteristics of the EDT process such as cost and can also form the basis for designing adaptive process control strategies for EDT process of finishing rollers.
Author Contributions
Conceptualization and methodology, E.E.; software, J.K.; formal analysis and validation, E.E. and J.K.; writing—original draft preparation, E.E. and M.T.; writing—review and editing, E.E. and M.T. All authors have read and agreed to the published version of the manuscript.
Funding
This research received no external funding.
Acknowledgments
The work was accomplished under the grant project VEGA 2-0080−19 “Prediction of weldability and formability for laser welded tailored blanks made of combined high strength steels with CAE support” and project APVV-0273−12 “Supporting innovations of autobody components from the steel sheet blanks oriented to the safety, the ecology and the car weight reduction”.
Conflicts of Interest
The authors declare no conflict of interest.
References
- Batalha, D.F.; Stipkovic Filho, M. Quantitative characterization of the surface topography of cold rolled sheets-new approaches and possibilities. J. Mater. Process. Technol. 2001, 113, 732–738. [Google Scholar] [CrossRef]
- Hong, M.H.; Tark, H.J.; Park, J.S.; Paik, D.J. Improvement of surface texture on the hot dip galvanized and galvannealed steel sheets. La Metallurgia Italiana 2012, 6, 9–13. [Google Scholar]
- Grochea, P.; Calliesb, T. Tribology in Sheet Metal Forming with Regard to Challenges in Lightweight Construction. Adv. Mater. Res. 2005, 6–8, 93–100. [Google Scholar] [CrossRef]
- Evin, E.; Kmec, J.; Fechová, E. Optimizing of electric discharge texturing parameters of rolls of the rolling mill of steel sheets. Appl. Mech. Mater. 2003, 420, 78–84. [Google Scholar] [CrossRef]
- Müll, K.; Routschek, T. Topocrom Texturing: Technology and Advantages. Available online: http://www.topocrom.com/content/pdf/Baosteel_BAC_Topocrom.pdf (accessed on 27 November 2019).
- Terpák, L.; Dorčák, J.; Revaj, J. Quality Control of the Electro-Discharge Texturing. Metalurgija 2010, 49, 19–22. [Google Scholar]
- Gorbunov, A.V.; Belov, V.; Begletsov, D.O. Texturing of rollers for the production of auto-industry sheet. Steel Transl. 2009, 39, 696–699. [Google Scholar] [CrossRef]
- Faisal, N.; Kumar, K. Optimization of Machine Process Parameters in EDM for EN 31 Using Evolutionary Optimization Techniques. Technologies 2018, 6, 54. [Google Scholar] [CrossRef]
- Abu Qudeiri, J.E.; Saleh, A.; Ziout, A.; Mourad, A.-H.I.; Abidi, M.H.; Elkaseer, A. Advanced Electric Discharge Machining of Stainless Steels: Assessment of the State of the Art, Gaps and Future Prospect. Materials 2019, 12, 907. [Google Scholar] [CrossRef]
- Straka, L.; Corný, I.; Pitel’, J.; Hašová, S. Statistical Approach to Optimize the Process Parameters of HAZ of Tool Steel EN X32CrMoV12-28 after Die-Sinking EDM with SF-Cu Electrode. Metals 2017, 7, 35. [Google Scholar] [CrossRef]
- Salcedo, A.T.; Arbizu, I.P.; Pérez, C.J.L. Analytical Modelling of Energy Density and Optimization of the EDM Machining Parameters of Inconel 600. Metals 2017, 7, 166. [Google Scholar] [CrossRef]
- Liang, J.F.; Liao, Y.S.; Kao, J.Y.; Huang, C.H.; Hsu, C.Y. Study of the EDM performance to produce a stable process and surface modification. Int. J. Adv. Manuf. Technol. 2018, 95, 1743–1750. [Google Scholar] [CrossRef]
- Gaikwad, M.U.; Krishnamoorthy, A.; Jatti, V.S. Investigation and Optimization of Process Parameters in Electrical Discharge Machining (EDM) Process for NiTi 60. Mater. Res. Express 2019, 6, 65707. [Google Scholar] [CrossRef]
- Kumar, S.; Kundu, S.; Chaudhary, R. Optimization of Process Parameter and Experimental Investigation of MRR on H−13 Die Tool Steel using EDM with Application of Taguchi Technique. Int. J. Eng. Manage. Res. 2014, 4, 162–167. [Google Scholar]
- Świercz, R.; Oniszczuk-Świercz, D. Experimental Investigation of Surface Layer Properties of High Thermal Conductivity Tool Steel after Electrical Discharge Machining. Metals 2017, 7, 550. [Google Scholar] [CrossRef]
- Sabyrov, N.; Jahan, M.P.; Bilal, A.; Perveen, A. Ultrasonic Vibration Assisted Electro-Discharge Machining (EDM)—An Overview. Materials 2019, 12, 522. [Google Scholar] [CrossRef]
- Montgomery, D.C. Design and Analysis of Experiments, 8th ed.; Wiley Publication: New York, NY, USA, 2012; p. 752. [Google Scholar]
- Roy, R.K. Design of Experiments Using the Taguchi Approach: 16 Steps to Product and Process Improvement, 1st ed.; John Wiley & Sons: New York, NY, USA, 2001. [Google Scholar]
- Ryan, T.P. Modern Experimental Design, 1st ed.; John Wiley & Sons: New York, NY, USA, 2007. [Google Scholar]
- Warrender, T.E.; Aspinwall, D.K.; Dewes, R.C.; Simao, J.M.T.; Aspinwall, E.M.; Scamans, G. Difficulties in characterising roll surfaces. Trans. Eng. Sci. 2003, 44, 56–64. [Google Scholar] [CrossRef]
- Ishfaq, K.; Ahmad, N.; Jawad, M.; Ali, M.A.; Al-Ahmari, A.M. Evaluating Material’s Interaction in Wire Electrical Discharge Machining of Stainless Steel (304) for Simultaneous Optimization of Conflicting Responses. Materials 2019, 12, 1940. [Google Scholar] [CrossRef] [PubMed]
- Sun, Y.; Gong, Y.; Liu, Y.; Li, Q.; Zhou, Y. Experimental study on surface characteristics and improvement of microelectrode machined by low speed wire electrical discharge turning. Arch. Civ. Mech. Eng. 2017, 17, 964–977. [Google Scholar] [CrossRef]
- Godočíková, E.; Leško, M.; Baláž, P. Usage of a statistical method of designing factorial experiments in the mechanical activation of a complex CuPbZn sulphide concentrate. Acta Montanistica Slovaca 2003, 8, 134–138. [Google Scholar]
- ISO. ISO 12085:1996(en) Geometrical Product Specifications (GPS)—Surface Texture: Profile Method—Motif Parameters; ISO: Geneva, Switzerland, 1996. [Google Scholar]
- Khan, R.M. Problem Solving and Data Analysis Using Minitab: A Clear and Easy Guide to Six Sigma Methodology, 1st ed.; Wiley: West Sussex, UK, 2013; 484p. [Google Scholar]
- Allen, T. Introduction to Engineering Statistics and Six Sigma: Statistical Quality Control and Design of Experiments and Systems, 1st ed.; Springer: London, UK, 2006; p. 529. [Google Scholar]
- Ishfaq, K.; Mufti, N.A.; Mughal, M.P.; Saleem, M.Q.; Ahmed, N. Investigation of wire electric discharge machining of stainless-clad steel for optimization of cutting speed. Int. J. Adv. Manuf. Technol. 2018, 96, 1429–1443. [Google Scholar] [CrossRef]
- Ikram, A.; Mufti, N.A.; Saleem, M.Q.; Khan, A.R. Parametric optimization for surface roughness, kerf and MRR in wire electrical discharge machining (WEDM) using Taguchi design of experiment. J. Mech. Sci. Technol. 2013, 27, 2133–2141. [Google Scholar] [CrossRef]
- Shah, C.D.; Mevada, J.R.; Khatri, B.C. Optimization of Process Parameter of Wire Electrical Discharge Machine by Response Surface Methodology on Inconel-600. Int. J. Emerging Technol. Adv. Eng. 2013, 3, 260–267. [Google Scholar]
© 2020 by the authors. Licensee MDPI, Basel, Switzerland. This article is an open access article distributed under the terms and conditions of the Creative Commons Attribution (CC BY) license (http://creativecommons.org/licenses/by/4.0/).