The Efficiency of Utilisation of High-strength Steel in Tubular Profiles


Abstract
:
1. Introduction
2. Test Program
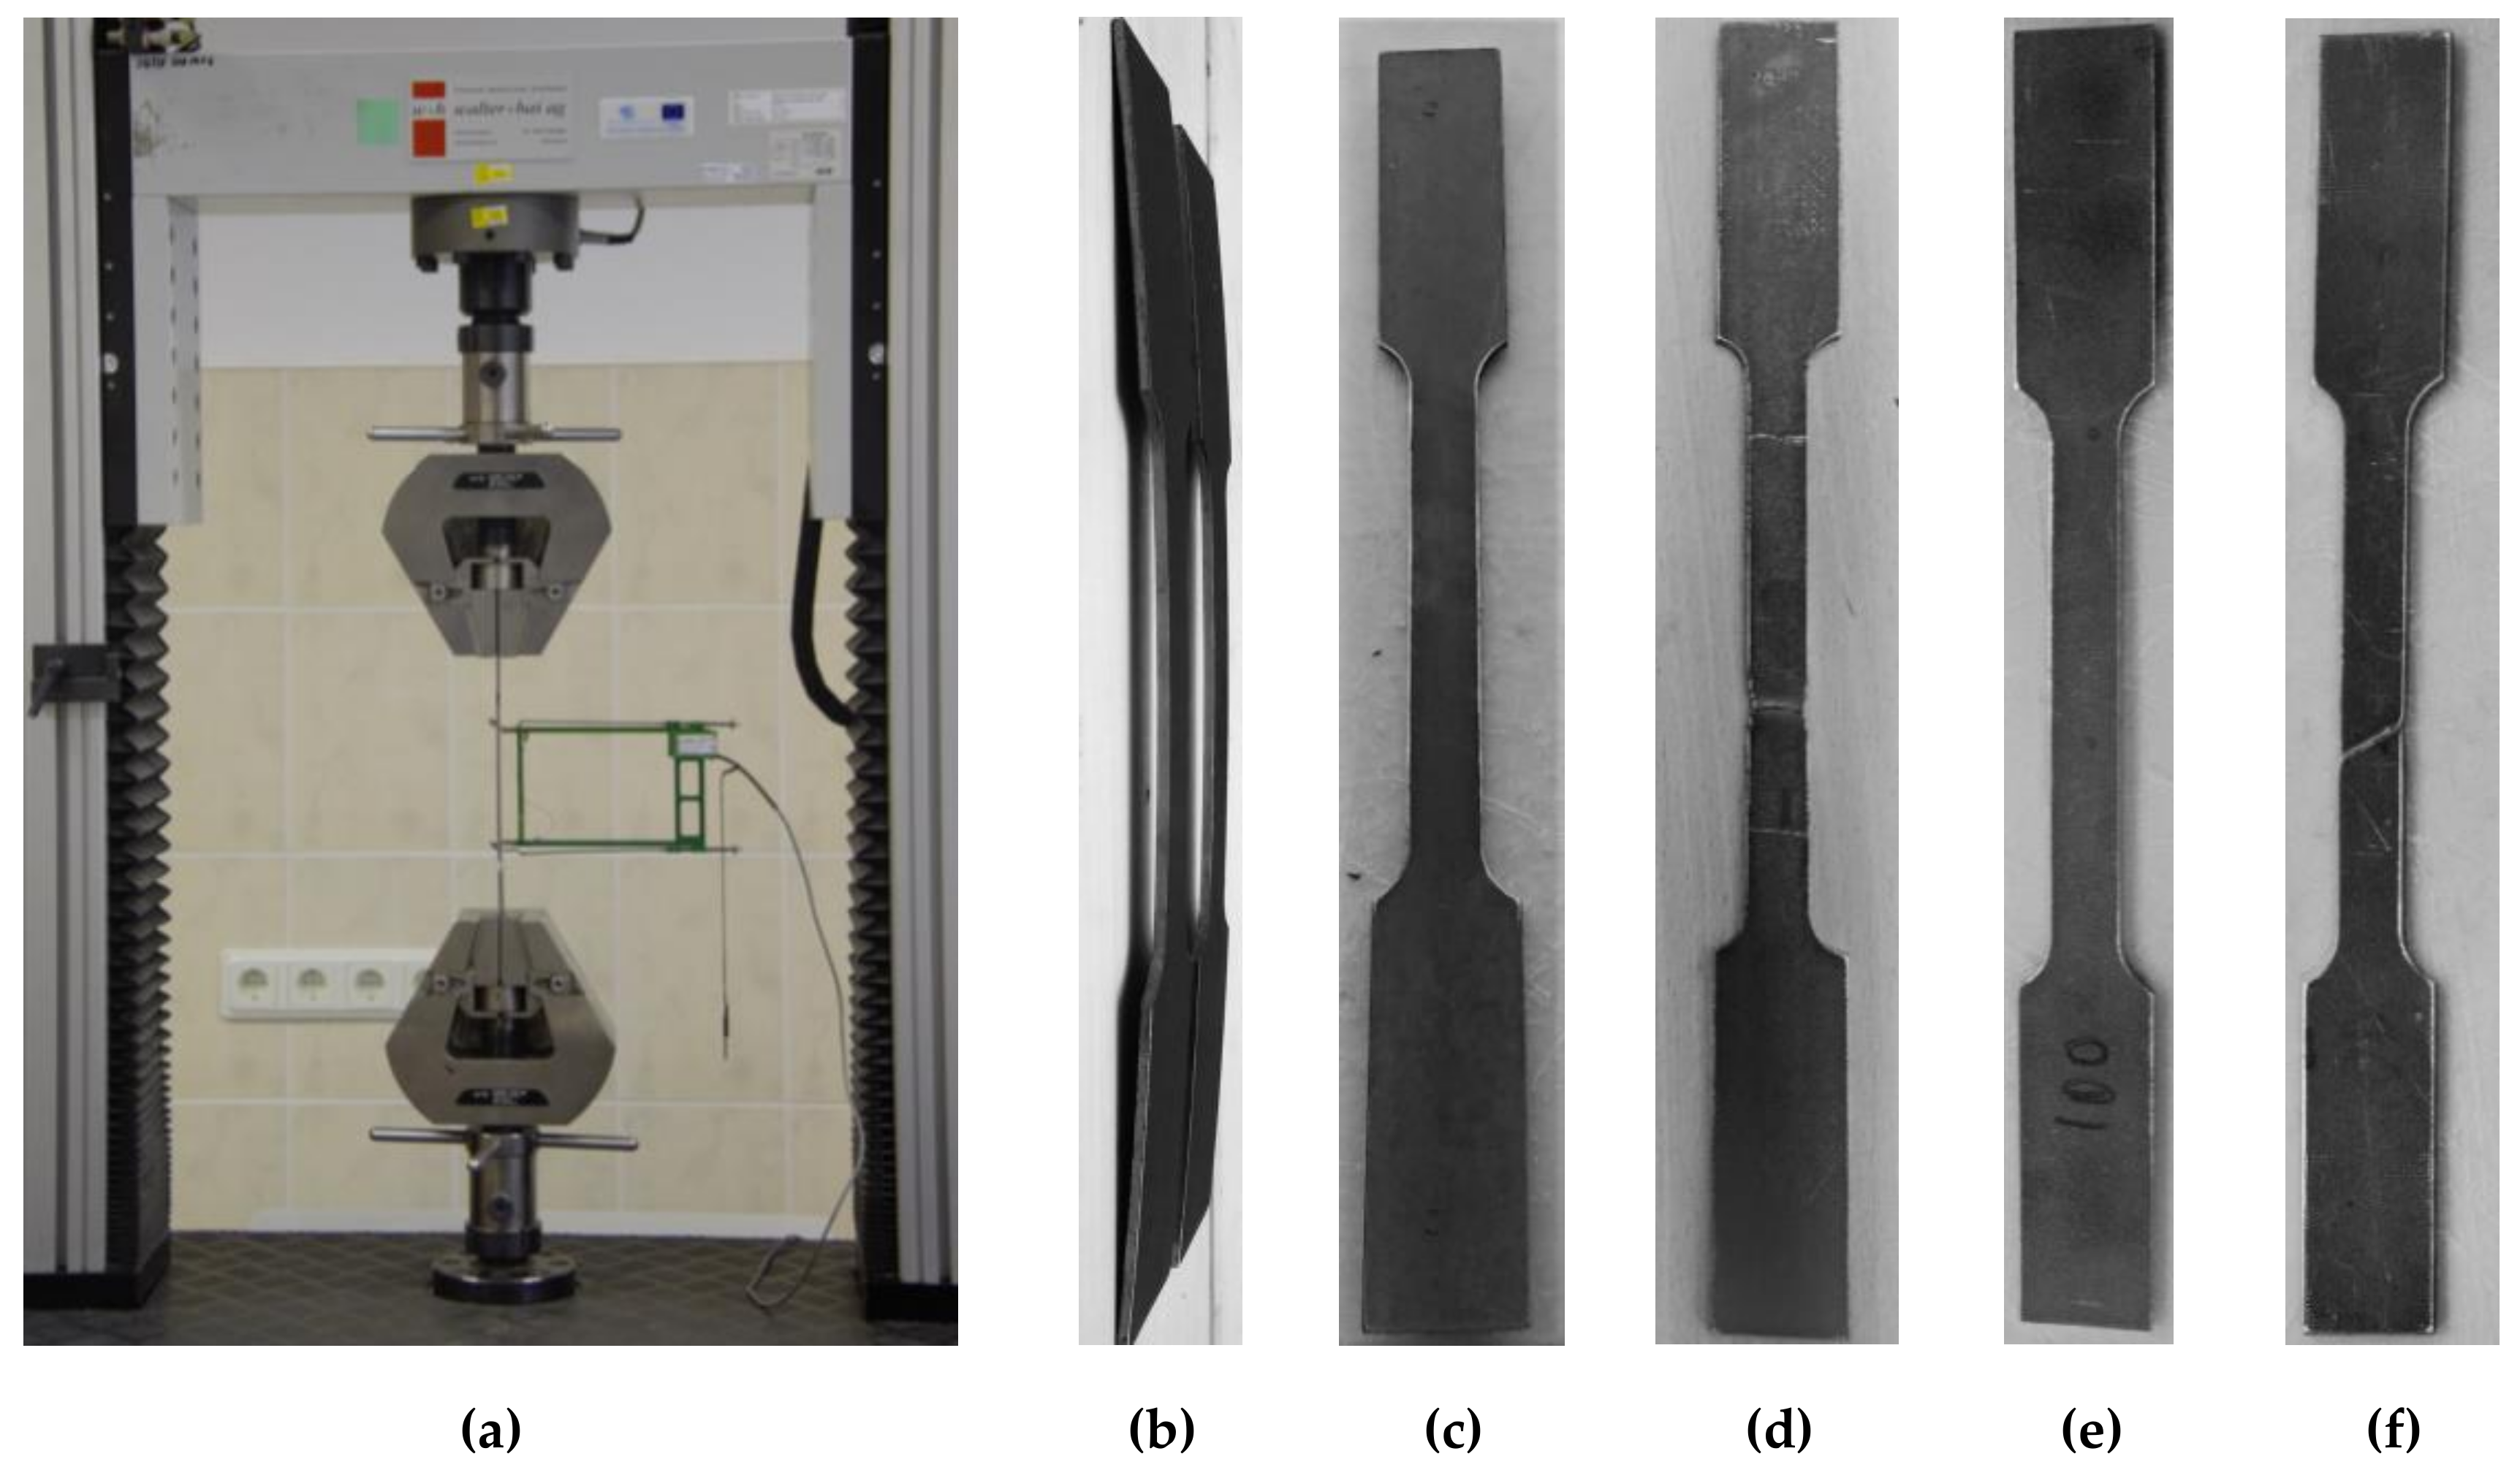
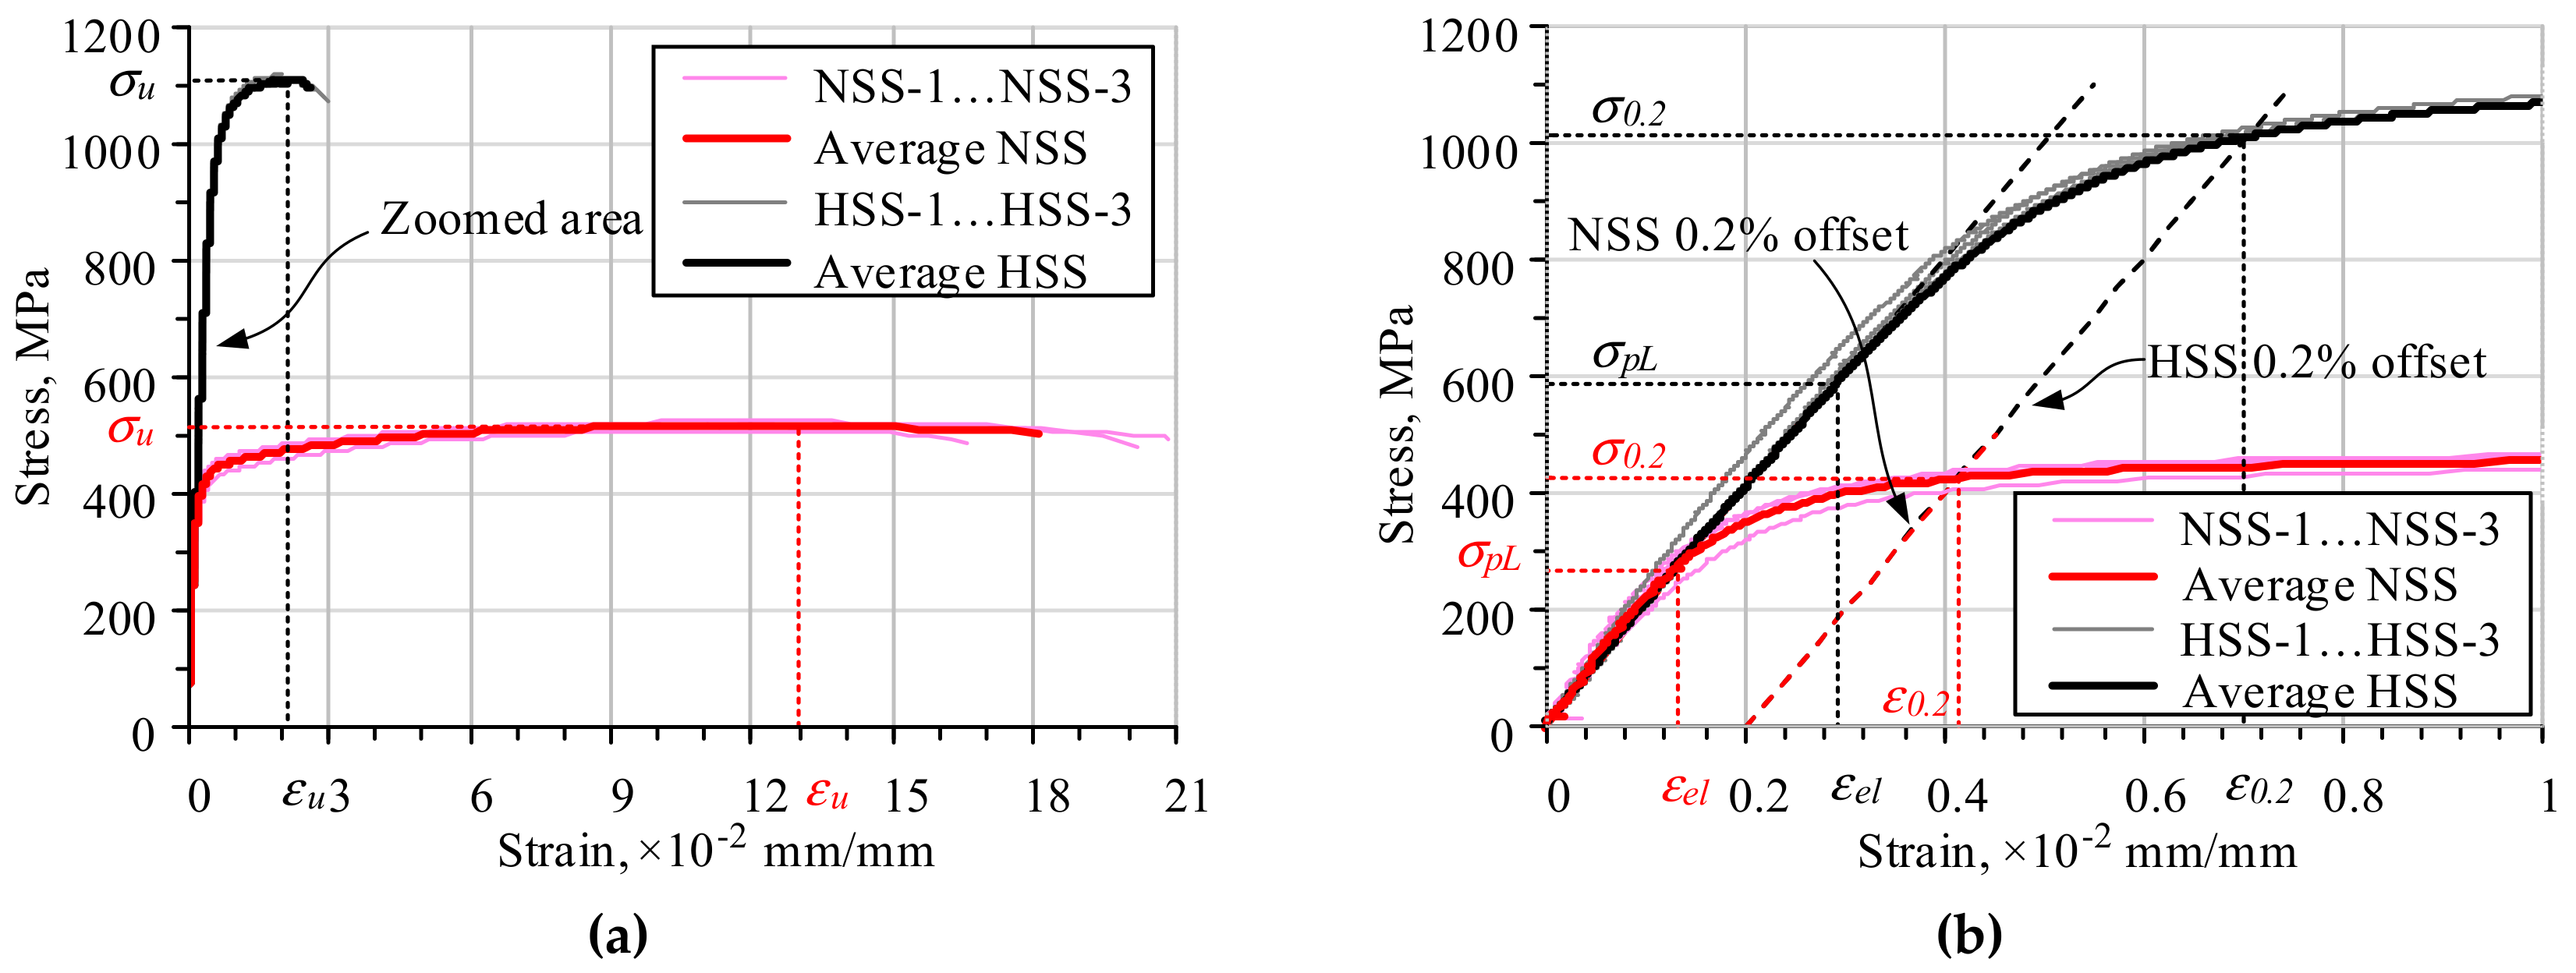
2.1. Characterisation of the Materials
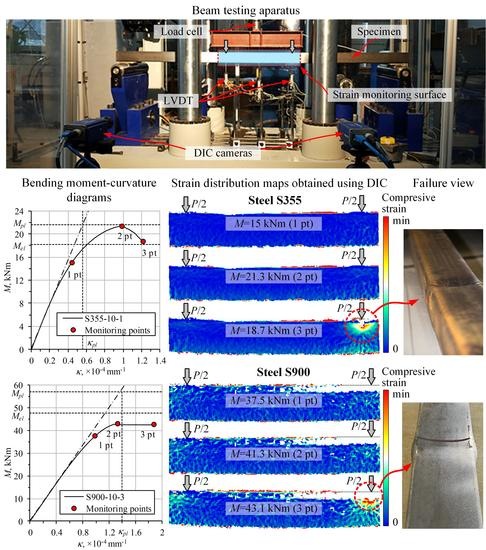
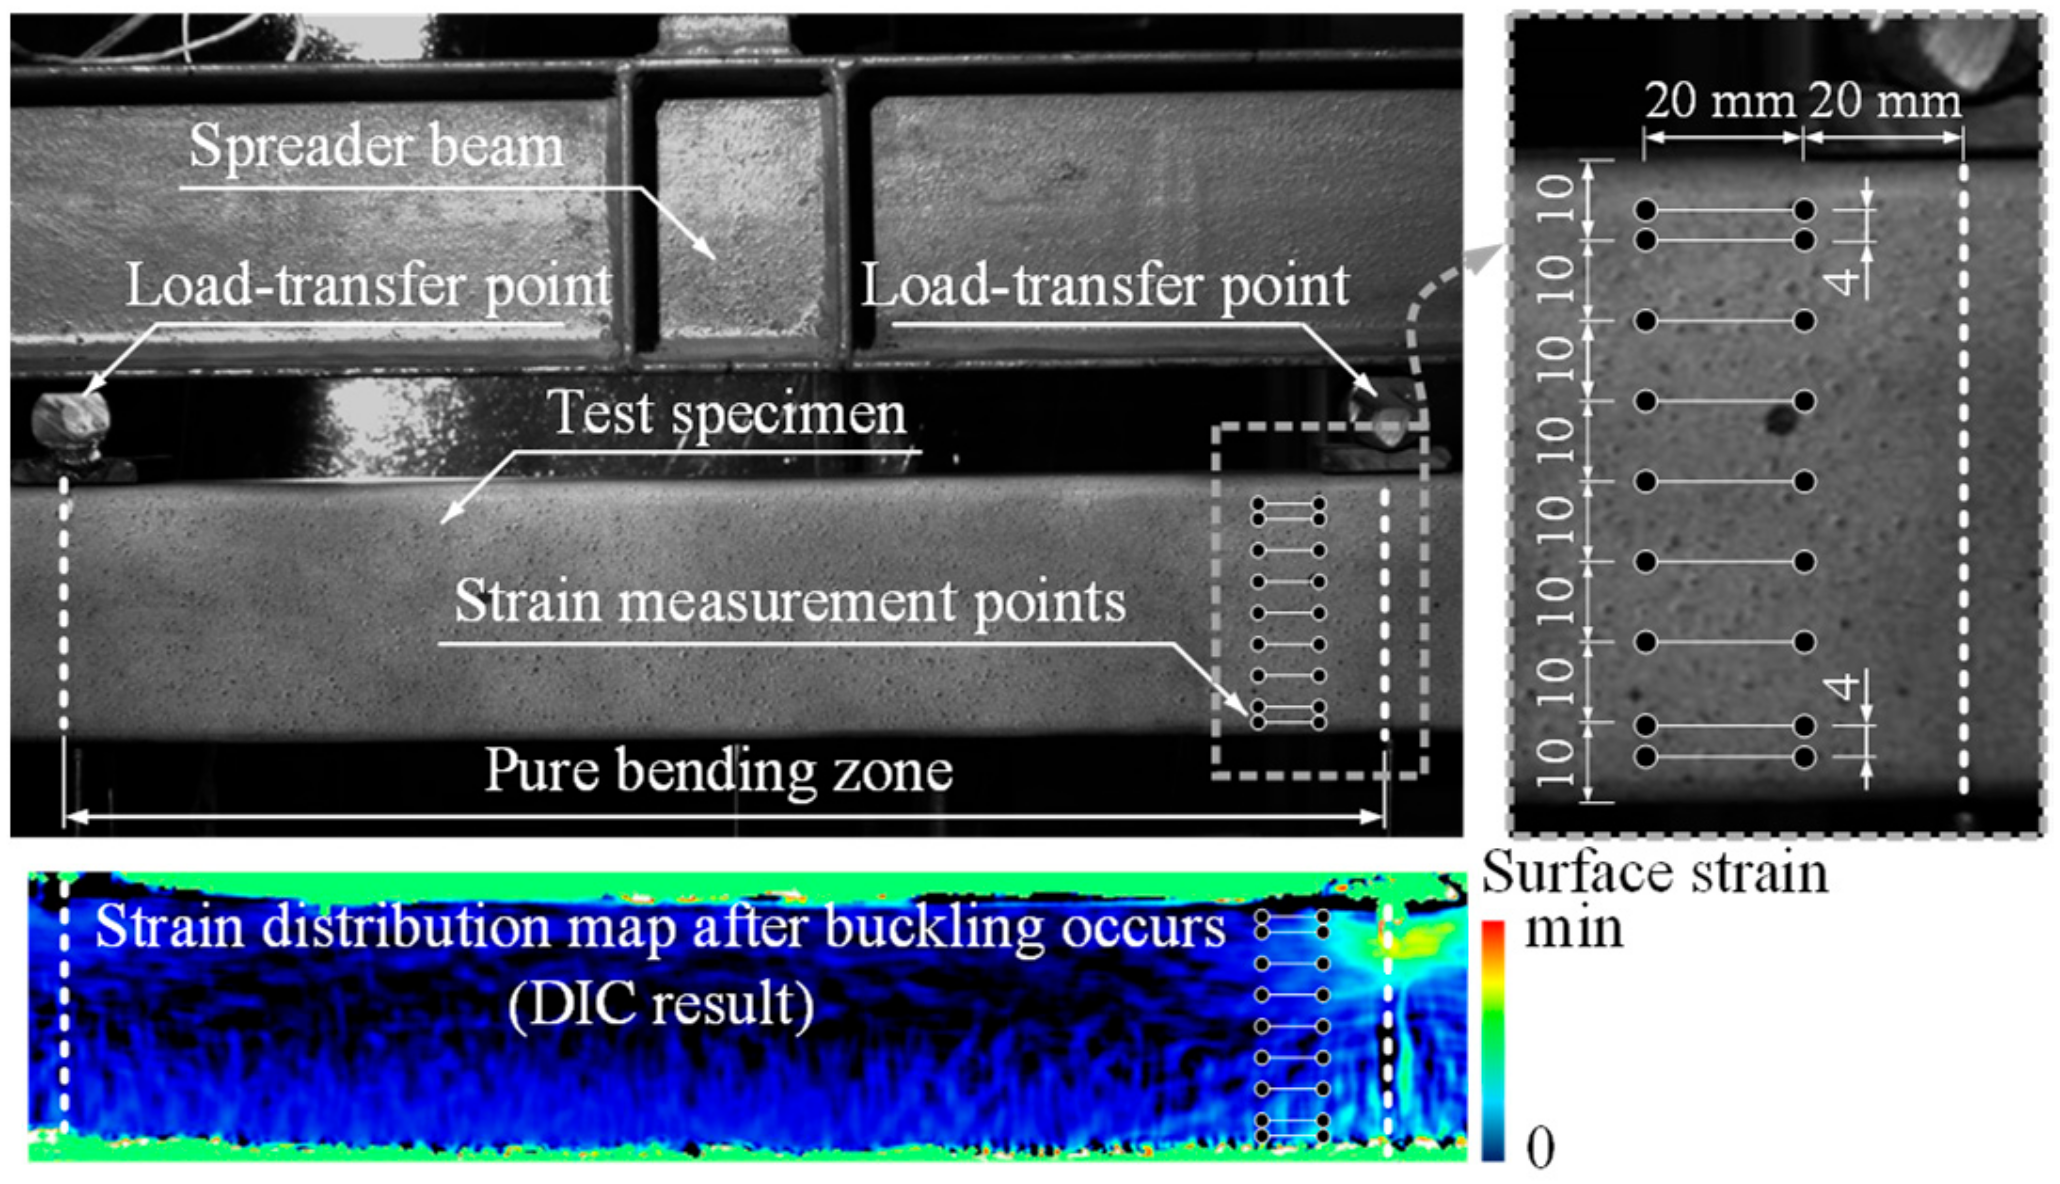
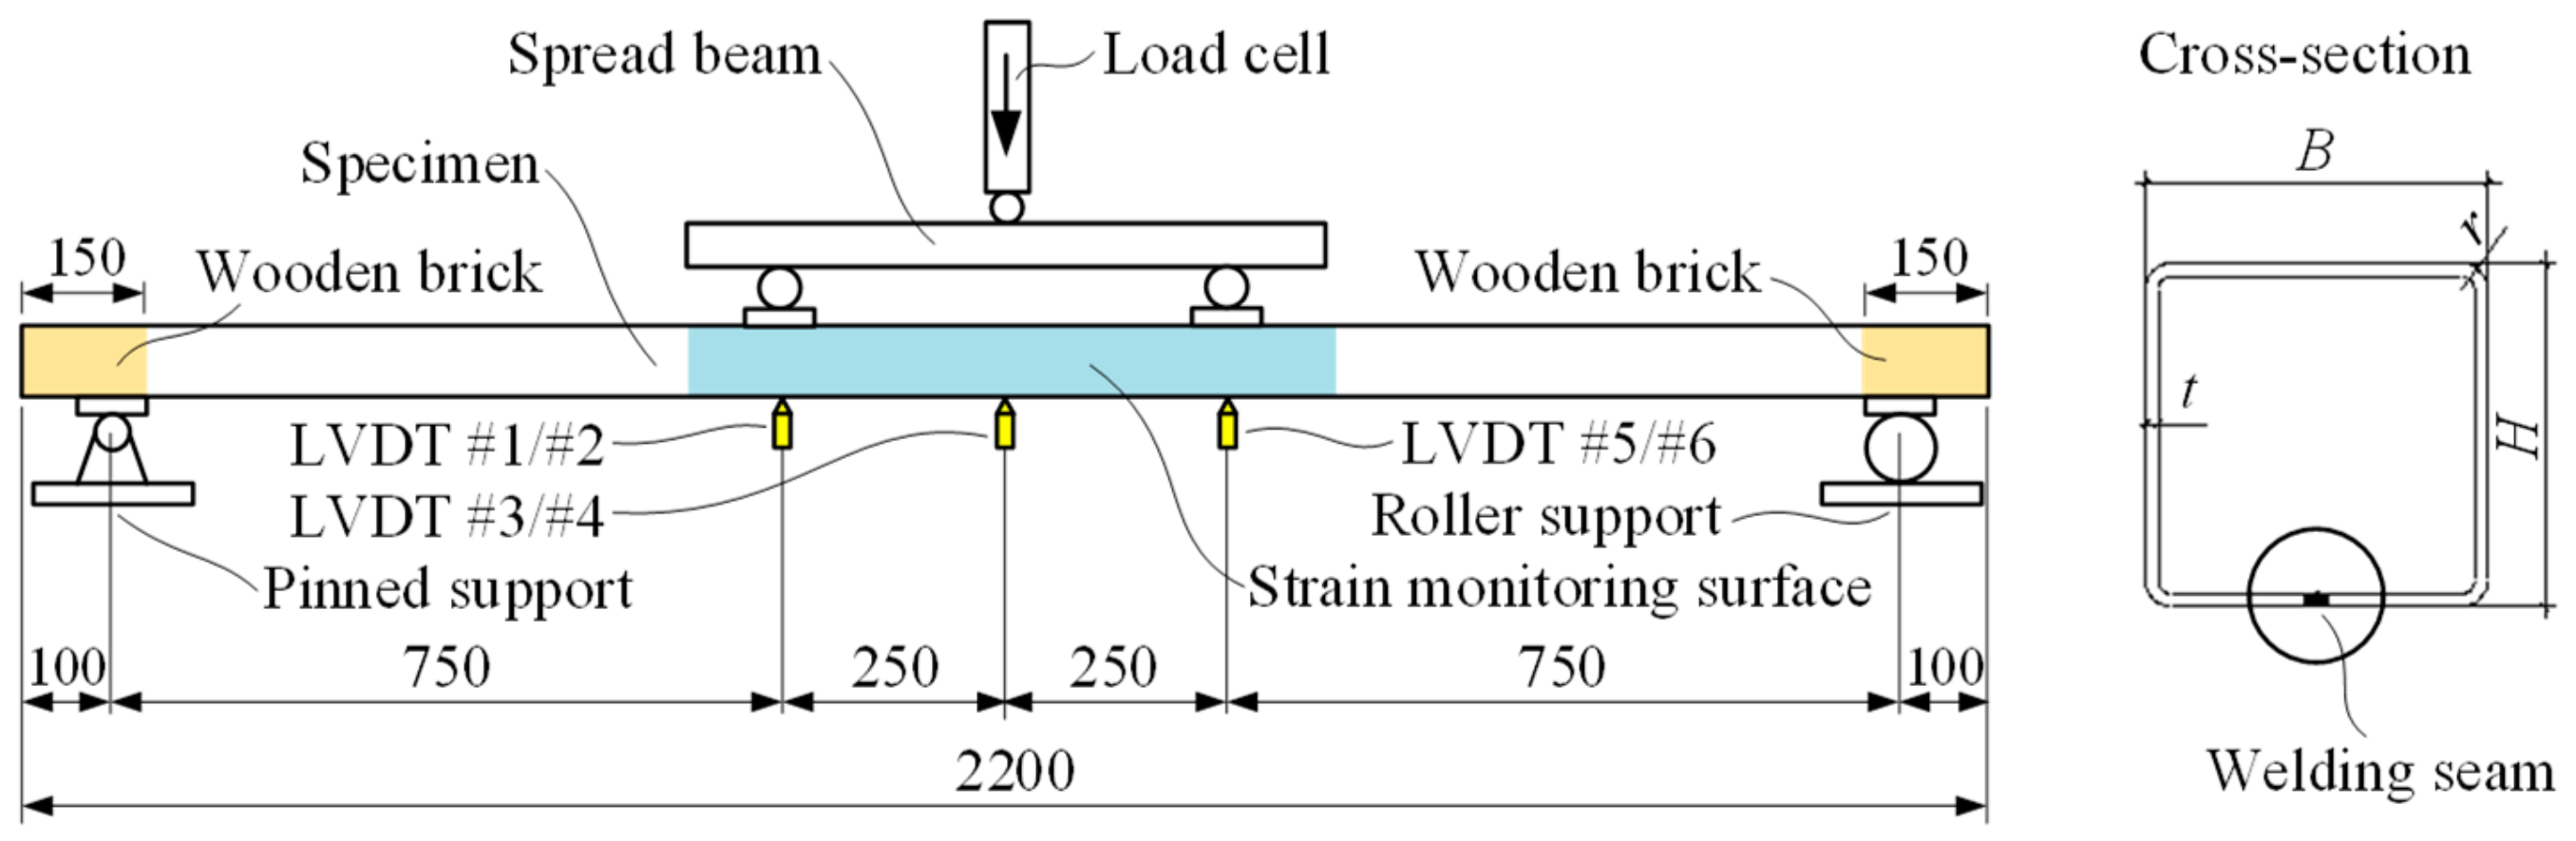
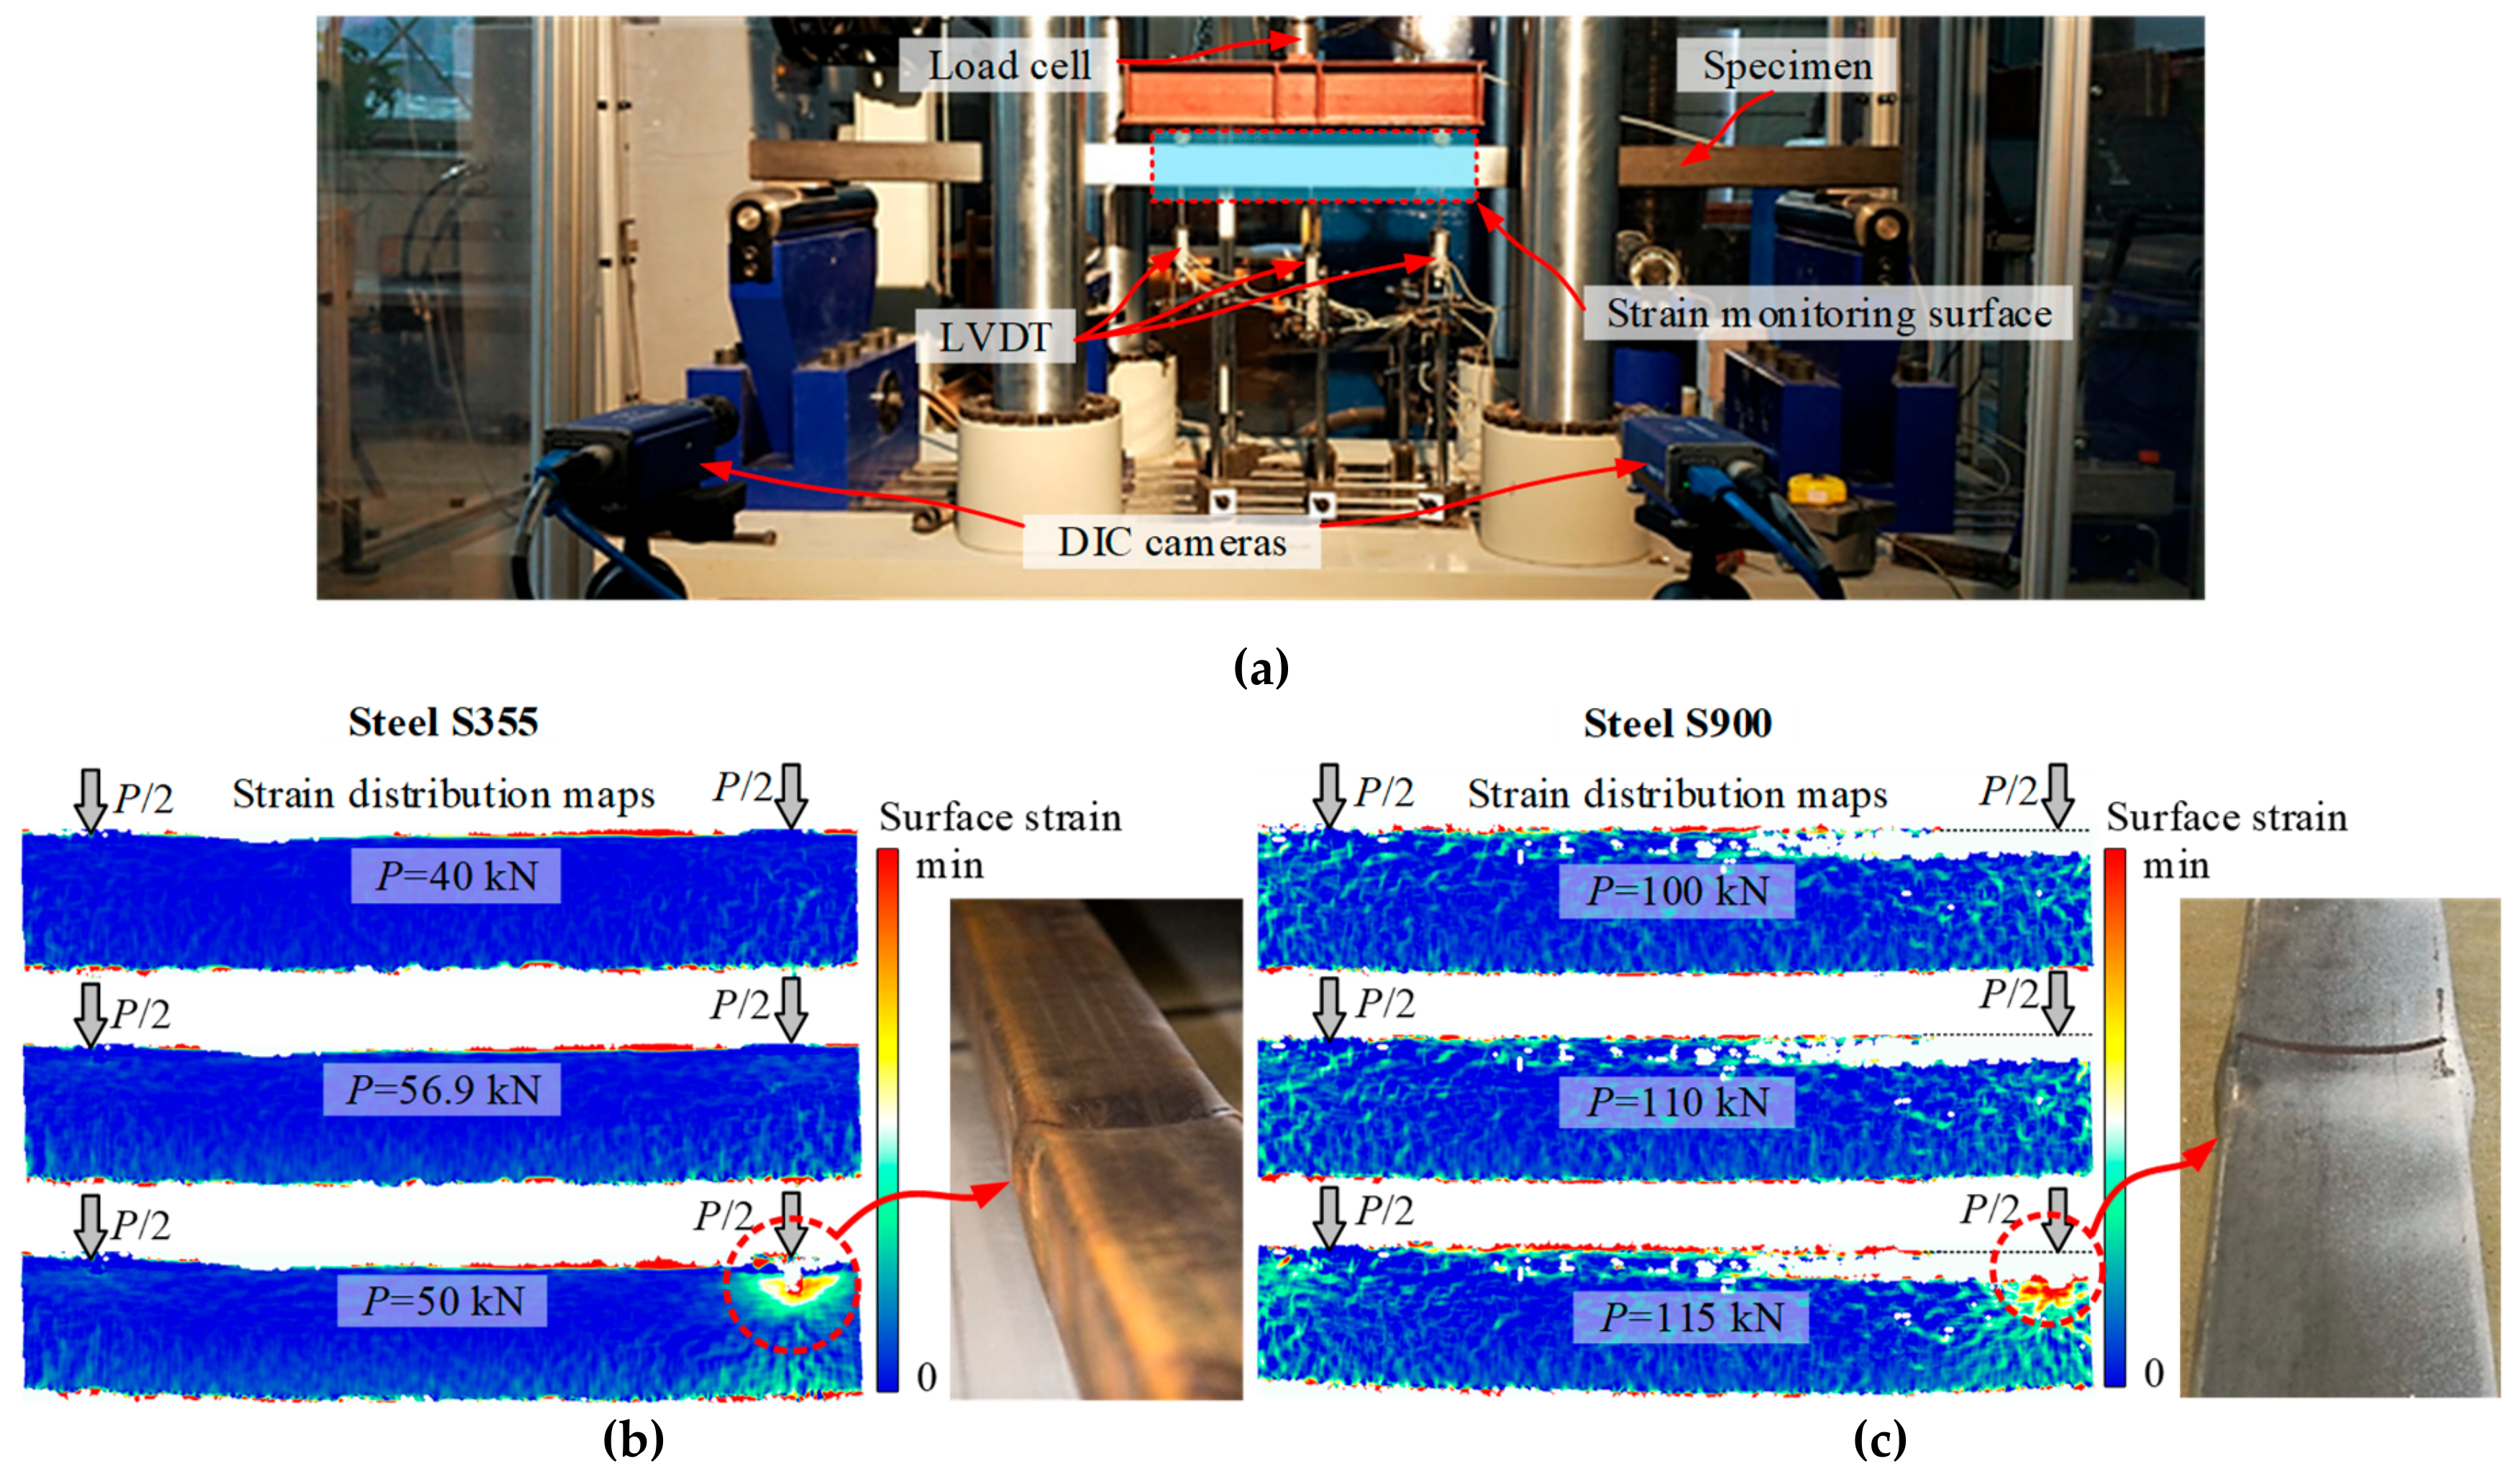
2.2. Beam Tests
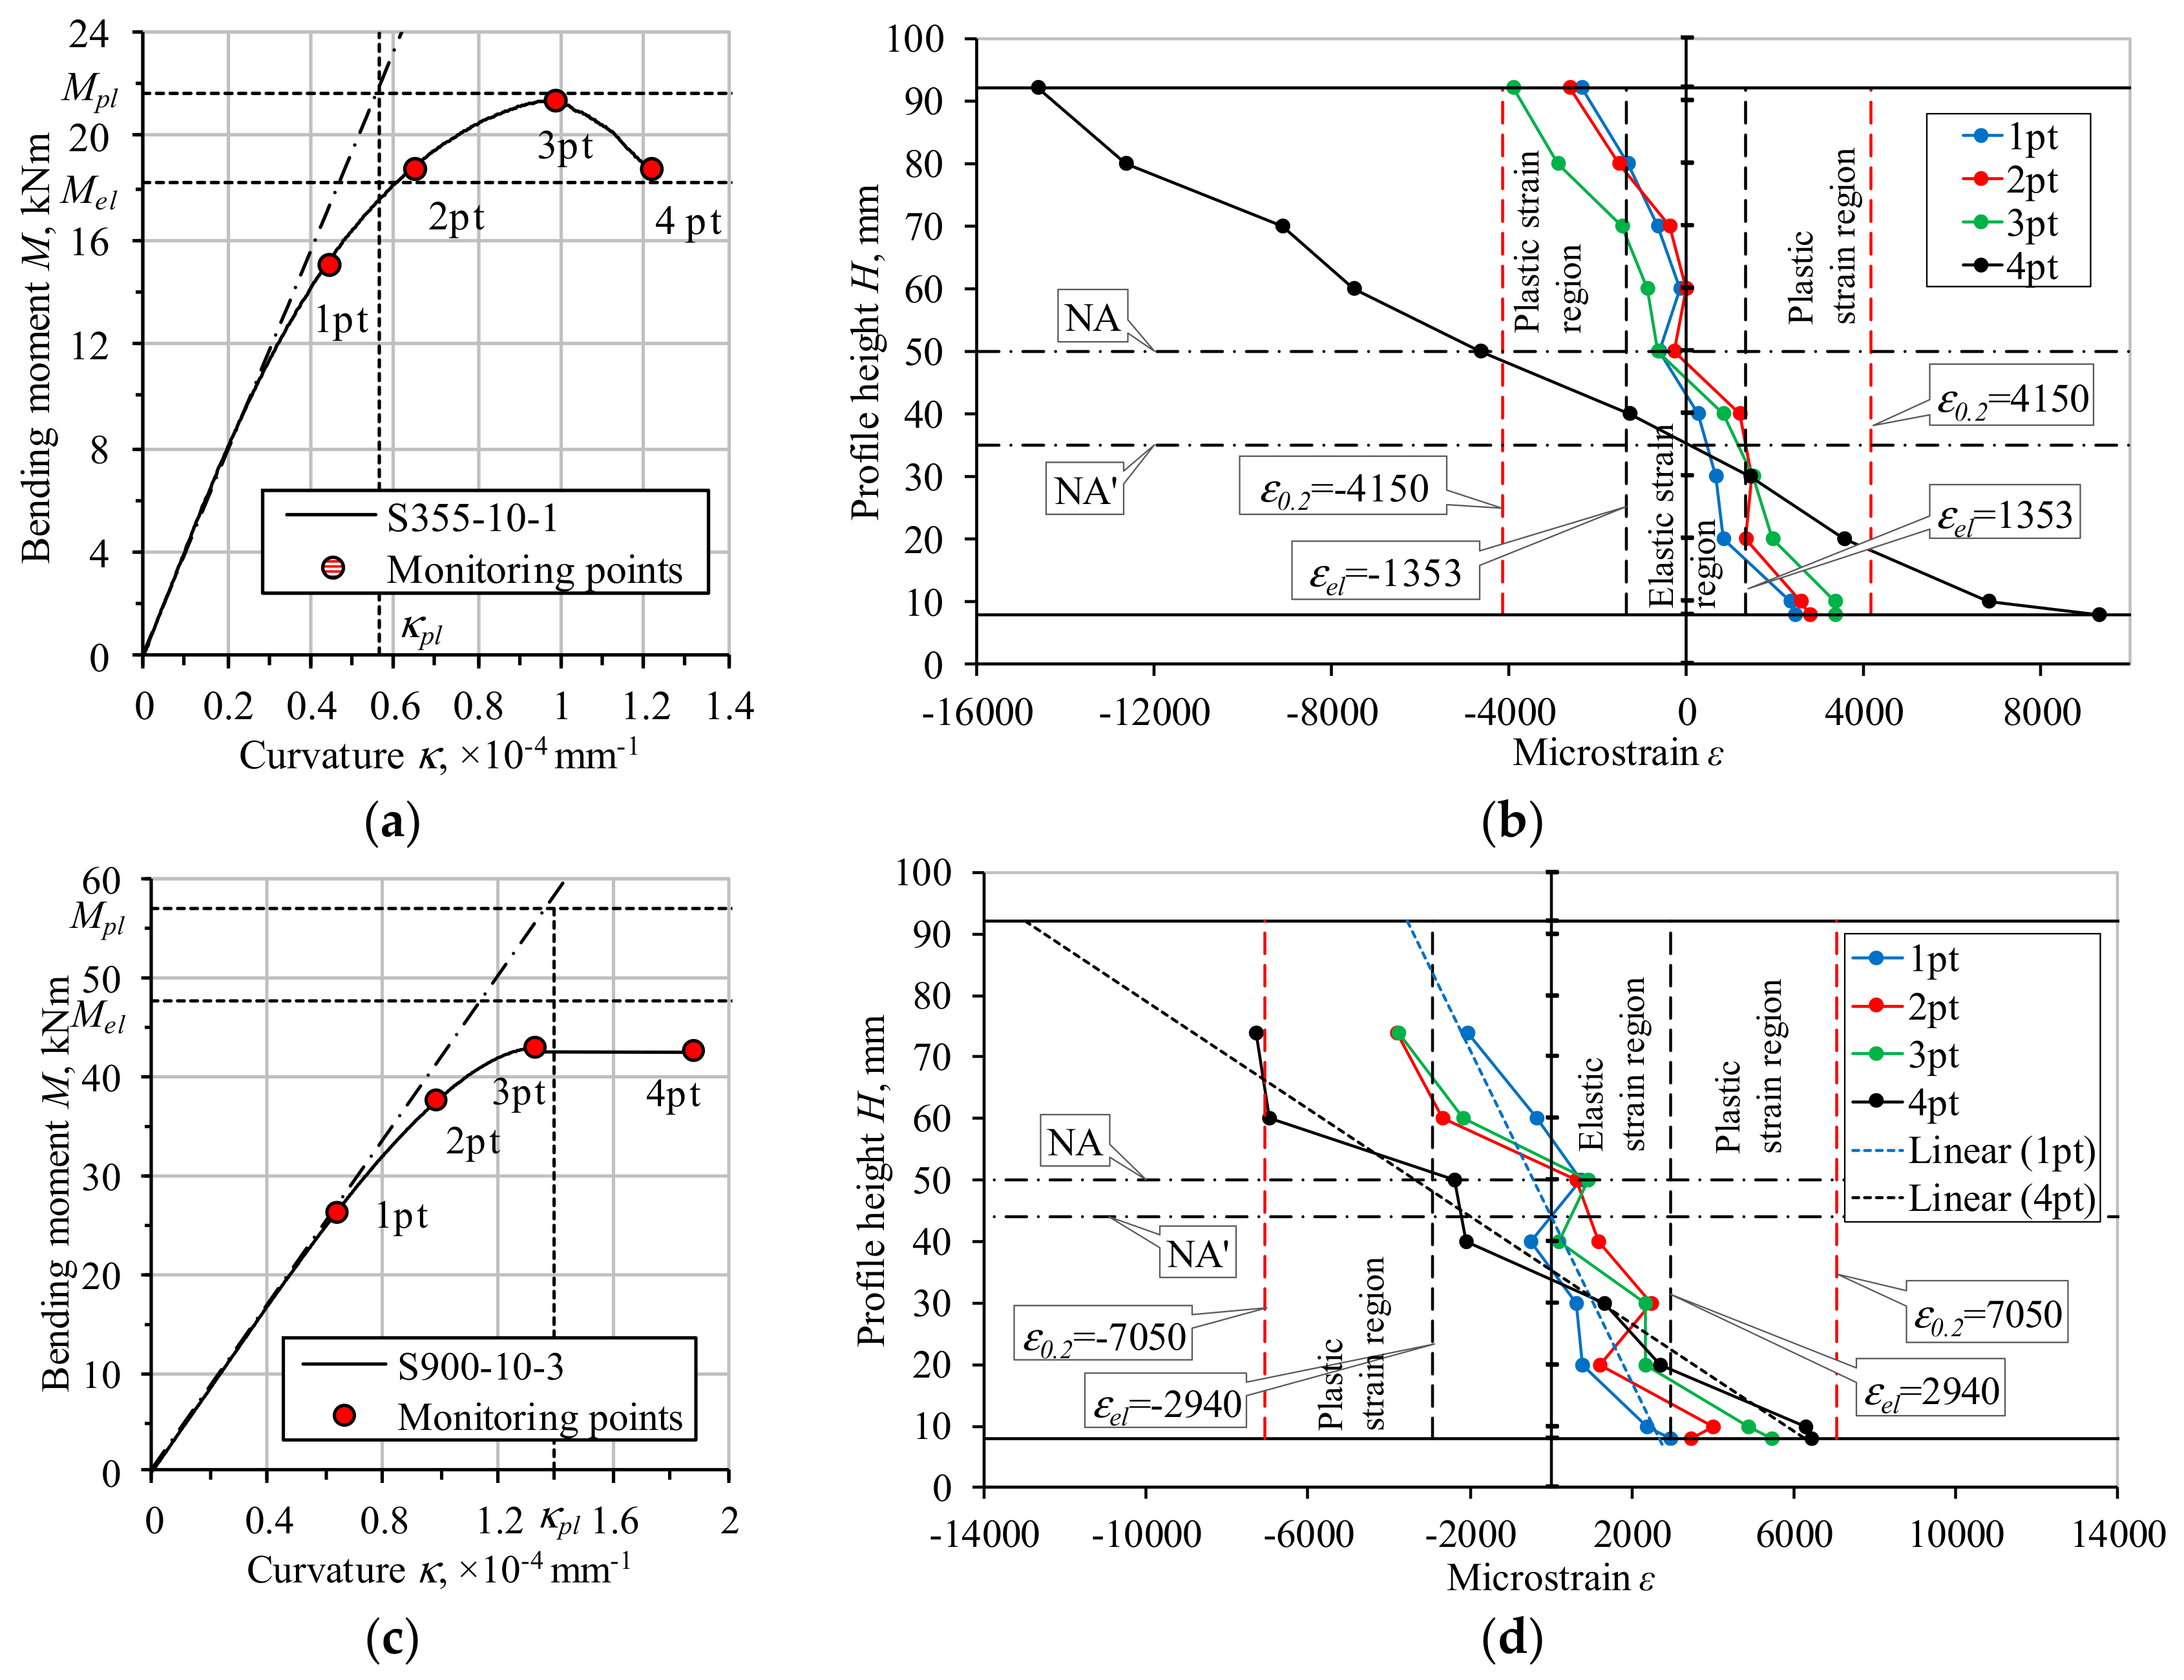
3. Test Results
4. Discussion of the Results
- NSS: The beam specimens were capable of attaining the load-bearing resistance comparable to the theoretical plastic moment Mpl. The considered geometry of SHS enabled the efficient utilisation of the material. The Mu/Mel ratio given in Table 4 defined the average increase of the theoretical load-bearing capacity by 18%.
- HSS: A premature local buckling limited the load-bearing capacity of the tubular specimen. The considered geometry and structural performance of the profile disabled the ability to utilise HSS efficiently due to local bearing failure. The Mu/Mel ratio (Table 4) demonstrated the 9% deficit of the ultimate load, considering the theoretical elastic moment as the reference.
5. Conclusions
- An almost identical initial elastic modulus was characteristic of the considered steel grades S355 (NSS) and S900 (HSS). This parameter predominantly controlled the deformation behaviour of the elements.
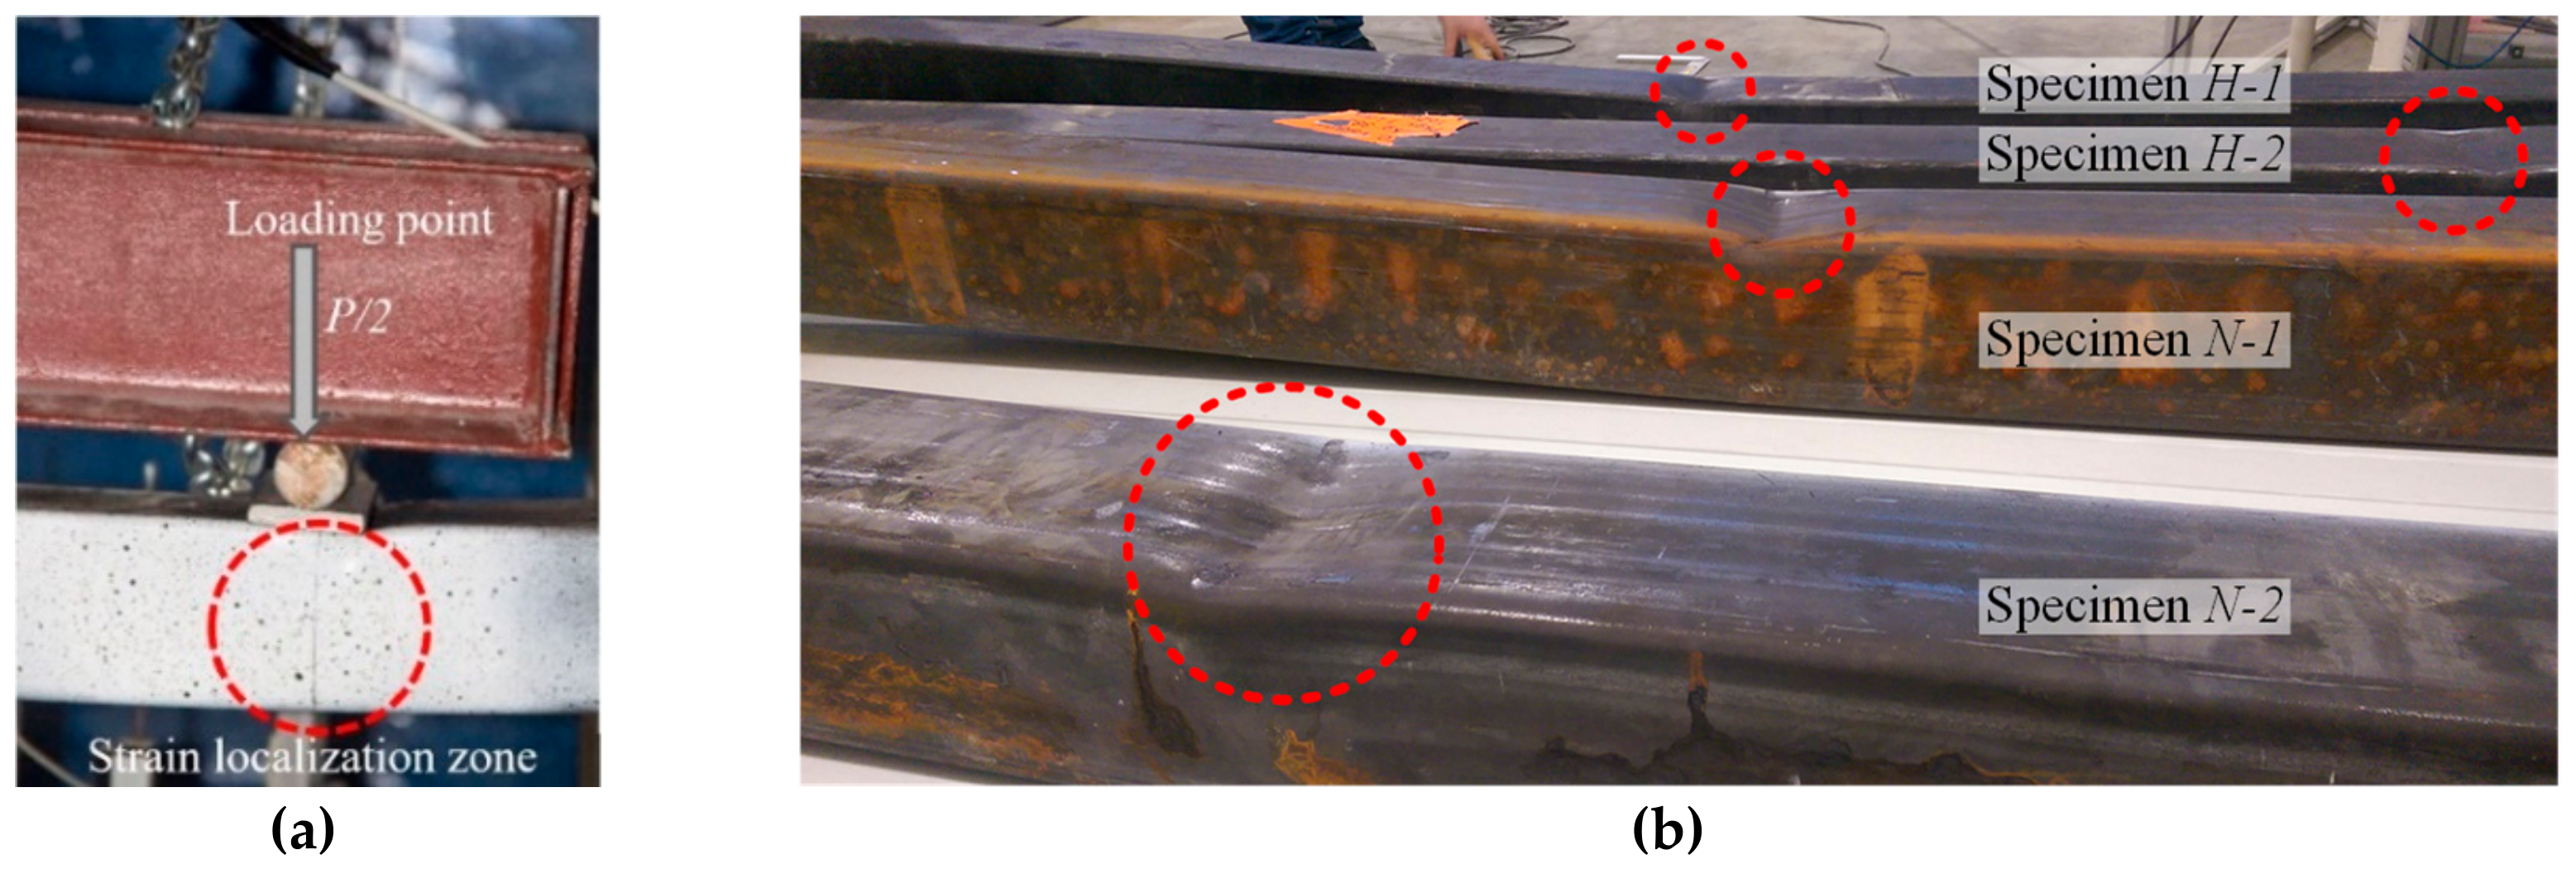
- The failure of all beam specimens was a consequence of the deformation localisation process identified by using a digital image correlation system. Although the deformed shape of the profiles looked similar, the corresponding deformation mechanisms were different. The strain localisation in the NSS profile corresponded to the descending branch of the loading diagram, whereas the HSS element continuously demonstrated increased deformations until the ultimate loading stage.
- The actual bending resistance of the NSS profiles was comparable to the theoretical plastic bending moment Mpl. This meant that the strength term controlled the load-bearing capacity of the NSS elements. The Mu/Mel ratio gave the average increase of the theoretical load-bearing capacity at 18%. Alternatively, the stiffness condition governed the failure behaviour of the HSS specimens; the load-bearing capacity was below the theoretical value Mel at 9%. The identification of the optimum configuration of the cross-section should be the subject for further research.
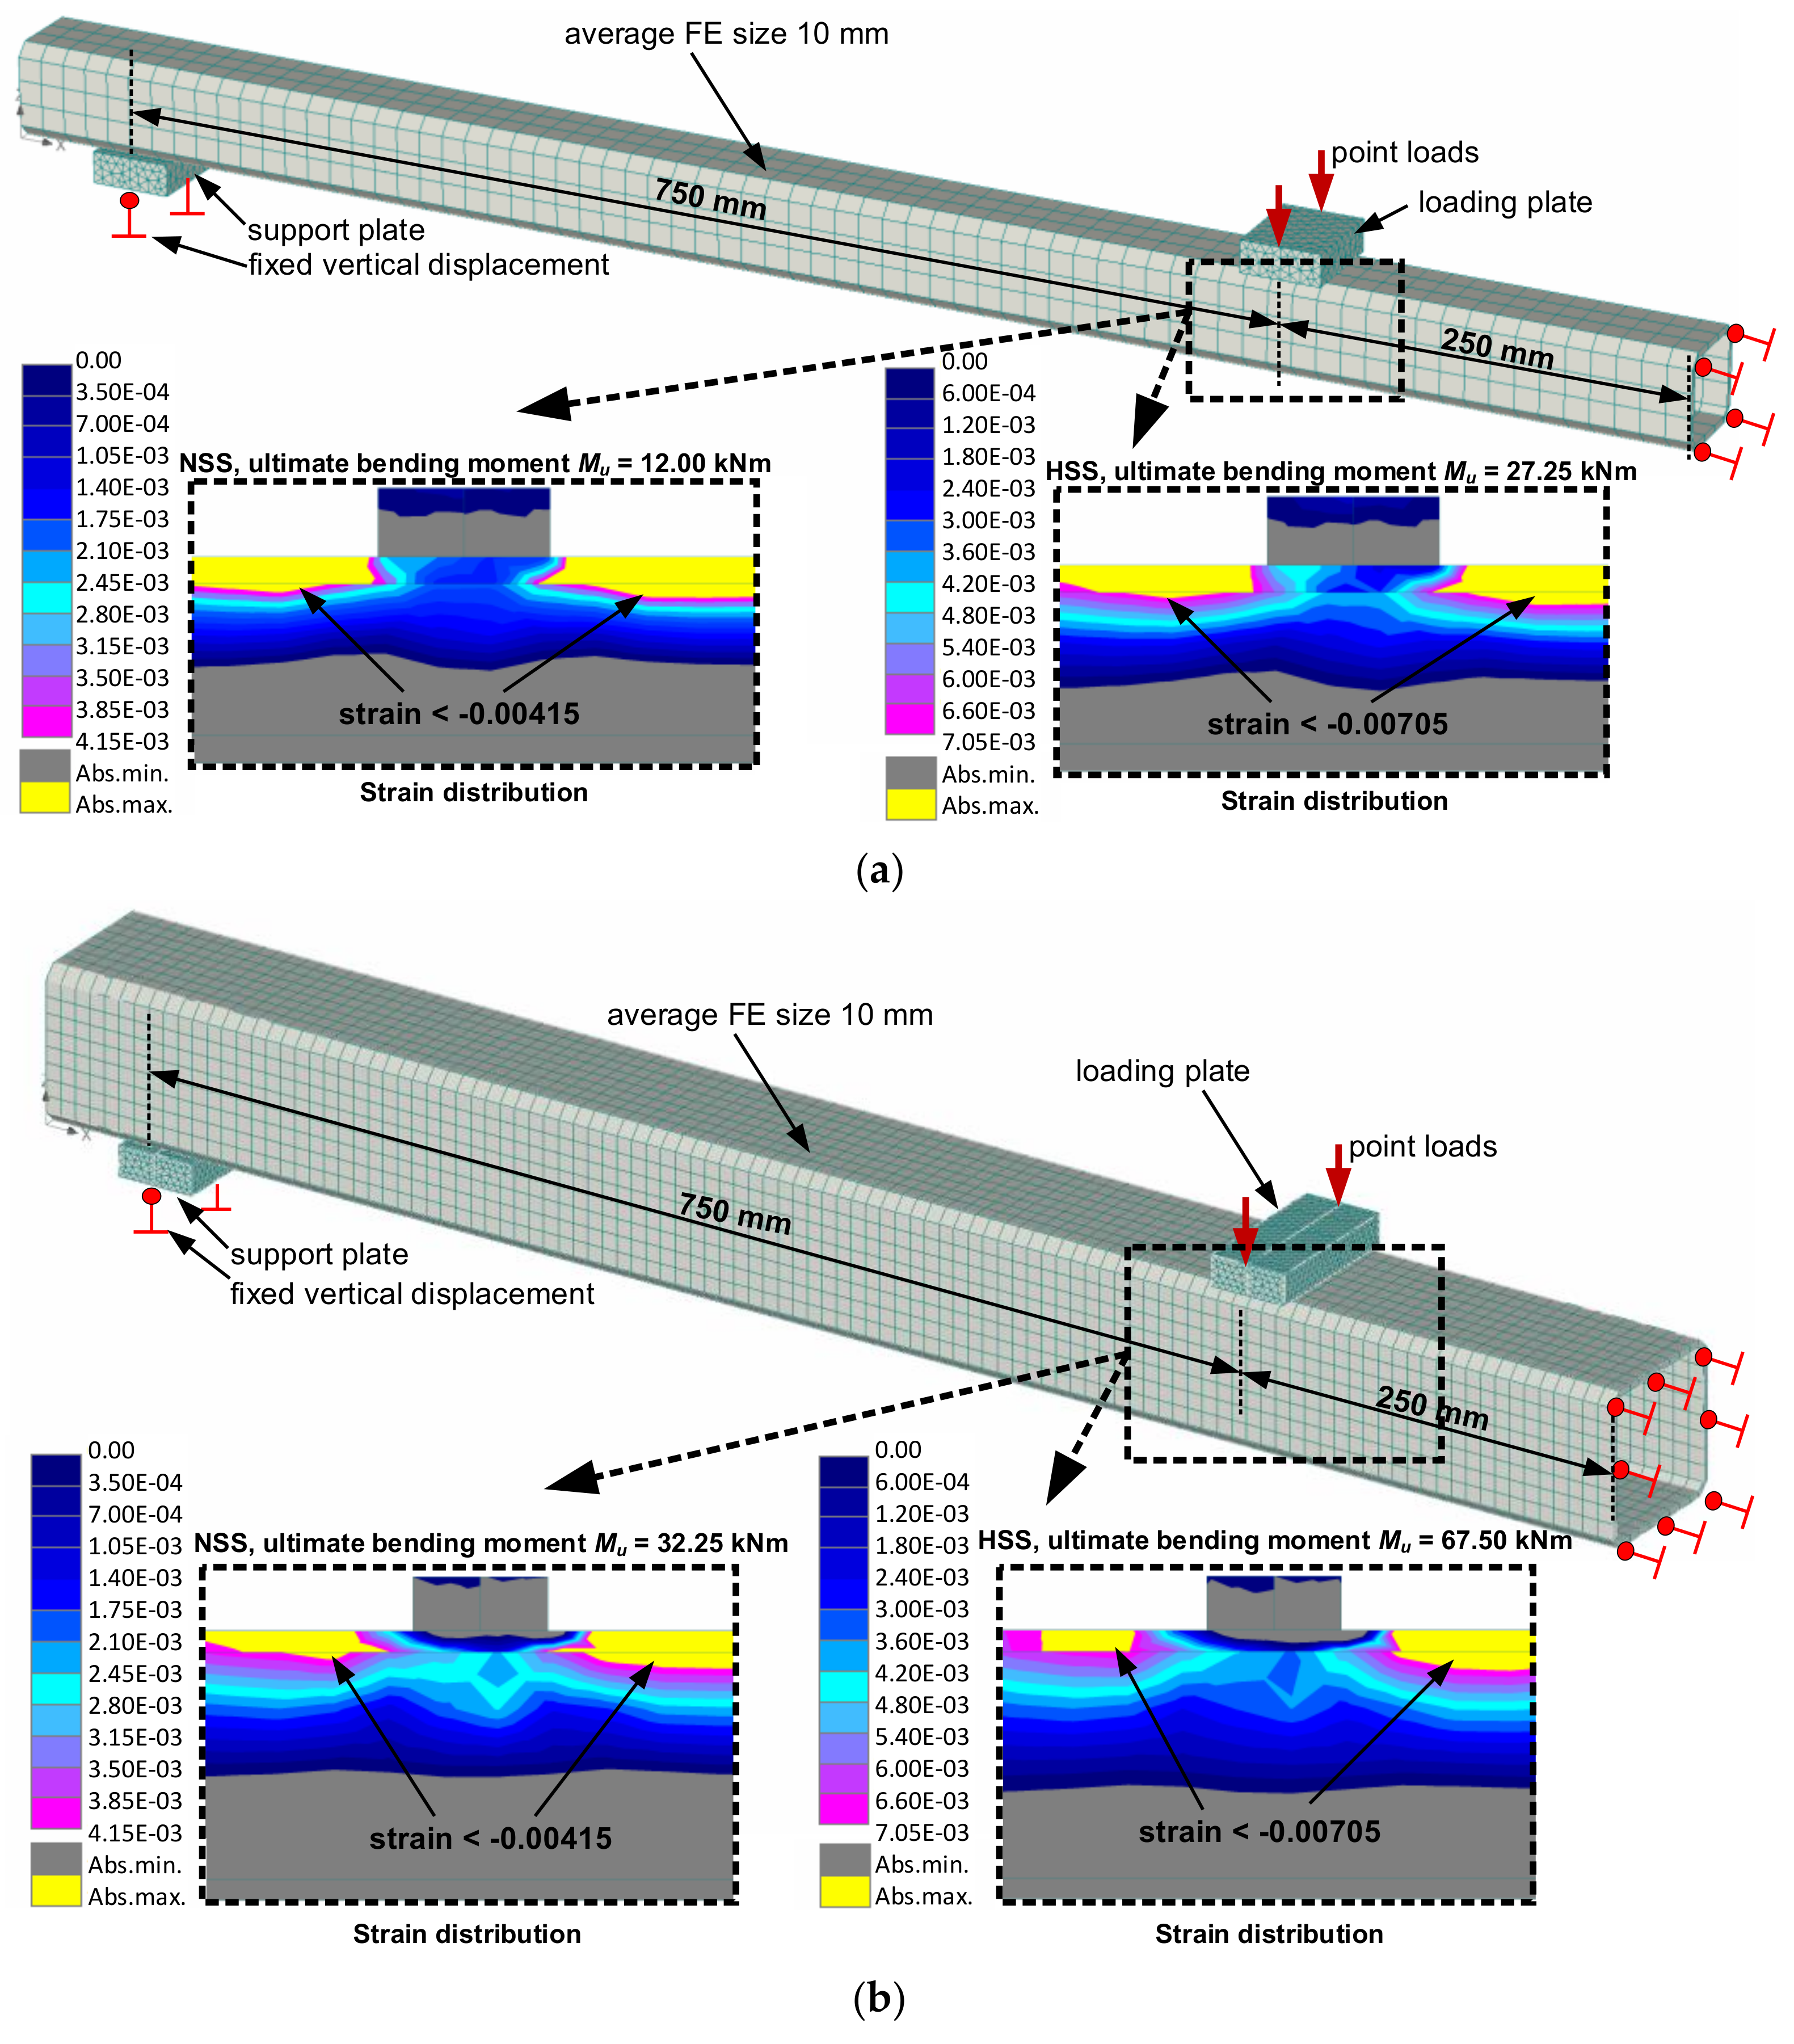
- The numerical analysis demonstrated that the HSS utilisation efficiency was dependent on the shape of the cross-section. The ratio cef was found as being equal to 89% for the 100 × 100 × 4 mm profile, whereas it increased up to 96% for the 60 × 60 × 4 mm cross-section. The actual efficiency of the utilisation of HSS in the 100 × 100 × 4 mm specimen was less substantial than that obtained in the physical tests (cef = 85%). This was a consequence of the idealised approximation of the deformation localisation process in the tubular profiles assumed in FE analysis.
Author Contributions
Funding
Conflicts of Interest
References
- Young, B.; Li, H.T. Behaviour of cold-formed high strength steel RHS under localized bearing forces. Eng. Struct. 2019, 183, 192–205. [Google Scholar]
- Gkantou, M.; Theofanous, M.; Baniotopoulos, C. Plastic design of hot-finished high strength steel continuous beams. Thin-Walled Struct. 2018, 133, 85–95. [Google Scholar] [CrossRef]
- Lan, X.; Chan, T.M.; Young, B. Structural behavior and design of chord plastification in high strength steel CHS X-joints. Constr. Build. Mat. 2018, 191, 1252–1267. [Google Scholar] [CrossRef]
- Young, B.; Li, H.T. Design of cold-formed high strength steel tubular sections undergoing web crippling. Thin-Walled Struct. 2018, 133, 192–205. [Google Scholar]
- Yan, J.J.; Chen, M.T.; Quach, W.M.; Yan, M.; Young, B. Mechanical properties and cross-sectional behavior of additively manufactured high strength steel tubular sections. Thin-Walled Struct. 2019, 144, 106–158. [Google Scholar] [CrossRef]
- Misiunaite, I.; Rimkus, A.; Jakubovskis, R.; Sokolov, A.; Gribniak, V. Analysis of local deformation effects in cold-formed tubular profiles subjected to bending. J. Construct. Steel Res. 2019, 160, 598–612. [Google Scholar] [CrossRef]
- Gardner, L.; Saari, N. Comparative experimental study of hot-rolled and cold-formed rectangular hollow sections. Thin-Walled Struct. 2010, 48, 495–507. [Google Scholar] [CrossRef]
- Gardner, L.; Yun, X. Description of stress-strain curves for cold-formed steels. Construct. Build. Mat. 2018, 189, 527–538. [Google Scholar] [CrossRef]
- Afshan, S.; Rossi, B.; Gardner, L. Strength enhancements in cold-formed structural sections – Part I: Material testing. J. Constr. Steel Res. 2013, 83, 177–188. [Google Scholar] [CrossRef] [Green Version]
- Rossi, B.; Afshan, S.; Gardner, L. Strength enhancements in cold-formed structural sections – Part II: Predictive models. J. Constr. Steel. Res. 2013, 83, 189–196. [Google Scholar] [CrossRef] [Green Version]
- Ma, J.L.; Chan, T.M.; Young, B. Material properties and residual stresses of cold-formed high strength steel hollow sections. J. Constr. Steel Res. 2015, 109, 152–165. [Google Scholar] [CrossRef]
- Wang, J.; Afshan, S.; Gkantou, M.; Theofanous, M.; Baniotopoulus, C.; Gardner, L. Flexural behaviour of hot-finished high strength steel square and rectangular hollow sections. J. Constr. Steel Res. 2016, 121, 97–109. [Google Scholar] [CrossRef] [Green Version]
- Ma, J.L.; Chan, T.M.; Young, B. Design of cold-formed high strength steel tubular beams. Eng. Struct. 2017, 151, 432–443. [Google Scholar] [CrossRef]
- Ma, J.L.; Chan, T.M.; Young, B. Experimental investigation of cold-formed high strength steel tubular beams. Eng. Struct. 2016, 126, 200–209. [Google Scholar] [CrossRef]
- Xiaoyi, L.; Chen, J.; Chan, T.M.; Young, B. The continuous strength method for the design of high strength steel tubular sections in compression. Eng. Struct. 2018, 162, 165–177. [Google Scholar]
- Zhao, X.-L.; Fernando, D.; Al-Mahaidi, R. CFRP strengthened RHS subjected to transverse end bearing force. Eng. Struct. 2006, 28, 1555–1565. [Google Scholar] [CrossRef]
- International Organization for Standardization (ISO). Metallic Material – Tensile Testing – Part 1: Method of Test at Room Temperature; EN ISO 6892-1: 2016; ISO: Geneva, Switzerland, 2016. [Google Scholar]
- Standards Association of Australia (AS). Metallic Material – Tensile Testing at Ambient Temperature; AS 1391-2007; AS: Sydney, Australia, 2007. [Google Scholar]
- American Society for Testing and Materials (ASTM). Standard Test Methods for Tension Testing of Metallic Materials; E8/E8M-13a; ASTM: West Conshohocken, PA, USA, 2013. [Google Scholar]
- International Organization for Standardization (ISO). Plastics-Determination of Tensile Properties - Part 1: General Principles; EN ISO 527-1; CEN: Brussels, Belgium, 1996. [Google Scholar]
- Schafer, B.W.; Pekoz, T. Computational modeling of cold-formed steel: characterizing geometric imperfections and residual stresses. J. Constr. Steel. Res. 1998, 47, 193–210. [Google Scholar] [CrossRef]


| Material | C | Si | Mn | P | S | Al | Cr | Ni | Mo | Cu | Nb | V | Ti |
|---|---|---|---|---|---|---|---|---|---|---|---|---|---|
| HSS | 0.100 | 0.250 | 1.30 | 0.020 | 0.010 | 0.015 | – | – | – | – | 0.050 | 0.050 | 0.070 |
| NSS | 0.140 | 0.180 | 1.13 | 0.006 | 0.014 | 0.030 | 0.040 | 0.020 | – | 0.040 | 0.020 | – | 0.003 |
| Steel Grade | E (GPa) | σ0.2 (MPa) | σu (MPa) | εel (×10−3) | ε0.2 (×10−3) | σu/σ0.2 (–) | Agt (%) |
|---|---|---|---|---|---|---|---|
| S900 (HSS) | 200.6 | 1013 | 1112 | 2.94 | 7.05 | 1.1 | 2.07 |
| S355 (NSS) | 200.0 | 430 | 515 | 1.35 | 4.15 | 1.2 | 13.03 |
| Specimen | B | H | t | r | Wel | Wpl |
|---|---|---|---|---|---|---|
| (mm) | (mm) | (mm) | (mm) | (×103 mm3) | (×103 mm3) | |
| N-1 | 100.33 | 100.43 | 3.75 | 7.49 | 43.26 | 51.51 |
| N-2 | 100.62 | 99.80 | 3.72 | 7.45 | 42.70 | 51.22 |
| H-1 | 101.74 | 101.60 | 3.99 | 7.98 | 46.81 | 56.33 |
| H-2 | 101.65 | 101.68 | 4.00 | 8.00 | 46.93 | 56.53 |
| Specimen | Mu | κu × 10−4 | Mel | Mpl | Mu/Mel | Mu/Mpl |
|---|---|---|---|---|---|---|
| (kNm) | (mm-1) | (kNm) | (kNm) | (–) | (–) | |
| N-1 | 21.34 | 1.00 | 18.17 | 21.63 | 1.17 | 0.99 |
| N-2 | 21.41 | 1.01 | 17.93 | 21.38 | 1.19 | 1.00 |
| H-1 | 43.05 | 1.35 | 47.44 | 57.08 | 0.91 | 0.75 |
| H-2 | 43.13 | 1.26 | 47.56 | 57.29 | 0.91 | 0.75 |
© 2020 by the authors. Licensee MDPI, Basel, Switzerland. This article is an open access article distributed under the terms and conditions of the Creative Commons Attribution (CC BY) license (http://creativecommons.org/licenses/by/4.0/).
Share and Cite
Misiūnaitė, I.; Gribniak, V.; Rimkus, A.; Jakubovskis, R. The Efficiency of Utilisation of High-strength Steel in Tubular Profiles. Materials 2020, 13, 1193. https://doi.org/10.3390/ma13051193
Misiūnaitė I, Gribniak V, Rimkus A, Jakubovskis R. The Efficiency of Utilisation of High-strength Steel in Tubular Profiles. Materials. 2020; 13(5):1193. https://doi.org/10.3390/ma13051193
Chicago/Turabian StyleMisiūnaitė, Ieva, Viktor Gribniak, Arvydas Rimkus, and Ronaldas Jakubovskis. 2020. "The Efficiency of Utilisation of High-strength Steel in Tubular Profiles" Materials 13, no. 5: 1193. https://doi.org/10.3390/ma13051193
APA StyleMisiūnaitė, I., Gribniak, V., Rimkus, A., & Jakubovskis, R. (2020). The Efficiency of Utilisation of High-strength Steel in Tubular Profiles. Materials, 13(5), 1193. https://doi.org/10.3390/ma13051193