Article

Effect of Carbonaceous Components on Tribological Properties of Copper-Free NAO Friction Material

1
Department of Materials Science and Engineering, I-SHOU University, Kaohsiung 84001, Taiwan
2
Graduate Institute of Applied Science and Technology, National Taiwan University of Science and Technology, Taipei 10607, Taiwan
*
Author to whom correspondence should be addressed.
Materials 2020, 13(5), 1163; https://doi.org/10.3390/ma13051163
Submission received: 31 December 2019 / Revised: 20 February 2020 / Accepted: 2 March 2020 / Published: 5 March 2020

Abstract

:
Copper helps to accelerate heat transfer during the braking process, allowing the brake materials to produce a stable coefficient of friction (COF), which in turn reduces wear loss and braking noise. However, its properties are also quite harmful to aquatic organisms. Finding a suitable replacement that fits all functions of copper for brake materials is not an easy feat. In this paper, six different carbonaceous components (coke, carbon black, carbon fiber, artificial graphite, natural graphite and expanded graphite) were substituted for copper in non-asbestos organic (NAO) friction materials. The hardness, thermal conductivity and tribological behaviors of these copper-free NAO friction materials were examined. Experimental results indicate that carbonaceous components improve lubrication and assist the friction composites with generating friction layers on the worn surface. Specimens containing coke, carbon black or carbon fiber exhibit broken friction layers, whereas specimens containing artificial graphite, natural graphite or expanded graphite exhibit quite adherent and smooth friction layers. Among all the copper-free carbon containing specimens, the specimen containing expanded graphite appears to be the best choice. It has the highest thermal conductivity, a relatively low wear loss and a relatively high and stable COF.

1. Introduction

Non-asbestos organic (NAO) friction materials are vital in automotive brake components such as brake shoes, brake pads, brake linings, etc. NAO friction materials composed of fibrous reinforcement, internal lubricant, and friction modifiers are usually bound by phenolic resins [1,2,3]. Copper (Cu) is one of friction materials widely used in brake materials due to its excellent ductility, high conductivity, and good mechanical properties. Cu induces smooth sliding conditions to produce a stable coefficient of friction. Consequently, both the wear loss and braking noise can be largely reduced. Cu also speeds up the thermal energy release during the braking process and reduces the contact temperatures of friction materials, thus avoiding thermal fade.
At present, most of the brake materials contain 1–15% Cu [4,5]. However, as the concentration of copper in water or food exceeds 20 micrograms per gram (µg/g), it can be toxic, especially for aquatic organisms such as to algae, fungi, mollusks and fish. Aquatic organisms are 10 to 1000 times more sensitive to the toxic effects of copper than mammals [6,7,8]. Cu may cause an imbalance in the aquatic food chain and cause rapid death/growth of aquatic organisms. According to earlier research, copper is a neurobehavioral toxicant in fish. In addition, it inhibits olfaction of fish, such as salmon [5,9,10]. Wear debris containing copper may therefore inevitably endanger the marine ecology. For the sustainability of marine ecology, the states of Washington [11] and California [12] both passed legislation limiting the copper content in brake materials in 2010. The development of copper-free friction materials in brake pads thus responds to the above demands. A lot of research or studies on possible ingredients for replacing copper in copper-free NAO friction materials such as organic fibers [13,14,15,16], non-copper metals [17,18,19], solid lubricants [20,21,22,23] and others [24,25,26] have been reported since then.
The solid lubricant, one key component in friction materials, is critically important for the safe and smooth operation of tribological systems. Graphite and other carbonaceous components are well-known nontoxic solid lubricants. These carbonaceous components possess self-lubricating properties, are able to stabilize the coefficient of friction, reduce wear loss and reduce braking noise during the braking process [20,21,22,23,27,28,29,30,31,32,33,34]. Additionally, the high thermal conductivity of carbonaceous components can also accelerate the escaping of the friction heat [20,21,22,23]. With properties similar to those of copper, carbonaceous components may be a suitable replacement as raw materials for copper-free NAO. However, carbonaceous components with varying crystalline structures, crystallinity, size, shape, and appearance may affect the mechanical and thermal properties of friction materials.
Some studies on the tribological performance of various graphite and other carbonaceous components in friction materials are reported [20,21,22,23,27,28,29,30,31,32,33,34]. Kolluri et al. [27] compared the effect of both natural and synthetic graphite and their sizes on fade and recovery properties in friction materials. Natural graphite was found to be more effective to boost friction than synthetic graphite. The fade properties of friction materials were unaffected by the particle size of natural graphite, but fade resistance tended to increase with a decrease in the particle size of synthetic graphite. Cho et al. [28,29] reported the complementary effects between graphite and other solid lubricants in friction materials. Gilardi et al. [20] studied the effects of graphite type on noise reduction in brake pads. They discovered that adding thermal graphite into friction materials resulted in higher thermal conductivity and the better noise reduction performance than when synthetic graphite was added. Aranganathan et al. [21,22,30] concluded that adding thermal graphite in friction materials showed good thermal properties, fade performance, wear resistance, and lubricity in their study and recommended that thermal graphite should be the replacement component for copper. Manoharan et al. [23] compared three kinds of graphite, vein graphite, flake graphite and expandable graphite, as solid lubricants in brake materials and drew the conclusion that brake materials containing expandable graphite exhibited the best thermal stability with good fade and recovery performance among them. Ertan and Yavuz [31] investigated the role of solid lubricants (graphite, coke, and ZnS) on brake performance. They discovered that graphite has a positive effect on the properties of brake linings. However, brake linings containing a high concentration of coke express an unstable coefficient of friction (COF) relationship with the temperature and number of braking cycles. Ahmadijokani et al. [32] investigated the effect of short carbon fibers on the mechanical properties and tribological behaviors of friction materials and discovered that the COF and specific wear rate of friction materials dropped with the addition of carbon fiber. Carbon fiber also aggravated the fade behavior, with a reduction of the COF with temperature increase. Lee et al. [34] studied the effects of two types of liquid impregnant-derived carbon (coal-tar pitch and phenolic resin) on tribological behaviors in a high energy automotive brake system. Results showed that the lamellar carbon transferred from the pitch impregnant generated a lubricating film but the glassy carbon transferred from the resin impregnant demonstrated difficulty in generating a lubricant film. Thus, friction materials with pitch-derived carbon showed more stable tribological performance than those with resin-derived carbon.
Undoubtedly, graphite and other carbonaceous components play important roles in friction materials. However, it is difficult to differentiate whether the composition of carbon adding or the fabrication processes play the key role. In this study, the authors make a systematic comparison among different carbonaceous components. We chose six different kinds of carbonaceous components—coke, carbon black, carbon fiber, artificial graphite, natural graphite and expanded graphite—to replace copper in NAO friction materials. The mechanical, thermal and tribological properties of these copper-free NAO friction materials also were examined.

2. Materials and Methods

2.1. Raw Materials

Table 1 lists the formulas of the fabricated specimens. Each specimen contains 14–15 ingredients, including 27.7 vol % binder, 17.5 vol % fibrous reinforcement, 13.9 vol % lubricant, 35.8 vol % friction modifiers and 5.1 vol % theme ingredient (copper components or copper-replaced (carbonaceous) components). Due to business confidentiality, the detailed content ratio of each component is not described here. In Table 2, the parent ingredients, including binder, fibrous reinforcements, lubricants and friction modifiers, were kept fixed at 94.9 vol %. The control specimen containing copper is designated as NAO. The copper-free specimens are obtained by replacing copper with carbonaceous components. Those copper-replaced (carbonaceous) components which had been used in different copper-free specimens are coke (designated as Coke), carbon black (designated as CB), carbon fiber (designated as CF), artificial graphite (designated as AG), natural graphite (designated as NG) and expanded graphite (designated as EG).
Table 3 lists the specification of carbonaceous components used in this study, including the size, thermal conductivity and the manufacturer. Expandable graphite powders (3772, Anthracite Industries, Sunbury, PA, USA) were treated in a microwave oven in ambient conditions at 700 W for 5–10 seconds, 15 times, to form expanded graphite. The morphologies and microstructures of these carbonaceous components were observed using a Hitachi S3400 scanning electron microscope (SEM) (Hitachi Instruments Inc., Tokyo, Japan). The particle sizes of these components were measured using the Horiba LA-350 laser diffraction particle size analyzer (Horiba Scientific, Kyoto, Japan).

2.2. Sample Preparation

The sample preparation includes pretreatment of raw materials, mixture of raw materials, hot pressing and post-curing. At first, the aramid pulps were first shaken for one minute (1725 times) using the mixer (8000M Mixer/Mill, SPEX® SamplePrep, Metuchen, NJ, USA). After that, all ingredients were then added into a V-shaped mixer (SY-RBV, Shang Yuh Machine Corp., Ltd, New Taipei City, Taiwan) to mix for 30 min. The mixture was press-molded to a round disk of 25.4 mm in diameter and 10 mm in thickness at 170 °C under a unidirectional pressure of 150 MPa. Finally, the green specimens were then post-cured in an air furnace for four hours at 160 °C.

2.3. Hardness Test

The hardness of each specimen was measured by using a hardness test machine (ATK-600, Akashi Corp., Osaka, Japan) according to ASTM E18 standard. A 12.7 mm spherical steel ball shape indenter was used, to which the applied load was set at 100 kgf (HRS). Each set of specimens was tested in five different positions and the average value of hardness was measured.

2.4. Thermal Conductivity

The thermal conductivity of each specimen was measured using a thermal conductivity analyzer (Hot disk TPS 2500S, Techmark Precision Instrument Co., Ltd., Göteborg, Sweden) with the transient plane heat source method (ISO 22007-2). A 3.189 mm radius Kapton type sensor was used and placed between two pieces of specimen. The thermal conductivity was measured using input power 50 mW for two to four seconds.

2.5. Friction and Wear Test

The friction and wear tests were operated on a homemade disc-on-disc sliding wear tester, as shown in Figure 1. A SAE-G2500 square cast iron (32 mm × 32 mm) was fitted on the rotor as counter face material. Before testing, the specimens and the cast iron were polished using a level of #400 grit paper. A fixed pressure of 1 MPa, constant rotor speed of 800 rpm (linear speed of 0.53 m/s) and testing time of 600 s (sliding distance of 320 m) were used for all wear processes. In order to maintain the similar surface condition of the specimen in each wear test, wear processes were conducted twice as a running-in period before the wear test. After that, wear processes were conducted five times as a wear test for each specimen. At least three specimens were measured for each condition. All tests were performed at room temperature in an atmosphere subject to a relative humidity in the range of 50–70 RH%. The COF was determined from the output of a strain gauge (LRK-100K, NTS Technology, Nara, Japan) and reduced from the formula, μ = M r × F n , where μ is the friction coefficient, M is the moment, Fn is the load and r is the radius of specimen. The average COF of each wear test was calculated from the formula μ avg = 0 t μ t dt t , where μavg is the average friction coefficient, μ is the friction coefficient and t is the sliding time. At least 15 wear processes were conducted for each condition, and the average value of the average COF was measured.
The weight difference between before and after five times of wear processes of each specimen was measured with an electronic balance (AG285, Mettler Toledo, Greifensee, Switzerland). As the density is very different from the NAO to the other specimens, the wear weight loss of each specimen was translated into volume loss. The wear volume loss of each specimen was calculated from the formula V loss = W loss D , where Vloss is wear volume loss, Wloss is wear weight loss and D is density of the specimen. The density of the NAO specimen is 2.28 g/cm3, the density of the EG specimen is 1.62 g/cm3 and the density of the other specimens is about 1.92–1.94 g/cm3. The detailed test method of density is shown in Supplementary Materials (Figure S1).
The morphologies of the polished surfaces and worn surfaces were examined using a SEM (S3400, Hitachi Instruments Inc., Tokyo, Japan). The average surface roughness (Ra) of the polished surfaces and worn surfaces was measured using a surface profilometer (Surftest SJ-210, Mitutoyo Corp., Kanagawa, Japan). The stylus tip of profilometer was skidded on the surface for 4 mm at a speed of 0.5 mm/s. At least 24 paths were skidded for each condition and the average value of the surface roughness was measured.

3. Results and Discussion

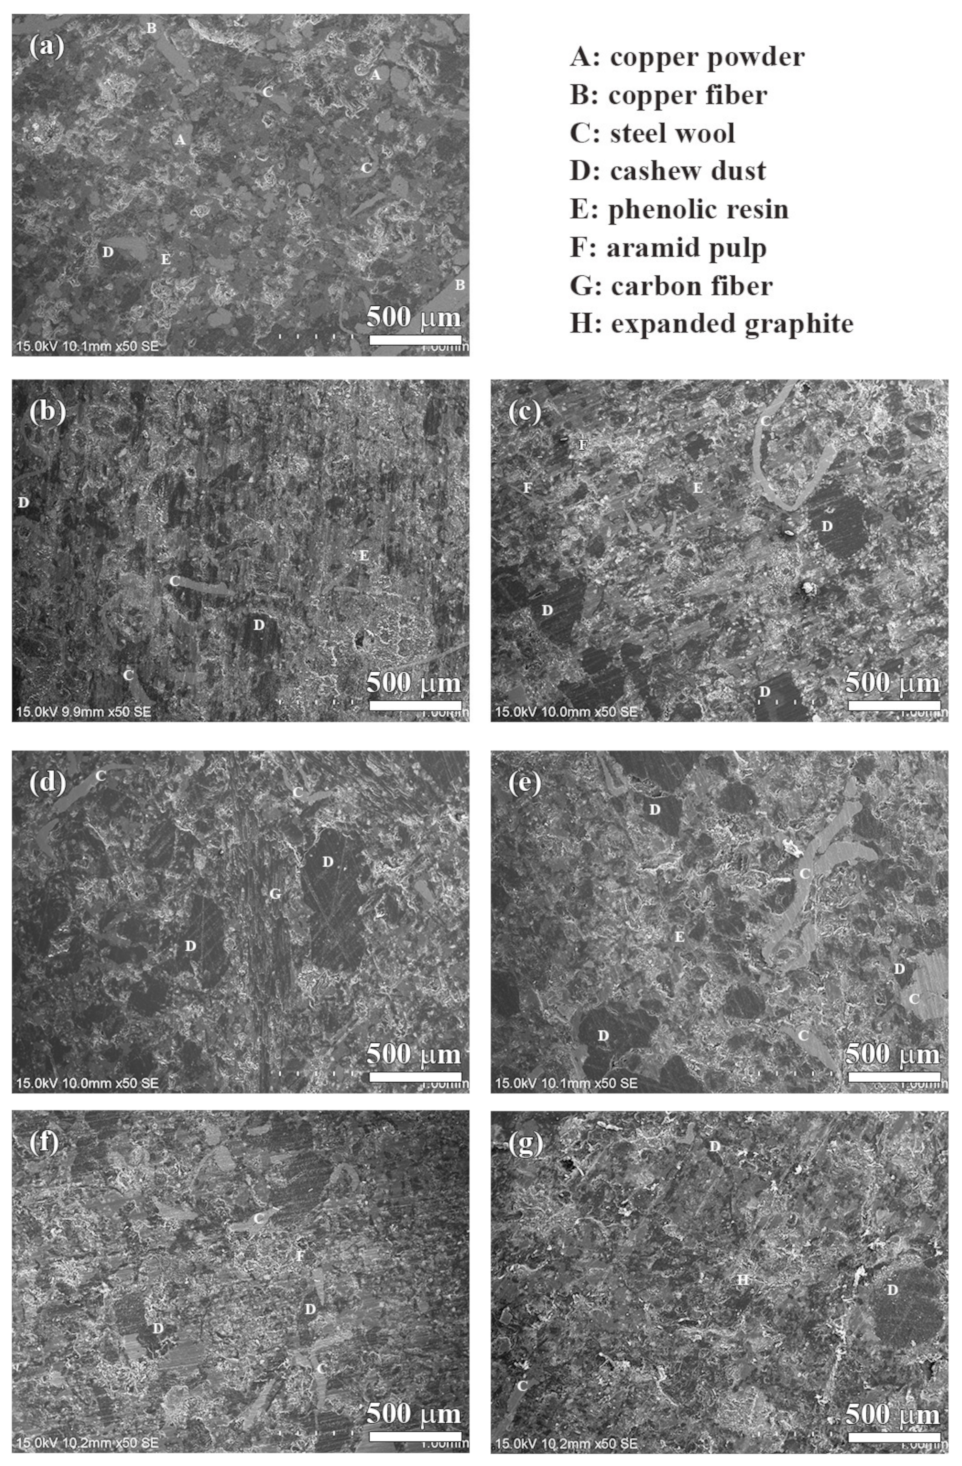
3.1. Morphologies of Carbonaceous Components

The SEM morphologies of the carbonaceous components are shown in Figure 2. Several pores with diameters of less than 1 µm can be observed on the coke particle (Figure 2a). Figure 2b shows an aggregation of carbon black particles whose size is less than 100 nm. The chopped carbon fiber with a clean surface is 7 µm in diameter (Figure 2c). The artificial graphite particles show a layer-like structure (Figure 2d). The natural graphite has a sheet-like and flake shape (Figure 2e). The expanded graphite is composed of several graphite sheets and shows a loose and porous structure (Figure 2f).

3.2. Hardness

Figure 3 shows the hardness of each specimen. The hardness of the Coke, CB, CF and AG specimens do not show significant difference (~80 HRS); the hardness of the NG specimen is slightly lower (~77 HRS), but the hardness of EG specimen (~40 HRS) is the lowest among all specimens. The morphology of natural graphite, which easily splits along the slice (Figure 2e), probably explains why the hardness of the NG specimen is slightly lower. For the EG specimen, the morphology of expanded graphite is loose and porous (Figure 2f), resulting in the lowest hardness out of all the specimens.

3.3. Thermal Conductivity

Figure 4 shows the thermal conductivity of each specimen. Among the six specimens, the EG specimen shows the highest thermal conductivity (2.6 W/mK). The thermal conductivity of the AG and NG specimens are about the same as the NAO (2.0 W/mK). The CB and CF specimens have lower thermal conductivity (1.6 W/mK) in comparison with the above four, and the Coke specimen has the lowest thermal conductivity of all specimens (1.4 W/mK).
The thermal properties of the carbonaceous components depend on their crystal structure, crystallinity, size, shape, porosity, etc. Carbon atoms in the graphite crystal are in a sp2-hybridized state. The theoretical thermal conductivity of graphite along the basal plane can be up to 398 W/mK, but on the vertical basal plane, it is only 2.2 W/mK at room temperature [40]. The expanded graphite is composed of graphite sheets and shows excellent thermal conductivity (a-axis: 400–1300 W/mK, c-axis: 3–65 W/mK) [41]. The thermal conductivity of the Coke, CB and CF specimens is lower than that of the AG and NG specimens, which could be due to the thermal conductivity of coke, carbon black, and carbon fiber (0.2–70 W/mk), which are about one sixth of graphite (a-axis: 398 W/mK, c-axis:2.2 W/mK) [35,36,37,38,39]. Additionally, small pores in the coke, as shown in Figure 2a, result in the Coke specimen having the lowest thermal conductivity among all specimens.

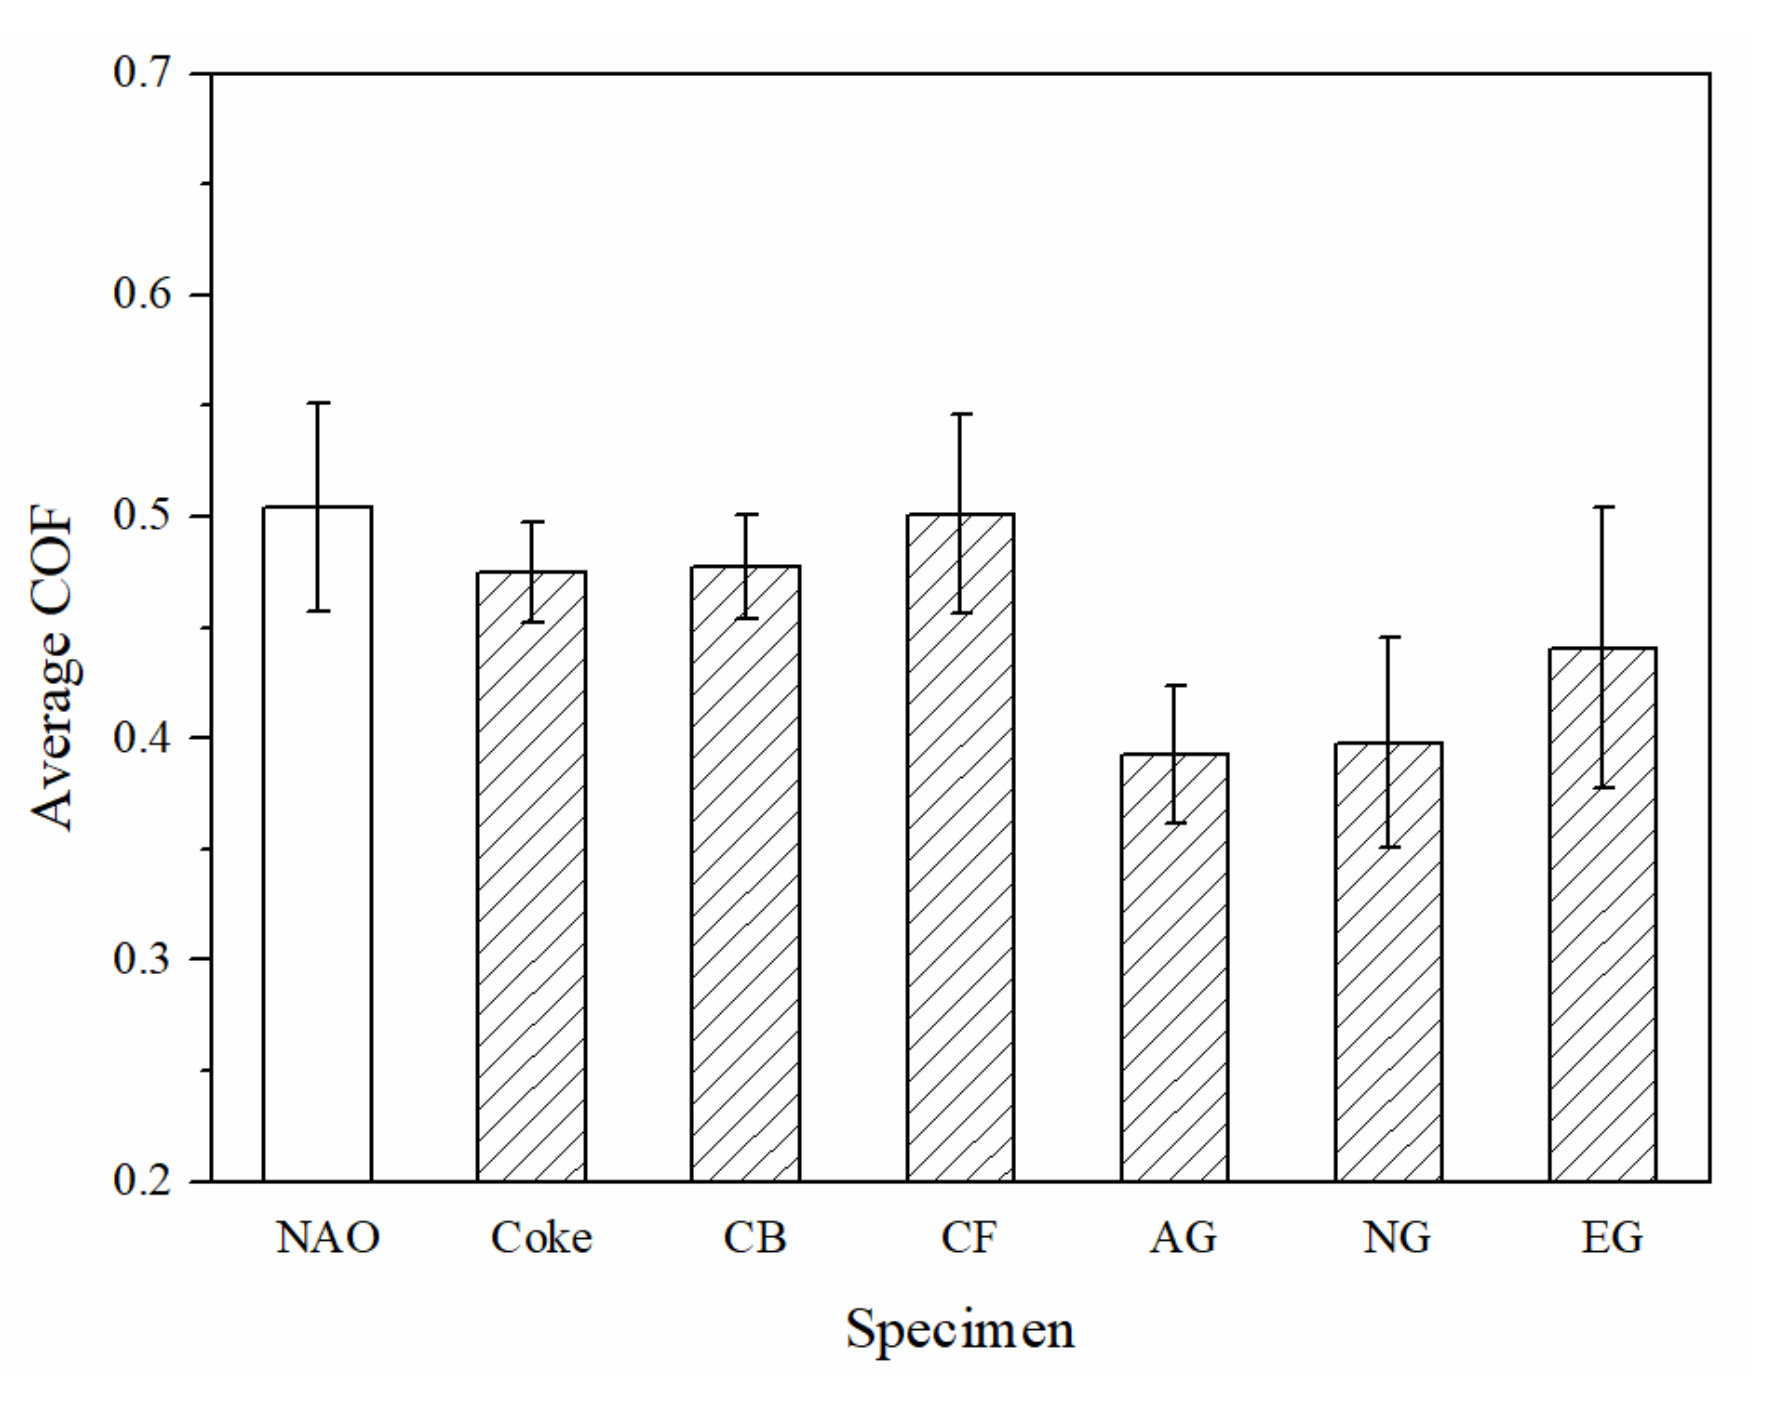
3.4. Friction and Wear

Typical COF curves of specimens under the same pressure (1 MPa) and speed (800 rpm) from at least 15 wear processes are shown in Figure 5. As shown in Figure 5a, the maximum static COF is 0.45, and the kinetic COF is 0.41 at the beginning of the wear test for the NAO specimen. The COF rises up to 0.55 at around 200 s, after which the value keeps at 0.55 from 200 to 600 s.
For the Coke specimen (Figure 5b), the COF rises from 0.46 to 0.63 in the first 130 s and then maintains a high value from 130 to 250 s. However, the COF of the Coke specimen drops down to 0.40–0.45 after 250 s. The COF curve of the Coke specimen is more fluctuant and unstable than that of the other specimens. As shown in Figure 5c, the CB specimen exhibited a similar COF curve as the NAO specimen. Different from the NAO specimen, the CB specimen shows a slight fluctuant curve from 150 to 400 s and exhibits a drop in the COF from 0.50 to 0.45 at around 475 s. In the Figure 5d, the COF of the CF specimen rises from 0.50 to 0.65 at first 115 s and then decreases to 0.47 at around 300 s. After that, the COF curve of the CF specimen becomes stable. The profile of curve is like a stairs shape.
As shown in Figure 5e, the AG specimen showed the most stable COF curve among all the specimens, and the COF is about 0.37–0.40. For the NG and EG specimens (Figure 5f,g), the profiles of the COF curves are also stable; however, the COF curves are like a stairs shape. The EG specimen shows a bit higher COF than the NG specimen.
The average coefficient of friction (COF) of the specimens are shown in Figure 6. Among copper-free carbon containing specimens, the CF specimen shows the highest average COF (0.50), whereas the AG and NG specimens show the lowest average COF (0.39). Except the carbon fiber containing (CF) specimen, the average COF of all the other copper-free carbon containing specimens are lower than the NAO specimen (0.50).
Each column of the bar chart in Figure 7 represents the wear volume loss of the specimens. The NAO specimen, containing copper, shows the highest wear loss (0.023 cm3) of all the specimens. Among the copper-free carbon containing specimens, the CF specimen shows the highest wear loss (0.016 cm3), but the AG, NG and EG specimens show low wear loss (0.010–0.011 cm3). Carbonaceous components can improve the wear resistance of the specimens. The wear volume loss of copper-free carbon containing specimens is 30–57% lower than that of the NAO specimen.
In comparison with the NAO specimen, the copper-free carbon containing specimens not only present a lower COF but also lower wear loss, especially the specimens with graphite-like carbonaceous components (i.e., AG, NG and EG). As is commonly known [42,43], graphite is a layered solid with hexagonal lattice. The carbon atoms in the basal plane are bonded with strong covalent bonds. However, between the basal planes is a weak intermolecular force, the Van der Waals force. As a shear force acts on the graphite, the basal planes slide over one another by intracrystalline slip and provide good lubricative effect. The unique structure of graphite is the main reason why graphite-like carbonaceous components (artificial graphite, natural graphite and expanded graphite) show very good lubricating properties.
In addition, coke and the carbon fiber have a high carbon content and a high percentage of non-graphitic structures [44]. Both the quantity and quality of the basal planes of coke or carbon fiber are not as good as graphite, which may result in a higher COF and a higher wear loss of the Coke and CF specimens. On the other hand, the Young’s modulus of carbon fiber is higher than that of other carbon components such as coke and graphite. This higher Young’s modulus, characteristic of carbon fiber, may make the fiber difficult to be compacted. In addition, the stable friction layer on the worn surface is also not easy to form. Therefore, the CF specimen has the highest COF and wear loss in comparison with the other copper-free carbon containing specimens.
Carbon black is composed of several nano scale carbon spheres, which also consist of layers of graphene sheets [44]. However, the lubricity of carbon black is not similar to graphite-like carbonaceous components (artificial graphite, natural graphite and expanded graphite). The CB specimen shows a higher COF and wear than the AG, NG and EG specimens. The size of carbon black (nano-scale) is much smaller than that of graphite-like carbonaceous components (micro-scale). Due to the small size of carbon black, it may be difficult to generate as continuous and stable lubricant film as graphite-like carbonaceous components. The size effect might be the reason for the slight lubricity of the CB specimen.

3.5. Morphologies of Polished Surface and Worn Surface

The SEM morphologies of the polished specimens are shown in Figure 8. The surfaces were polished using a level of #400 grit paper. As labeled in Figure 8, the different kinds of raw materials were distributed on the polished surface of the specimen, such as copper powder, copper fiber, steel wool, phenolic resin, cashew dust, carbonaceous components and so on.
The worn surfaces of the specimens are shown in Figure 9 and Figure 10. As shown in Figure 9a, there are several small sized patches (50–200 µm) on the worn surface of the NAO specimen. Some sub-cracks, cracks and pores are observed on the friction layer (as indicated in arrows in Figure 9a and Figure 10a).
In earlier research [45], Eriksson and Jacobson had pointed out two types of contact plateaus, the primary and the secondary plateaus, on the worn surface of organic brake materials. The hard constitutes or fibrous reinforcements with stable mechanical properties and good wear resistance on the worn surface are called primary plateaus. The plateaus which are induced from primary plateaus and made up of compacted/sintered debris are called secondary plateaus. In this study, the primary plateaus (bright patches) and the secondary plateaus (dark patches) were both observed on the worn surface of the NAO specimen (as indicated by arrows in Figure 9a and Figure 10a).
Unlike the NAO specimen, all the copper-free carbon containing specimens exhibited obvious friction layers. Large sized friction layers covered the worn surfaces of the Coke, CB and CF specimens, as shown in Figure 9b–d. However, their friction layers were broken. This might be due to the sub-cracks generated and cracks growing during the wear test, as shown in Figure 10b–d. The broken friction layers may explain why the Coke, CB and CF specimens show higher wear loss than that of the AG, NG and EG specimens.
The worn surfaces of the AG and NG specimens show large sized, smooth and quite adherent friction layers (Figure 9e,f). There are few cracks and sub-cracks on the friction layers, as shown in Figure 10e,f. The smooth friction layer may be due to the soft and lamellar structure of graphite. In addition, this smooth worn surface also explains the stable COF curve and low wear loss during the wear test.
It should be noticeable that the COF curve of NG is like a stairs shape (Figure 5f), but the curve of AG is not (Figure 5e). However, both the AG and NG specimens show a similar worn surface (Figure 10e,f). This is because the worn surfaces of the specimens are affected by the tribological behaviors of the specimens at the final stage of the wear test. At the final stage of the wear test (400–600 s), the AG and NG specimens exhibited stable COF curves and similar COF values. Therefore, this phenomenon reflects that AG and NG show a similar worn surface. As shown in Figure 9g and Figure 10g, the worn surface of the EG specimen shows few sub-cracks on the large sized, quite adherent friction layer.

3.6. Surface Roughness of Polished Surface and Worn Surface

Figure 11 shows the surface roughness of each specimen on the polished surface and worn surface. The polished surfaces were treated with the same condition, therefore the surface roughness of each specimen on the polished surface is close (1.25–1.30 µm), as shown in Figure 11.
After wear test, the surface roughness of the NAO specimen was reduced to 1.05 µm. The results can be explained by soft copper being rubbed to form a smooth friction layer during the wear process. In an earlier study, Kumar and Bijwe [46] also observed a smooth surface topography and appearance of a very thin fine copper enriched friction layer on the worn surface of copper-containing friction materials.
In comparison with the NAO specimen, the copper-free carbon containing specimens show a rough worn surface instead of a polished surface. The friction layers of the copper-free carbon containing specimens are rougher than the copper enriched friction layer of the NAO specimen. For the Coke, CB and CF specimens, the surface roughness of the worn surfaces is about 1.70–1.80 µm. The broken friction layers, as shown in Figure 9b–d, illustrate that the surface roughness of the Coke, CB and CF specimens increases after the wear process. For the copper-free carbon containing specimens, the rougher worn surfaces of the Coke, CB and CF specimens were responsible for the higher COF and larger wear loss during the wear process, as shown in Figure 6 and Figure 7.
The AG and NG specimens appear the smoothest worn surface among all the copper-free carbon containing specimens; the worn surface roughnesses are about 1.38 µm. This is attributed to the fact that the AG and NG specimens show smooth and quite adherent friction layers, as shown in Figure 9e–f. As shown in Figure 9g, the worn surface of the EG specimen is slightly rougher than that of the AG and NG specimens. The worn surface roughness of the EG specimen was 1.42 µm. The smoother worn surface of the AG and NG specimens were also accompanied by a lower COF and smaller wear loss. The EG specimen with a slightly rougher worn surface was accompanied by a higher COF than that of the AG and NG specimens.
The specimens containing graphite-like carbonaceous components show high thermal conductivity, good wear resistance (low wear loss) and a stable and smooth worn surface. In the meantime, the average COFs of the AG and NG specimens 23% lower than that of the NAO specimen. The average COF of the EG specimen is 13% lower than that of the NAO specimen. Among all the specimens, the EG specimen shows the highest thermal conductivity, a relatively low wear loss and a relatively high and stable COF. It seems that expanded graphite has potential to be the candidate to replace copper in copper-free NAO friction materials.

4. Conclusions

(1)
In comparison with NAO specimens, specimens containing expanded graphite (EG) have a higher thermal conductivity; the specimens containing artificial graphite (AG) or natural graphite (NG) have thermal conductivity similar to the NAO specimen, and the specimens containing coke (Coke), carbon black (CB) or carbon fiber (CF) have lower thermal conductivity.
(2)
Most of the carbonaceous components used in this study can improve the tribological performance of specimens, especially graphite-like carbonaceous components, such as artificial graphite, natural graphite and expanded graphite.
(3)
The worn specimens containing coke (Coke), carbon black (CB) and carbon fiber (CF) exhibited broken friction layers. The worn specimens containing artificial graphite (AG), natural graphite (NG) and expanded graphite (EG) exhibited quite adherent and large sized friction layers.
(4)
After the wear test, the surface roughness of the AG, NG and EG specimens increase slightly. However, the Coke, CB and CF specimens show much rougher worn surfaces.
(5)
Among all of the copper-free carbon containing specimens, the specimen containing expanded graphite (EG) has the highest thermal conductivity, a relatively low wear loss and a relatively high and stable COF. It has potential to be the candidate to replace copper in copper-free NAO friction materials.

Supplementary Materials

The following are available online at https://www.mdpi.com/1996-1944/13/5/1163/s1. Supplementary materials contain the bulk density of each specimen (Figure S1 Bulk density of specimens).

Author Contributions

Conceptualization, H.-Y.L. and K.-J.L.; experiment and data analysis, H.-Y.L., Y.-C.L. and Y.-W.W.; resources, C.-F.W.; writing—original draft preparation, H.-Y.L.; writing—review and editing, H.-Z.C. and K.-J.L. All authors have read and agreed to the published version of the manuscript.

Funding

This work was funded by the Ministry of Science and Technology of Taiwan, Republic of China under the contract numbers MOST 107-2813-C-214-041-E and MOST 108-2221-E-214-015.

Acknowledgments

The authors are thankful to Jomin Teng and Cherry Hung (WINSON Machinery Co., Ltd.) for providing the cast iron and SH Lin (SHIN-YAO Co., Ltd) for providing the coke in this research. The authors also gratefully acknowledge the use of SEM belonging to the Precious Instrument Center of I-SHOU University and the use of a thermal conductivity analyzer belonging to the Metal Materials Development Center of I-SHOU University.

Conflicts of Interest

The authors declare no conflicts of interest.

References

  1. Jacko, M.G.; Rhee, S.K. Brake linings and clutch facings. In Encyclopedia of Composite Materials and Components; Grayson, M.J., Ed.; Wiley and Sons: New York, NY, USA, 1983; pp. 144–154. [Google Scholar]
  2. Bijwe, J. Composites as friction materials: Recent developments in non-asbestos fiber reinforced friction materials—A review. Polym. Compos. 1997, 18, 378–396. [Google Scholar] [CrossRef]
  3. Blau, P.J. Compositions, Functions, and Testing of Friction Brake Materials and Their Additives; Oak Ridge National Laboratory: Oak Ridge, TN, USA, 2001. [Google Scholar]
  4. Kim, S.J.; Lee, J.Y.; Han, J.M.; Kim, Y.C.; Park, H.D.; Sung, S.H.; Lee, J.J.; Cha, J.H.; Jo, J.H.; Jang, H. The role of copper on the friction and wear performance of automotive brake friction materials. SAE Int. J. Mater. Manuf. 2011, 5, 9–18. [Google Scholar] [CrossRef]
  5. Straffelini, G.; Ciudin, R.; Ciotti, A.; Gialanella, S. Present knowledge and perspectives on the role of copper in brake materials and related environmental issues: A critical assessment. Environ. Pollut. 2015, 207, 211–219. [Google Scholar] [CrossRef] [PubMed]
  6. Wright, D.A.; Welbourn, P. Environmental Toxicology; Cambridge University Press: Cambridge, UK, 2002. [Google Scholar]
  7. Bradl, H. Heavy Metals in the Environment: Origin, Interaction and Remediation; Elservier/Academic Press: London, UK, 2005. [Google Scholar]
  8. Solomon, F. Impacts of Copper on Aquatic Ecosystems and Human Health. Available online: http://www.ushydrotech.com/files/6714/1409/9604/Impacts_of_Copper_on_Aquatic_Ecosystems_and_human_Health.pdf (accessed on 30 December 2019).
  9. Hansen, J.A.; Rose, J.D.; Jenkins, R.A.; Gerow, K.G.; Bergman, H.L. Chinook salmon (Oncorhynchus tshawytscha) and rainbow trout (Oncorhynchus mykiss) exposed to copper: Neurophysiological and histological effects on the olfactory system. Environ. Toxicol. Chem. 1999, 18, 1979–1991. [Google Scholar] [CrossRef]
  10. Beyers, D.W.; Farmer, M.S. Effects of copper on olfaction of colorado pikeminnow. Environ. Toxicol. Chem. 2001, 20, 907–912. [Google Scholar] [CrossRef] [PubMed]
  11. An Act Relating to Limiting the Use of Certain Substances in Brake Friction Materials. Available online: http://lawfilesext.leg.wa.gov/biennium/2009-10/Pdf/Bills/Session%20Laws/Senate/6557-S.sl.pdf (accessed on 30 December 2019).
  12. Hazardous Materials: Motor Vehicle Brake Friction Materials. Available online: https://leginfo.legislature.ca.gov/faces/billNavClient.xhtml?bill_id=200920100SB346 (accessed on 30 December 2019).
  13. Xin, X.; Xu, C.G.; Qing, L.F. Friction properties of sisal fibre reinforced resin brake composites. Wear 2007, 262, 736–741. [Google Scholar] [CrossRef]
  14. Yun, R.P.; Filip, P.; Lu, Y.F. Performance and evaluation of eco-friendly brake friction materials. Tribol. Int. 2010, 43, 2010–2019. [Google Scholar] [CrossRef]
  15. Lee, P.W.; Filip, P. Friction and wear of Cu-free and Sb-free environmental friendly automotive brake materials. Wear 2013, 302, 1404–1413. [Google Scholar] [CrossRef]
  16. Matějka, V.; Fu, Z.; Kukutschová, J.; Qi, S.; Jiang, S.; Zhang, X.; Yun, R.; Vaculík, M.; Heliová, M.; Lu, Y. Jute fibers and powderized hazelnut shells as natural fillers in non-asbestos organic non-metallic friction composites. Mater. Des. 2013, 51, 847–853. [Google Scholar] [CrossRef]
  17. Lee, J.J.; Lee, J.A.; Kwon, S.; Kim, J.J. Effect of different reinforcement materials on the formation of secondary plateaus and friction properties in friction materials for automobiles. Tribol. Int. 2018, 120, 70–79. [Google Scholar] [CrossRef]
  18. Leonardi, M.; Menapace, C.; Matějka, V.; Gialanella, S.; Straffelini, G. Pin-on-disc investigation on copper-free friction materials dry sliding against cast iron. Tribol. Int. 2018, 119, 73–81. [Google Scholar] [CrossRef]
  19. Mahale, V.; Bijwe, J.; Sinha, S. A step towards replacing copper in brake-pads by using stainless steel swarf. Wear 2019, 424–425, 133–142. [Google Scholar] [CrossRef]
  20. Gilardi, R.; Alzati, L.; Thiam, M.; Brunel, J.F.; Desplanques, Y.; Dufrenoy, P.; Sharma, S.; Bijwe, J. Copper substitution and noise reduction in brake pads: Graphite type selection. Materials 2012, 5, 2258–2269. [Google Scholar] [CrossRef] [Green Version]
  21. Aranganathan, N.; Bijwe, J. Special grade of graphite in NAO friction materials for possible replacement of copper. Wear 2015, 330–331, 515–523. [Google Scholar] [CrossRef]
  22. Aranganathan, N.; Bijwe, J. Development of copper-free eco-friendly brake-friction material using novel ingredients. Wear 2016, 352–353, 79–91. [Google Scholar] [CrossRef]
  23. Manoharan, S.; Vijay, R.; Lenin Singaravelu, D.; Kchaou, M. Experimental investigation on the tribo-thermal properties of brake friction materials containing various forms of graphite: A comparative study. Arab. J. Sci. Eng. 2019, 44, 1459–1473. [Google Scholar] [CrossRef]
  24. Zheng, K.; Gao, C.; He, F.; Lin, Y. The role of rare earth lanthanum oxide in polymeric matrix brake composites to replace copper. Polymers 2018, 10, 1027. [Google Scholar] [CrossRef] [Green Version]
  25. Menapace, C.; Leonardi, M.; Matějka, V.; Gialanella, S.; Straffelini, G. Dry sliding behavior and friction layer formation in copper-free barite containing friction materials. Wear 2018, 398–399, 191–200. [Google Scholar] [CrossRef]
  26. Mahale, V.; Bijwe, J.; Sinha, S. Efforts towards green friction materials. Tribol. Int. 2019, 136, 196–206. [Google Scholar] [CrossRef]
  27. Kolluri, D.K.; Ghosh, A.K.; Bijwe, J. Performance evaluation of composite friction materials: Influence of nature and particle size of graphite. J. Reinf. Plast. Compos. 2010, 29, 2842–2854. [Google Scholar] [CrossRef]
  28. Cho, M.H.; Ju, J.; Kim, S.J.; Jang, H. Tribological properties of solid lubricants (graphite, Sb2S3, MoS2) for automotive brake friction materials. Wear 2006, 260, 855–860. [Google Scholar] [CrossRef]
  29. Kim, S.J.; Cho, M.H.; Cho, K.H.; Jang, H. Complementary effects of solid lubricants in the automotive brake lining. Tribol. Int. 2007, 40, 15–20. [Google Scholar] [CrossRef]
  30. Aranganathan, N.; Bijwe, J. Comparative performance evaluation of NAO friction materials containing natural graphite and thermo-graphite. Wear 2016, 358–359, 17–22. [Google Scholar] [CrossRef]
  31. Rukiye, E.; Nurettin, Y. The effects of graphite, coke and ZnS on the tribological and surface characteristics of automotive brake friction materials. Ind. Lubr. Tribol. 2011, 63, 245–253. [Google Scholar] [CrossRef]
  32. Ahmadijokani, F.; Alaei, Y.; Shojaei, A.; Arjmand, M.; Yan, N. Frictional behavior of resin-based brake composites: Effect of carbon fibre reinforcement. Wear 2019, 420–421, 108–115. [Google Scholar] [CrossRef]
  33. Lee, K.J.; Yeh, Y.T.; Cheng, H.Z.; Lin, H.Y. Friction and wear behaviors of carbon nanotube reinforced silica and alumina matrix composites fabricated by catalyst sol-gel and CVD process. Mater. Trans. 2018, 59, 280–289. [Google Scholar] [CrossRef]
  34. Lee, K.J.; Wu, T.Y.; Lin, H.Y.; Cheng, H.Z.; Wang, C.F. Modified automotive organic friction materials through infiltration of liquid carbon precursors. Carbon Lett. 2019, 29, 359–368. [Google Scholar] [CrossRef]
  35. Kasai, A.; Murayama, T.; Ono, Y. Measurement of effective thermal conductivity of coke. ISIJ Int. 1993, 33, 697–702. [Google Scholar] [CrossRef]
  36. Smith, W.R.; Wilkes, G.B. Thermal conductivity of carbon blacks. Ind. Eng. Chem. 1944, 36, 1111–1112. [Google Scholar] [CrossRef]
  37. Khizhnyak, P.E.; Chechetkin, A.V.; Glybin, A.P. Thermal conductivity of carbon black. J. Eng. Phys. 1979, 37, 1073–1075. [Google Scholar] [CrossRef]
  38. T700S Data Sheet. Available online: https://www.toraycma.com/file_viewer.php?id=4459 (accessed on 30 December 2019).
  39. Pierson, H.O. Carbon fiber. In Handbook of Carbon, Graphite, Diamonds and Fullerenes: Processing, Properties and Applications, 1st ed.; Noyes Publications: Park Ridge, NJ, USA, 1993; p. 195. [Google Scholar]
  40. Pierson, H.O. Graphite structure and properties. In Handbook of Carbon, Graphite, Diamonds and Fullerenes: Processing, Properties and Applications, 1st ed.; Noyes Publications: Park Ridge, NJ, USA, 1993; p. 54. [Google Scholar]
  41. Chung, D.D.L. Exfoliation of graphite. J. Mater. Sci. 1987, 22, 4190–4198. [Google Scholar] [CrossRef]
  42. Bernal, J.D. The Structure of Graphite. Proc. R. Soc. Lond. Ser. A Contain. Pap. Math. Phys. Character 1924, 106, 749–773. [Google Scholar]
  43. Scharf, T.W.; Prasad, S.V. Solid lubricants: A review. J. Mater. Sci. 2013, 48, 511–531. [Google Scholar] [CrossRef]
  44. Harry, M.; Heintz, E.A.; Reinoso, F.R. Introduction to Carbon Technologies; University of Alicante: San Vicente del Raspeig, Alicante, Spain, 1997. [Google Scholar]
  45. Eriksson, M.; Jacobson, S. Tribological surfaces of organic brake pads. Tribol. Int. 2000, 33, 817–827. [Google Scholar] [CrossRef]
  46. Kumar, M.; Bijwe, J. Non-asbestos organic (NAO) friction composites: Role of copper; its shape and amount. Wear 2011, 270, 269–280. [Google Scholar] [CrossRef]
Figure 1. The friction and wear tester.
Materials 13 01163 g001
Figure 2. Surface morphologies of different carbonaceous components: (a) coke, (b) carbon black, (c) carbon fiber, (d) artificial graphite, (e) natural graphite and (f) expanded graphite.
Materials 13 01163 g002
Figure 3. The hardness of specimens.
Materials 13 01163 g003
Figure 4. The thermal conductivity of specimens.
Materials 13 01163 g004
Figure 5. The COF curves of specimens: (a) NAO, (b) Coke, (c) CB, (d) CF, (e) AG, (f) NG, (g) EG.
Materials 13 01163 g005
Figure 6. The average COF of specimens.
Materials 13 01163 g006
Figure 7. The wear loss of specimens.
Materials 13 01163 g007
Figure 8. Polished surfaces of specimens: (a) NAO, (b) Coke, (c) CB, (d) CF, (e) AG, (f) NG, (g) EG.
Materials 13 01163 g008
Figure 9. General worn surfaces of specimens: (a) NAO, (b) Coke, (c) CB, (d) CF, (e) AG, (f) NG; (g) EG.
Materials 13 01163 g009
Figure 10. Detailed worn surfaces of specimens: (a) NAO, (b) Coke, (c) CB, (d) CF, (e) AG, (f) NG, (g) EG.
Materials 13 01163 g010
Figure 11. The surface roughness of specimens.
Materials 13 01163 g011
Table 1. Formulation of the friction materials.
FunctionRaw MaterialsSize (μm)Content (vol %)
Binderphenolic resin4527.7
Fibrous reinforcementaramid pulp
potassium titanate
steel wool
5–20 1
3–5 1
10–100 1
17.5
Lubricantantimony trisulfide
artificial graphite
45
75
13.9
Friction modifieraluminum
barite
cashew dust
nitrile butadiene rubber (NBR)
silica
silicon carbide
zirconia
45
20
20–500
120
45
40
13.8
35.8
Theme ingredientcopper (Cu powder/Cu fiber) or
copper-replaced (carbonaceous) components
50 2/ 60–100 3
(see Table 3)4
5.1
1 Diameter of fibrous reinforcement. 2 Size of copper powder. 3 Diameter of copper fiber. 4 Size of copper-replaced (carbonaceous) components.
Table 2. List of copper and copper-replaced (carbonaceous) components (content in vol %).
IngredientNAOCokeCBCFAGNGEG
Parent ingredient 194.9094.9094.9094.9094.9094.9094.90
copper powder2.55------
copper fiber2.55------
coke-5.10-----
carbon black--5.10----
carbon fiber---5.10---
artificial graphite----5.10--
natural graphite-----5.10-
expanded graphite------5.10
1 Parent ingredient contains binder, fibrous reinforcements, lubricants and friction modifiers.
Table 3. Carbonaceous components used in this study.
Carbonaceous ComponentSize
(μm)
Thermal Conductivity
(W/m K)
Description, Company
cokeD503:43.9
D954:129.9
< 0.973 [35]Metallurgical coke,
China Steel Chemical Corp.,
Kaohsiung, Taiwan
carbon blackD50:0.9
D95:2.4
0.2–0.3 [36,37]FEF N-550,
China Synthetic Rubber Corp.,
Kaohsiung, Taiwan
PAN1-based
carbon fiber
diameter:7
length:3000–5000
8–70 [38,39]T700S,
Toray Industries, Inc.,
Tokyo, Japan
artificial graphiteD50:77.8
D95:204.6
a-axis:398
c-axis:2.2 [40]
G-3,
Hsu I Enterprises Corp.,
Tainan, Taiwan
natural graphitesize:10–20
thickness: <3
a-axis:398
c-axis:2.2 [40]
Graphite flake, -325 mesh,
Alfa Aesar,
Ward Hill, MA, USA
expanded graphite2size:25
expanded length:25–7500
a-axis:400–1300
c-axis:3–65 [41]
Expandable graphite, 3772, Anthracite Industries,
Sunbury, PA, USA
(Expansion ratio ~1:300)
1 Polyacrylonitrile (PAN). 2 The expandable graphite was treated in a microwave to form expanded graphite.3 D50: the size below which 50% of powder sample is contained. 4 D95: the size below which 95% of powder sample is contained.

