The Effect of Confinement Angle on Self-Colliding Aluminium Laser Plasmas Using Spectrally Resolved Fast Imaging


Abstract
:1. Introduction
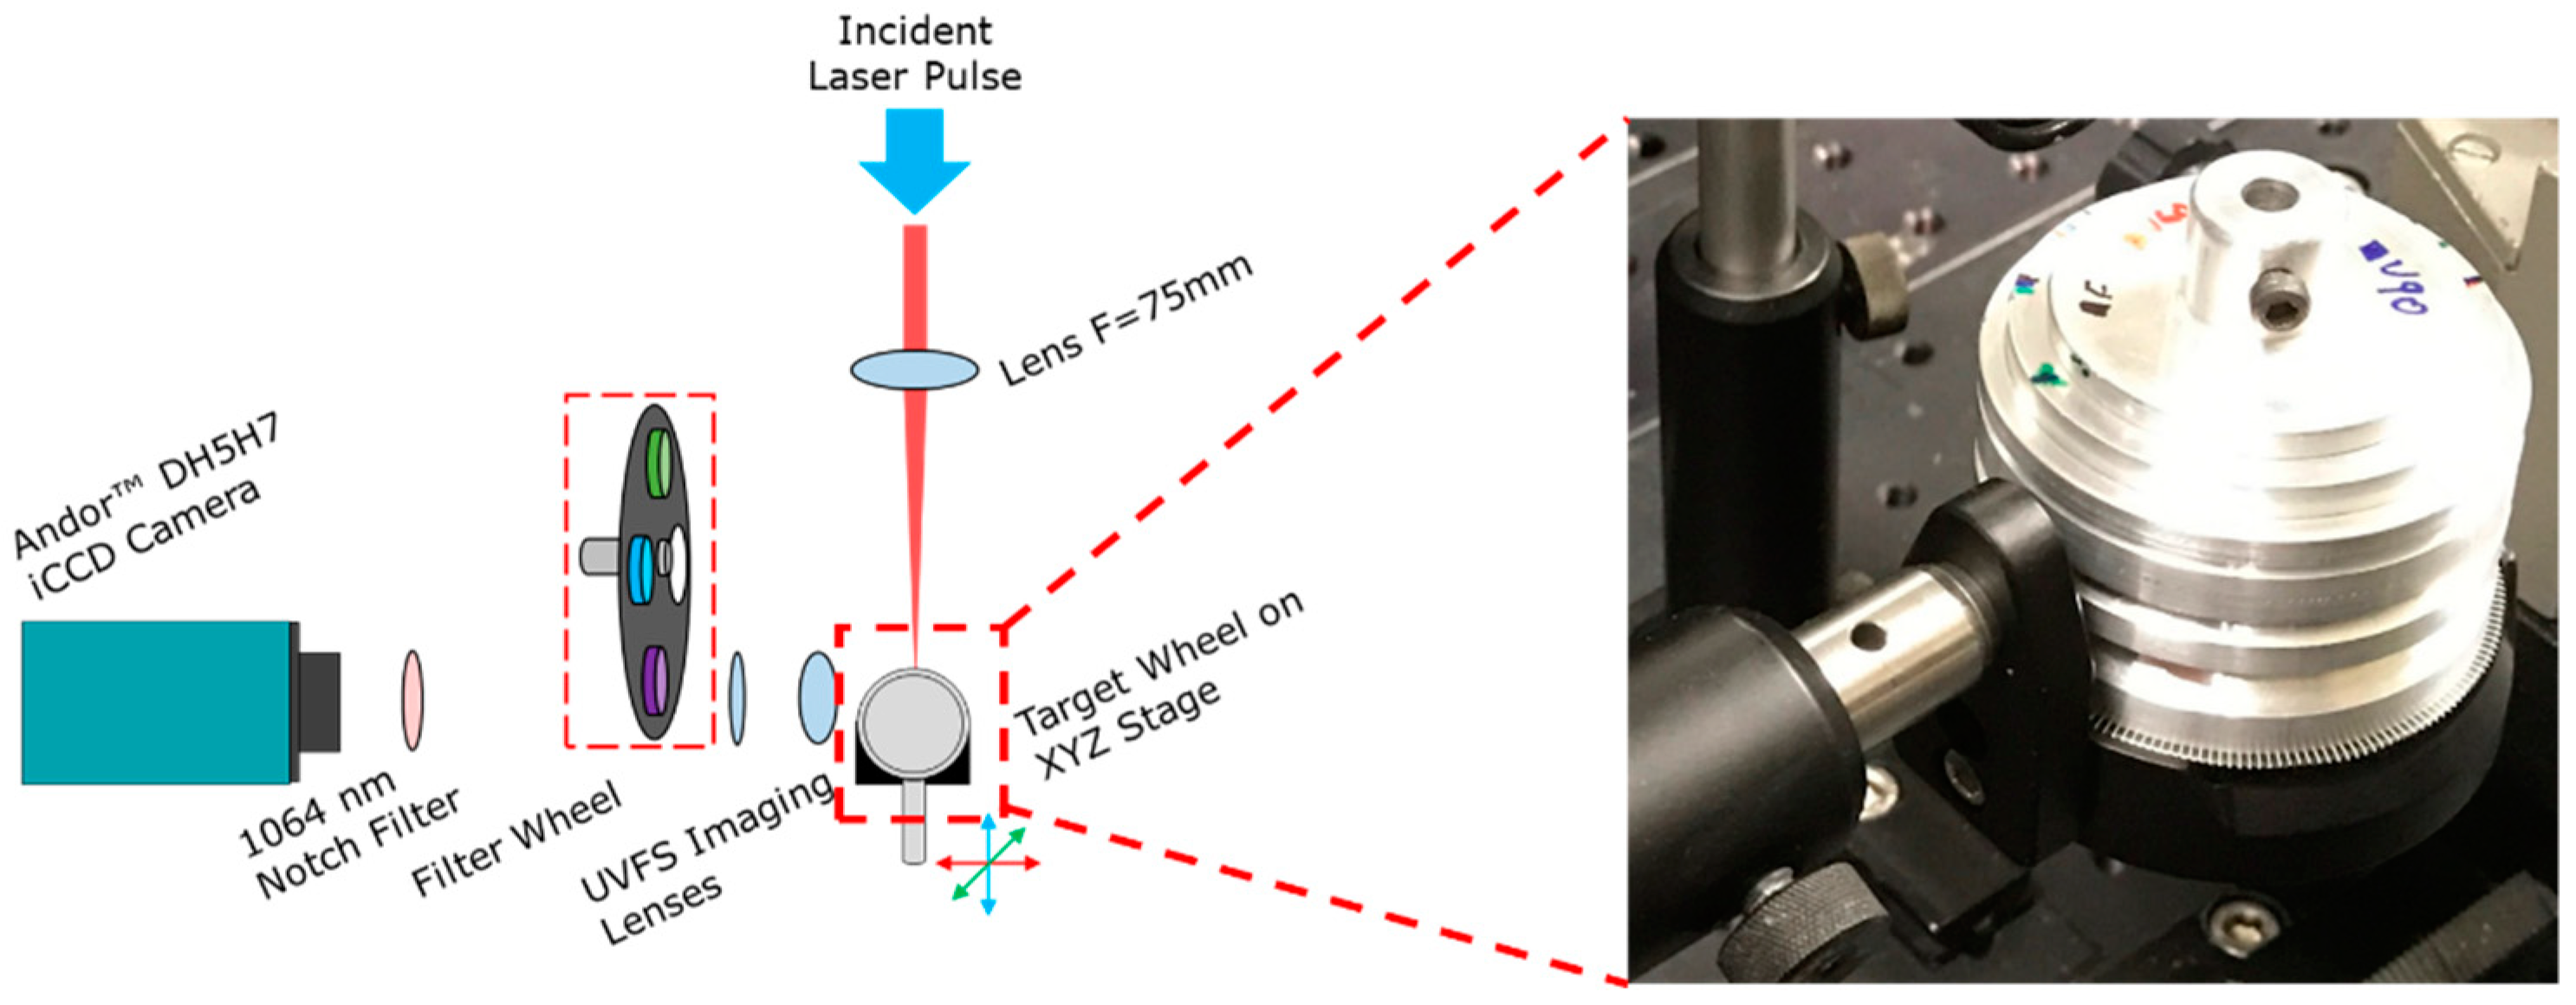
2. Experimental Apparatus
3. Results and Discussion
3.1. Broadband Time-Resolved Fast Imaging
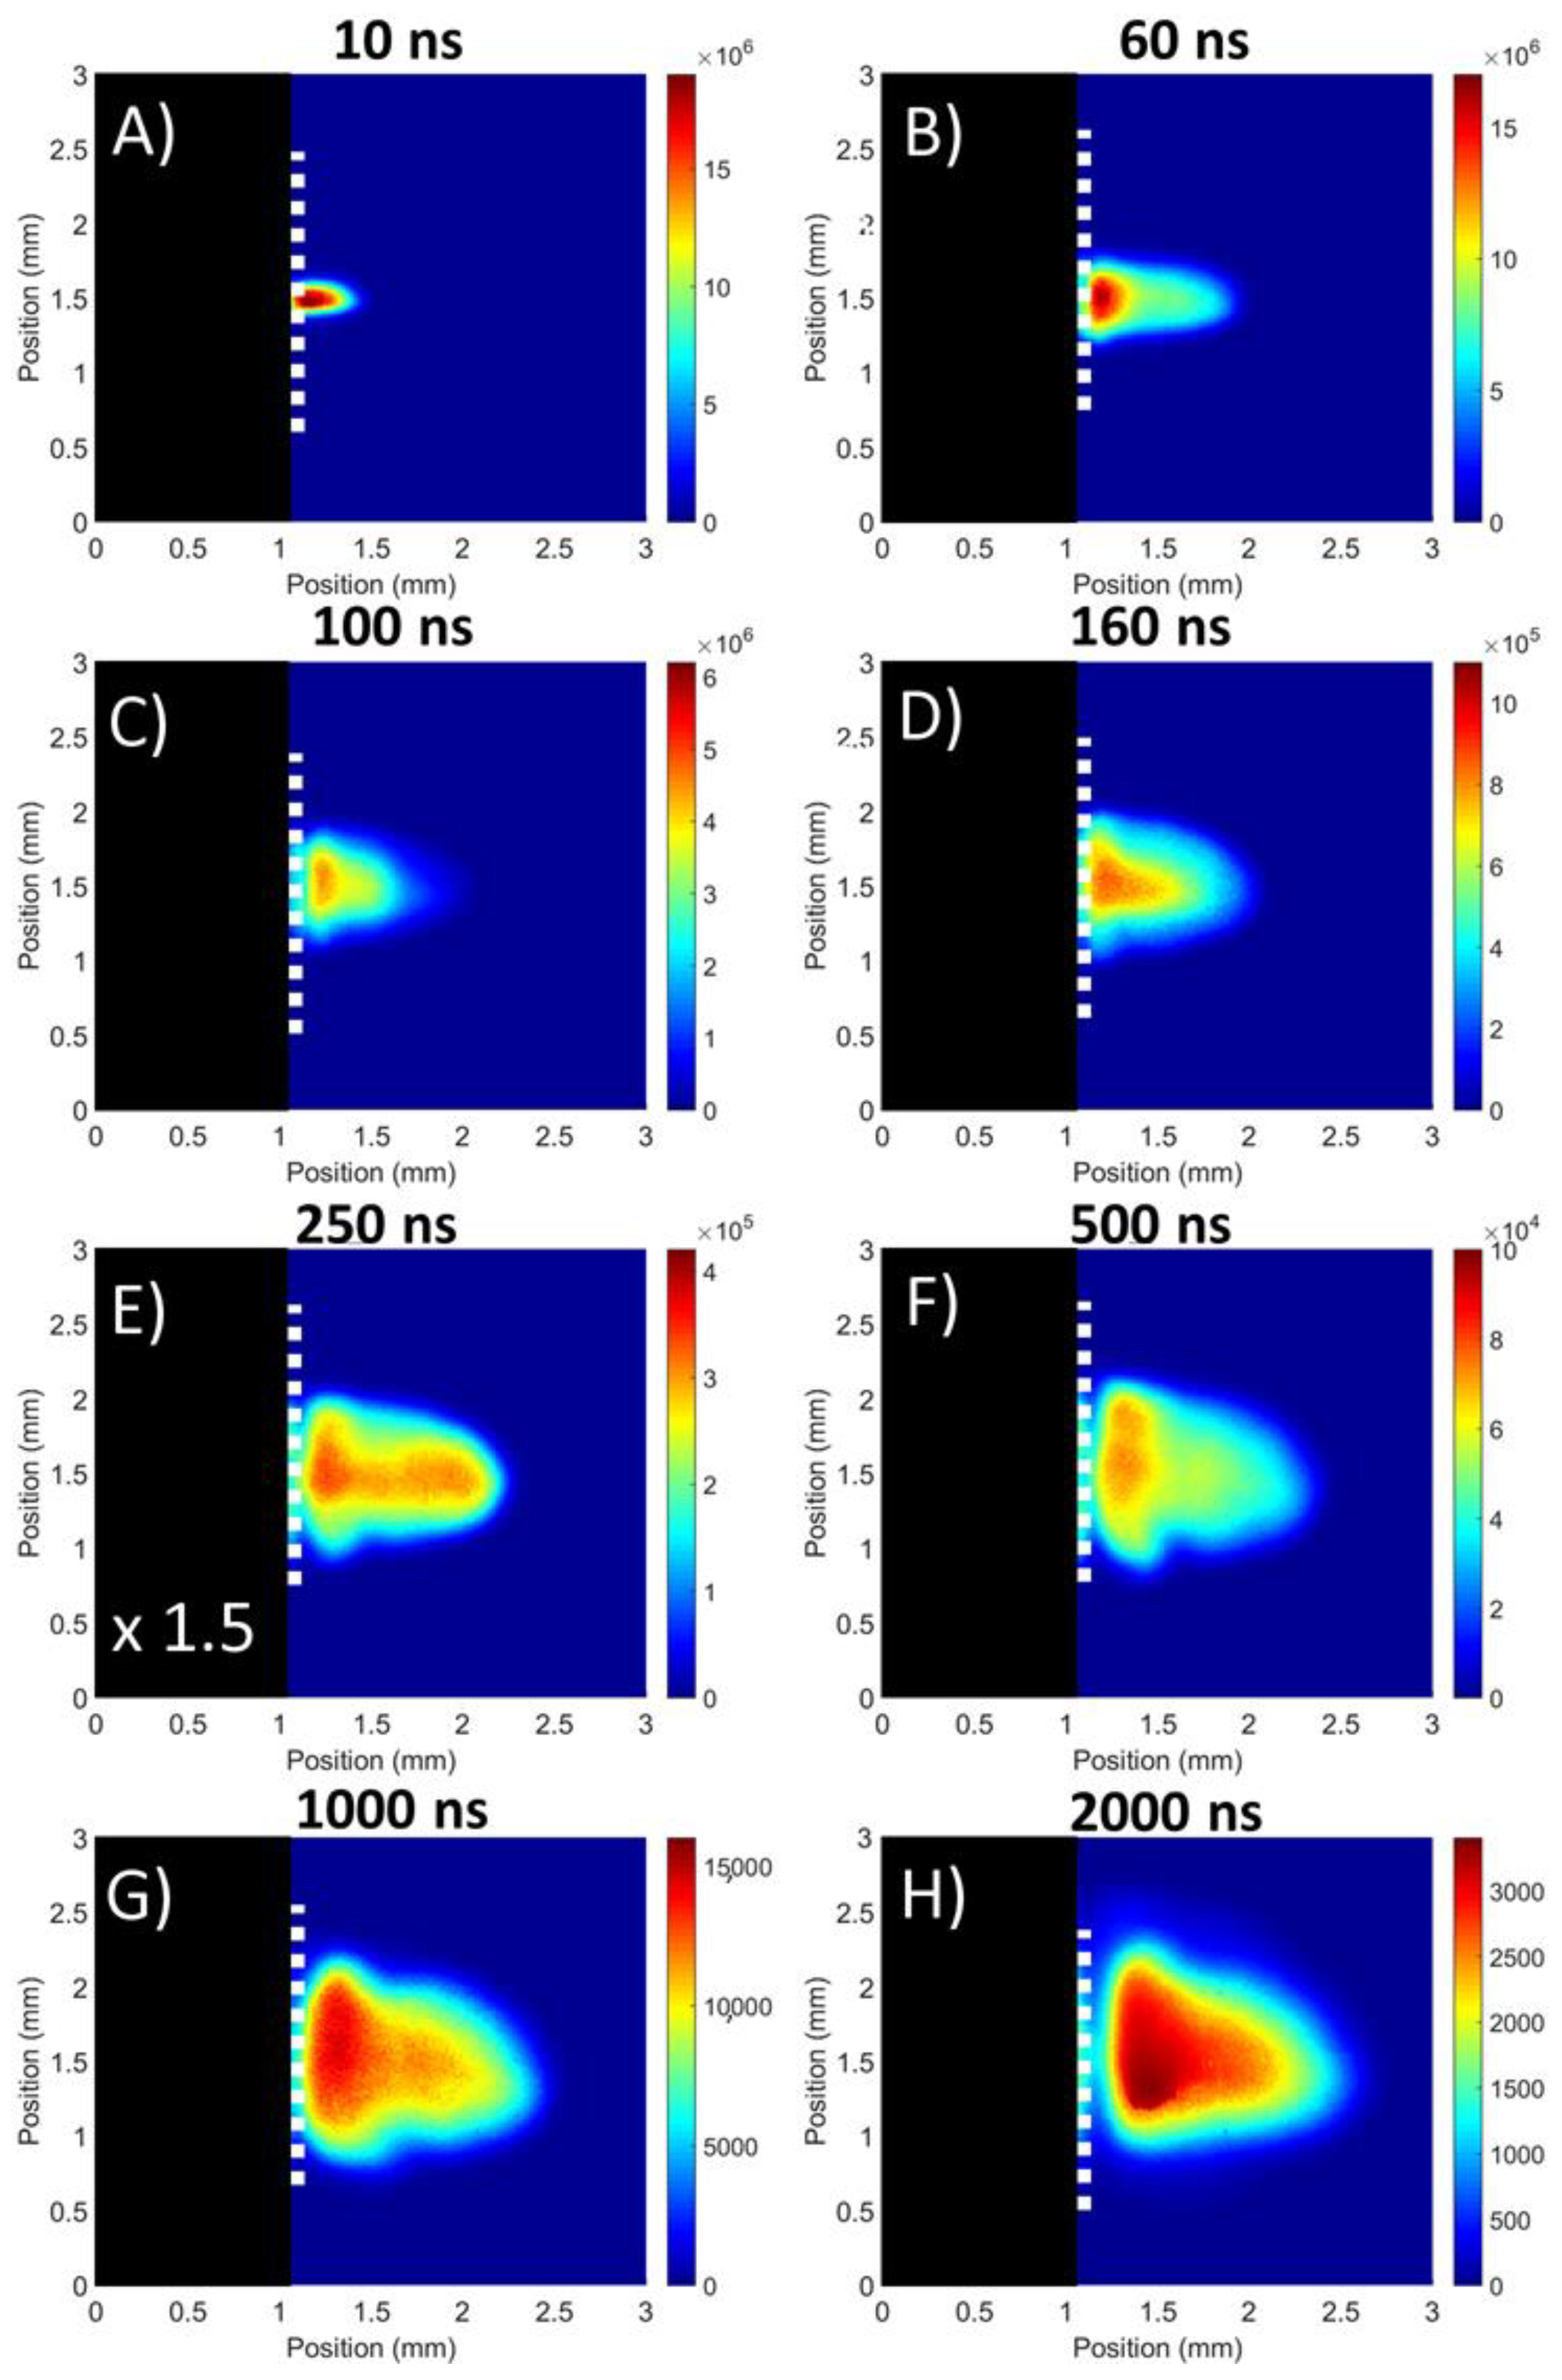
3.1.1. Flat Target
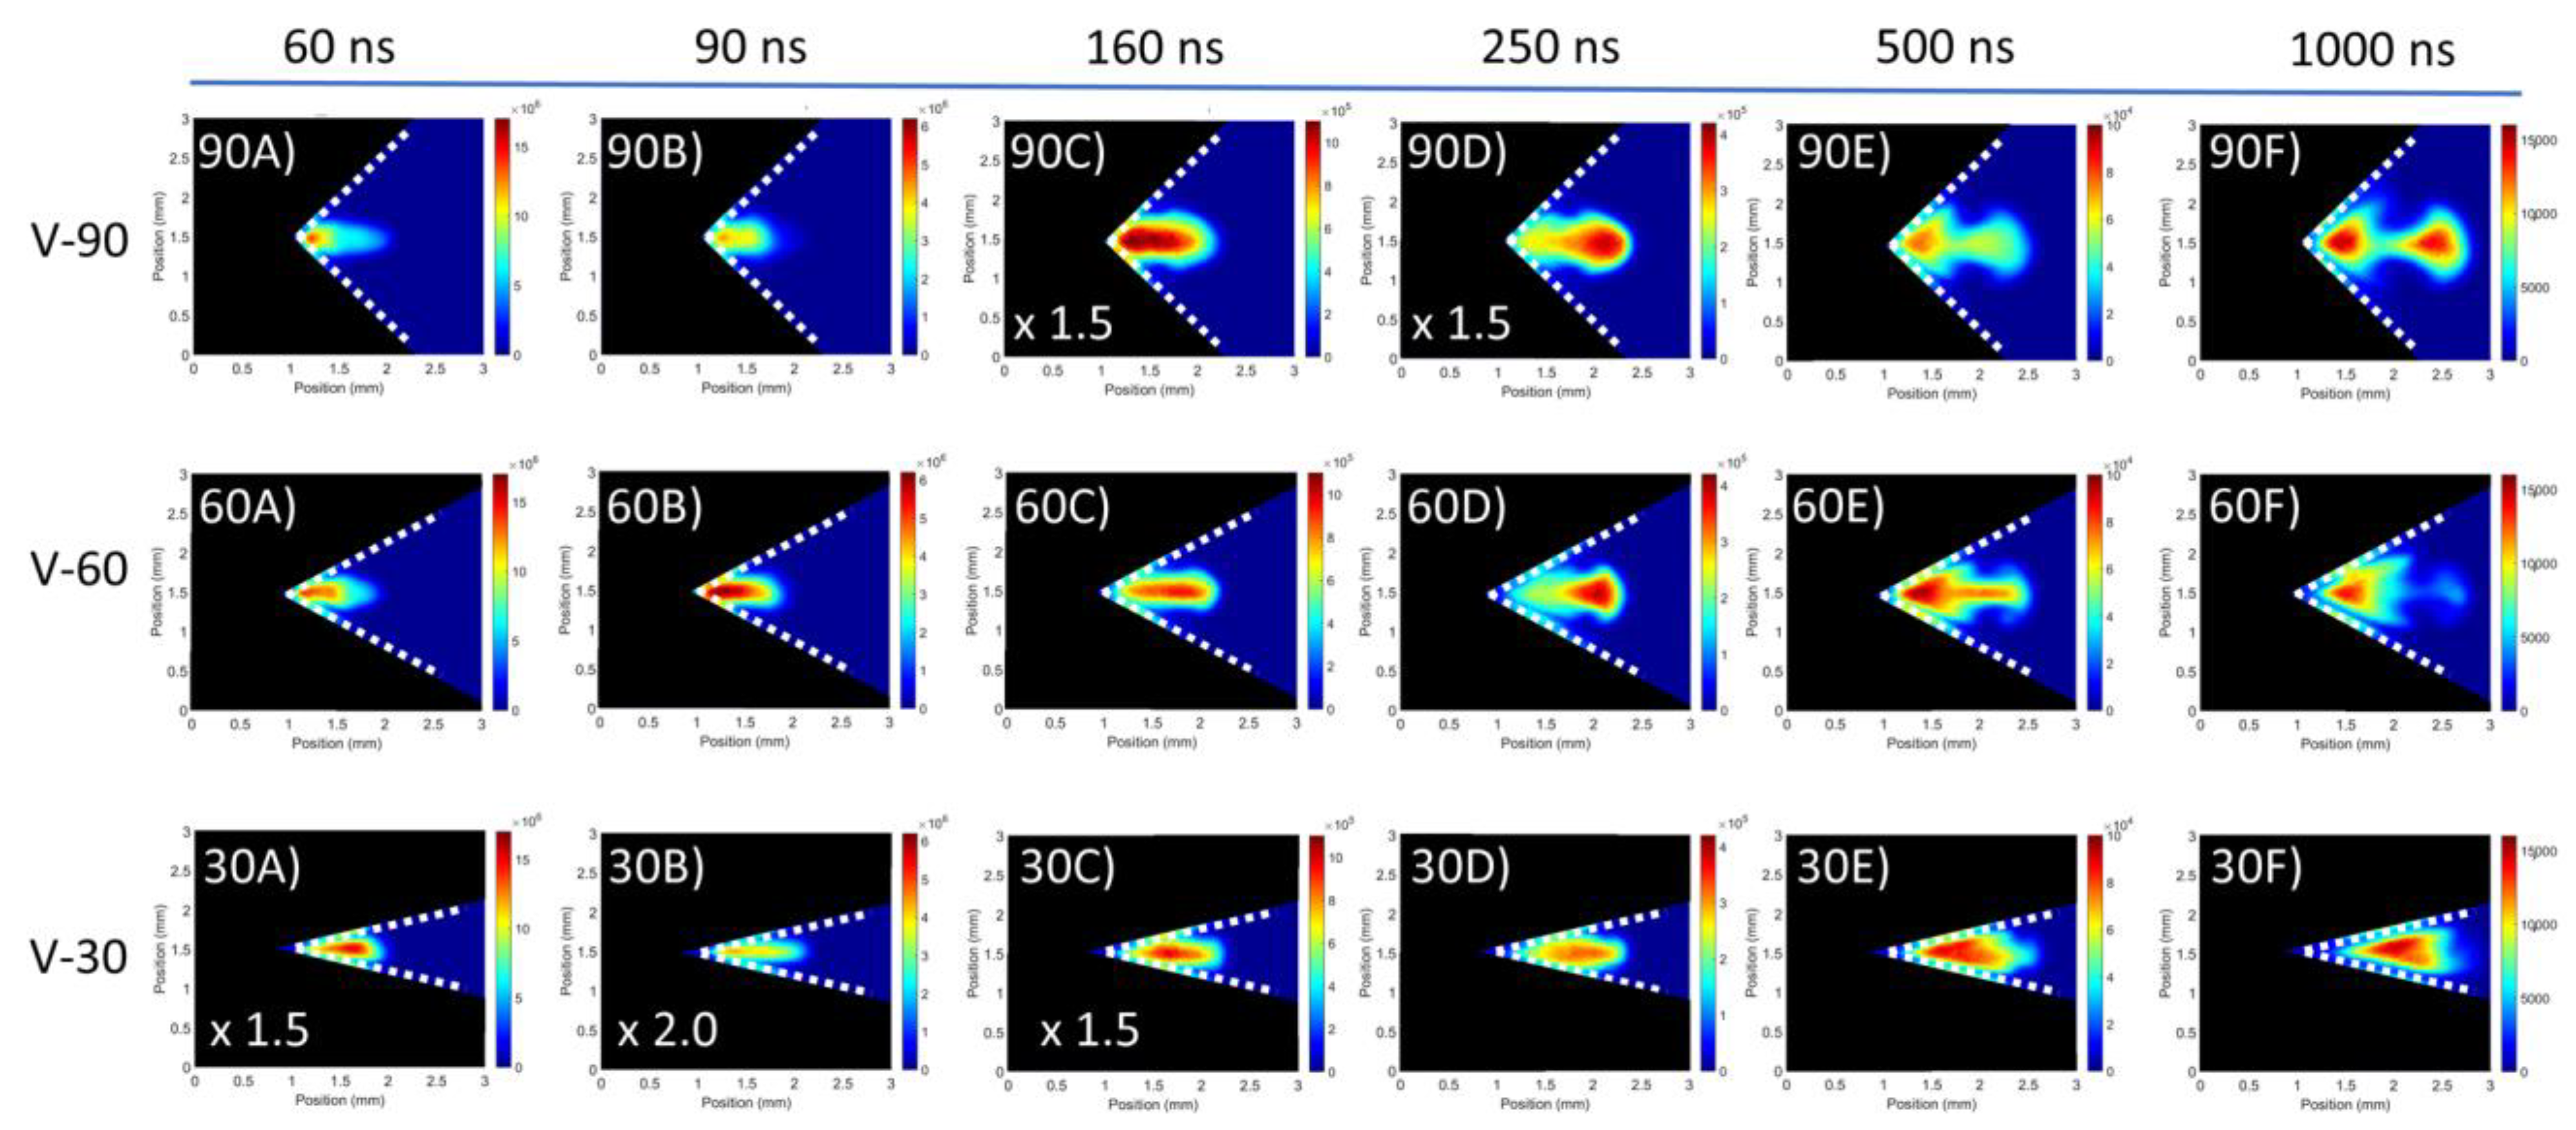
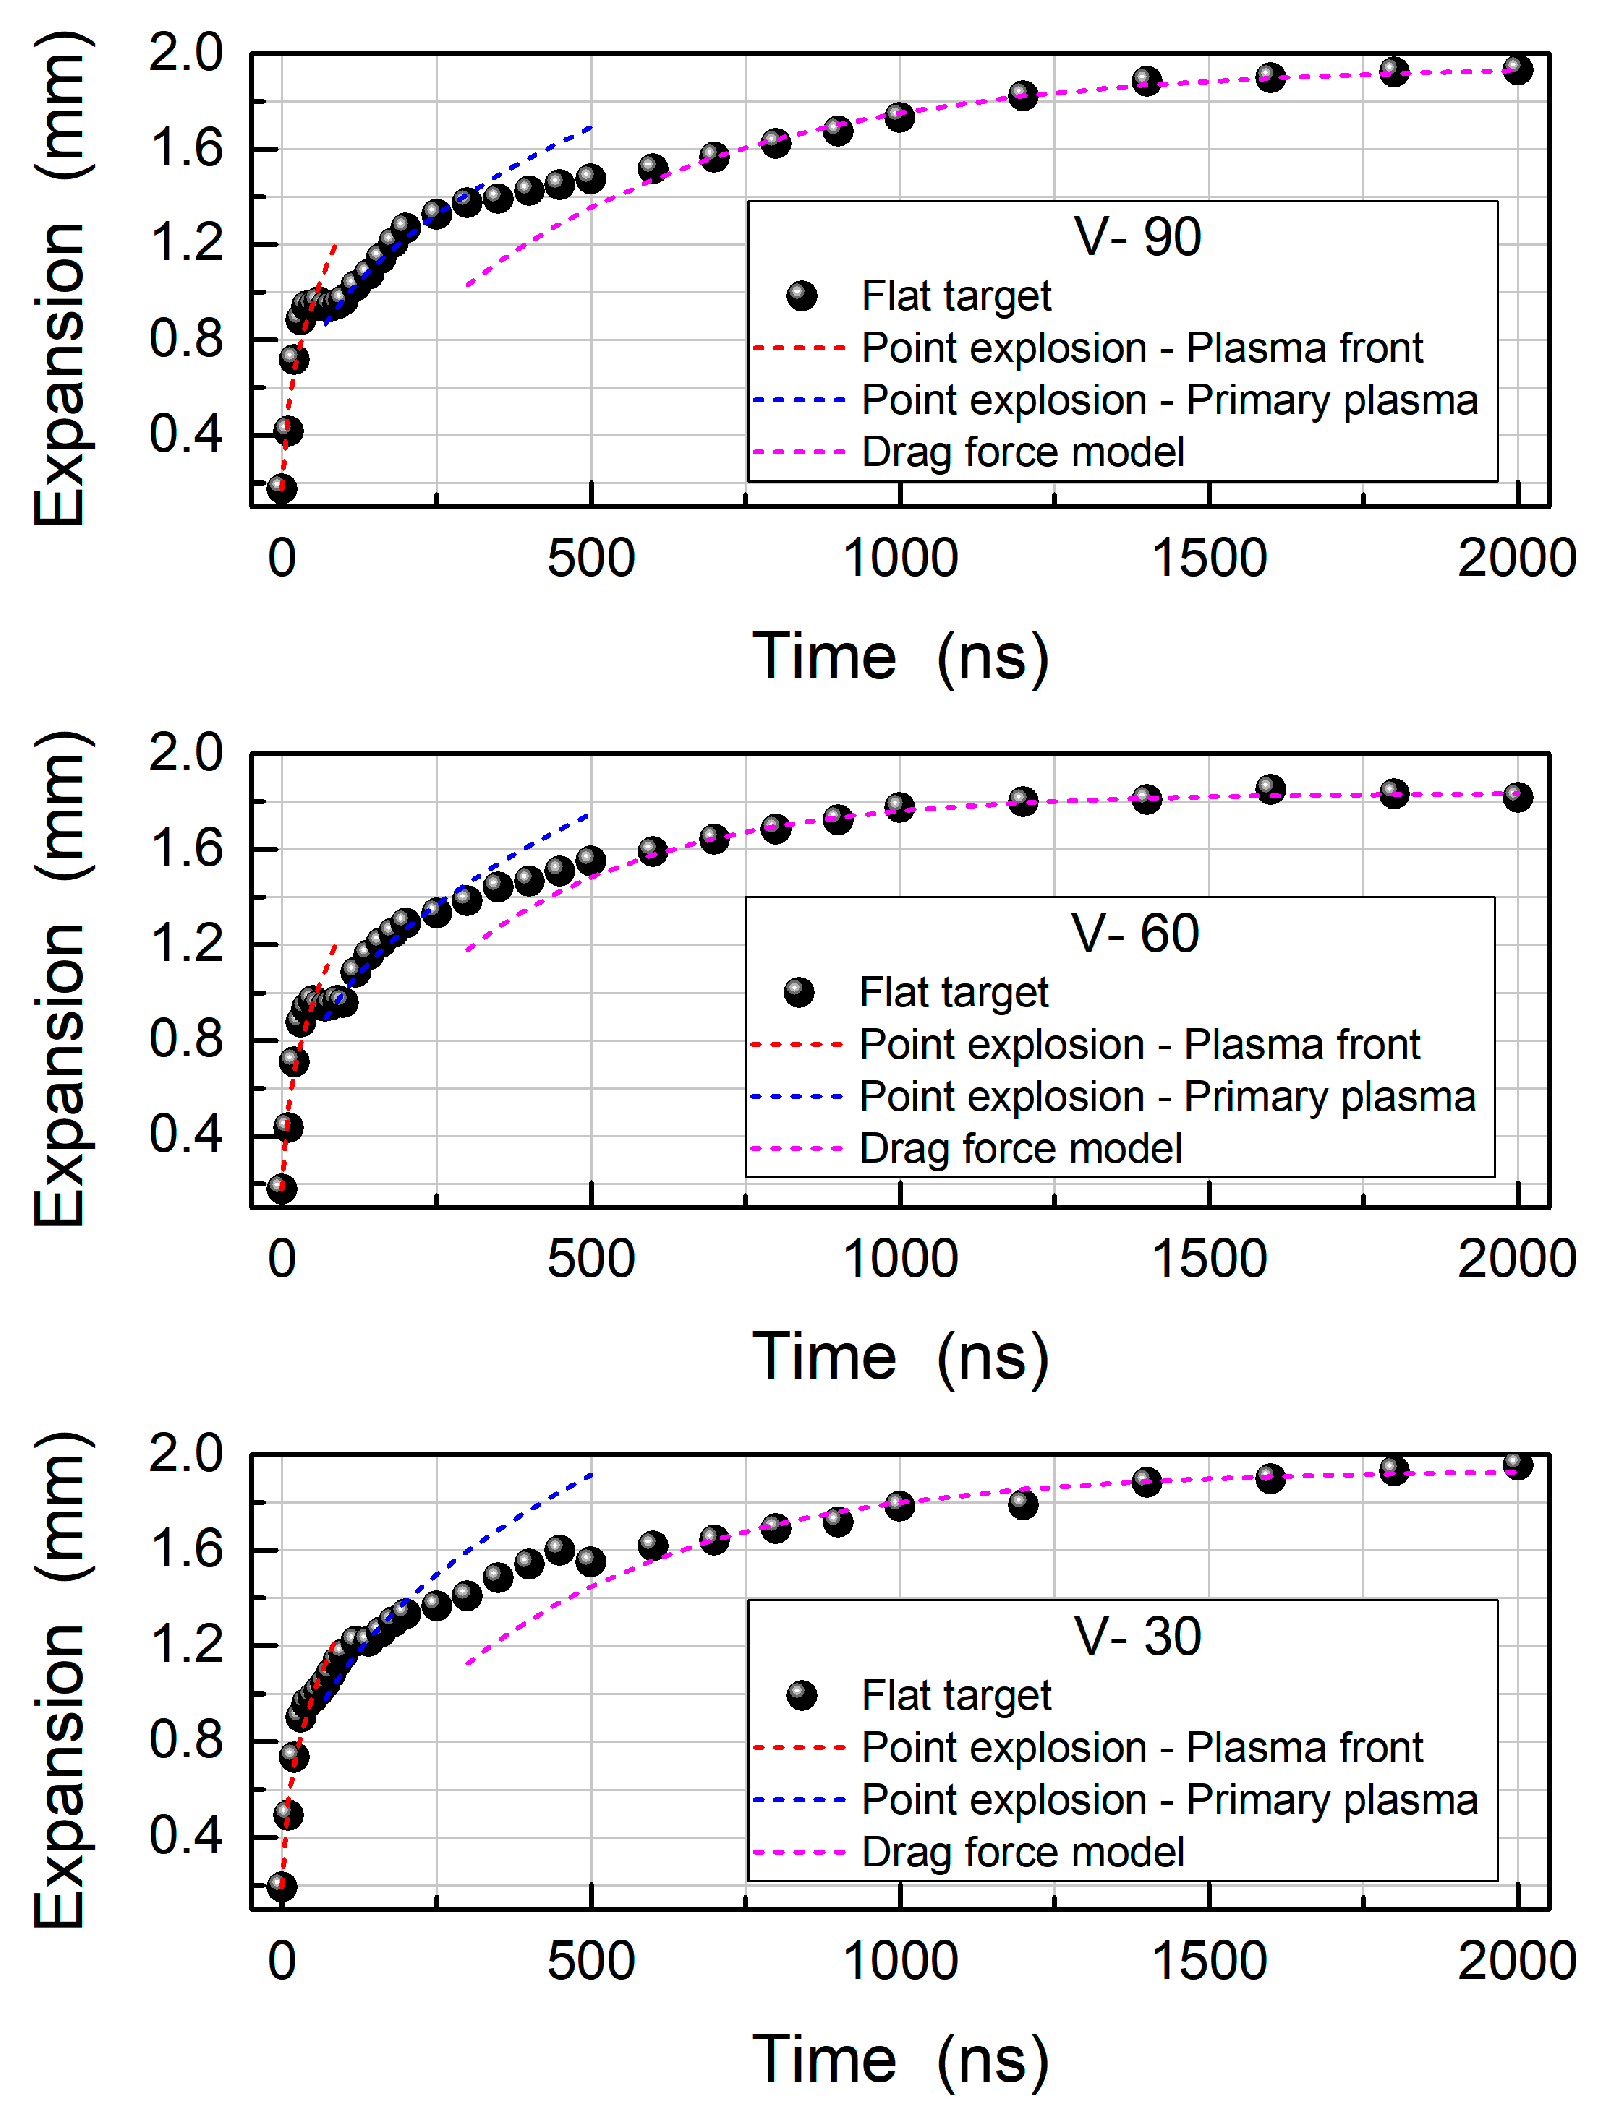
3.1.2. V-Channel Targets
3.2. Filtered Time-Resolved Imaging
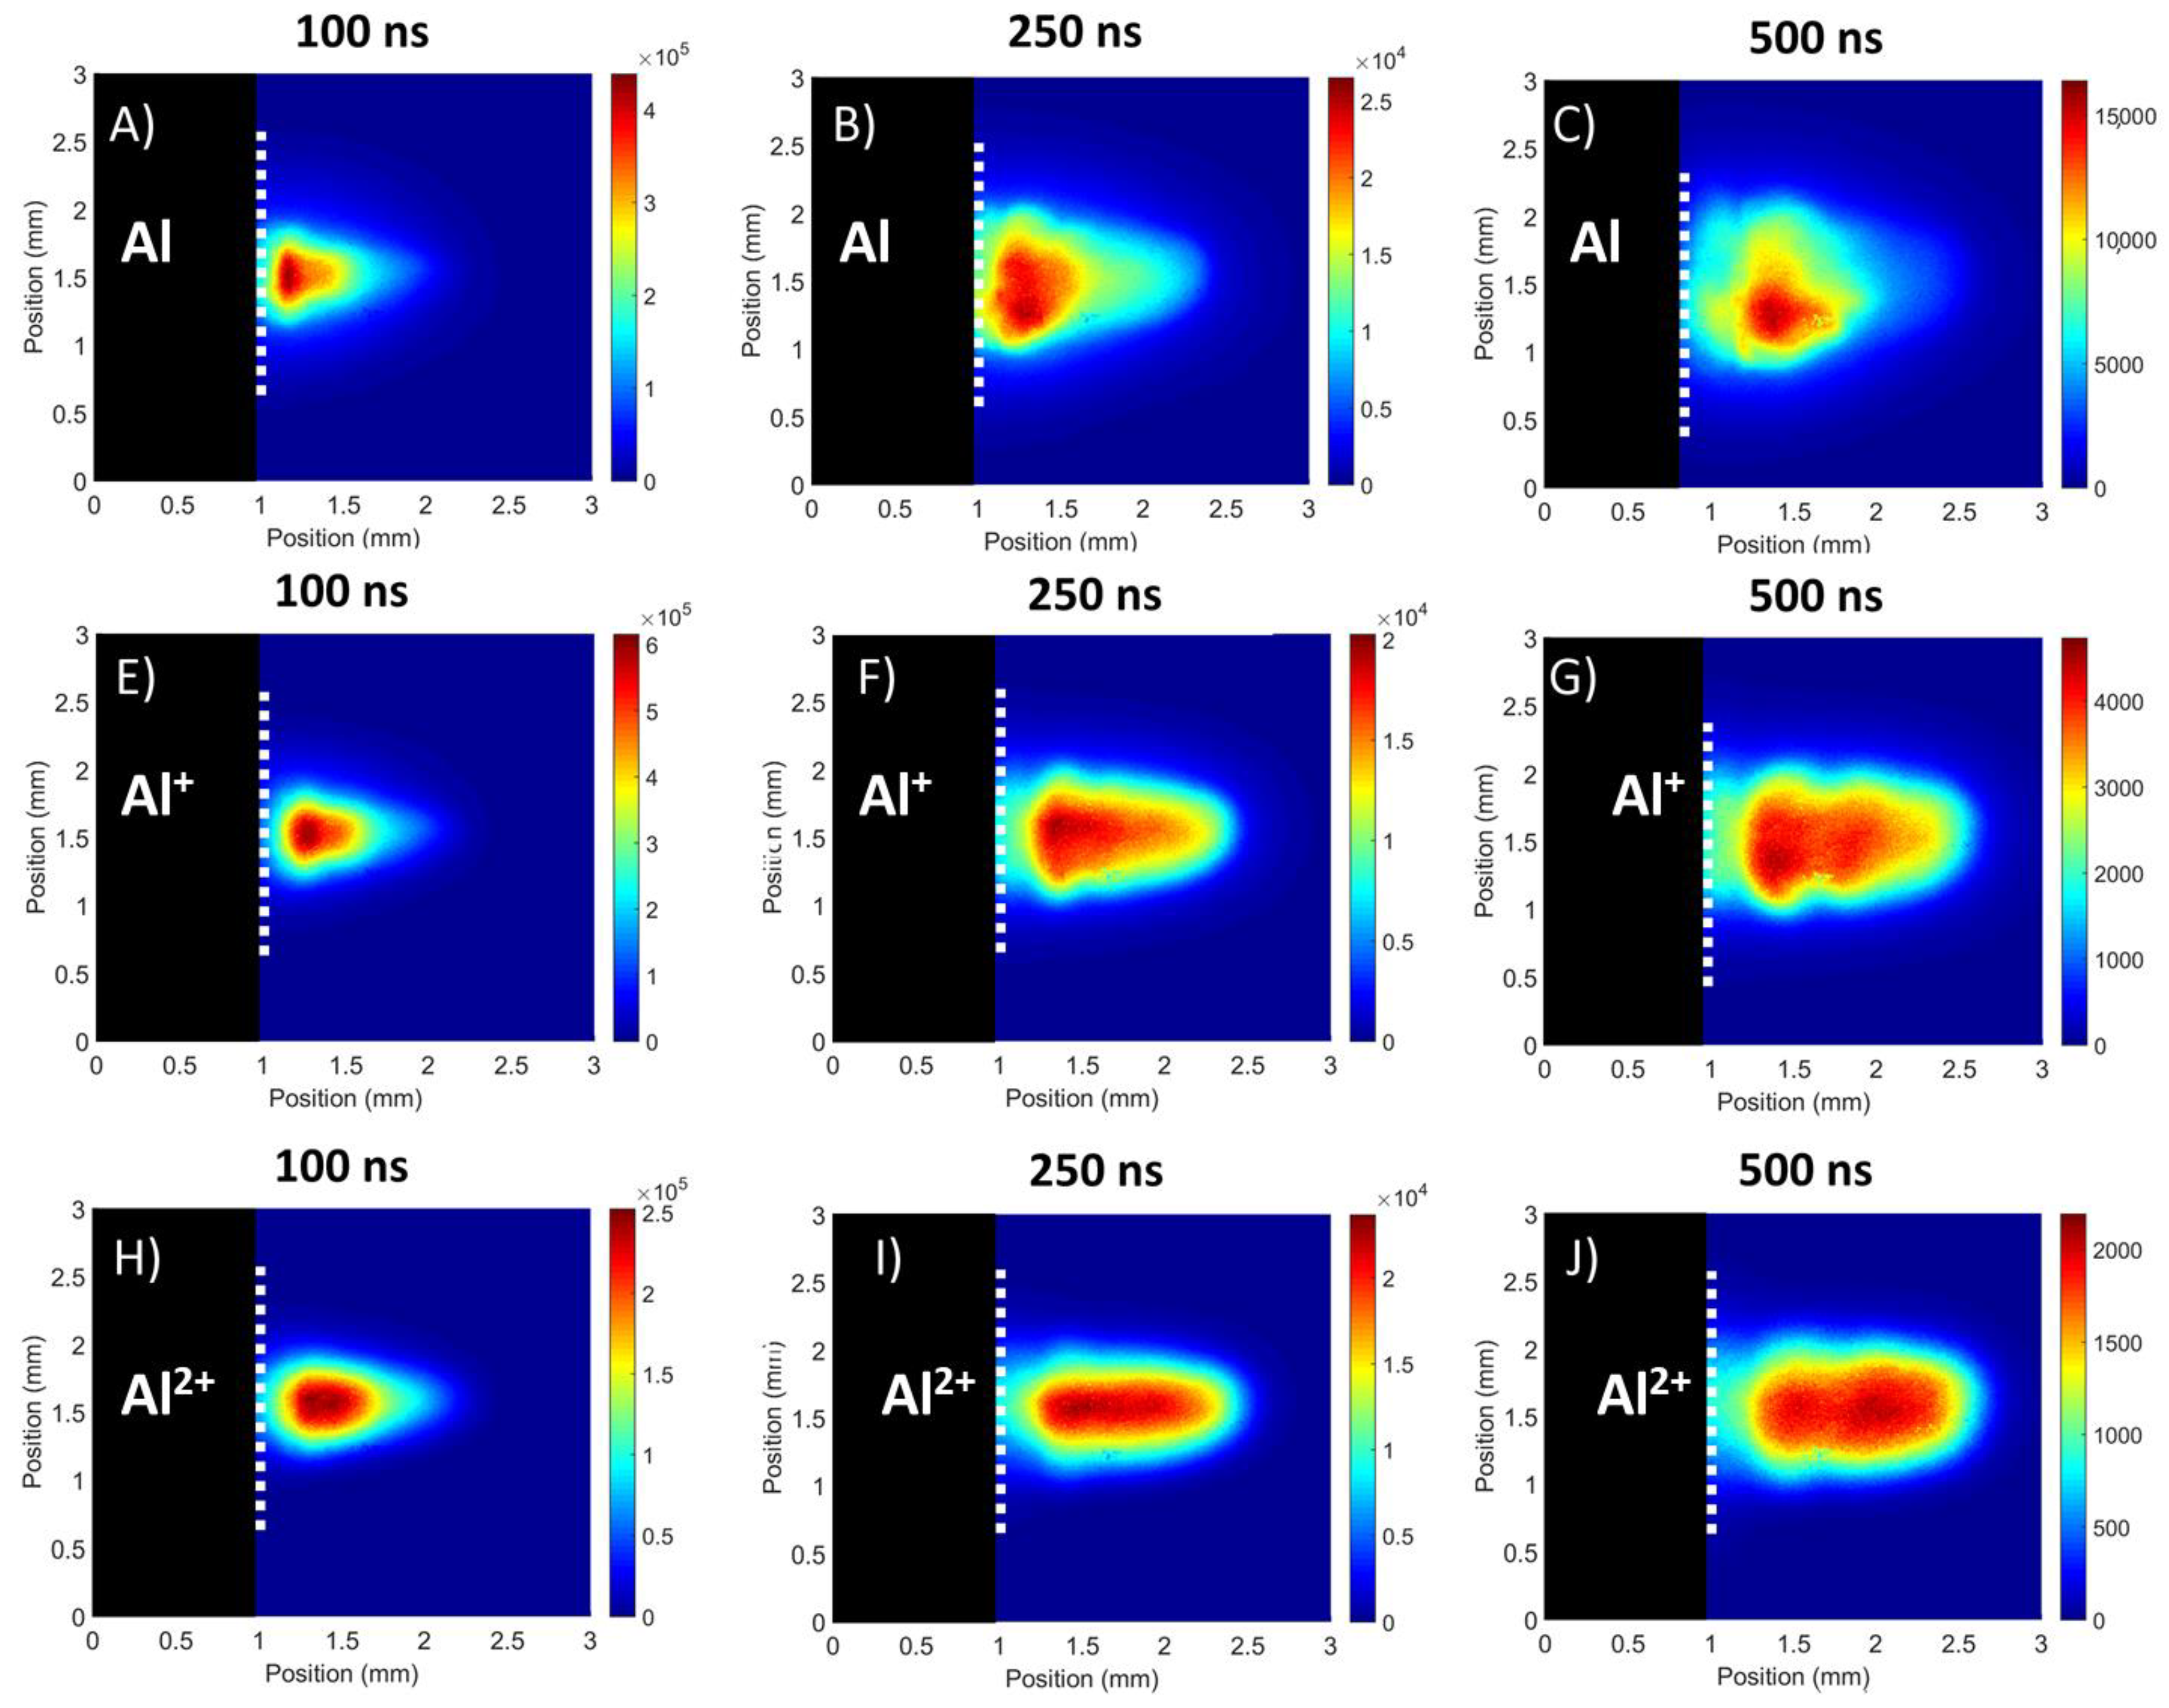
3.2.1. Flat Target
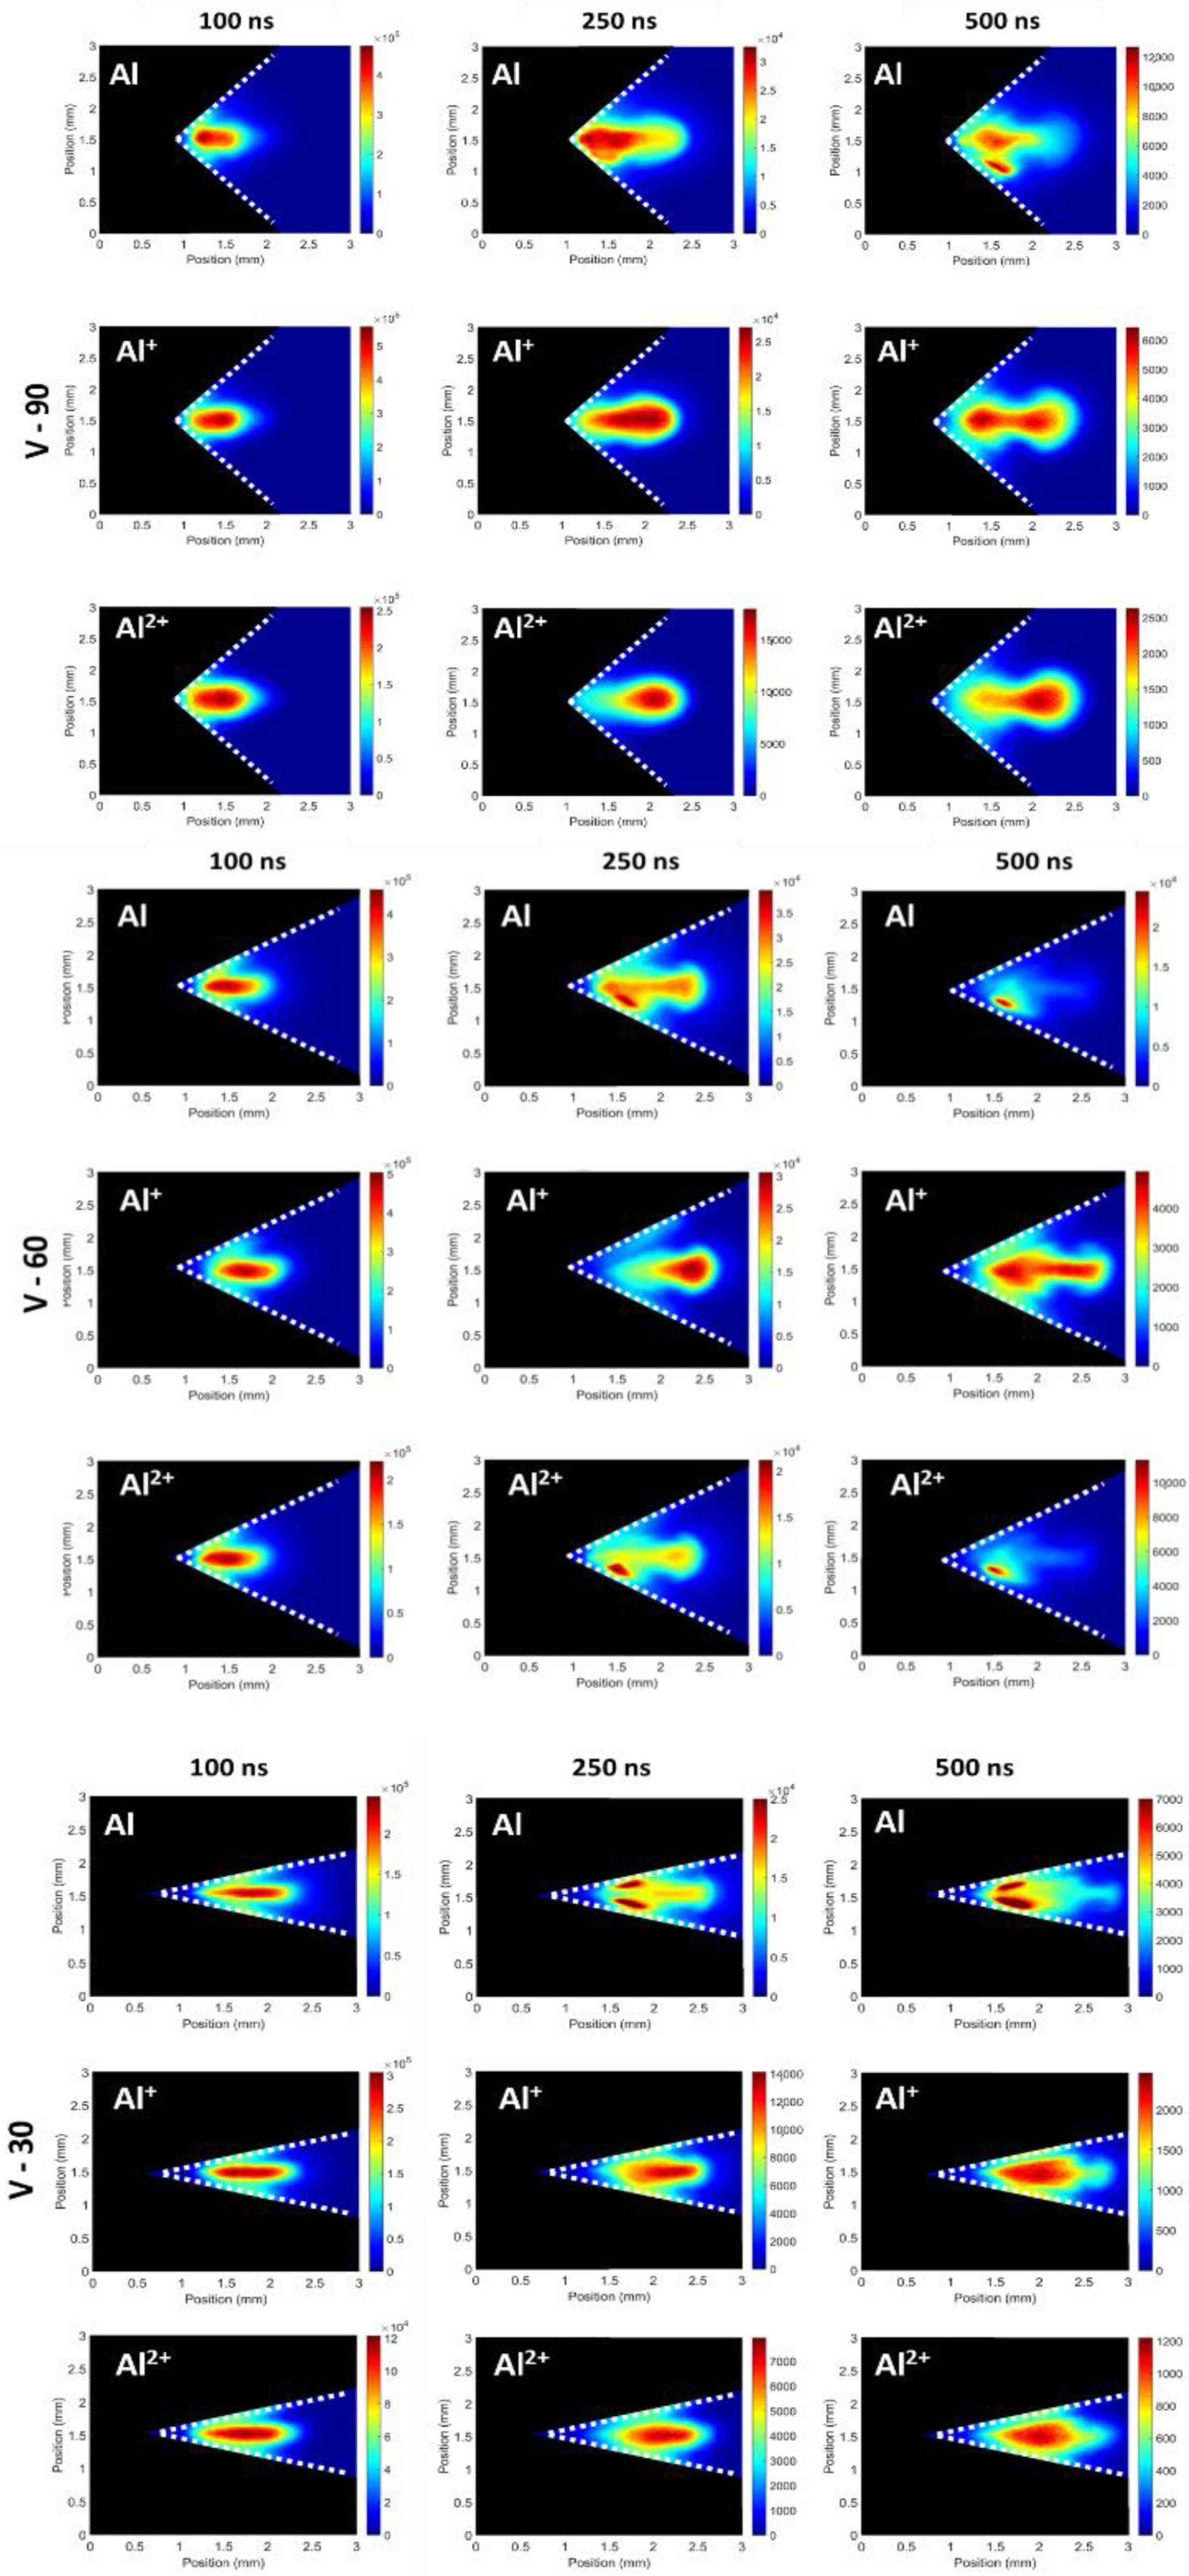
3.2.2. V-Channel Targets
4. Conclusions
Author Contributions
Funding
Conflicts of Interest
References
- White, J.; Dunne, P.; Hayden, P.; O’Reilly, F.; O’Sullivan, G. Optimizing 13.5 nm laser-produced tin plasma emission as a function of laser wavelength. Appl. Phys. Lett. 2007, 90, 181502. [Google Scholar] [CrossRef]
- Camps, E.; Escobar-Alarcón, L.; Haro-Poniatowski, E.; Fernández-Guasti, M. Spectroscopic studies of two perpendicularly interacting carbon plasmas generated by laser ablation. Appl. Surf. Sci. 2002, 197–198, 239–245. [Google Scholar] [CrossRef]
- Irissou, E.; Vidal, F.; Johnston, T.; Chaker, M.; Guay, D.; Ryabinin, A.N. Influence of an inert background gas on bimetallic cross-beam pulsed laser deposition. J. Appl. Phys. 2006, 99, 034904. [Google Scholar] [CrossRef]
- Gu, Y.J.; Zhu, Z.; Li, X.F.; Yu, Q.; Huang, S.; Zhang, F.; Kong, Q.; Kawata, S. Stable long range proton acceleration driven by intense laser pulse with underdense plasmas. Phys. Plasmas 2014, 21, 063104. [Google Scholar] [CrossRef]
- Woolsey, N.C.; Courtois, C.; Dendy, R.O. Laboratory plasma astrophysics simulation experiments using lasers. Plasma Phys. Control. Fusion 2004, 46, B397–B405. [Google Scholar] [CrossRef]
- Smith, R.A.; Lazarus, J.; Hohenberger, M.; Marocchino, A.; Robinson, J.S.; Chittenden, J.P.; Moore, A.S.; Gumbrell, E.T.; Dunne, M. High resolution imaging of colliding blast waves in cluster media. Plasma Phys. Control. Fusion 2007, 49, B117–B124. [Google Scholar] [CrossRef]
- Brueckner, K.A.; Jorna, S. Laser-driven fusion. Rev. Mod. Phys. 1974, 46, 325–367. [Google Scholar] [CrossRef]
- Glenzer, S.H.; Back, C.A.; Suter, L.J.; Blain, M.A.; Landen, O.L.; Lindl, J.D.; MacGowan, B.J.; Stone, G.F.; Turner, R.E.; Wilde, B.H. Thomson Scattering from Inertial-Confinement-Fusion Hohlraum Plasmas. Phys. Rev. Lett. 1997, 79, 1277–1280. [Google Scholar] [CrossRef]
- Dittrich, T.R.; Haan, S.W.; Marinak, M.M.; Pollaine, S.M.; Hinkel, D.E.; Munro, D.H.; Verdon, C.P.; Strobel, G.L.; McEachern, R.; Cook, R.C.; et al. Review of indirect-drive ignition design options for the National Ignition Facility. Phys. Plasmas 1999, 6, 2164–2170. [Google Scholar] [CrossRef]
- Rambo, P.W.; Denavit, J. Interpenetration and ion separation in colliding plasmas. Phys. Plasmas 1994, 1, 4050–4060. [Google Scholar] [CrossRef]
- Fallon, C.; Hayden, P.; Walsh, N.; Kennedy, E.T.; Costello, J.T. Target geometrical effects on the stagnation layer formed by colliding a pair of laser produced copper plasmas. Phys. Plasmas 2015, 22, 093506. [Google Scholar] [CrossRef]
- Al-Shboul, K.F.; Hassan, S.M.; Harilal, S.S. Molecular formation in the stagnation region of colliding laser-produced plasmas. Plasma Sources Sci. Technol. 2016, 25, 065017. [Google Scholar] [CrossRef]
- Al-Shboul, K.F.; Harilal, S.S.; Hassan, S.M.; Hassanein, A.; Costello, J.T.; Yabuuchi, T.; Tanaka, K.A.; Hirooka, Y. Interpenetration and stagnation in colliding laser plasmas. Phys. Plasmas 2014, 21, 013502. [Google Scholar] [CrossRef]
- Dardis, J.; Costello, J.T. Stagnation layers at the collision front between two laser-induced plasmas: A study using time-resolved imaging and spectroscopy. Spectrochim. Acta Part B At. Spectrosc. 2010, 65, 627–635. [Google Scholar] [CrossRef]
- Rumsby, P.T.; Paul, J.W.M.; Masoud, M.M. Interactions between two colliding laser produced plasmas. Plasma Phys. 1974, 16, 969–975. [Google Scholar] [CrossRef]
- Harilal, S.S.; Bindhu, C.V.; Kunze, H.-J. Time evolution of colliding laser produced magnesium plasmas investigated using a pinhole camera. J. Appl. Phys. 2001, 89, 4737–4740. [Google Scholar] [CrossRef] [Green Version]
- Li, X.; Yang, Z.; Wu, J.; Han, J.; Wei, W.; Jia, S.; Qiu, A. The effect of target materials on colliding laser-produced plasmas. J. Appl. Phys. 2016, 119, 133301. [Google Scholar] [CrossRef]
- Hough, P.; McLoughin, C.; Kelly, T.J.; Hayden, P.; Harilal, S.S.; Mosnier, J.P.; Costello, J.T. Electron and ion stagnation at the collision front between two laser produced plasmas. J. Phys. D Appl. Phys. 2009, 42, 055211. [Google Scholar] [CrossRef]
- Cao, S.; Su, M.; Liu, J.; Min, Q.; Sun, D.; He, S.; Ma, P.; Wang, K.; Dong, C. Expansion dynamics and compression layer in collinear double-pulse laser produced plasmas in a vacuum. Phys. Plasmas 2020, 27, 052101. [Google Scholar] [CrossRef]
- Gambino, N.; Hayden, P.; Mascali, D.; Costello, J.; Fallon, C.; Hough, P.; Yeates, P.; Anzalone, A.; Musumeci, F.; Tudisco, S. Dynamics of colliding aluminium plasmas produced by laser ablation. Appl. Surf. Sci. 2013, 272, 69–75. [Google Scholar] [CrossRef]
- Tselev, A.; Gorbunov, A.; Pompe, W. Cross-beam pulsed laser deposition: General characteristic. Rev. Sci. Instrum. 2001, 72, 2665–2672. [Google Scholar] [CrossRef]
- Gupta, S.L.; Pandey, P.K.; Thareja, R.K. Dynamics of laser ablated colliding plumes. Phys. Plasmas 2013, 20, 013511. [Google Scholar] [CrossRef]
- Luna, H.; Kavanagh, K.D.; Costello, J.T. Study of a colliding laser-produced plasma by analysis of time- and space-resolved image spectra. J. Appl. Phys. 2007, 101, 033302. [Google Scholar] [CrossRef] [Green Version]
- Guthikonda, N.; Manikanta, E.; Chelikani, L.; Sai Shiva, S.; Sree Harsha, S.; Ikkurthi, V.R.; Prem Kiran, P. Interaction of two counterpropagating laser induced plasmas and shock waves in air. Phys. Plasmas 2020, 27, 023107. [Google Scholar] [CrossRef]
- Yang, Z.; Wei, W.; Han, J.; Wu, J.; Li, X.; Jia, S. Experimental study of the behavior of two laser produced plasmas in air. Phys. Plasmas 2015, 22, 073511. [Google Scholar] [CrossRef]
- Cristoforetti, G.; Lorenzetti, G.; Legnaioli, S.; Palleschi, V. Investigation on the role of air in the dynamical evolution and thermodynamic state of a laser-induced aluminium plasma by spatial- and time-resolved spectroscopy. Spectrochim. Acta Part B At. Spectrosc. 2010, 65, 787–796. [Google Scholar] [CrossRef]
- Li, X.; Wei, W.; Wu, J.; Jia, S.; Qiu, A. The Influence of spot size on the expansion dynamics of nanosecond-laser-produced copper plasmas in atmosphere. J. Appl. Phys. 2013, 113, 243304. [Google Scholar] [CrossRef]
- Wang, Y.; Chen, A.; Sui, L.; Li, S.; Wang, X.; Jiang, Y.; Huang, X.; Jin, M. Two sequential enhancements of laser-induced Cu plasma with cylindrical cavity confinement. J. Anal. At. Spectrom. 2016, 31, 1974–1977. [Google Scholar] [CrossRef]
- Su, X.; Zhou, W.; Qian, H. Optimization of cavity size for spatial confined laser-induced breakdown spectroscopy. Opt. Express 2014, 22, 28437. [Google Scholar] [CrossRef]
- Shen, X.K.; Sun, J.; Ling, H.; Lu, Y.F. Spatial confinement effects in laser-induced breakdown spectroscopy. Appl. Phys. Lett. 2007, 91, 081501. [Google Scholar] [CrossRef]
- Qiu, Y.; Yao, C.; Yao, C.; Gan, J.; Zhang, W.; Xu, N.; Sun, J.; Wu, J. Spatial confinement of laser-induced plasma by laser-induced and obstacle-reflected shock wave and its effect on optical emission of laser-induced plasma. AIP Adv. 2019, 9, 095021. [Google Scholar] [CrossRef] [Green Version]
- Zhang, D.; Chen, A.; Wang, X.; Wang, Y.; Sui, L.; Ke, D.; Li, S.; Jiang, Y.; Jin, M. Influence of the distance between target surface and focal point on the expansion dynamics of a laser-induced silicon plasma with spatial confinement. Spectrochim. Acta Part B At. Spectrosc. 2018, 143, 71–77. [Google Scholar] [CrossRef]
- Popov, A.M.; Colao, F.; Fantoni, R. Spatial confinement of laser-induced plasma to enhance LIBS sensitivity for trace elements determination in soils. J. Anal. At. Spectrom. 2010, 25, 837. [Google Scholar] [CrossRef]
- Singh, S.C.; Fallon, C.; Hayden, P.; Mujawar, M.; Yeates, P.; Costello, J.T. Ion flux enhancements and oscillations in spatially confined laser produced aluminum plasmas. Phys. Plasmas 2014, 21, 093113. [Google Scholar] [CrossRef]
- Hassanein, A. Effects of plasma spatial profile on conversion efficiency of laser-produced plasma sources for EUV lithography. J. Micro/Nanolithogr. MEMS MOEMS 2009, 8, 041503. [Google Scholar] [CrossRef] [Green Version]
- Wu, J.; Wei, W.; Li, X.; Jia, S.; Qiu, A. Infrared nanosecond laser-metal ablation in atmosphere: Initial plasma during laser pulse and further expansion. Appl. Phys. Lett. 2013, 102, 164104. [Google Scholar] [CrossRef]
- Hussein, A.E.; Diwakar, P.K.; Harilal, S.S.; Hassanein, A. The role of laser wavelength on plasma generation and expansion of ablation plumes in air. J. Appl. Phys. 2013, 113, 143305. [Google Scholar] [CrossRef]
- Geohegan, D.B. Fast intensified-CCD photography of YBA2Cu3P7-x laser ablation in vacuum and ambient oxygen. Appl. Phys. Lett. 1992, 60, 2732–2734. [Google Scholar] [CrossRef]
- Gao, X.; Liu, L.; Song, C.; Lin, J. The role of spatial confinement on nanosecond YAG laser-induced Cu plasma. J. Phys. D Appl. Phys. 2015, 48, 175205. [Google Scholar] [CrossRef]
- Wang, Y.; Chen, A.; Sui, L.; Li, S.; Liu, D.; Wang, X.; Jiang, Y.; Huang, X.; Jin, M. Persistence of atomic spectral line on laser-induced Cu plasma with spatial confinement. Phys. Plasmas 2016, 23, 113105. [Google Scholar] [CrossRef]
- Hough, P.; Kelly, T.J.; Fallon, C.; McLoughlin, C.; Hayden, P.; Kennedy, E.T.; Mosnier, J.P.; Harilal, S.S.; Costello, J.T. Enhanced shock wave detection sensitivity for laser-produced plasmas in low pressure ambient gases using interferometry. Meas. Sci. Technol. 2012, 23, 125204. [Google Scholar] [CrossRef] [Green Version]
- Harilal, S.S.; Bindhu, C.V.; Tillack, M.S.; Najmabadi, F.; Gaeris, A.C. Internal structure and expansion dynamics of laser ablation plumes into ambient gases. J. Appl. Phys. 2003, 93, 2380–2388. [Google Scholar] [CrossRef] [Green Version]
- Miyamoto, S.; Amano, S.; Inoue, T.; Nica, P.-E.; Shimoura, A.; Kaku, K.; Sekioka, T.; Mochizuki, T. EUV source developments on laser-produced plasmas using cryogenic Xe and Lithium new scheme target. In Emerging Lithographic Technologies X; Lercel, M.J., Ed.; International Society for Optics and Photonics: San Jose, CA, USA, 2006; p. 61513S. [Google Scholar]
- Nagano, A.; Mochizuki, T.; Miyamoto, S.; Amano, S. Laser wavelength dependence of extreme ultraviolet light and particle emissions from laser-produced lithium plasmas. Appl. Phys. Lett. 2008, 93, 091502. [Google Scholar] [CrossRef]


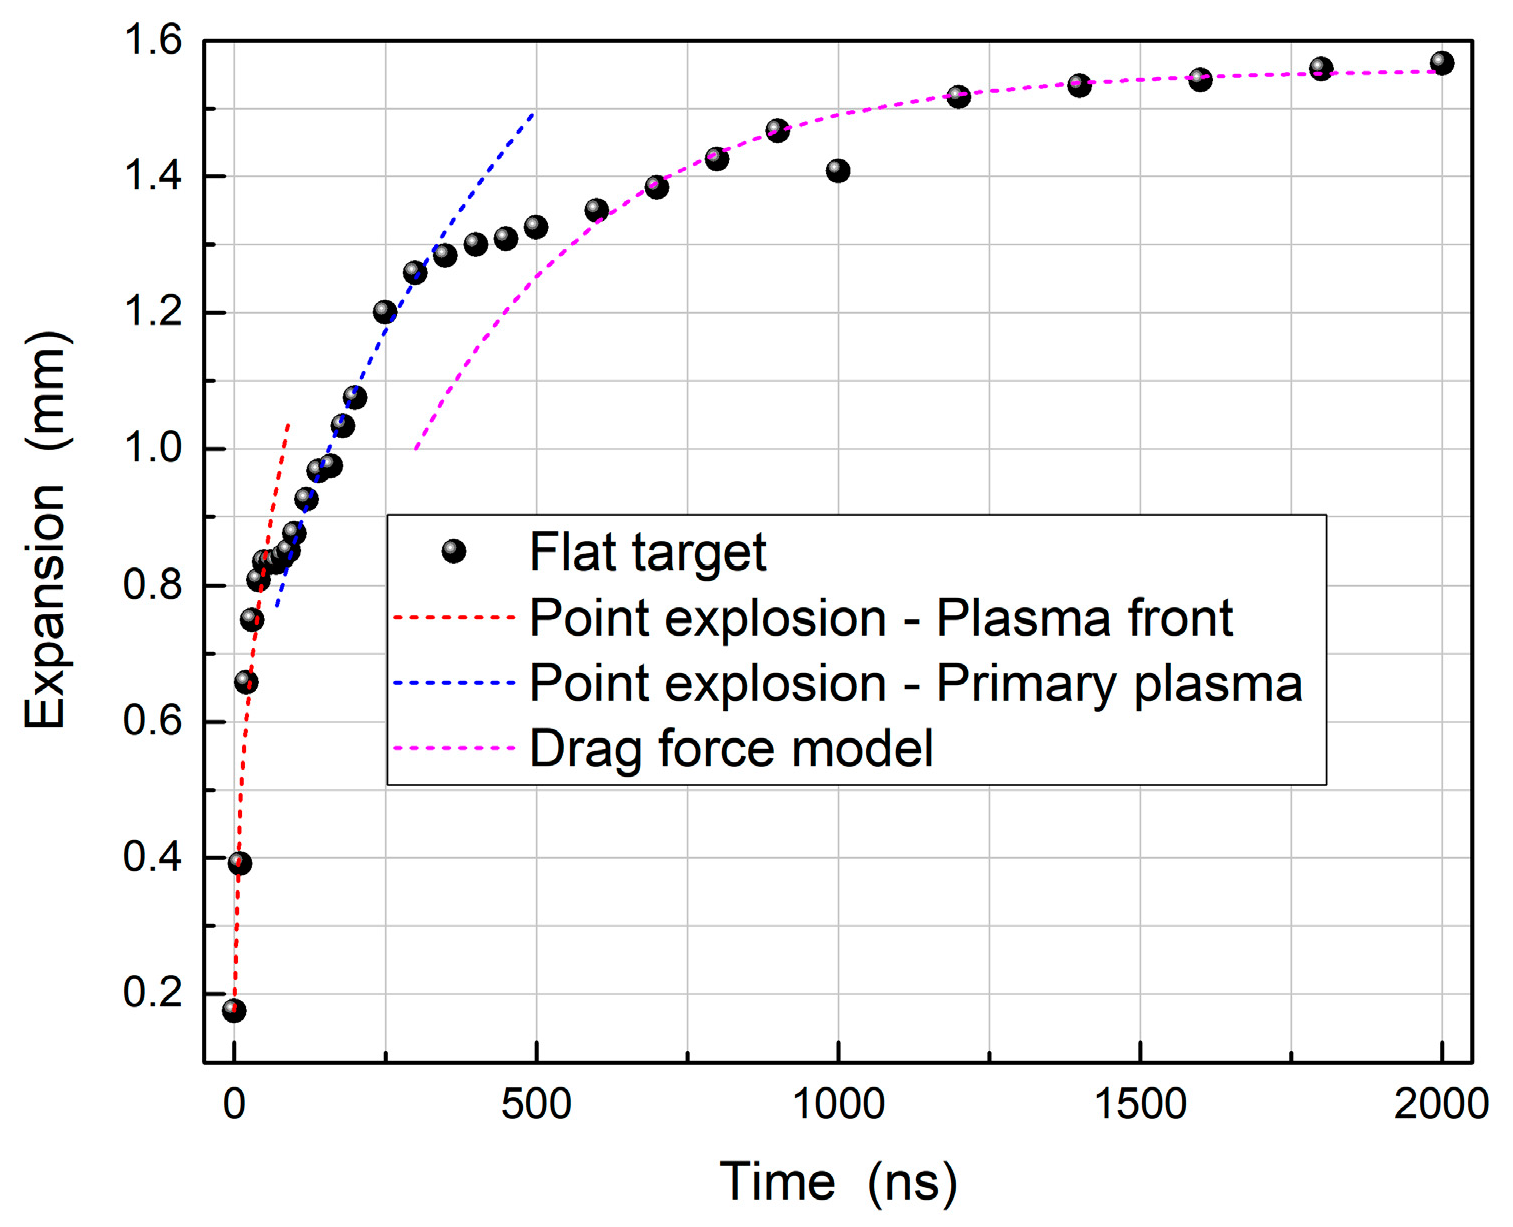
| Plasma Front | Flat | V90° | V60° | V30° |
| α | 0.11 | 0.12 | 0.12 | 0.13 |
| n | 0.46 | 0.48 | 0.48 | 0.46 |
| Primary Plasma | Flat | V90° | V60° | V30° |
| α | 0.11 | 0.13 | 0.13 | 0.14 |
| n | 0.41 | 0.40 | 0.40* | 0.40 * |
| Flat | V90° | V60° | V30° | |
|---|---|---|---|---|
| R0 | 1.56 | 1.95 | 1.84 | 1.94 |
| β | 3.00 × 10⁻³ | 2.20 × 10⁻³ | 3.10 × 10⁻³ | 2.50 × 10⁻³ |
Publisher’s Note: MDPI stays neutral with regard to jurisdictional claims in published maps and institutional affiliations. |
© 2020 by the authors. Licensee MDPI, Basel, Switzerland. This article is an open access article distributed under the terms and conditions of the Creative Commons Attribution (CC BY) license (http://creativecommons.org/licenses/by/4.0/).
Share and Cite
Varvarezos, L.; Davitt, S.J.; Costello, J.T.; Kelly, T.J. The Effect of Confinement Angle on Self-Colliding Aluminium Laser Plasmas Using Spectrally Resolved Fast Imaging. Materials 2020, 13, 5489. https://doi.org/10.3390/ma13235489
Varvarezos L, Davitt SJ, Costello JT, Kelly TJ. The Effect of Confinement Angle on Self-Colliding Aluminium Laser Plasmas Using Spectrally Resolved Fast Imaging. Materials. 2020; 13(23):5489. https://doi.org/10.3390/ma13235489
Chicago/Turabian StyleVarvarezos, Lazaros, Stephen J. Davitt, John T. Costello, and Thomas J. Kelly. 2020. "The Effect of Confinement Angle on Self-Colliding Aluminium Laser Plasmas Using Spectrally Resolved Fast Imaging" Materials 13, no. 23: 5489. https://doi.org/10.3390/ma13235489
APA StyleVarvarezos, L., Davitt, S. J., Costello, J. T., & Kelly, T. J. (2020). The Effect of Confinement Angle on Self-Colliding Aluminium Laser Plasmas Using Spectrally Resolved Fast Imaging. Materials, 13(23), 5489. https://doi.org/10.3390/ma13235489