Comparative Investigation of Activated Carbon Electrode and a Novel Activated Carbon/Graphene Oxide Composite Electrode for an Enhanced Capacitive Deionization


Abstract
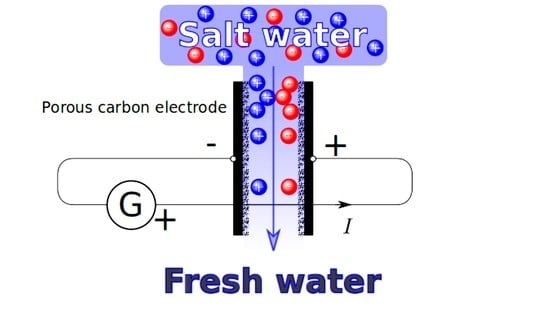
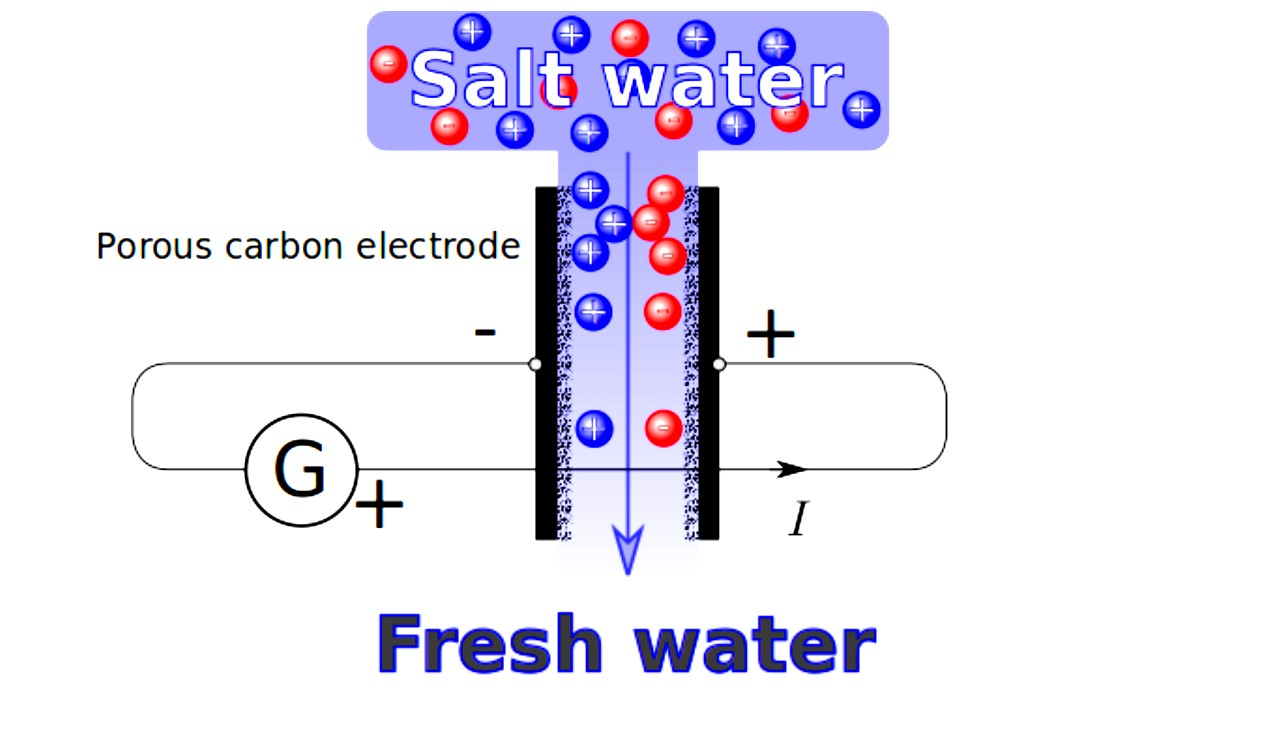
1. Introduction
2. Materials and Methods
2.1. Materials
2.2. Experimental Procedure
2.2.1. GO Synthesis
2.2.2. Fabrication of Activated Carbon/AC/GO-x Electrodes
2.3. Physical Characterization
2.4. Electrochemical Characterizations
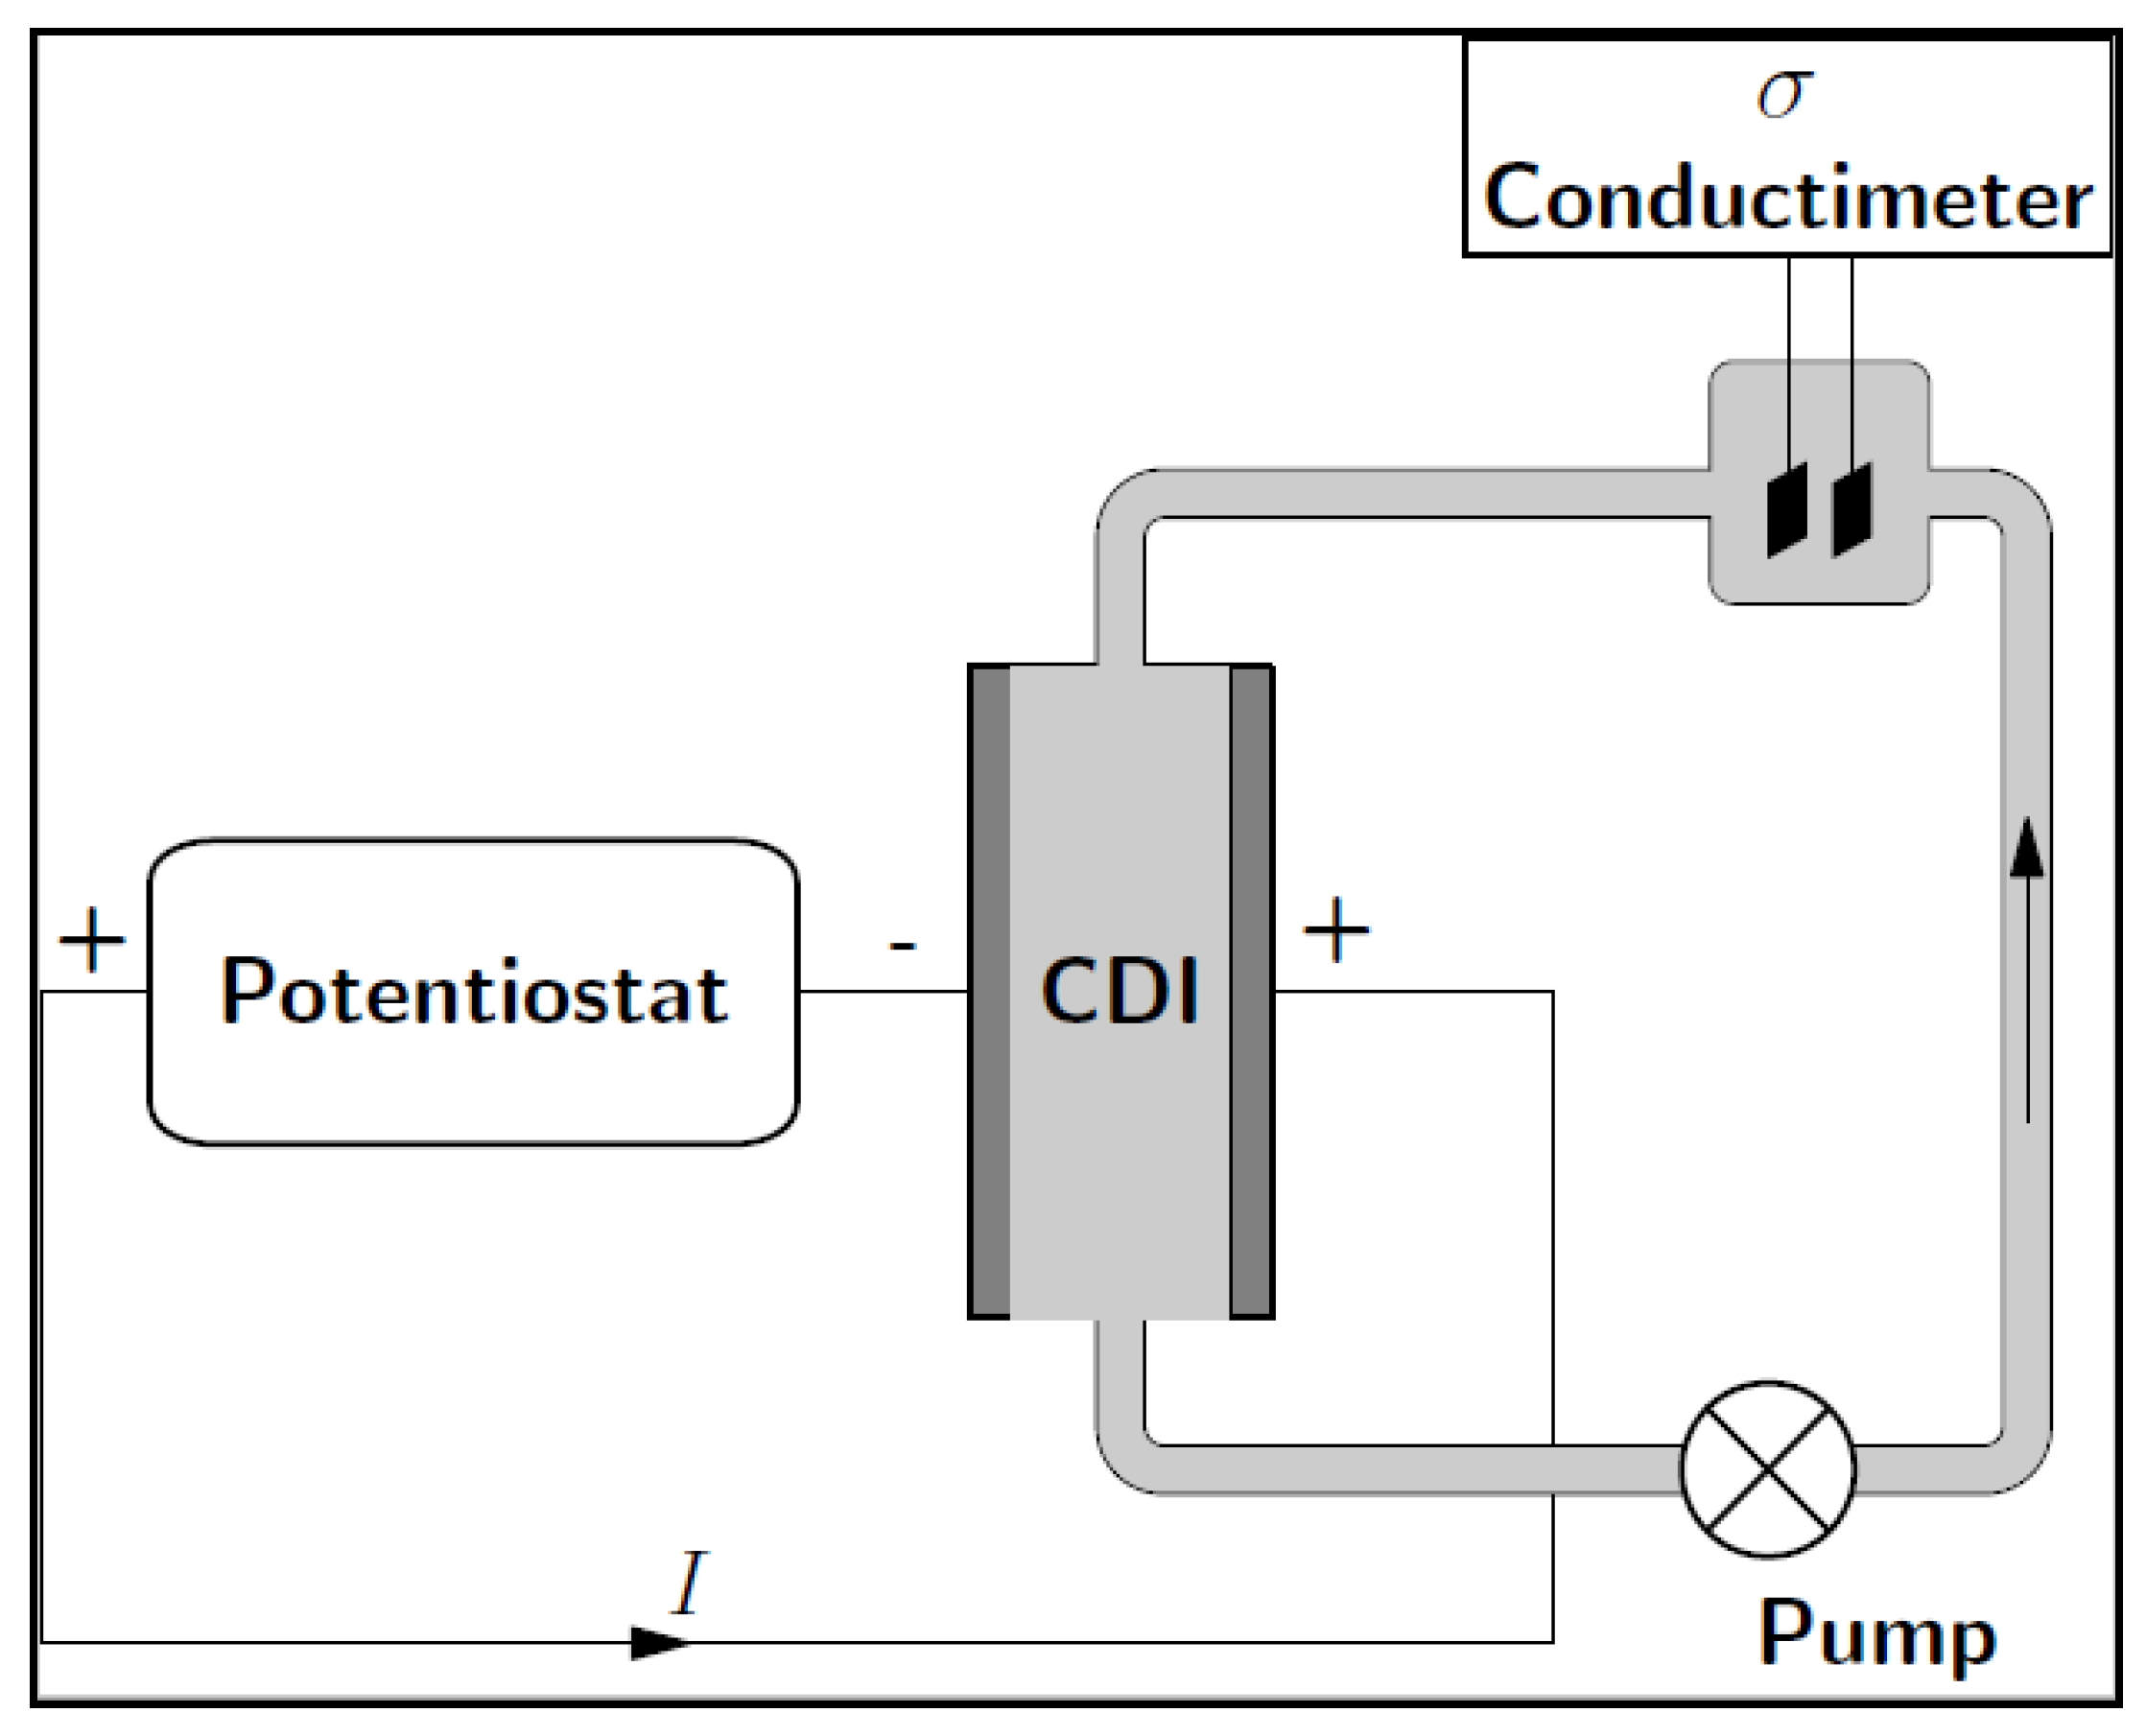
2.5. CDI Measurements
3. Results
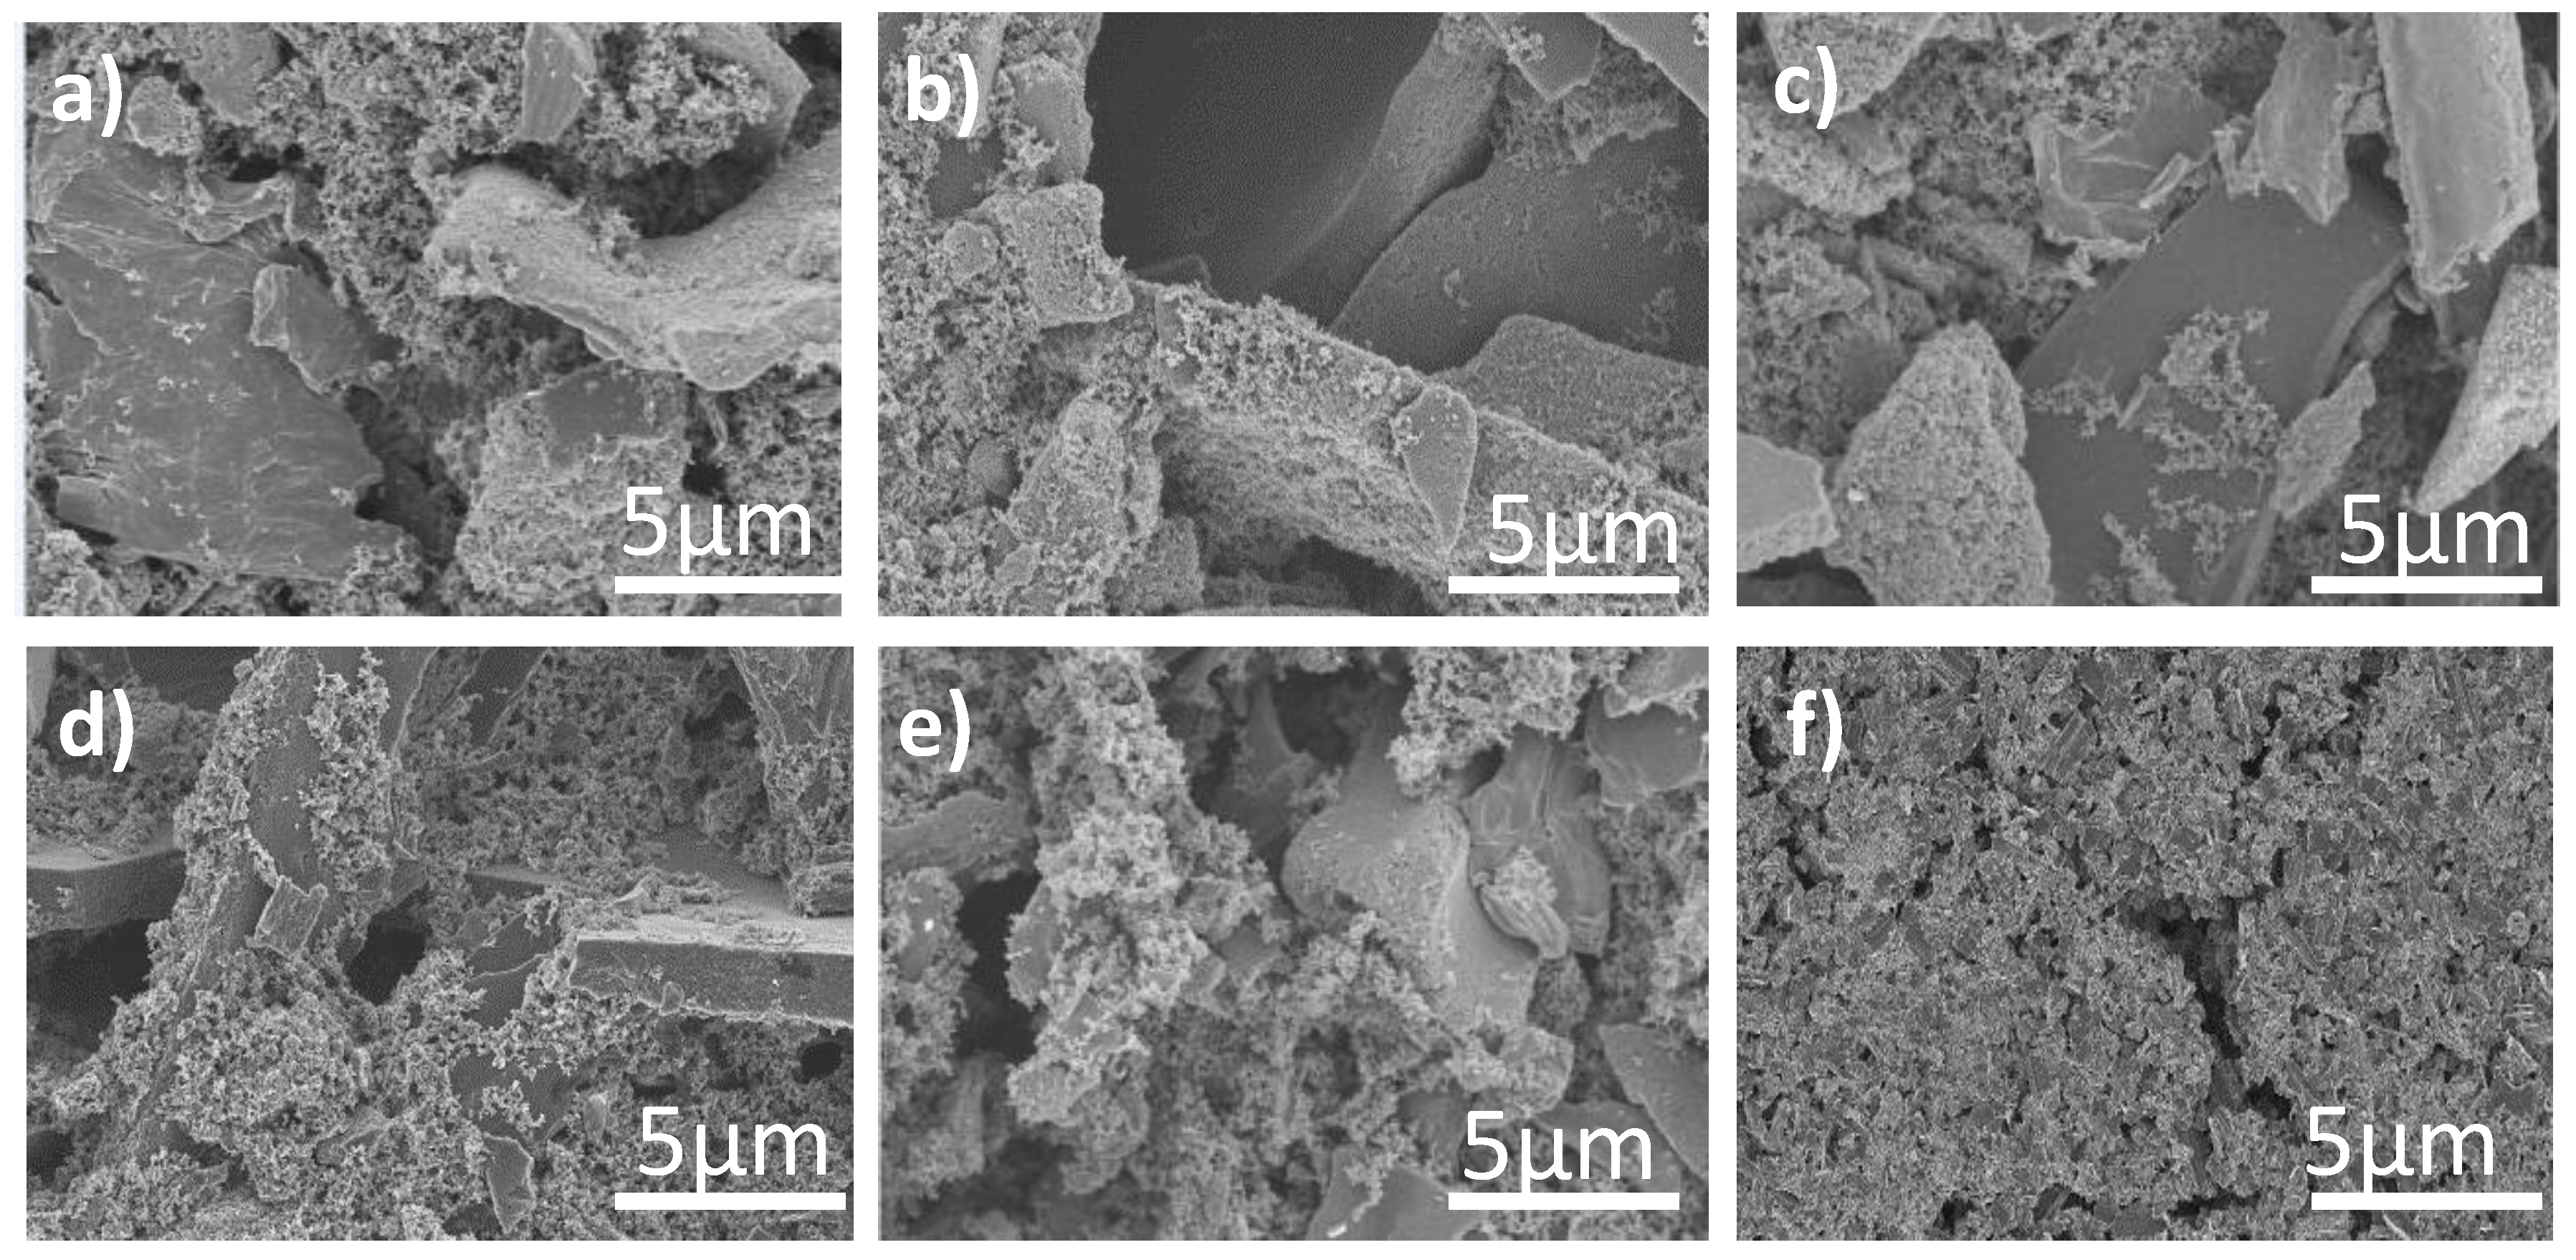
3.1. Morphological Properties
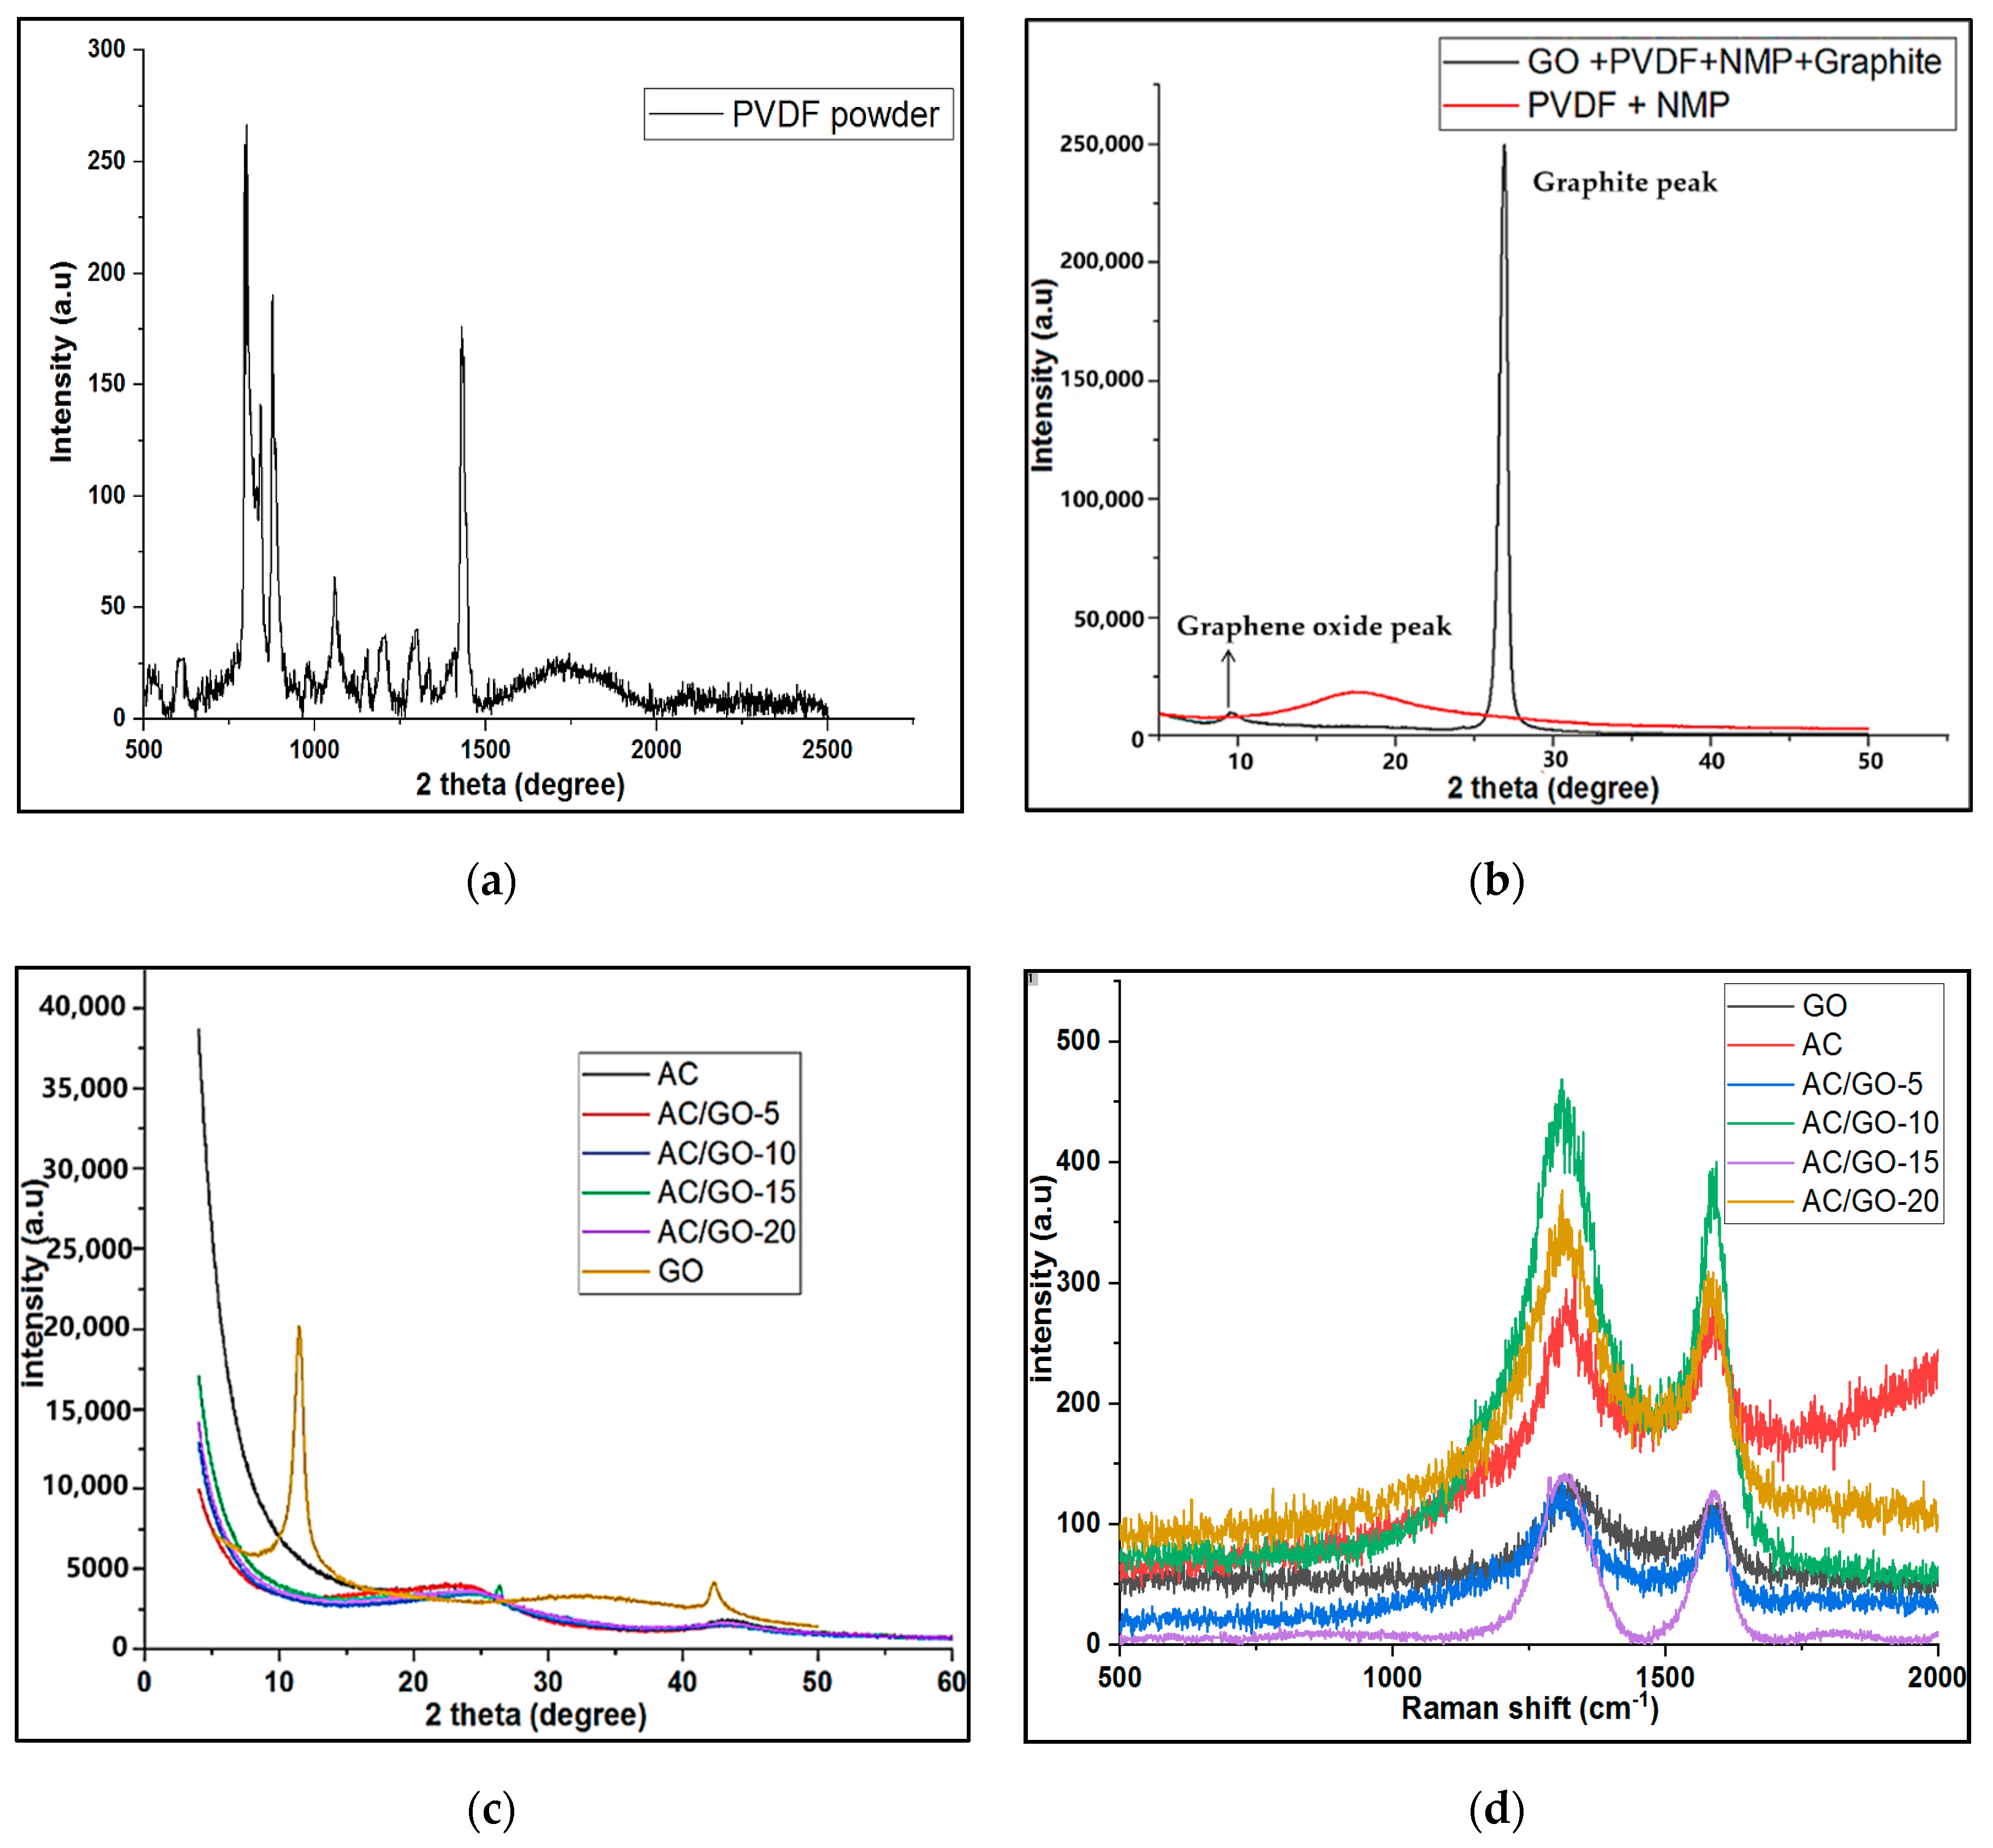
3.2. Raman Analysis of GO, AC and AC/GO-x
3.3. XRD Investigation
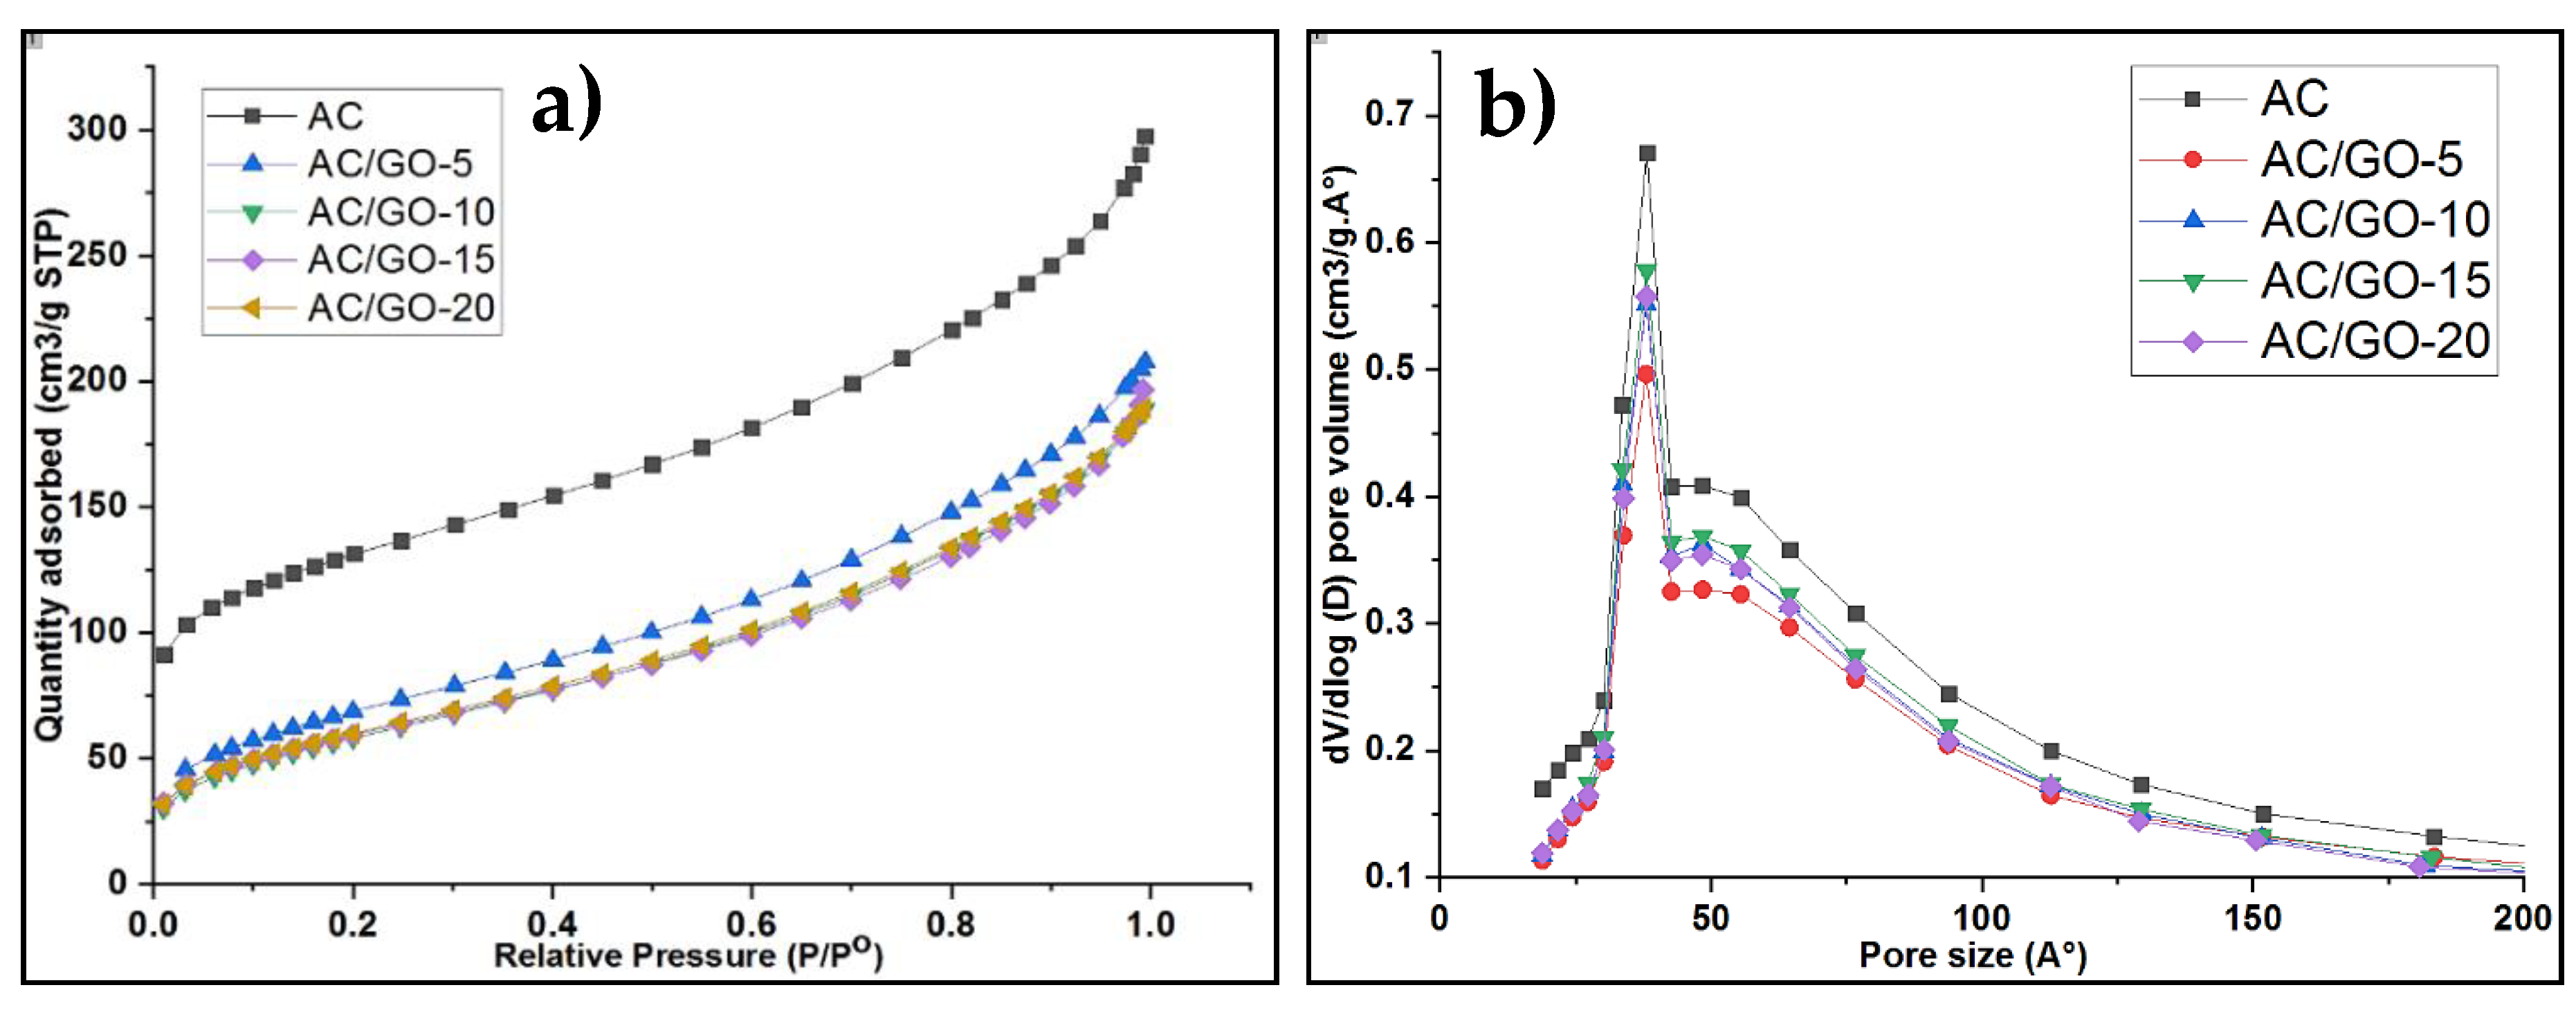
3.4. Textural Properties
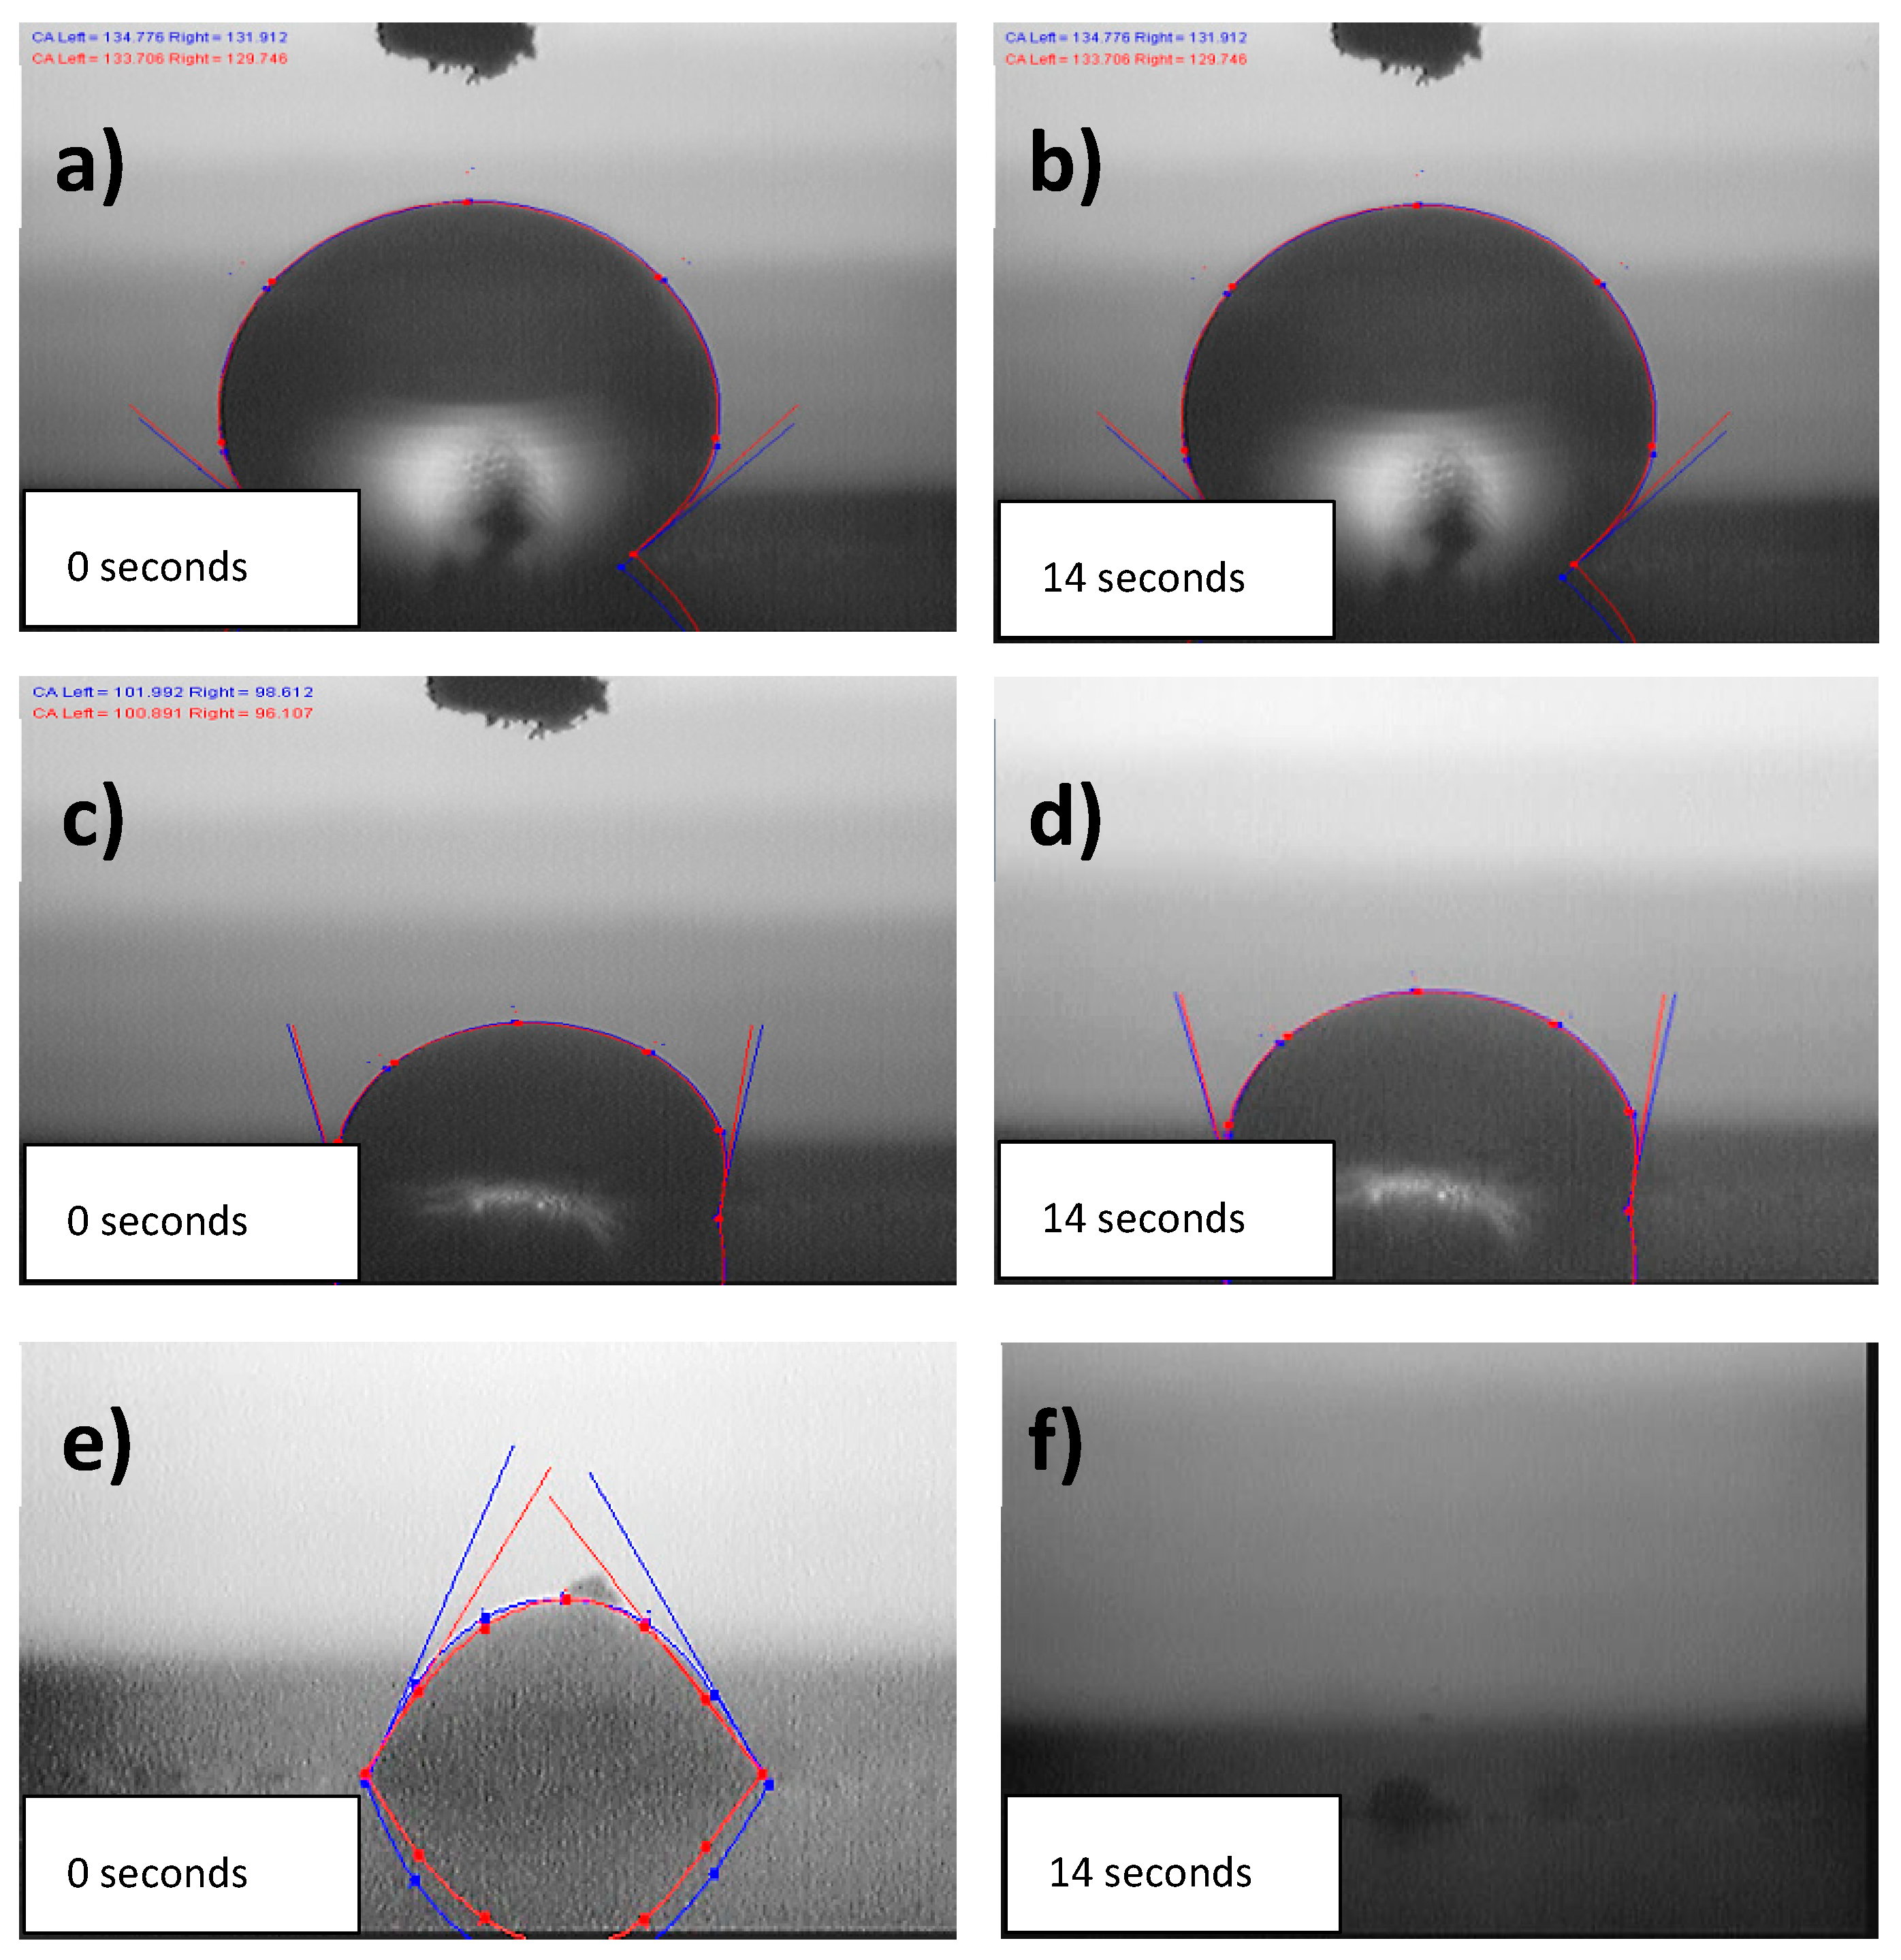
3.5. Wettability Properties
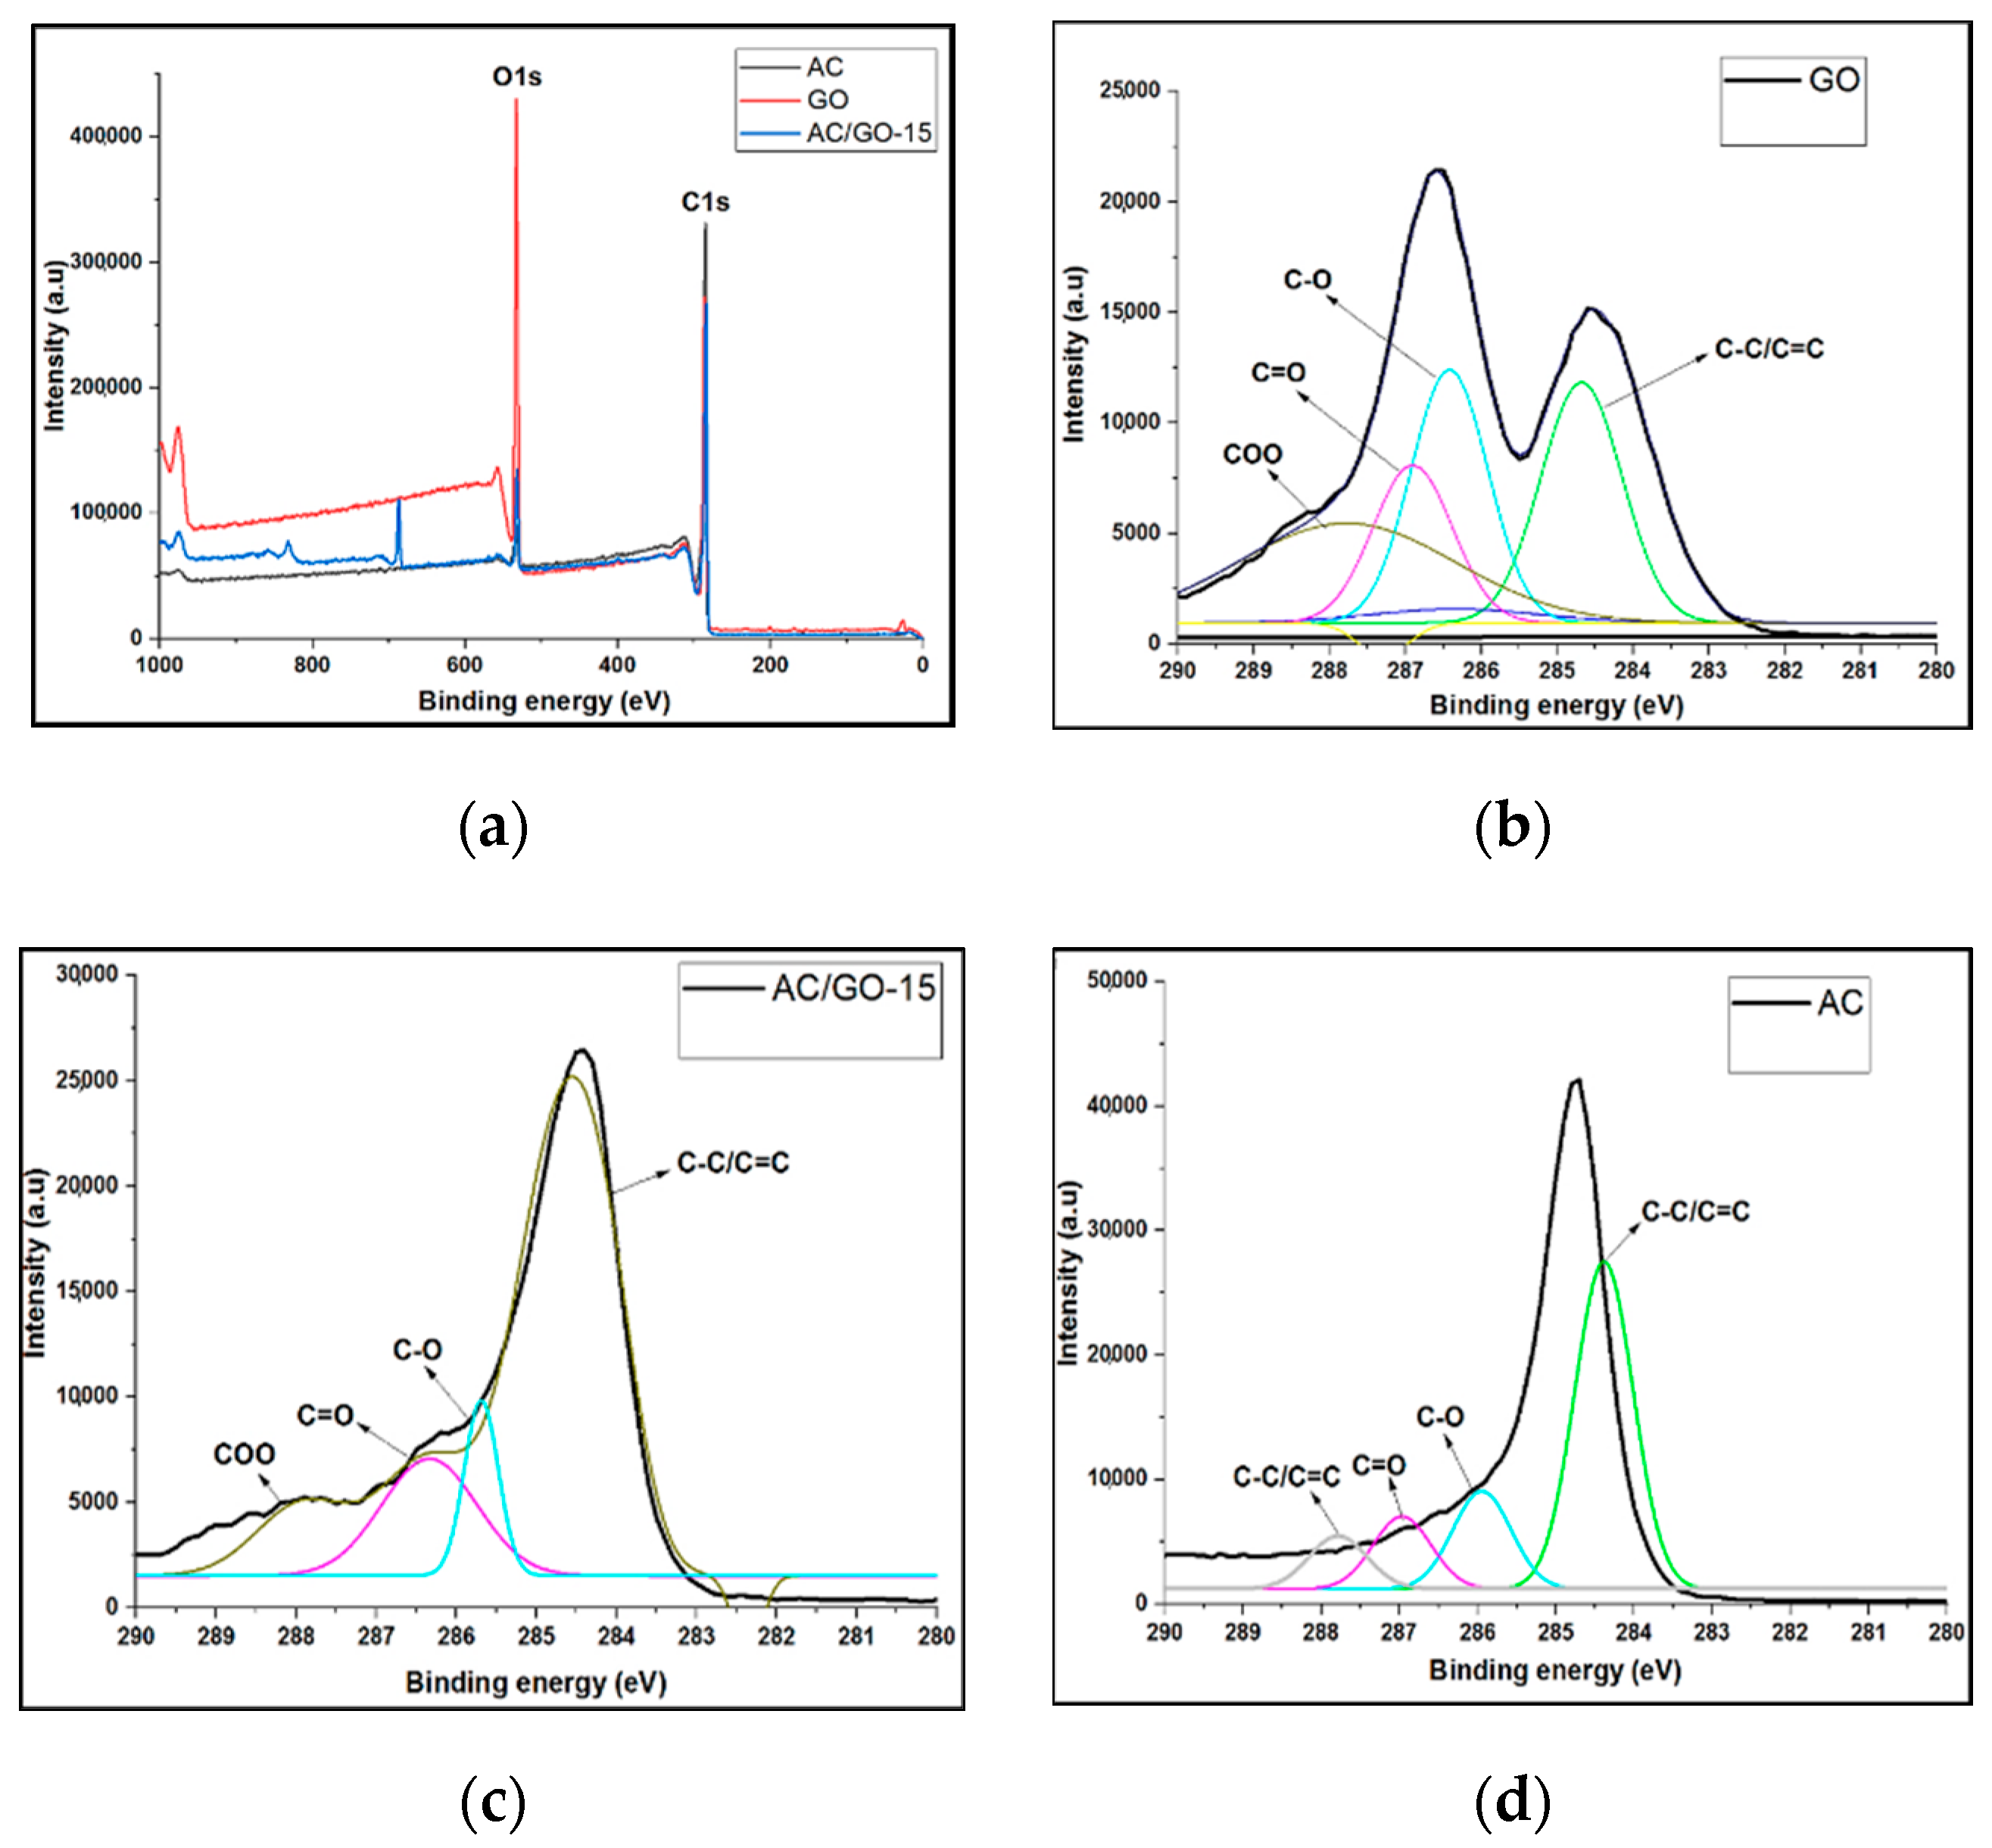
3.6. XPS Investigation
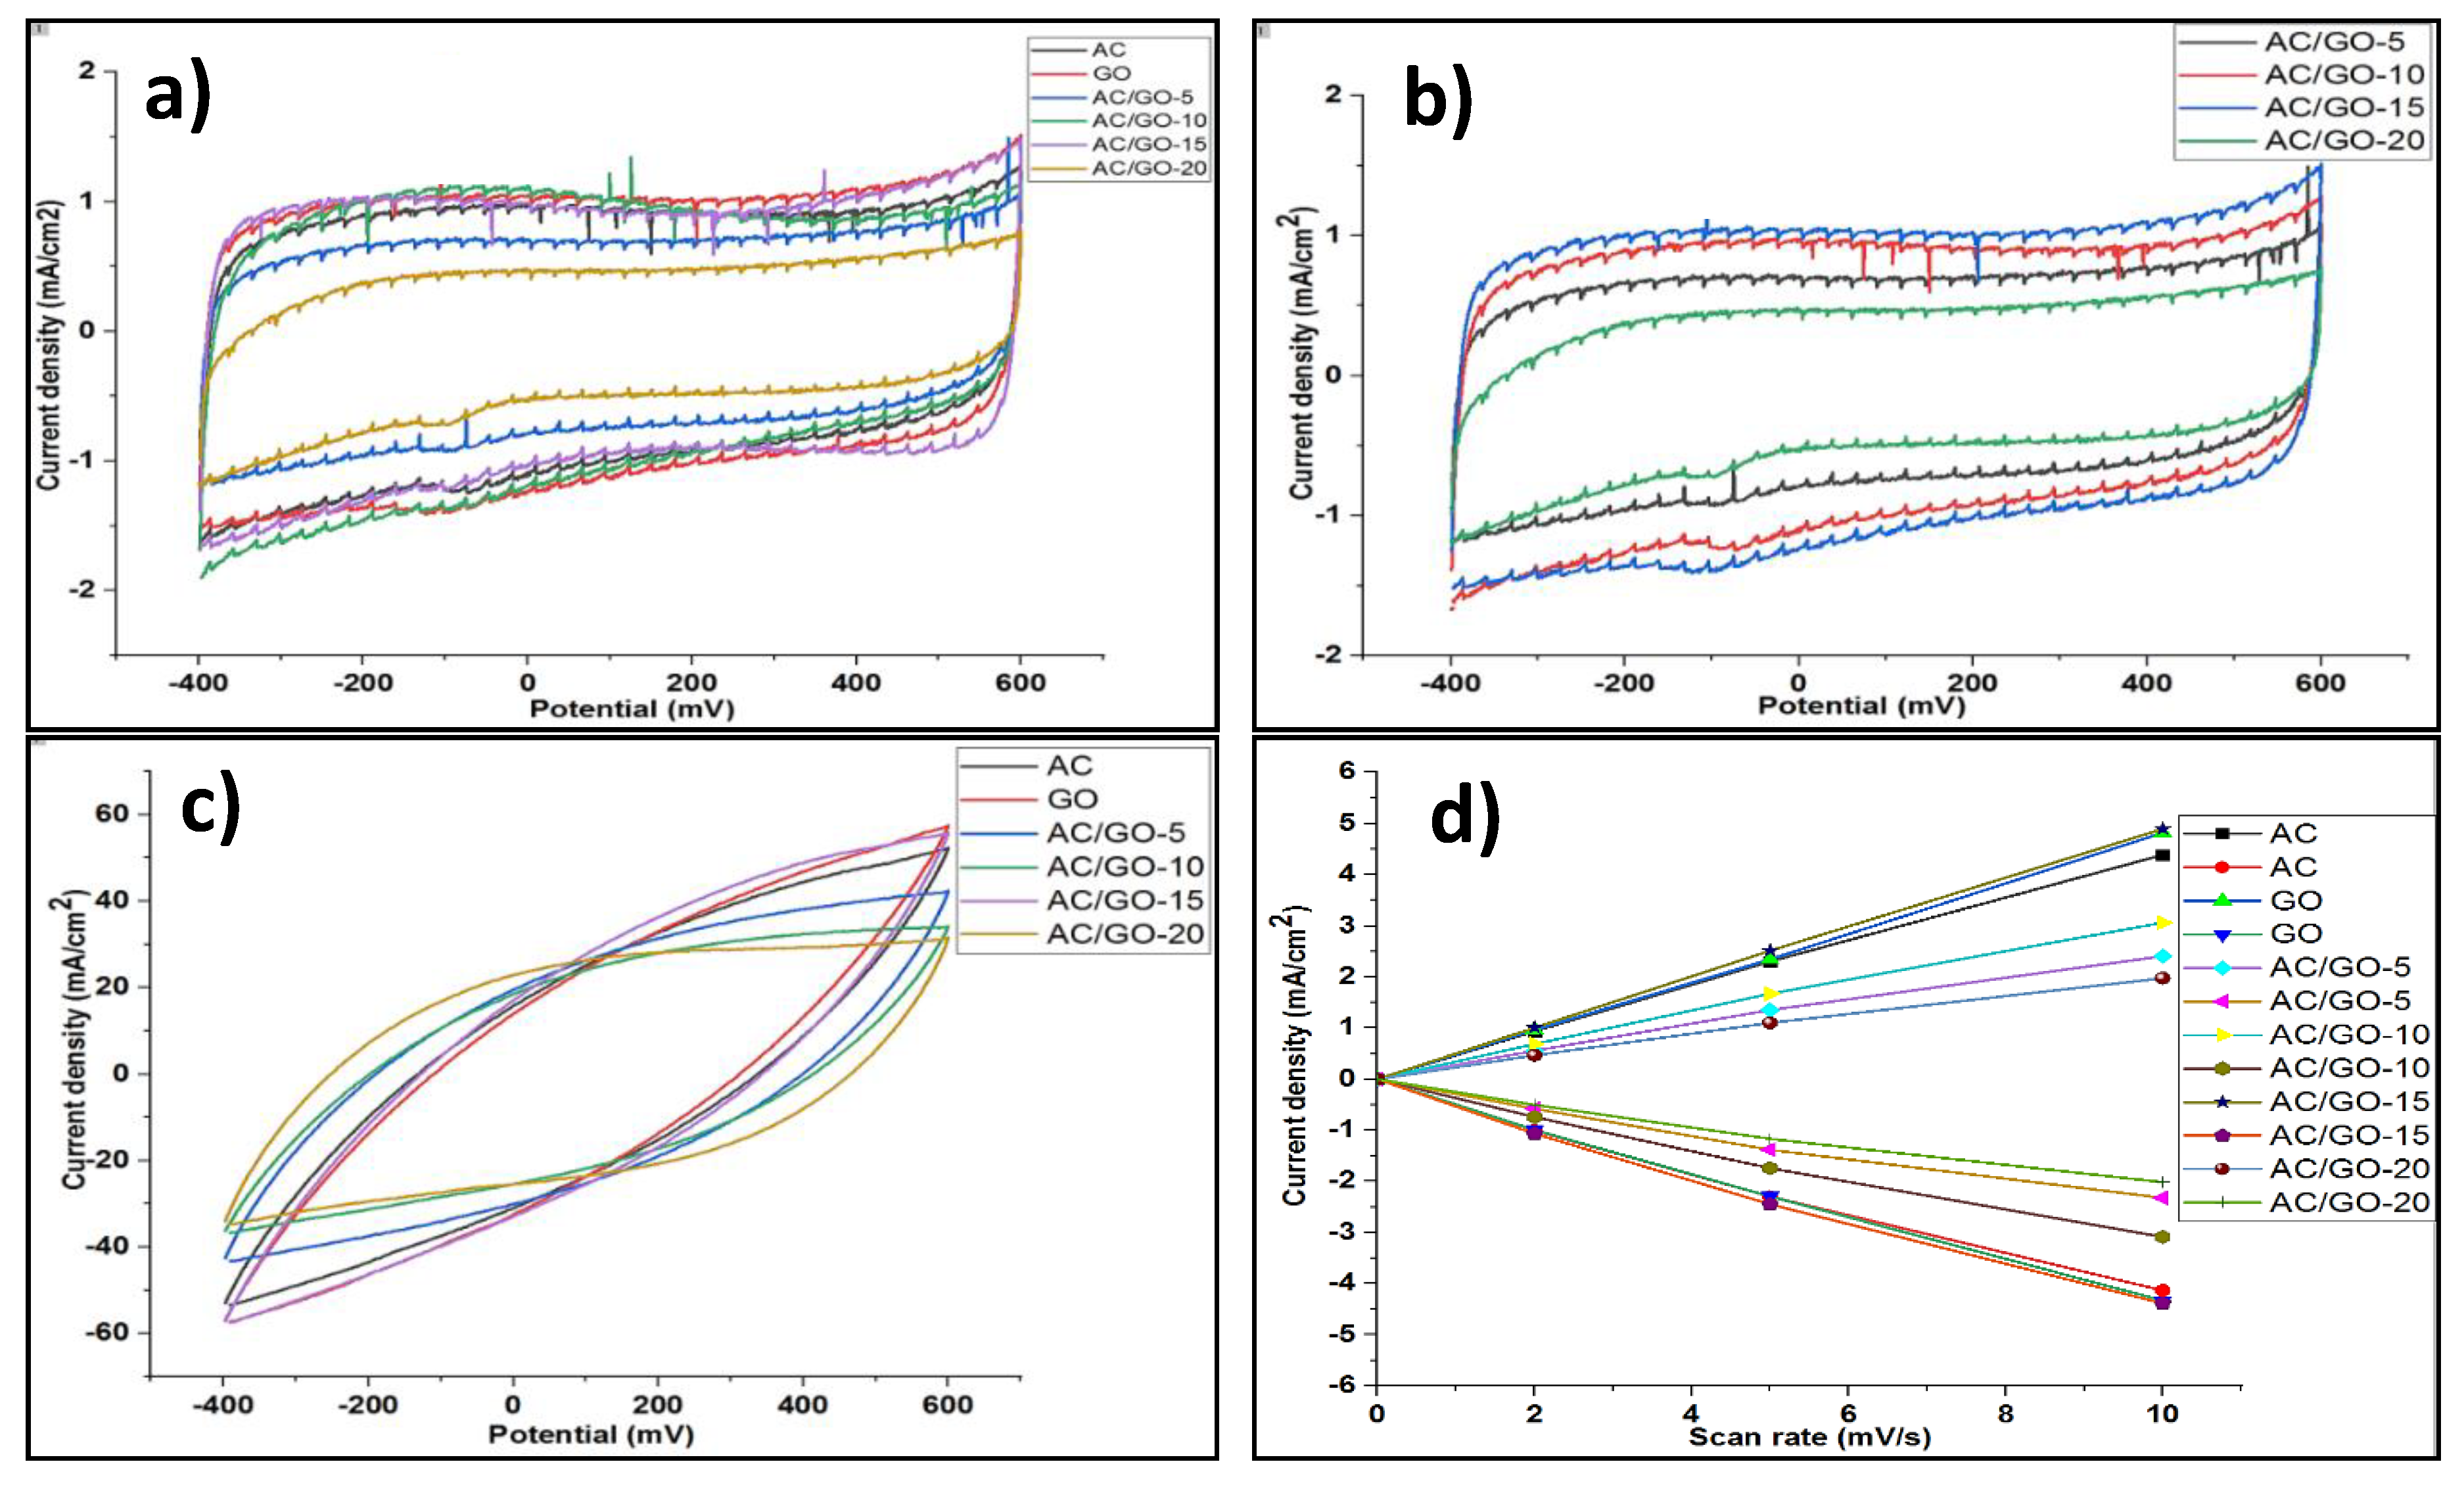
3.7. Electrochemical Properties
3.8. Desalination Performance
4. Conclusions
Author Contributions
Funding
Acknowledgments
Conflicts of Interest
References
- Alkaisi, A.; Mossad, R.; Sharifian-Barforoush, A. A Review of the Water Desalination Systems Integrated with Renewable Energy. Energy Procedia 2017, 110, 268–274. [Google Scholar] [CrossRef]
- Folaranmi, G.; Bechelany, M.; Sistat, P.; Cretin, M.; Zaviska, F. Towards Electrochemical Water Desalination Techniques: A Review on Capacitive Deionization, Membrane Capacitive Deionization and Flow Capacitive Deionization. Membranes 2020, 10, 96. [Google Scholar] [CrossRef] [PubMed]
- Zou, L.; Li, L.; Song, H.; Morris, G. Using mesoporous carbon electrodes for brackish water desalination. Water Res. 2008, 42, 2340–2348. [Google Scholar] [CrossRef] [PubMed]
- Porada, S.; Zhao, R.; Van Der Wal, A.; Presser, V.; Biesheuvel, P.M. Review on the science and technology of water desalination by capacitive deionization. Prog. Mater. Sci. 2013, 58, 1388. [Google Scholar] [CrossRef]
- Wang, X.Q.; Wang, P.; Ning, P.; Ma, Y.X.; Wang, F.; Guo, X.L.; Lan, Y. Adsorption of gaseous elemental mercury with activated carbon impregnated with ferric chloride. RSC Adv. 2015, 5, 24899. [Google Scholar] [CrossRef]
- Zhang, C.; Song, W.; Sun, G.; Xie, L.; Wan, L.; Wang, J.; Li, K. Synthesis, Characterization, and Evaluation of Activated Carbon Spheres for Removal of Dibenzothiophene from Model Diesel Fuel. Ind. Eng. Chem. Res. 2014, 53, 4271–4276. [Google Scholar] [CrossRef]
- Bonvin, F.; Jost, L.; Randin, L.; Bonvin, E.; Kohn, T. Super-fine powdered activated carbon (SPAC) for efficient removal of micropollutants from wastewater treatment plant effluent. Water Res. 2016, 90, 90–99. [Google Scholar] [CrossRef]
- Wang, L.; Wang, M.; Huang, Z.-H.; Cui, T.; Gui, X.; Kang, F.; Wang, K.; Wu, D. Capacitive deionization of NaCl solutions using carbon nanotube sponge electrodes. J. Mater. Chem. 2011, 21, 18295–18299. [Google Scholar] [CrossRef]
- Li, H.; Pan, L.; Lu, T.; Zhan, Y.; Nie, C.; Sun, Z. A comparative study on electrosorptive behavior of carbon nanotubes and graphene for capacitive deionization. J. Electroanal. Chem. 2011, 653, 40–44. [Google Scholar] [CrossRef]
- Ata, S.; Banerjee, S.L.; Singha, N.K. Polymer nano-hybrid material based on graphene oxide/POSS via surface initiated atom transfer radical polymerization (SI-ATRP): Its application in specialty hydrogel system. Polymer 2016, 103, 46–56. [Google Scholar] [CrossRef]
- Jia, B.; Zou, L. Graphene nanosheets reduced by a multi-step process as high-performance electrode material for capacitive deionisation. Carbon 2012, 50, 2315–2321. [Google Scholar] [CrossRef]
- Kruk, M.; Jaroniec, M. Gas Adsorption Characterization of Ordered Organic−Inorganic Nanocomposite Materials. Chem. Mater. 2001, 13, 3169–3183. [Google Scholar] [CrossRef]
- Lv, J.; Zhang, G.; Zhang, H.; Yang, F. Graphene oxide-cellulose nanocrystal (GO-CNC) composite functionalized PVDF membrane with improved antifouling performance in MBR: Behavior and mechanism. Chem. Eng. J. 2018, 352, 765–773. [Google Scholar] [CrossRef]
- Wu, T.; Zhou, B.; Zhu, T.; Shi, J.; Xu, Z.; Hu, C.; Wang, J. Facile and low-cost approach towards a PVDF ultrafiltration membrane with enhanced hydrophilicity and antifouling performance via graphene oxide/water-bath coagulation. RSC Adv. 2015, 5, 7880–7889. [Google Scholar] [CrossRef]
- Krishnamoorthy, K.; Navaneethaiyer, U.; Mohan, R.; Lee, J.; Kim, S.-J. Graphene oxide nanostructures modified multifunctional cotton fabrics. Appl. Nanosci. 2012, 2, 119–126. [Google Scholar] [CrossRef]
- Khalil, K.A.; Barakat, N.A.; Motlak, M.; Al-Mubaddel, F.S. A novel graphene oxide-based ceramic composite as an efficient electrode for capacitive deionization. Sci. Rep. 2020, 10, 9676. [Google Scholar] [CrossRef]
- Wang, Z.; Dou, B.; Zheng, L.; Zhang, G.; Liu, Z.; Hao, Z. Effective desalination by capacitive deionization with functional graphene nanocomposite as novel electrode material. Desalination 2012, 299, 96–102. [Google Scholar] [CrossRef]
- Biswas, S.; Drzal, L.T. Multilayered Nanoarchitecture of Graphene Nanosheets and Polypyrrole Nanowires for High Performance Supercapacitor Electrodes. Chem. Mater. 2010, 22, 5667–5671. [Google Scholar] [CrossRef]
- Alhabeb, M.; Beidaghi, M.; Van Aken, K.L.; Dyatkin, B.; Gogotsi, Y. High-density freestanding graphene/carbide-derived carbon film electrodes for electrochemical capacitors. Carbon 2017, 118, 642–649. [Google Scholar] [CrossRef]
- Suryanto, B.H.; Chen, S.; Duan, J.; Zhao, C. Hydrothermally driven transformation of oxygen functional groups at multiwall carbon nanotubes for improved electrocatalytic applications. ACS Appl. Mater. Interfaces. 2016, 14090. [Google Scholar] [CrossRef]
- Dong, Q.; Wang, G.; Qian, B.; Hu, C.; Wang, Y.; Qiu, J. Electrospun Composites Made of Reduced Graphene Oxide and Activated Carbon Nanofibers for Capacitive Deionization. Electrochim. Acta 2014, 137, 388–394. [Google Scholar] [CrossRef]
- El-Khodary, S.A.; El-Enany, G.M.; El-Okr, M.; Ibrahim, M. Preparation and Characterization of Microwave Reduced Graphite Oxide for High-Performance Supercapacitors. Electrochim. Acta 2014, 150, 269–278. [Google Scholar] [CrossRef]
- Konwar, L.J.; Sugano, Y.; Chutia, R.S.; Shchukarev, A.; Mäki-Arvela, P.; Kataki, R.; Mikkola, J.-P. Sustainable synthesis of N and P co-doped porous amorphous carbon using oil seed processing wastes. Mater. Lett. 2016, 173, 145–148. [Google Scholar] [CrossRef]
- Shen, J.; Yan, B.; Shi, M.; Ma, H.; Li, N.; Ye, M. One step hydrothermal synthesis of TiO2-reduced graphene oxide sheets. J. Mater. Chem. 2011, 21, 3415–3421. [Google Scholar] [CrossRef]
- Nishiyama, T.; Sumihara, T.; Sato, E.; Horibe, H. Effect of solvents on the crystal formation of poly(vinylidene fluoride) film prepared by a spin-coating process. Polym. J. 2017, 49, 319–325. [Google Scholar] [CrossRef]
- Basri, N.H.; Dolah, B.N.M. Physical and electrochemical properties of supercapacitor electrodes derived from carbon nanotube and biomass carbon. Int. J. Electrochem. Sci. 2013, 8, 257–273. [Google Scholar]
- Wang, K.; Zhao, N.; Lei, S.; Yan, R.; Tian, X.; Wang, J.; Song, Y.; Xu, D.; Guo, Q.; Liu, L. Promising biomass-based activated carbons derived from willow catkins for high performance supercapacitors. Electrochim. Acta 2015, 166, 1–11. [Google Scholar] [CrossRef]
- Thorogood, C.A.; Wildgoose, G.G.; Jones, J.H.; Compton, R.G. Identifying quinone-like species on the surface of graphitic carbon and multi-walled carbon nanotubes using reactions with 2,4-dinitrophenylhydrazine to provide a voltammetric fingerprint. New J. Chem. 2007, 31, 958–965. [Google Scholar] [CrossRef]
- Blegur, E.J.; Endarko, E. Study the effect of active carbon modified using HNO3 for carbon electrodes in capacitive deionization system. AIP Conf. Proc. 2016, 1788, 030041-1–030041-6. [Google Scholar]
- Huang, W.; Zhang, Y.; Bao, S.; Cruz, R.; Song, S. Desalination by capacitive deionization process using nitric acid-modified activated carbon as the electrodes. Desalination 2014, 340, 67–72. [Google Scholar] [CrossRef]
- Villar, I.; Roldan, S.; Ruiz, V.; Granda, M.; Blanco, C.; Menéndez, R.; Santamariía, R. Capacitive Deionization of NaCl Solutions with Modified Activated Carbon Electrodes S. Energy Fuels 2010, 24, 3329–3333. [Google Scholar] [CrossRef]
- Gao, X.; Omosebi, A.; Landon, J.; Liu, K. Enhanced Salt Removal in an Inverted Capacitive Deionization Cell Using Amine Modified Microporous Carbon Cathodes. Environ. Sci. Technol. 2015, 49, 10920–10926. [Google Scholar] [CrossRef] [PubMed]
- Yasin, A.S.; Mohamed, H.O.; Mohamed, I.M.; Mousa, H.M.; Barakat, N.A. Enhanced desalination performance of capacitive deionization using zirconium oxide nanoparticles-doped graphene oxide as a novel and effective electrode. Sep. Purif. Technol. 2016, 171, 34–43. [Google Scholar] [CrossRef]
- Leong, Z.Y.; Lu, G.; Yang, H.Y. Three-dimensional graphene oxide and polyvinyl alcohol composites as structured activated carbons for capacitive desalination. Desalination 2019, 451, 172–181. [Google Scholar] [CrossRef]


| Sample | d002 (nm) | 100/101 (nm) |
|---|---|---|
| AC | 0.35 | 0.21 |
| AC/GO-5 | 0.35 | 0.21 |
| AC/GO-10 | 0.35 | 0.21 |
| AC/GO-15 | 0.35 | 0.21 |
| AC/GO-20 | 0.35 | 0.21 |
| Sample | Vt (cm3·g−1) | SBET (m2·g−1) | VMICRO (cm3·g−1) | VMESO (cm3·g−1) |
|---|---|---|---|---|
| Pure AC | 0.82 | 1034.02 | 0.40 | 0.55 |
| AC | 0.33 | 467.62 | 0.19 | 0.35 |
| GO | 0.01 | 5.48 | 0.02 | 0.01 |
| AC/GO-5 | 0.30 | 228.29 | 0.07 | 0.30 |
| AC/GO-10 | 0.31 | 231.45 | 0.18 | 0.31 |
| AC/GO-15 | 0.43 | 240.43 | 0.08 | 0.30 |
| AC/GO-20 | 0.30 | 200.56 | 0.06 | 0.27 |
| Sample | AC | GO | AC/GO-5 | AC/GO-10 | AC/GO-15 | AC/GO-20 |
|---|---|---|---|---|---|---|
| CEDL (F/cm2) | 0.92 | 0.58 | 0.62 | 0.94 | 1.61 | 0.47 |
| Cspecific (F/g) | 56 | 157 | 43 | 66 | 75 | 33 |
| Material | Adsorption Capacity (mg/g) | Adsorption Efficiency (%) | Capacitance (F/g) | Operating Voltage (V) | References |
|---|---|---|---|---|---|
| Oxidized AC | - | 36.10 | 8.9 | 2.00 | [29] |
| “ | - | 15.00 | 73.13 | “ | [30] |
| “ | - | 55.00 | - | 1.00 | [31] |
| “ | 5.30 | - | - | “ | [32] |
| GO/ZrO2 | 4.55 | - | - | 1.20 | [33] |
| GO/PVA | 35.00 | - | - | “ | [34] |
| N-doped Ti/GO | 9.20 | 98 | 157 | “ | [16] |
| AC/GO | 5.70 | 20.10 | - | 1.00 | this work |
| Electrode | Voltage (V) | Concentration (Mg/L) | Time (min) | Adsorption Efficiency (%) | Salt Adsorption Capacity (SAC, mg/g) | Specific Energy Consumption (SEC) (kWh/m3) | Kinetics (mg/min) | Average Salt Adsorption Rate (ASAR mg/g/min) |
|---|---|---|---|---|---|---|---|---|
| AC | 1.0 | 400 | 16 | 25.14 | 3.74 | 0.08 | 0.56 | 0.23 |
| AC/GO-15 | 20.1 | 5.70 | 0.10 | 1.04 | 0.34 | |||
| AC | 1.4 | 400 | 16 | 37 | 5.50 | 0.20 | 1.2 | 0.34 |
| AC/GO-15 | 25.8 | 7.31 | 0.18 | 1.56 | 0.46 | |||
| AC | 1.0 | 1200 | 16 | 11.76 | 5.25 | 0.10 | 0.55 | 0.33 |
| AC/GO-15 | 8.40 | 7.03 | 0.09 | 0.95 | 0.44 | |||
| AC | 1.4 | 1200 | 16 | 16 | 7.28 | 0.26 | 0.96 | 0.46 |
| AC/GO-15 | 10.3 | 8.77 | 0.20 | 1.34 | 0.55 |
Publisher’s Note: MDPI stays neutral with regard to jurisdictional claims in published maps and institutional affiliations. |
© 2020 by the authors. Licensee MDPI, Basel, Switzerland. This article is an open access article distributed under the terms and conditions of the Creative Commons Attribution (CC BY) license (http://creativecommons.org/licenses/by/4.0/).
Share and Cite
Folaranmi, G.; Bechelany, M.; Sistat, P.; Cretin, M.; Zaviska, F. Comparative Investigation of Activated Carbon Electrode and a Novel Activated Carbon/Graphene Oxide Composite Electrode for an Enhanced Capacitive Deionization. Materials 2020, 13, 5185. https://doi.org/10.3390/ma13225185
Folaranmi G, Bechelany M, Sistat P, Cretin M, Zaviska F. Comparative Investigation of Activated Carbon Electrode and a Novel Activated Carbon/Graphene Oxide Composite Electrode for an Enhanced Capacitive Deionization. Materials. 2020; 13(22):5185. https://doi.org/10.3390/ma13225185
Chicago/Turabian StyleFolaranmi, Gbenro, Mikhael Bechelany, Philippe Sistat, Marc Cretin, and Francois Zaviska. 2020. "Comparative Investigation of Activated Carbon Electrode and a Novel Activated Carbon/Graphene Oxide Composite Electrode for an Enhanced Capacitive Deionization" Materials 13, no. 22: 5185. https://doi.org/10.3390/ma13225185
APA StyleFolaranmi, G., Bechelany, M., Sistat, P., Cretin, M., & Zaviska, F. (2020). Comparative Investigation of Activated Carbon Electrode and a Novel Activated Carbon/Graphene Oxide Composite Electrode for an Enhanced Capacitive Deionization. Materials, 13(22), 5185. https://doi.org/10.3390/ma13225185