Impact of Acidity Profile on Nascent Polyaniline in the Modified Rapid Mixing Process—Material Electrical Conductivity and Morphological Study

 ,
,  , , , and
Abstract
1. Introduction
2. Materials and Methods
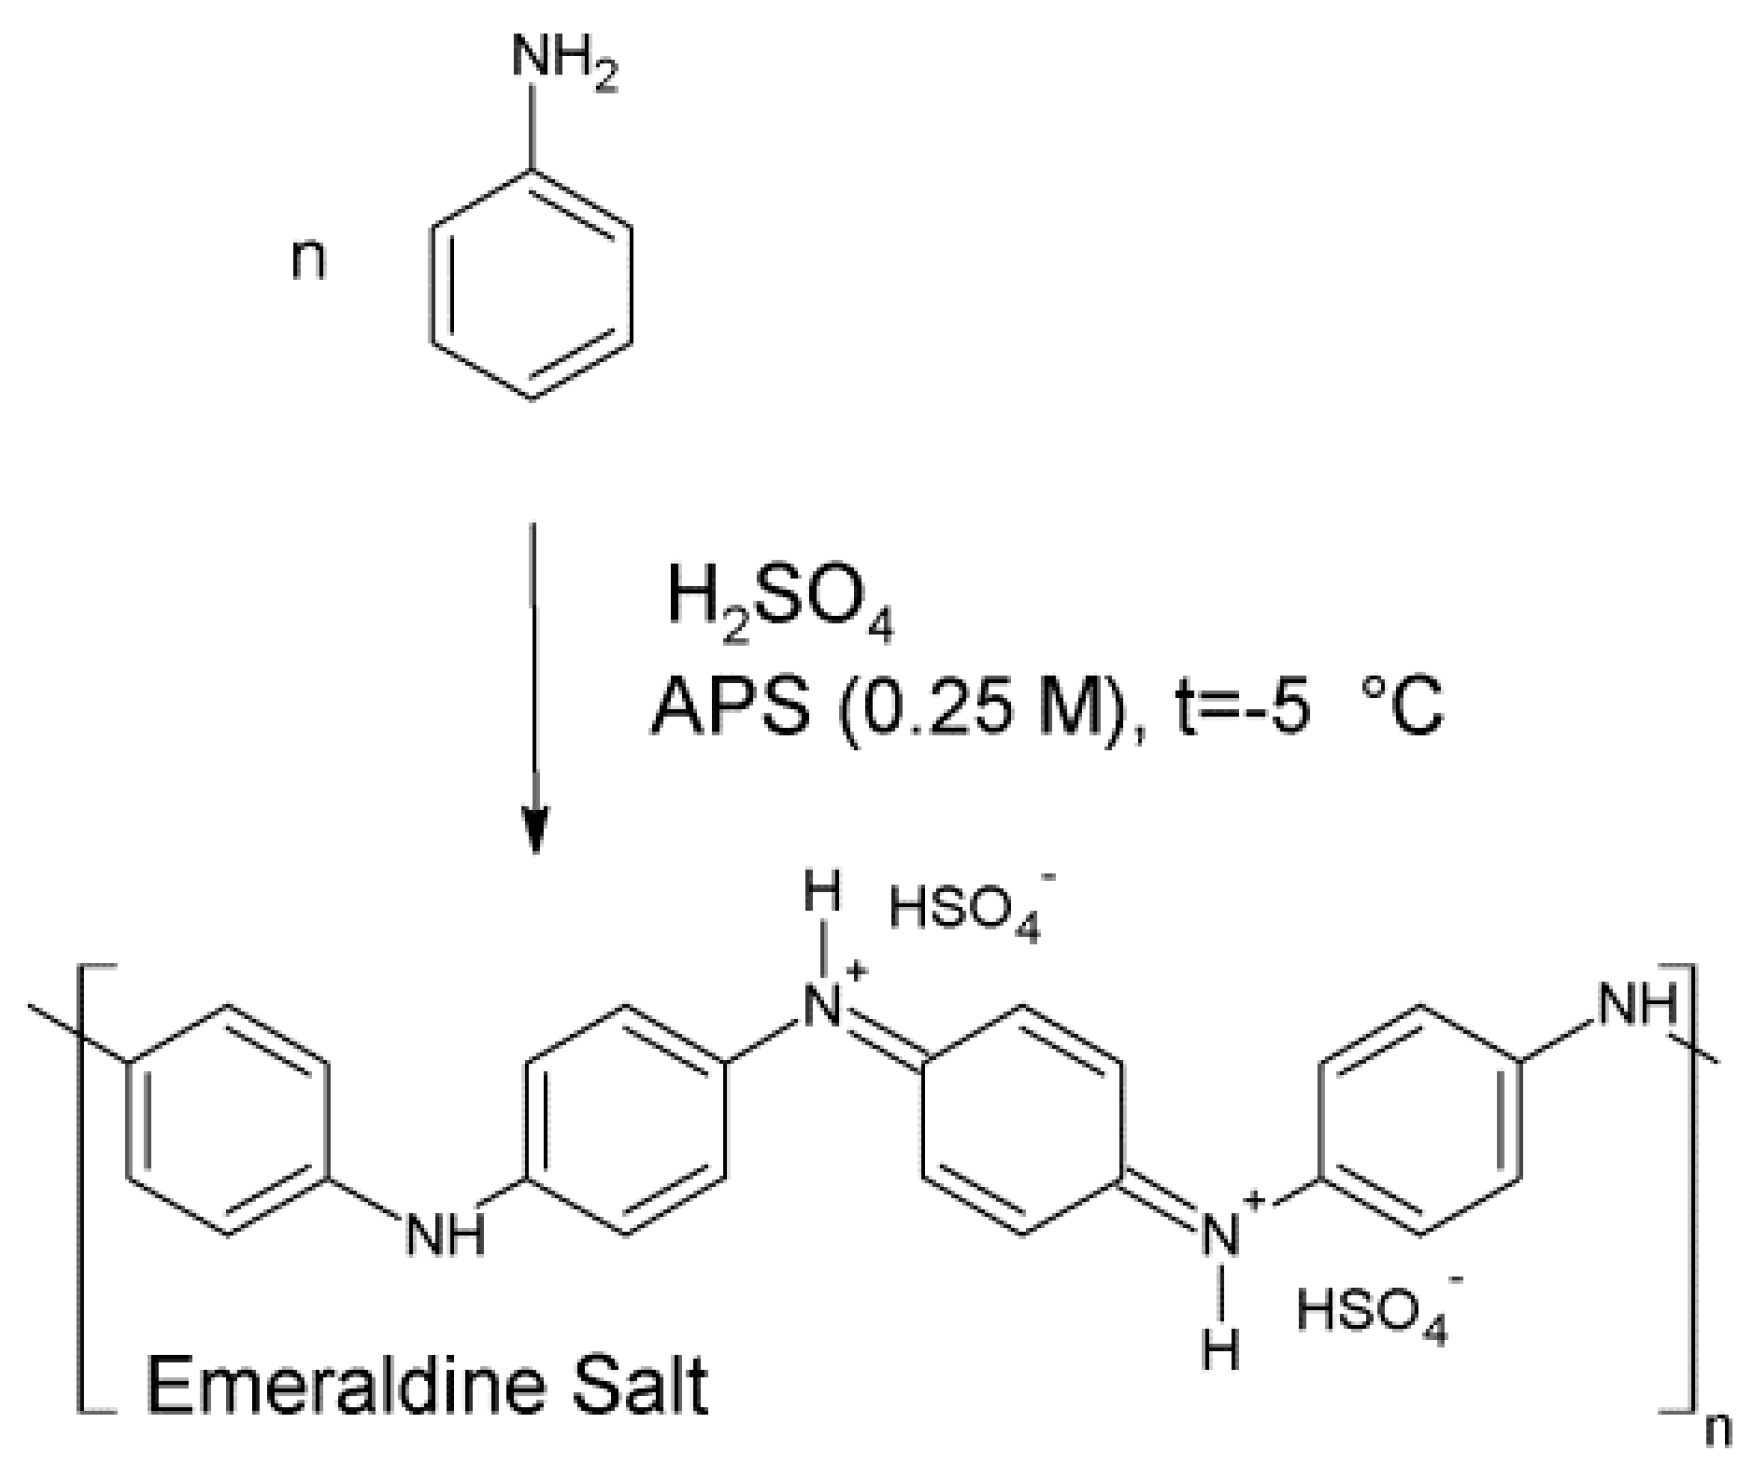
2.1. The Synthesis of Polyaniline
2.2. Analytical Methods
3. Results
3.1. Polymerization and Chemical Structure Determination
3.1.1. Polymerization
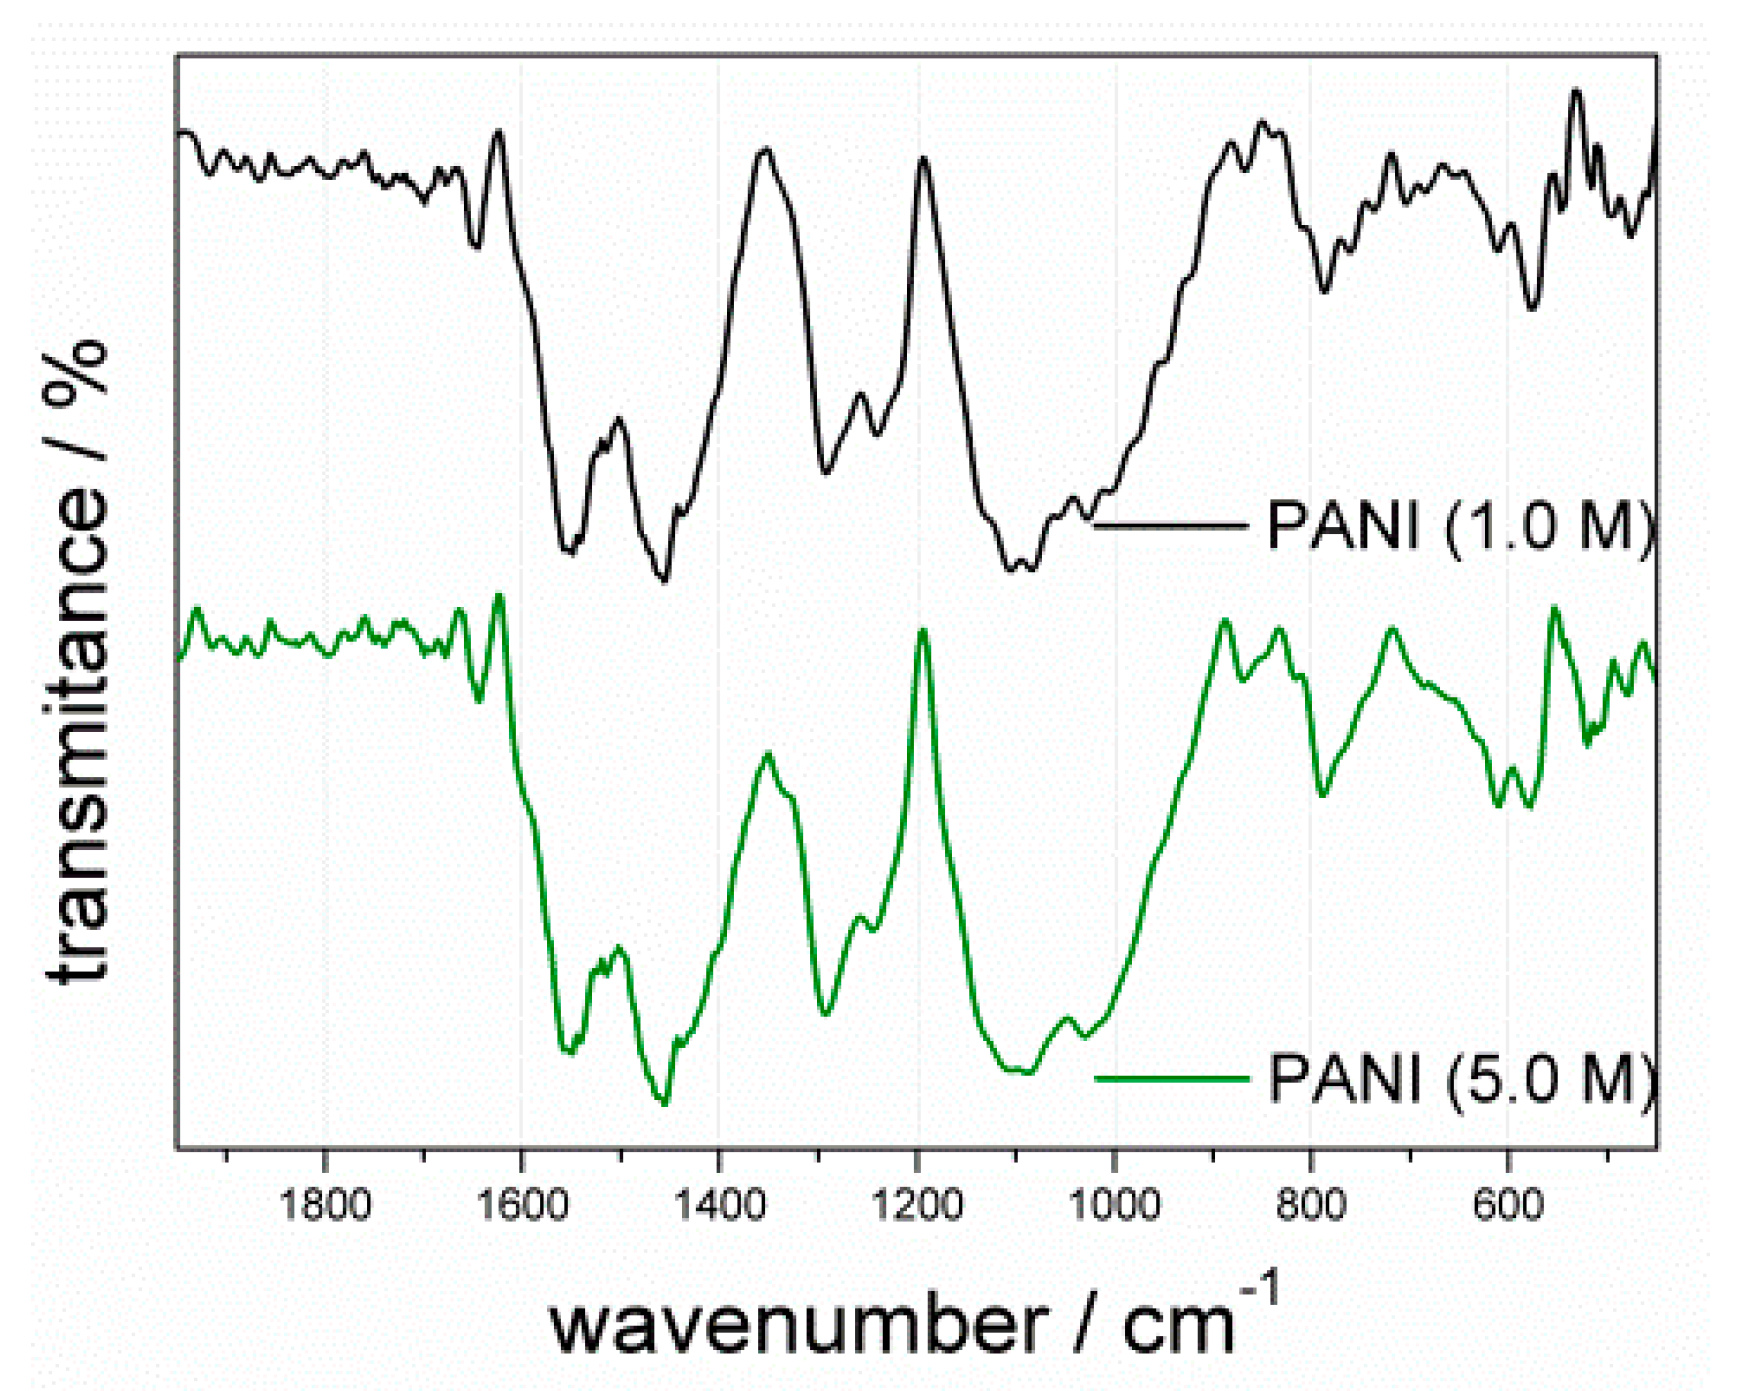
3.1.2. FTIR Analysis
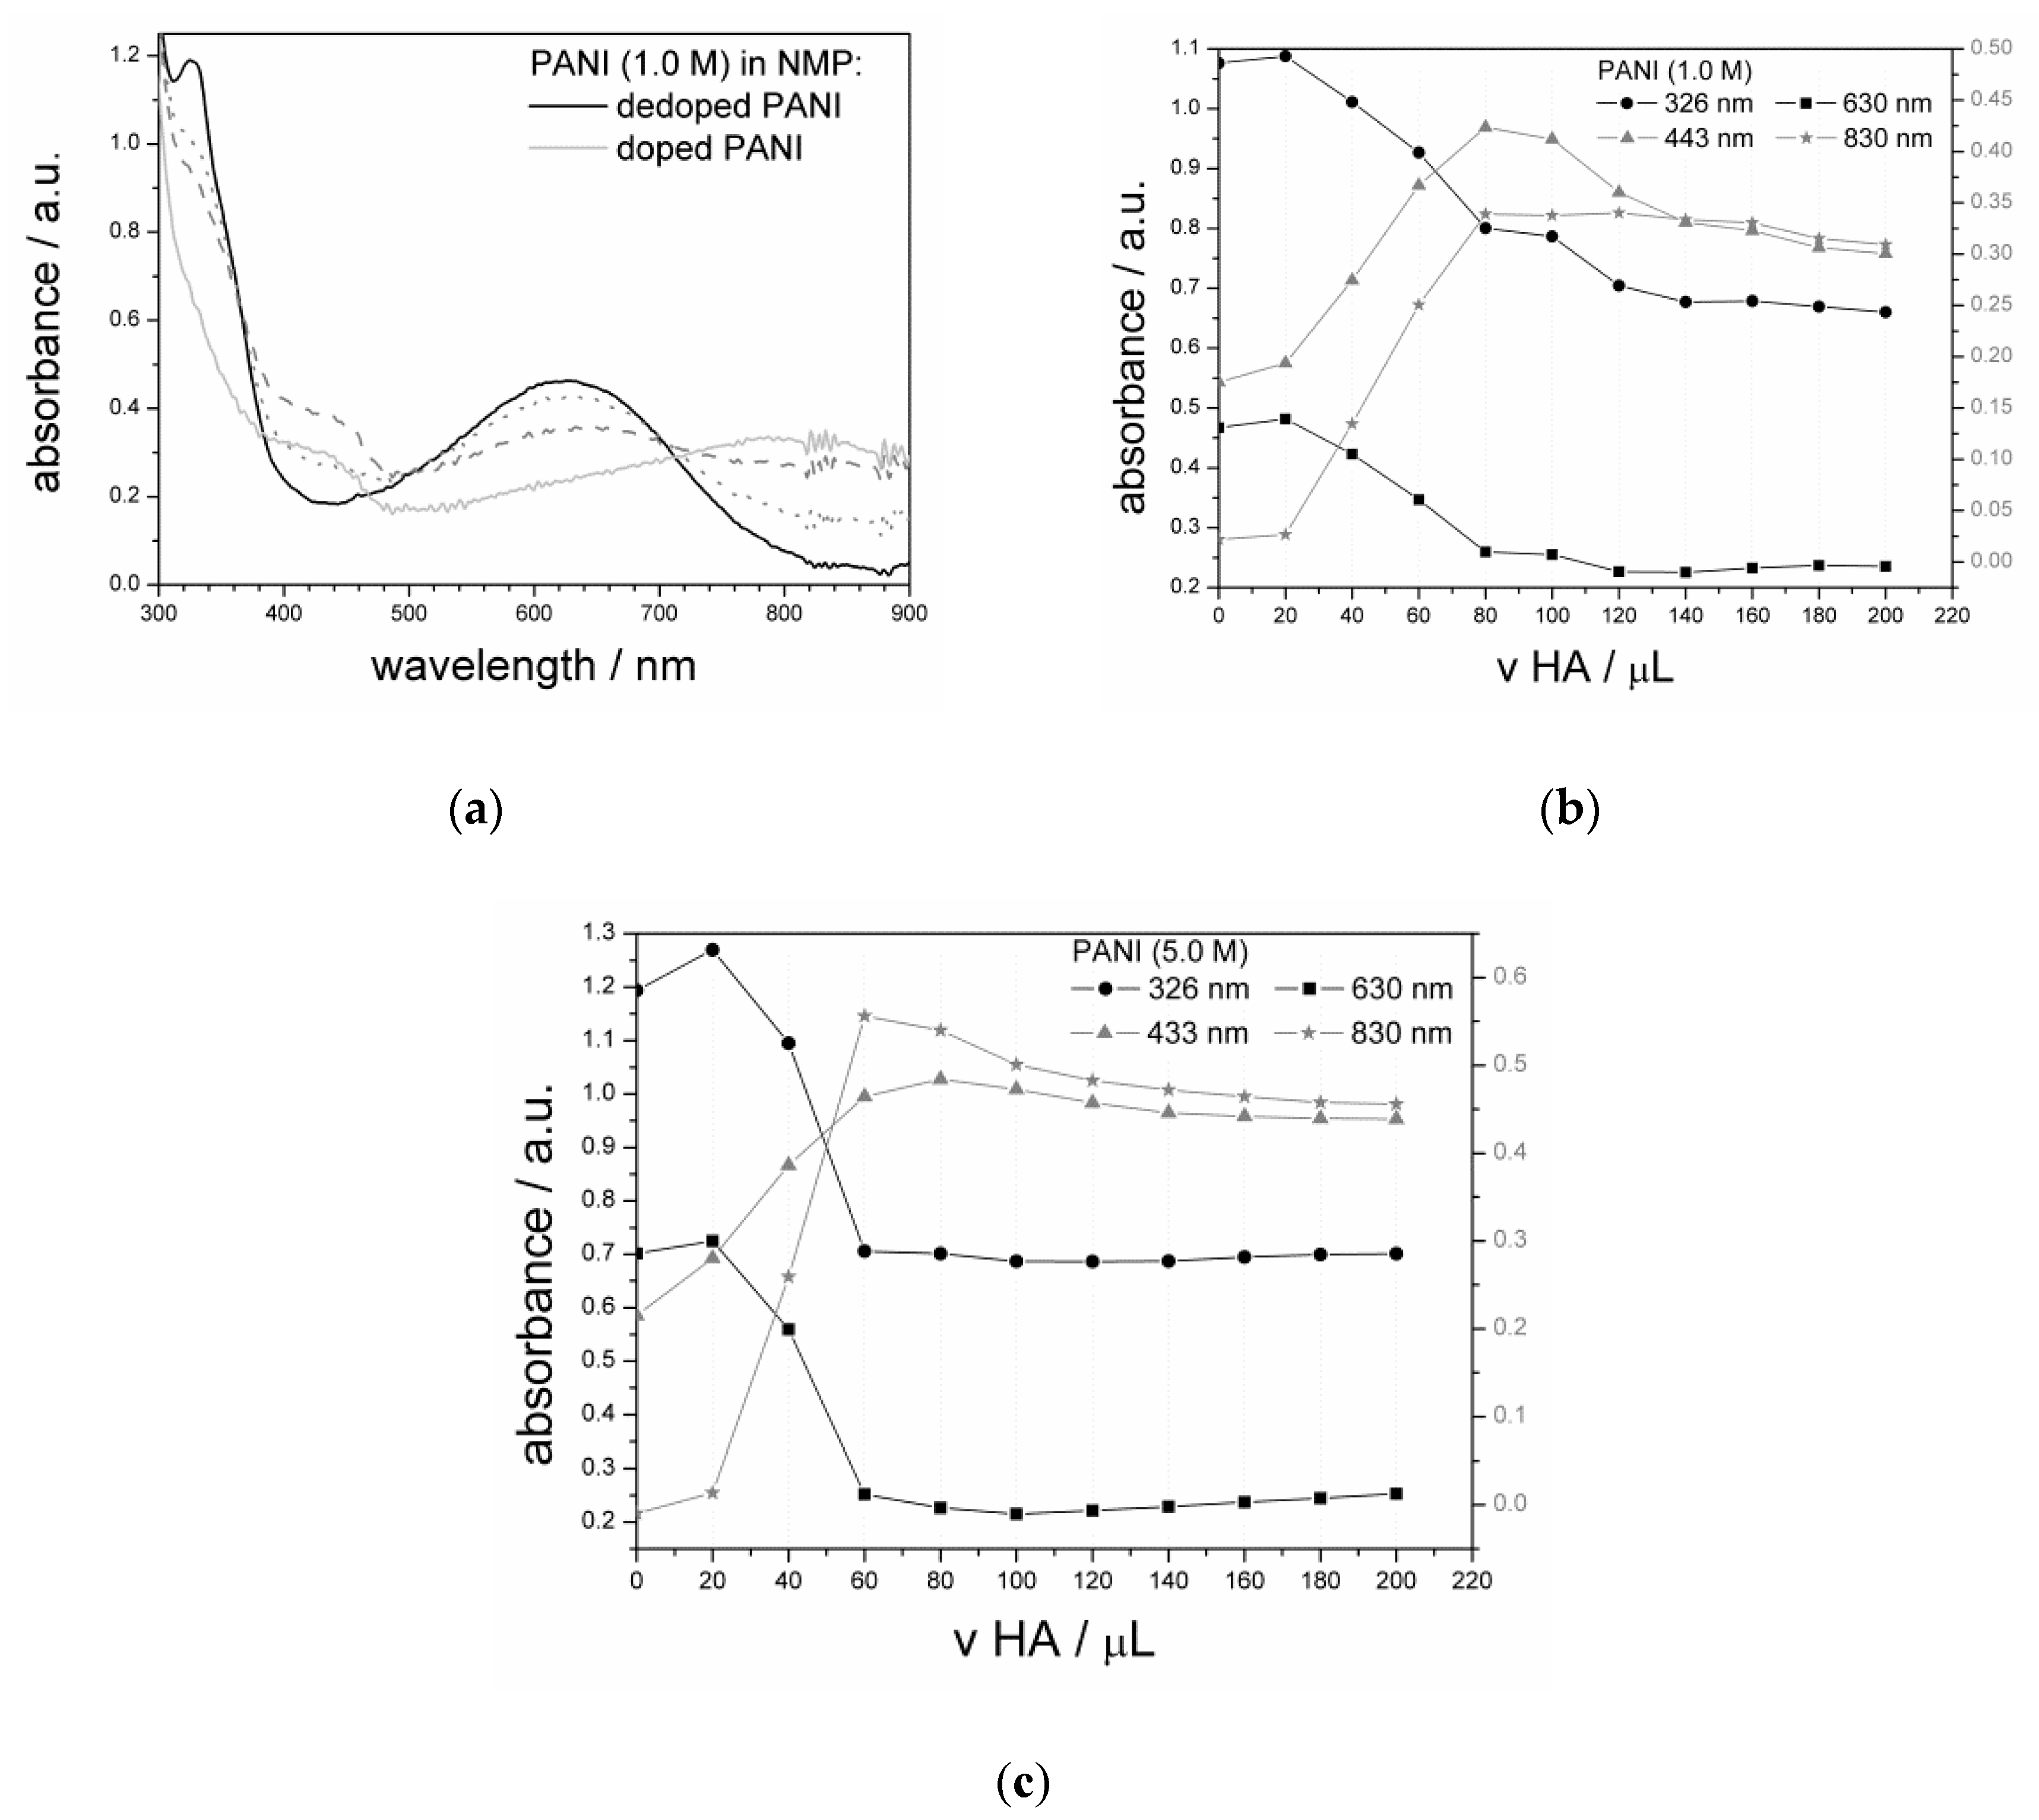
3.1.3. UV–Vis Analysis
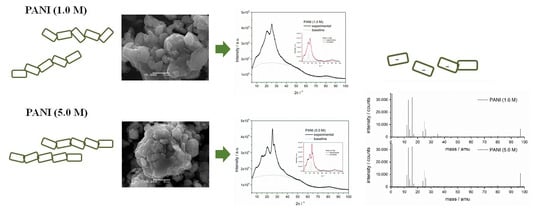
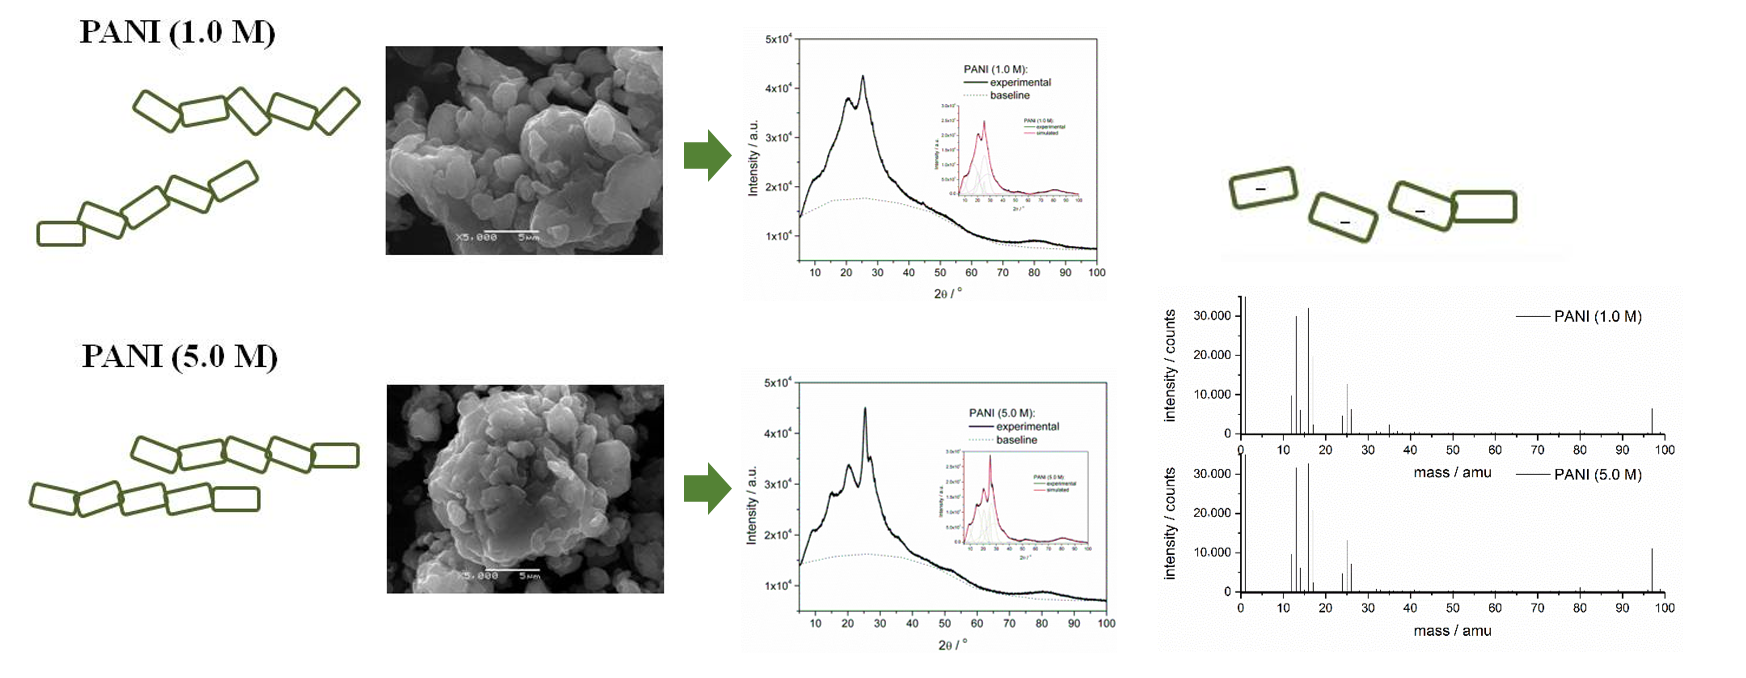
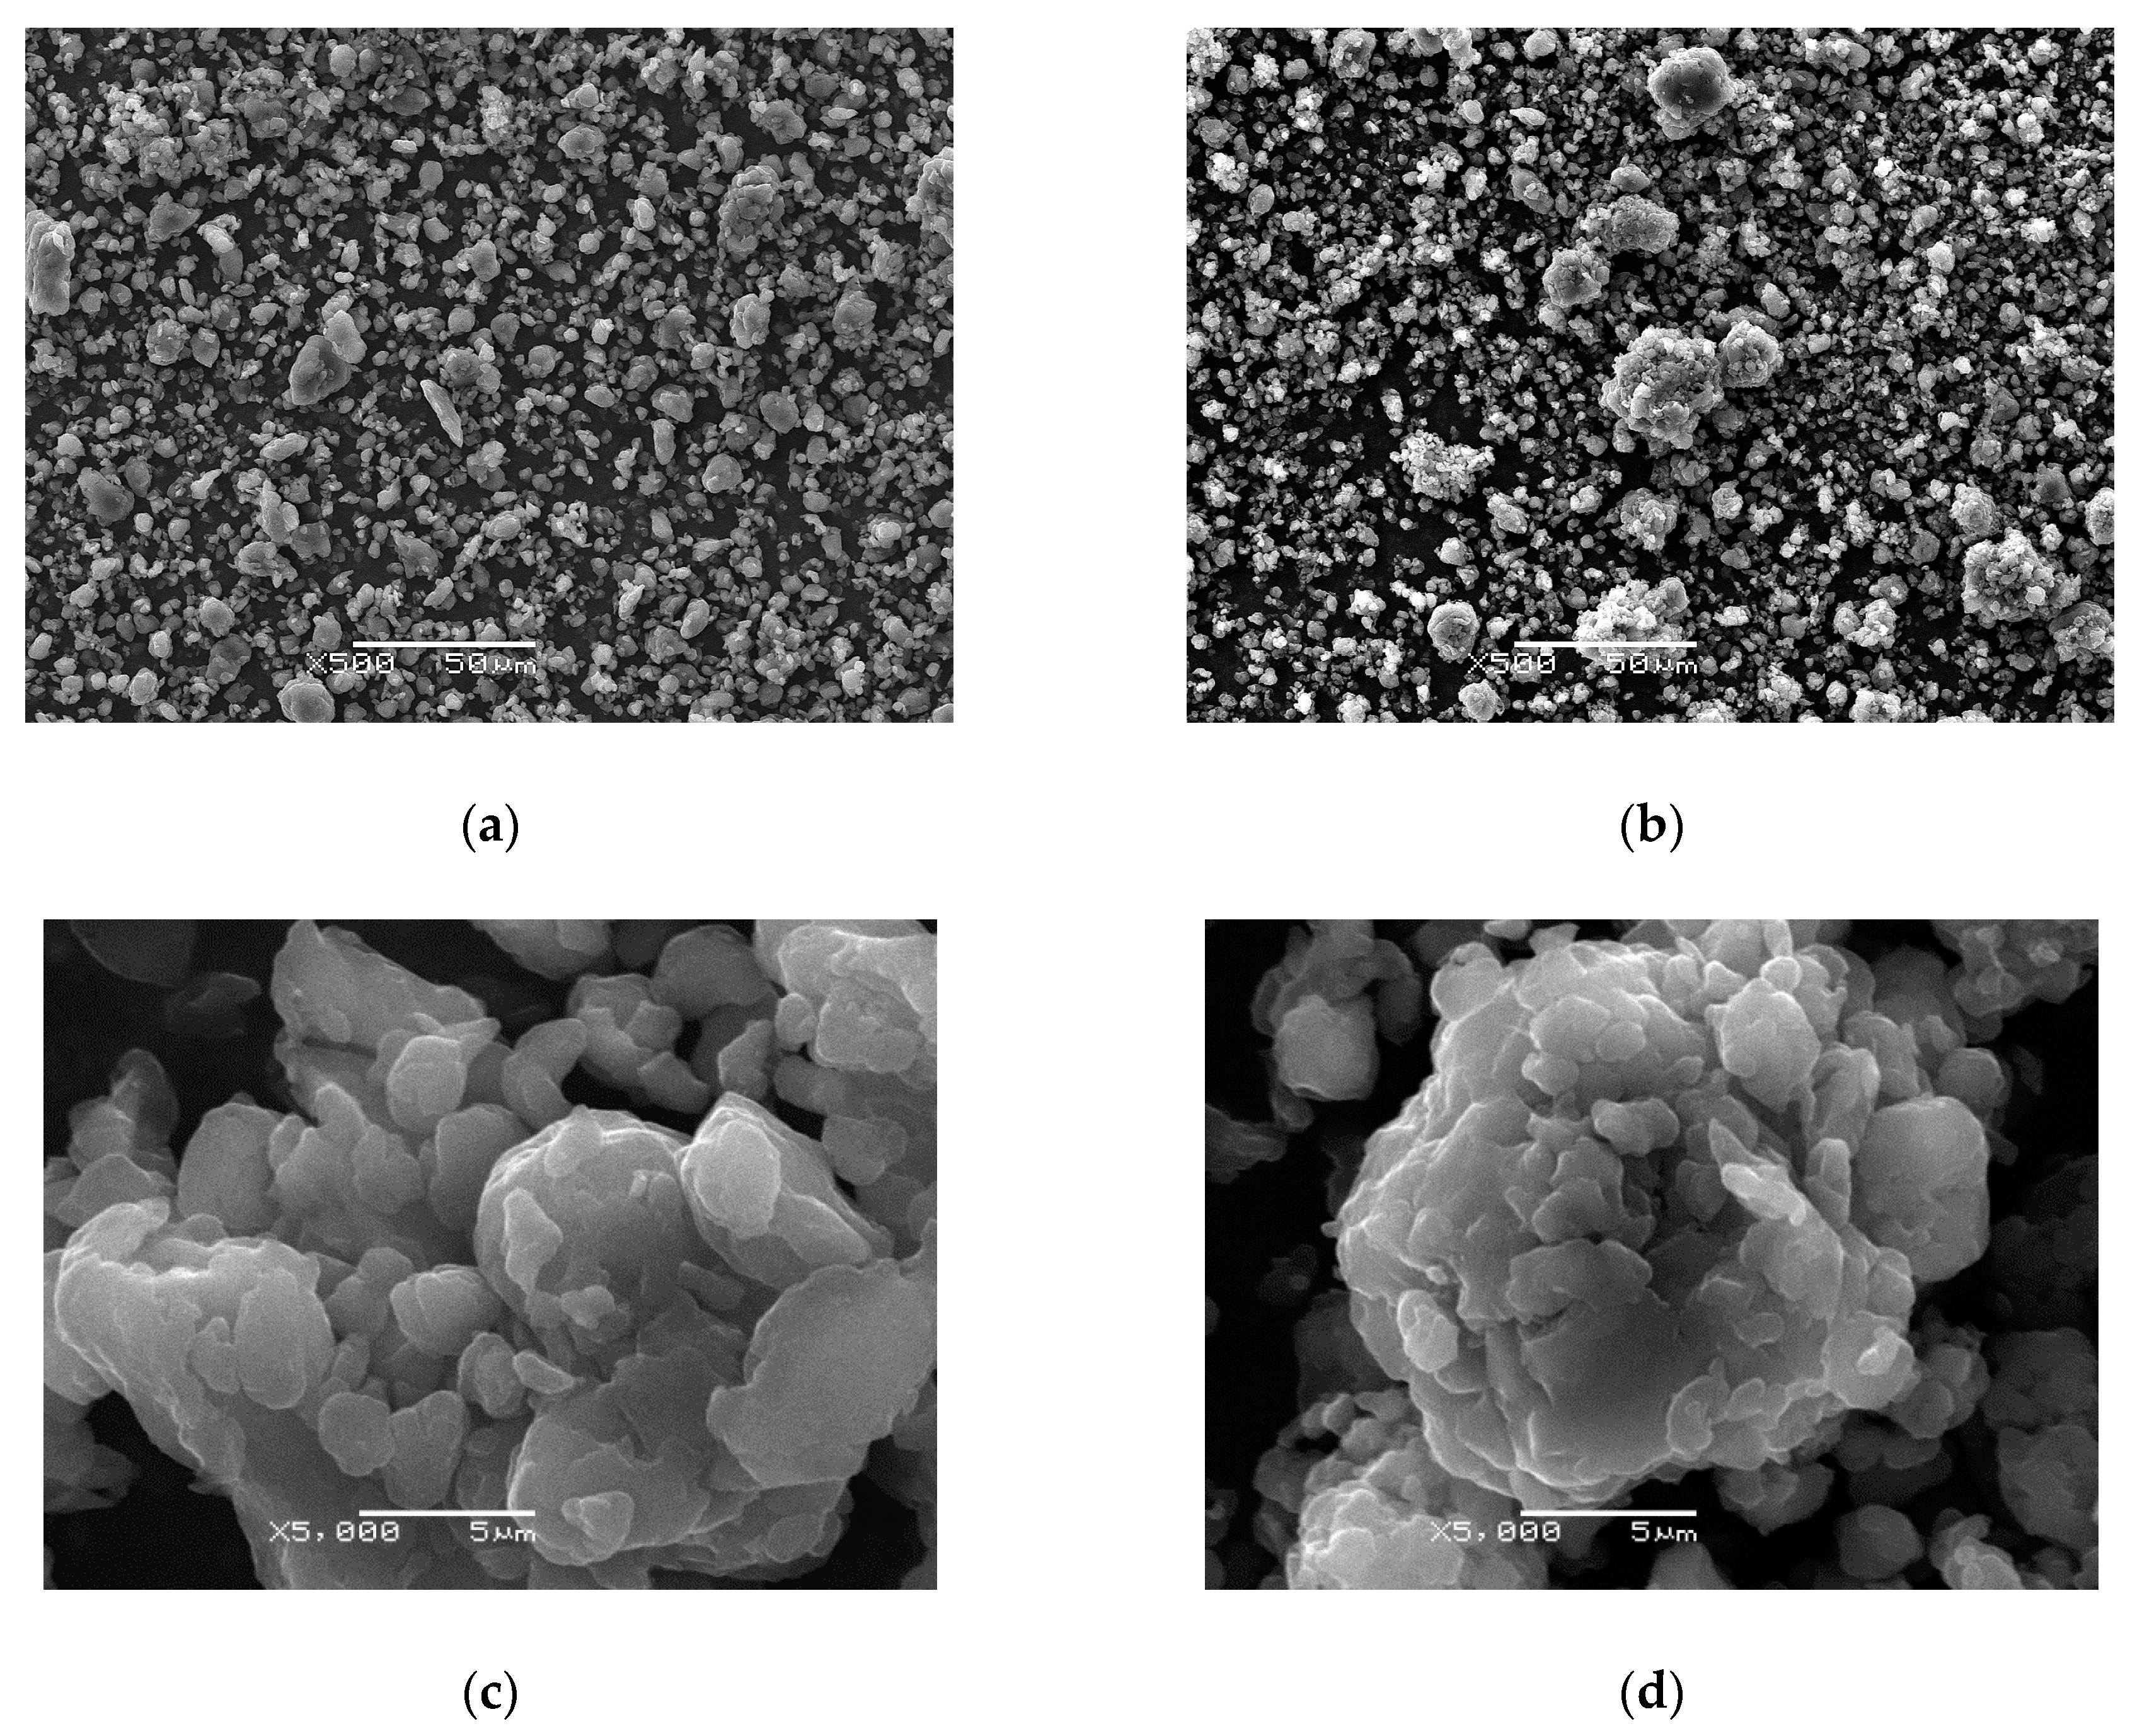
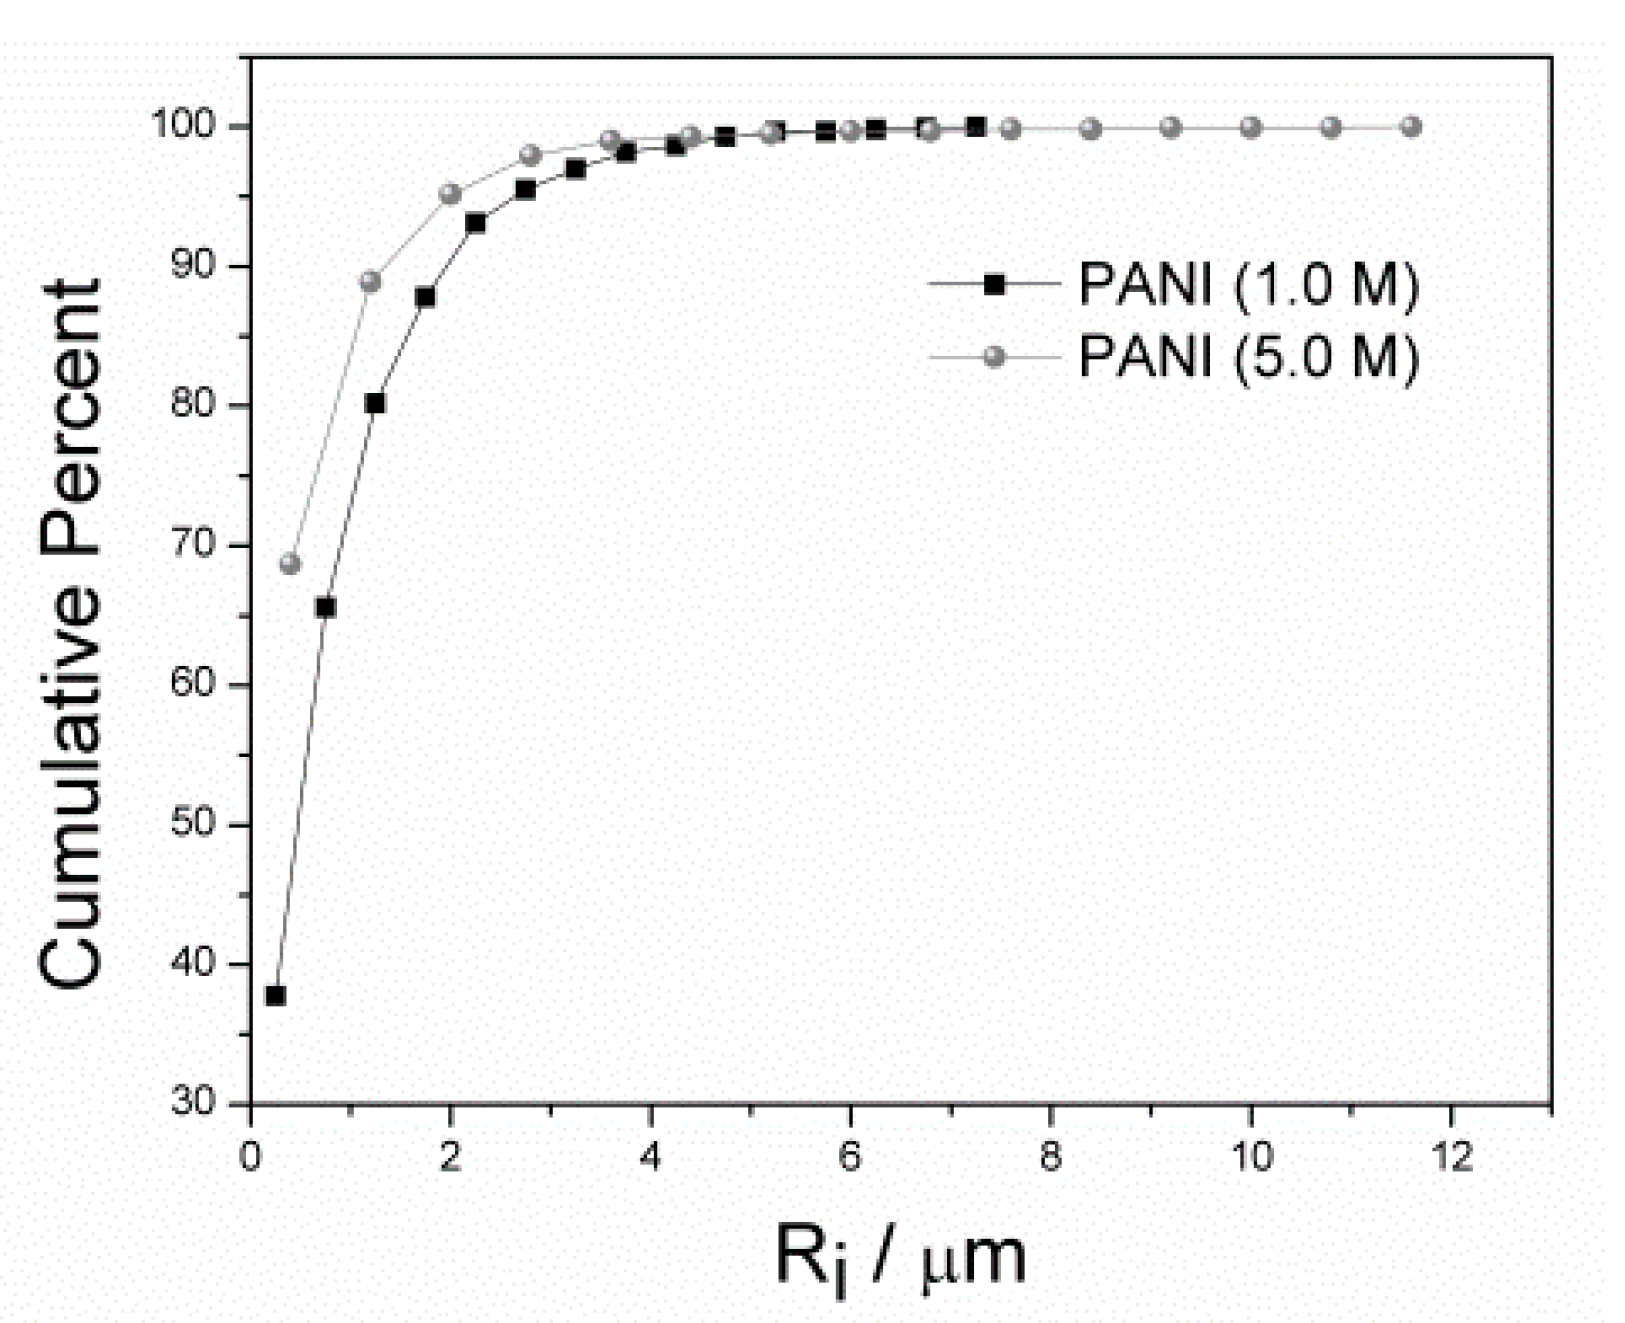
3.2. Morphology
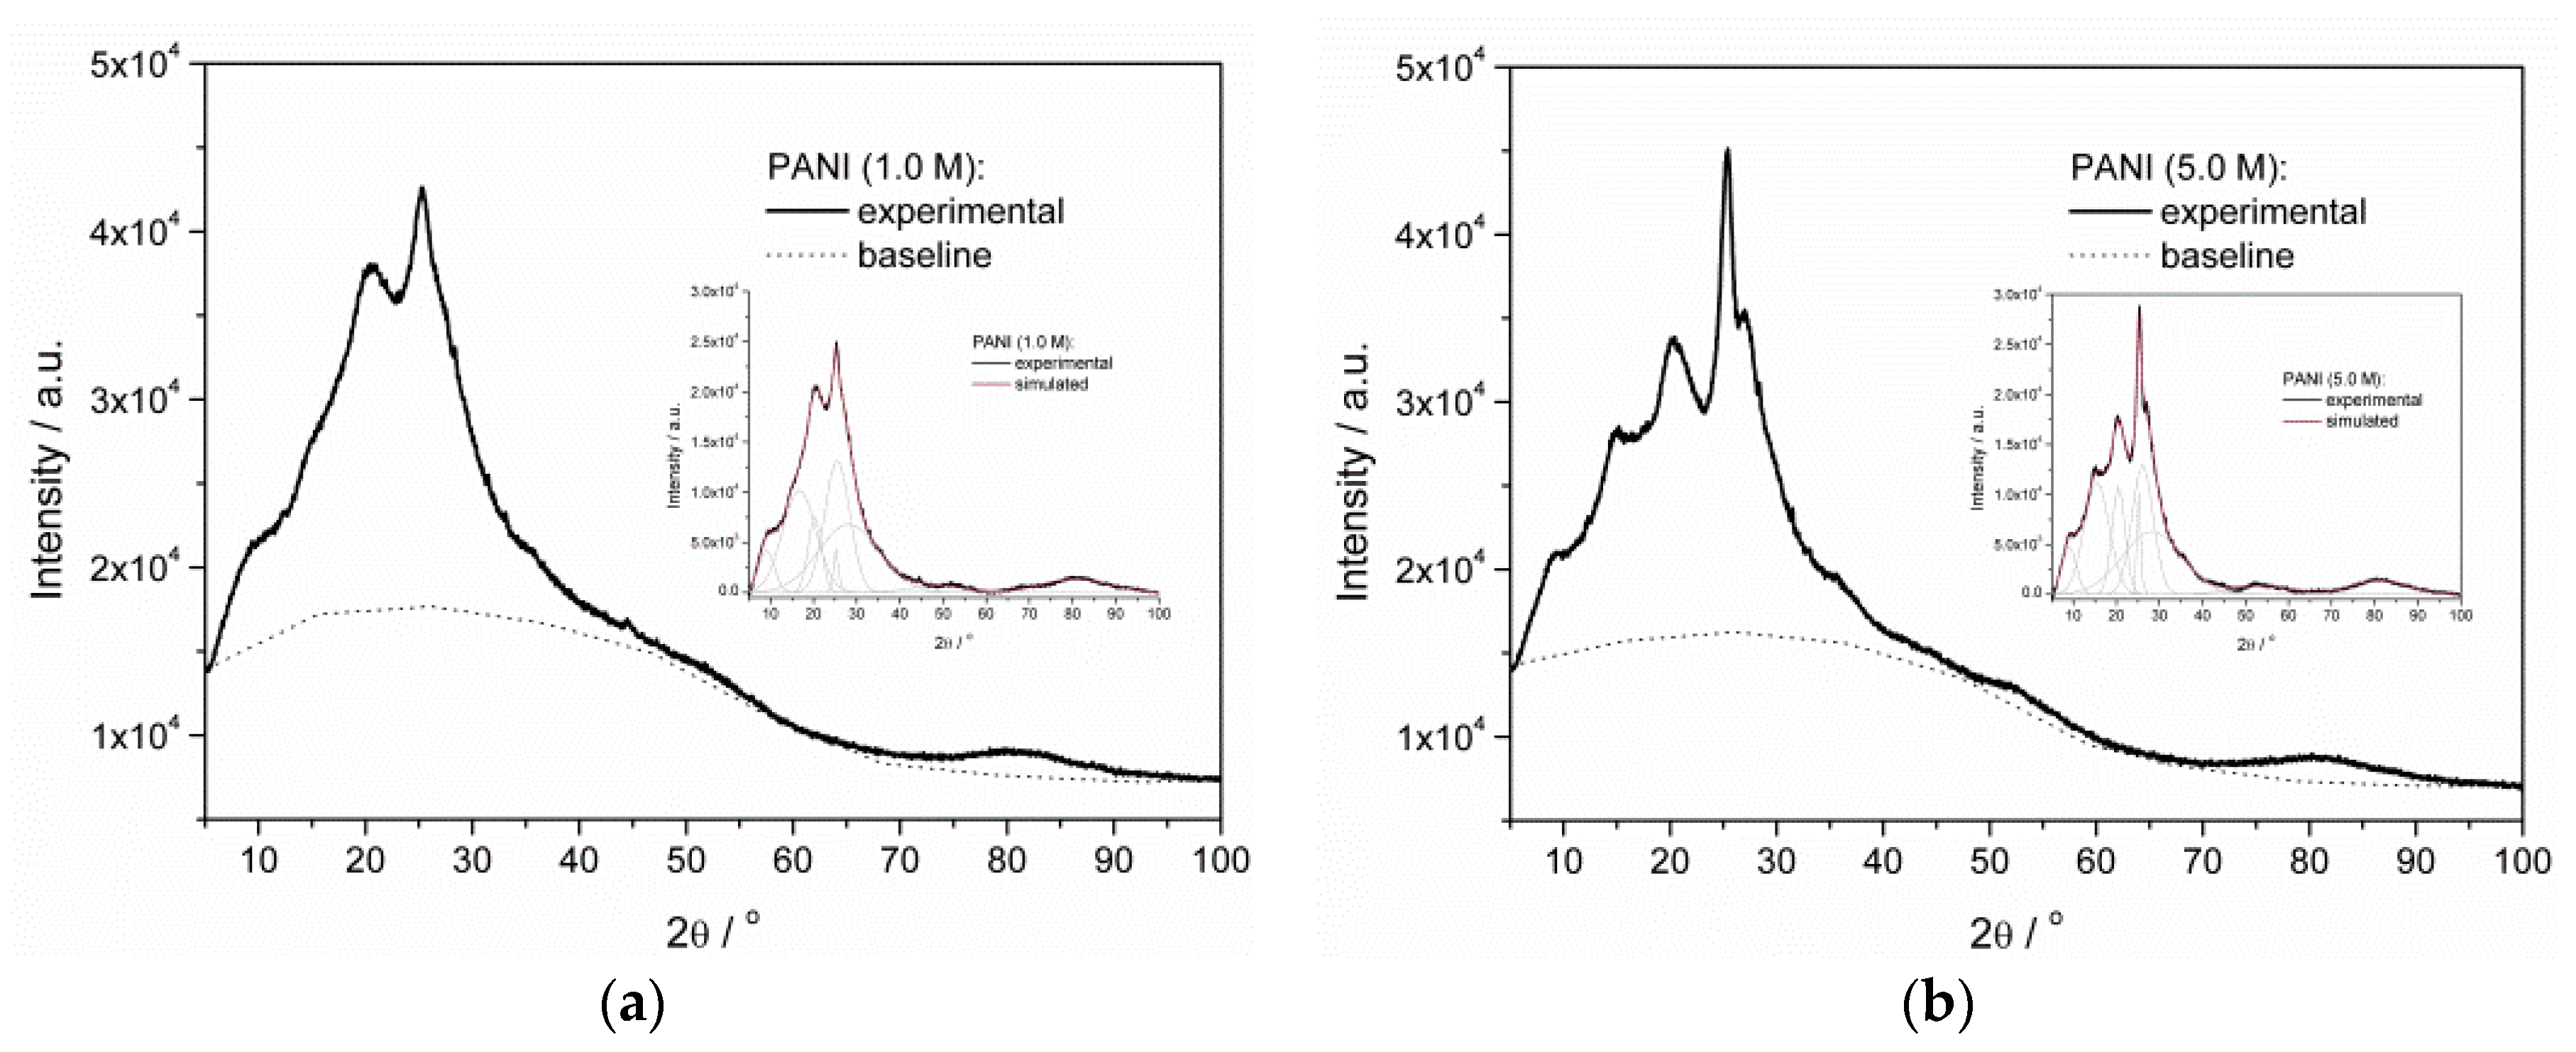
3.3. Crystallinity
3.4. Electrical Conductivity
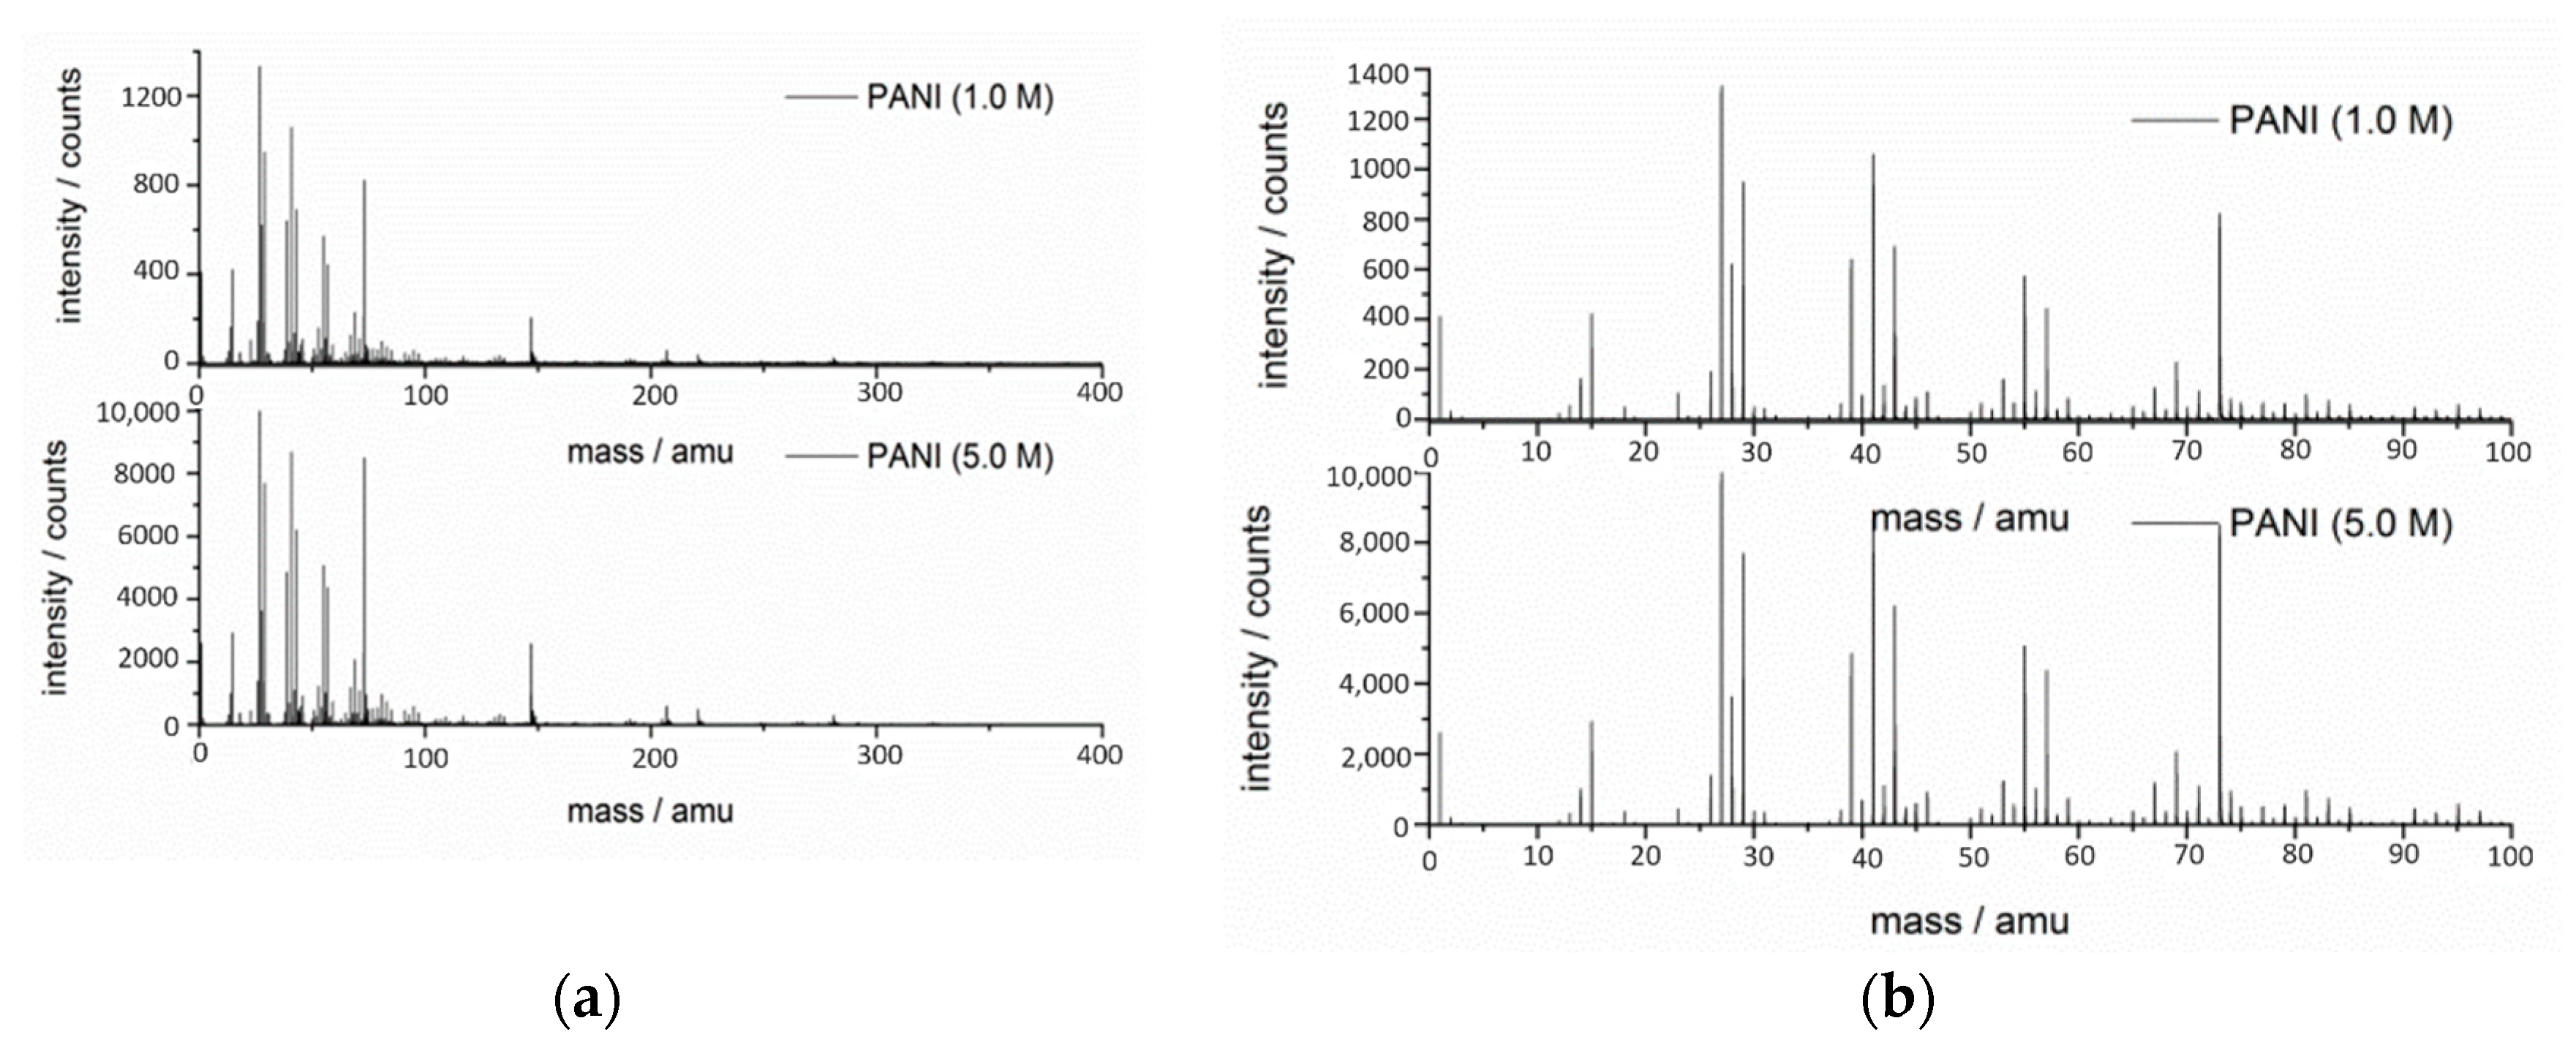
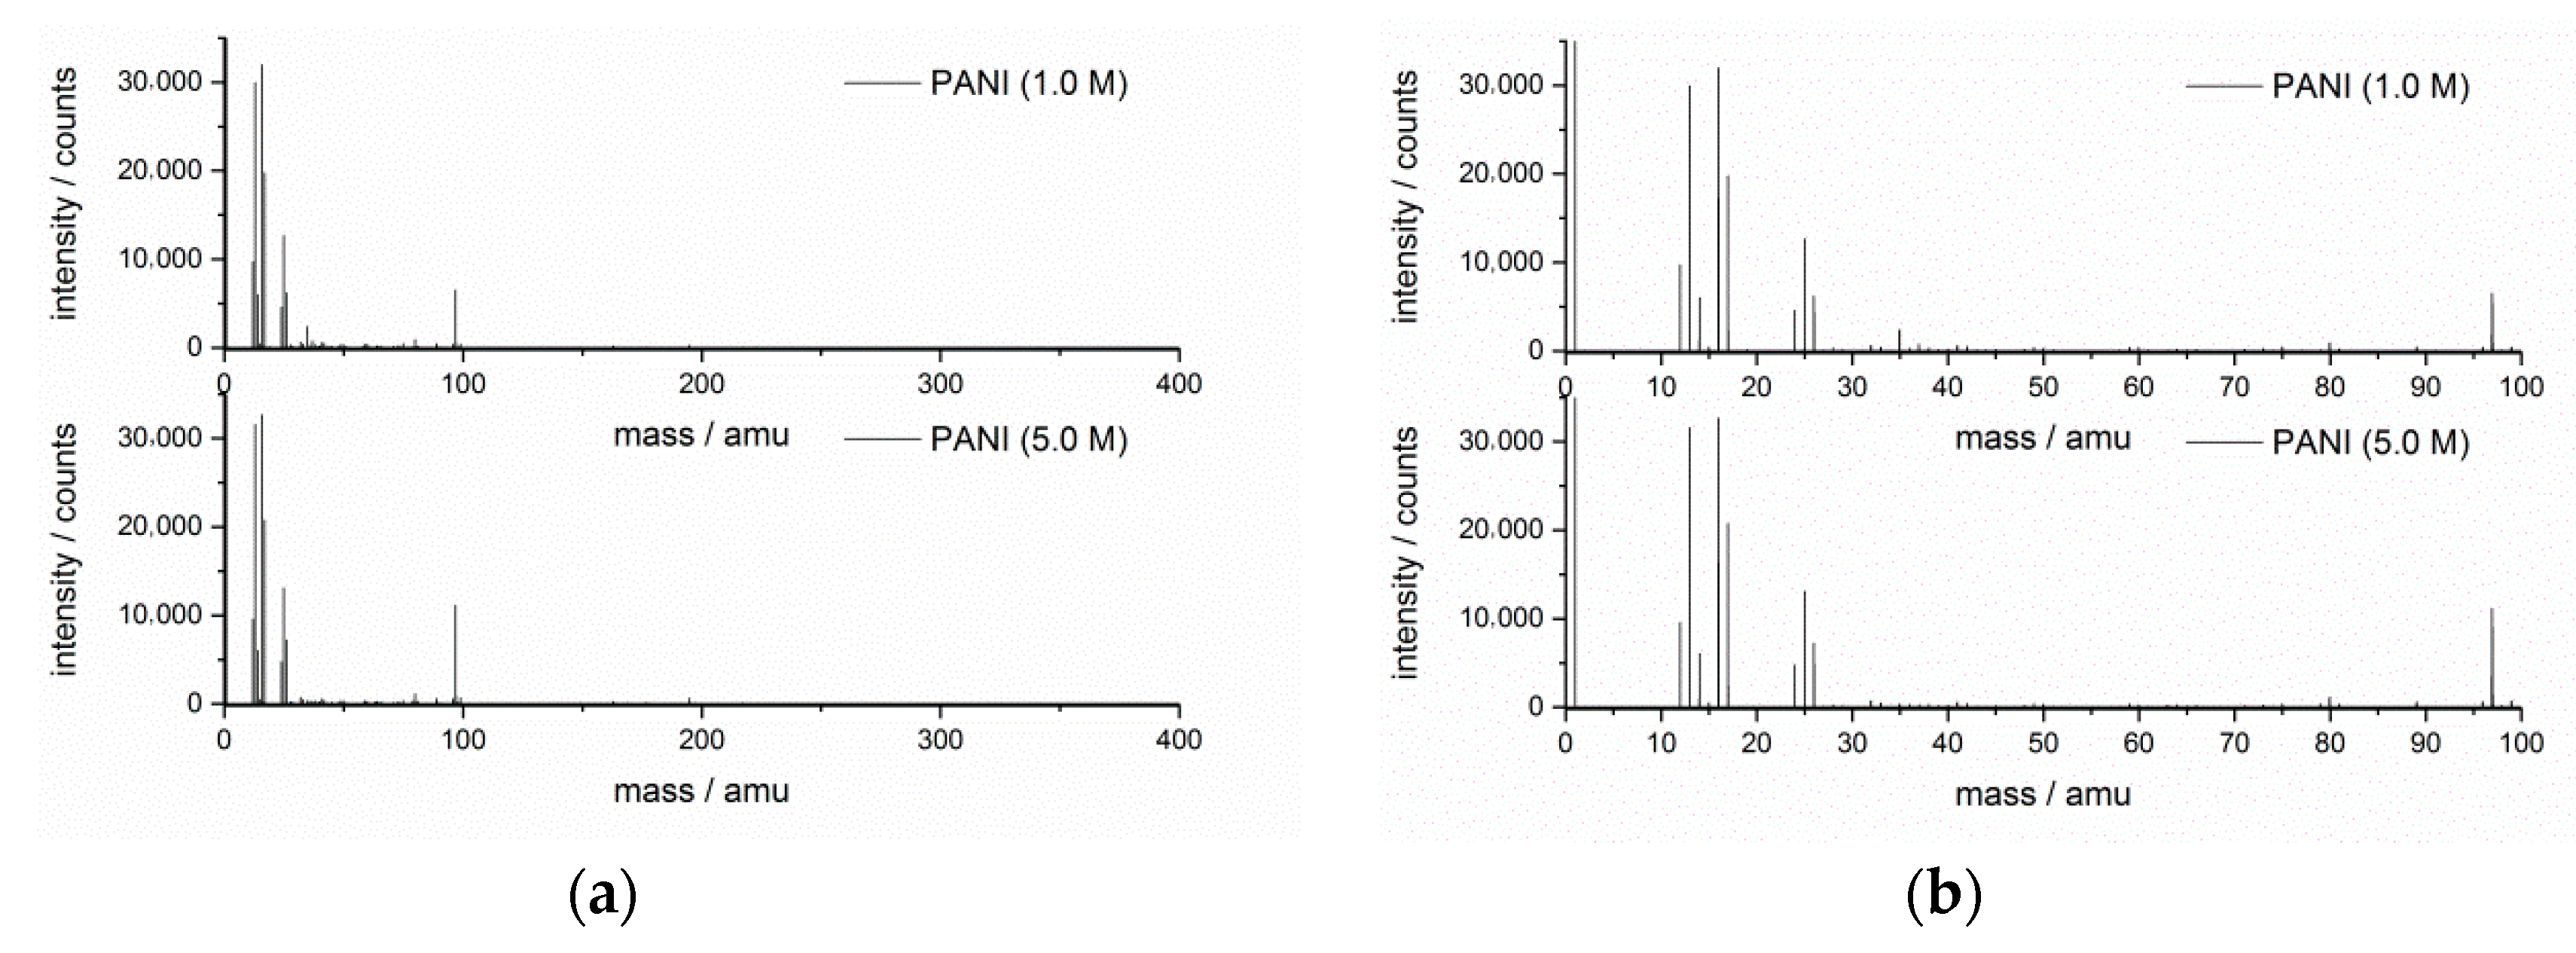
3.5. TOF-SIMS Mass Spectra of PANIs
4. Discussion
5. Conclusions
Author Contributions
Funding
Conflicts of Interest
References
- Shabani-Nooshabadi, M.; Mehdi Ghoreishi, S.; Jafari, Y.; Kashanizadeh, N. Electrodeposition of polyaniline-montmorrilonite nanocomposite coatings on 316L stainless steel for corrosion prevention. J. Polym. Res. 2014, 21, 416–425. [Google Scholar] [CrossRef]
- Kooti, M.; Kharazi, P.; Motamedi, H. Preparation and Antibacterial Activity of Three-component NiFe2O4-PANI-Ag Nanocomposite. J. Mater. Sci. Technol. 2014, 30, 656–660. [Google Scholar] [CrossRef]
- Qazi, T.; Rai, R.; Boccanccini, A. Tissue engineering of electrically responsive tissues using polyaniline based polymers: A review. Biomaterials 2014, 35, 9068–9086. [Google Scholar] [CrossRef]
- Stolarczyk, A.; Domagała, W.; Turczyn, R.; Januszkiewicz-Kaleniak, A.; Kępska, K.; Krukiewicz, K.; Gnus, M.; Łapkowski, M. The Influence of Oxygen Conditioning Effect on the Permeation Properties of Polyaniline Membranes. Sep. Sci. Technol. 2016. [Google Scholar] [CrossRef]
- Cena, C.R.; Malmonge, L.F.; Malmonge, J.A. Layer-by-layer thin films of polyaniline alternated with natural rubber and their potential application as a chemical sensor. J. Polym. Res. 2017, 24, 9–15. [Google Scholar] [CrossRef]
- Stejskal, J.; Hajná, M.; Kâspárková, V.; Humpolíček, P.; Zhigunov, A.; Trchová, M. Purification of a conducting polymer, polyaniline, for biomedical applications. Synth. Met. 2014, 195, 286–293. [Google Scholar] [CrossRef]
- Sapurina, Y.I.; Shishov, M.A. Oxidative Polymerization of Aniline: Molecular Synthesis of Polyaniline and the Formation of Supramolecular Structures. In New Polymers for Special Applications (Chapter 9); De Souza Gomes, A., Ed.; IntechOpen: London, UK, 2012; Available online: https://www.intechopen.com/books/new-polymers-for-special-applications/oxidative-polymerization-of-aniline-molecular-synthesis-of-polyaniline-and-the-formation-of-supramol (accessed on 12 November 2020).
- Ma, L.; Su, W.; Gan, M.; Li, X.; Luo, L. Effects of FeCl3/ammonium persulfate composite oxidant and magnetic field on film growth rate of polyaniline doped with dodecylbenzenesulfonic acid. J. Polym. Res. 2011, 18, 595–599. [Google Scholar] [CrossRef]
- Stejskal, J.; Hlavata, D.; Holler, P.; Trchova, M.; Proles, J.; Sapurina, I. Polyaniline prepared in the presence of various acids: A conductivity study. Polym. Int. 2004, 53, 294–300. [Google Scholar] [CrossRef]
- Jin, J.; Wang, Q.; Haque, M.A. Doping dependence of electrical and thermal conductivity of nanoscale polyaniline thin films. J. Phys. D 2010, 43, 205302–205306. [Google Scholar] [CrossRef]
- Laslau, C.; Zujovic, Z.; Travas-Sejdic, J. Theories of polyaniline nanostructure self-assembly: Towards an expanded, comprehensive Multi-Layer Theory (MLT). Prog. Polym. Sci. 2010, 35, 1403–1419. [Google Scholar] [CrossRef]
- Gao, H.; Jiang, T.; Han, B.; Wang, Y.; Du, J.; Liu, Z.; Zhang, J. Aqueous/ionic liquid interfacial polymerization for preparing polyaniline nanoparticles. Polymer 2004, 45, 3017–3019. [Google Scholar] [CrossRef]
- Chen, W.; Rakhi, R.B.; Alshareef, H.N. Facile synthesis of polyaniline nanotubes using reactive oxide templates for high energy density pseudocapacitors. J. Mater. Chem. A 2013, 1, 3315–3324. [Google Scholar] [CrossRef]
- Zhang, X.; Goux, W.J.; Manohar, S.K. Synthesis of Polyaniline Nanofibers by “Nanofiber Seeding”. J. Am. Chem. Soc. 2004, 126, 4502–4503. [Google Scholar] [CrossRef] [PubMed]
- Wang, K.; Meng, Q.; Zhang, Y.; Wei, Z.; Miao, M. High-Performance Two-Ply Yarn Supercapacitors Based on Carbon Nanotubes and Polyaniline Nanowire Arrays. Adv. Mater. 2013, 25, 1494–1498. [Google Scholar] [CrossRef]
- Zhang, Y.; Zhuang, X.; Su, Y.; Zhang, F.; Feng, X. Polyaniline nanosheet derived B/N co-doped carbon nanosheets as efficient metal-free catalysts for oxygen reduction reaction. J. Mater. Chem. 2014, 2, 7742–7746. [Google Scholar] [CrossRef]
- Petrov, P.; Mokreva, P.; Kostov, I.; Uzunova, V.; Tzoneva, R. Novel electrically conducting 2-hydroxyethylcellulose/polyanilinenanocomposite cryogels: Synthesis and application in tissue engineering. Carbohydr. Polym. 2016, 140, 349–355. [Google Scholar] [CrossRef]
- Wang, Y.; Tran, H.D.; Liao, L.; Duan, X.; Kaner, R.B. Nanoscale Morphology, Dimensional Control, and Electrical Properties of Oligoanilines. J. Am. Chem. Soc. 2010, 132, 10365–10373. [Google Scholar] [CrossRef]
- Erden, F.; Lai, S.C.; Chi, H.; Wang, F.; He, C. Tailoring the Diameters of Polyaniline Nanofibers for Sensor Application. ACS Omega 2017, 2, 6506–6513. [Google Scholar] [CrossRef]
- Sariciftci, N.S.; Kuzmany, H.; Neugebauer, H.; Neckel, A. Structural and electronic transitions in polyaniline: A Fourier transform infrared spectroscopic study. J. Chem. Phys. 1990, 92, 4530–4539. [Google Scholar] [CrossRef]
- Jangida, N.K.; Jadounb, S.; Kaura, N. A Review on high-throughput Synthesis, Deposition of Thin Films and properties of Polyaniline. Eur. Polym. J. 2020. [Google Scholar] [CrossRef]
- Adams, P.N.; Laughlin, P.J.; Monkman, A.P. Synthesis of high molecular weight polyaniline at low temperatures. Synth. Met. 1996, 76, 157–160. [Google Scholar] [CrossRef]
- Gvozdenović, M.M.; Jugović, B.Z.; Stevanović, J.S.; Trišović, T.L.; Grgur, B.N. Electrochemical Polymerization of Aniline. In Electropolymerization, 1st ed.; Schab-Balcerzak, E., Ed.; InTech: London, UK, 2011; Available online: http://www.intechopen.com/books/electropolymerization/electrochemical-polymerization-of-aniline (accessed on 12 November 2020).
- Gu, Z.J.; Zhang, Q.C.; Shen, Q. Synthesis and comparison of polyaniline nanofibers template by α-, β- and γ-cyclodextrin. J. Polym. Res. 2015, 22, 7. [Google Scholar] [CrossRef]
- Jiazing, H.; Richard, B.K. Nanofiber formation in the chemical polymerization of aniline: A mechanistic study. Angew. Chem. Int. Ed. 2004, 43, 5817–5821. [Google Scholar] [CrossRef]
- Das, M.; Akbar, A.; Sarkar, D. Investigation on dielectric properties of polyaniline (PANI) sulphonic acid (SA) composites prepared by interfacial polymerization. Synth. Met. 2019, 249, 69–80. [Google Scholar] [CrossRef]
- Amer, W.A.; Omran, M.M.; Ayad, M.M. Acid-free synthesis of polyaniline nanotubes for dual removal of organic dyes from aqueous solutions. Colloids Surf. A Physicochem. Eng. Asp. 2018, 562, 203–212. [Google Scholar] [CrossRef]
- Šeděnková, I.; Trchová, M.; Stejskal, J.; Bok, J. Polymerization of Aniline in the Solutions of Strong and Weak Acids: The Evolution of Infrared Spectra and Their Interpretation Using Factor Analysis. Appl. Spectrosc. 2007, 61, 1153–1162. [Google Scholar] [CrossRef]
- Wessling, B. Conductive Polymer/Solvent Systems: Solutions or Dispersions? In Handbook of Nanostructured Materials and Nanotechnology, Organics, Polymers and Biological Materials; Nalwa, H.S., Ed.; Academic Press: Cambridge, MA, USA, 1999; Volume 5, ISBN 9780080533643. [Google Scholar]
- Nečas, D.; Klapetek, P. Gwyddion: An open-source software for SPM data analysis. Cent. Eur. J. Phys. 2012, 10, 181–188. [Google Scholar] [CrossRef]
- Chen, W.Y.; Chen, C.Y.; Hsu, K.Y.; Wang, C.C.; Ling, Y.C. Reaction Monitoring of Polyaniline Film Formation on Carbon Nanotubes with TOF-SIMS. Appl. Surf. Sci. 2004, 231–232, 845–849. [Google Scholar] [CrossRef]
- Elmas, S.; Beelders, W.; Nash, J.; Macdonald, T.J.; Jasieniak, M.; Griesser, H.J.; Nann, T. Photo-Doping of Plasma-Deposited Polyaniline (PAni). RSC Adv. 2016, 74, 70691–70699. [Google Scholar] [CrossRef]
- Park, C.S.; Jung, E.Y.; Kim, D.H.; Cho, B.G.; Shin, B.J.; Tae, H.S. TOF-SIMS Study on Nano Size Conducting Polymer Prepared by Simple Atmospheric Pressure Plasma Polymerization Technique for Display Applications. Mol. Cryst. Liq. Cryst. 2017, 651, 16–25. [Google Scholar] [CrossRef]
- Park, C.S.; Jung, E.Y.; Kim, D.H.; Kim, D.Y.; Lee, H.K.; Shin, B.J.; Lee, D.H.; Tae, H.S. Atmospheric Pressure Plasma Polymerization Synthesis and Characterization of Polyaniline Films Doped with and without Iodine. Materials 2017, 10, 1272. [Google Scholar] [CrossRef] [PubMed]
- Trchová, M.; Stejskal, J. Polyaniline: The infrared spectroscopy of conducting polymer nanotubes (IUPAC Technical Report). Pure Appl. Chem. 2011, 83, 1803–1817. [Google Scholar] [CrossRef]
- Ciric-Marjanovic, G.; Dragicevic, L.; Milojevic, M.; Mojovic, M.; Mentus, S.; Dojcinovic, B.; Marjanovic, B.; Stejskal, J. Synthesis and Characterization of Self-Assembled Polyaniline Nanotubes/Silica Nanocomposites. J. Phys. Chem. B 2009, 113, 7116–7127. [Google Scholar] [CrossRef] [PubMed]
- Ciric-Marjanovic, G.; Dondur, V.; Milojevic, M.; Mojovic, M.; Mentus, S.; Radulovic, A.; Vukovic, Z.; Stejskal, J. Synthesis and Characterization of Conducting Self-Assembled Polyaniline Nanotubes/Zeolite Nanocomposite. Langmuir 2009, 25, 3122–3131. [Google Scholar] [CrossRef] [PubMed]
- Ping, Z. In situ FTIR—Attenuated total reflection spectroscopic investigations on the base-acid transitions of polyaniline. Base-acid transition in the emeraldine form of polyaniline. J Chem. Soc. Faraday Trans. 1996, 92, 3063–3067. [Google Scholar] [CrossRef]
- Trivedi, D.C. Polyanilines. In Handbook of Organic Conductive Molecules and Polymers; Nalwa, H.S., Ed.; Wiley: Chichester, UK, 1997; Volume 2, pp. 505–572. [Google Scholar]
- Do Nascimento, G.M.; Silva, C.H.B.; Temperini, S.L.A. Electronic Structure and Doping Behavior of PANI-NSA Nanofibers Investigated by Resonance Raman Spectroscopy. Macromol. Rapid Commun. 2006, 27, 255–259. [Google Scholar] [CrossRef]
- Stejskal, J.; Sapurina, I.; Trchová, M.; Konyushenko, E.N.; Holler, P. The genesis of polyaniline nanotubes. Polymer 2006, 47, 8253–8262. [Google Scholar] [CrossRef]
- Ayad, M.M.; Zaki, E.A.; Stejskal, J. Determination of the dopant weight fraction in polyaniline films using a quartz-crystal microbalance. Thin Solid Films 2007, 515, 8381–8385. [Google Scholar] [CrossRef]
- Feng, X.; Yang, G.; Xu, Q.; Hou, W.; Zhu, J.-J. Self-Assembly of Polyaniline/Au Composites: From Nanotubes to Nanofibers. Macromol. Rapid Commun. 2006, 27, 31–36. [Google Scholar] [CrossRef]
- Gottam, R.; Srinivasan, P. A novel process of alcohol promoted polymerization of aniline to form a nanofibrous, fluorescent and highly crystalline polyaniline salt. New J. Chem. 2015, 39, 8545–8551. [Google Scholar] [CrossRef]
- Bhadra, J.; Madi, N.K.; Al-Thani, N.J.; Al-Maadeed, M.A. Polyaniline/polyvinyl alcohol blends: Effect of sulfonic acid dopants on microstructural, optical, thermal and electrical properties. Synth. Met. 2014, 191, 126–134. [Google Scholar] [CrossRef]
- Aleahmad, M.; Ghafouri Taleghani, H.; Eisazadeh, H. Effect of Synthesis Conditions on the Morphology of Polyaniline. Asian J. Chem. 2010, 22, 7353–7360. [Google Scholar]
- Rahy, A.; Yang, D.J. Synthesis of highly conductive polyaniline nanofibers. Mater. Lett. 2008, 62, 4311–4314. [Google Scholar] [CrossRef]
- Butoi, B.; Groza, A.; Dinca, P.; Balan, A.; Barna, V. Morphological and Structural Analysis of Polyaniline and Poly(o-anisidine) Layers Generated in a DC Glow Discharge Plasma by Using an Oblique Angle Electrode Deposition Configuration. Polymers 2017, 9, 732. [Google Scholar] [CrossRef] [PubMed]
- Pouget, J.P.; Jozefowicz, M.E.; Epstein, A.J.; Tang, X.; MacDiarmid, A.G. X-ray Structure of Polyaniline. Macromolecules 1991, 24, 779–789. [Google Scholar] [CrossRef]
- Vivekanandan, J.; Ponnusamy, V.; Mahudeswaran, A.; Vijayanand, P.S. Synthesis, characterization and conductivity study of polyaniline prepared by chemical oxidative and electrochemical methods. Arch. Appl. Sci. Res. 2011, 3, 147–153. [Google Scholar]
- Raghavendra, S.C.; Khasim, S.; Revanasiddappa, M.; Ambika Prasad, M.V.N.; Kulkarni, A.B. Synthesis, characterization and low frequency a.c. conduction of polyaniline/fly ash composites. Bull. Mater. Sci. 2003, 26, 733–739. [Google Scholar] [CrossRef]
- Sanches, E.A.; Alves, S.F.; Soares, J.C.; da Silva, A.M.; da Silva, C.G.; de Souza, S.M.; da Frota, H.O. Nanostructured Polypyrrole Powder: A Structural and Morphological Characterization. J. Nanomater. 2015, 129678. [Google Scholar] [CrossRef]
- Abdolahi, A.; Hamzah, E.; Ibrahim, Z.; Hashim, S. Synthesis of Uniform Polyaniline Nanofibers through Interfacial Polymerization. Materials 2012, 5, 1487–1494. [Google Scholar] [CrossRef]
- Bhadra, S.; Khastgir, D.; Singha, N.K.; Hee Leeb, J. Progress in preparation, processing and applications of polyaniline. Prog. Polym. Sci. 2009, 34, 783–810. [Google Scholar] [CrossRef]
- Stejskal, J.; Sapurina, I.; Trchova, M. Polyaniline nanostructures and the role of aniline oligomers in their formation. Prog. Polym. Sci. 2010, 35, 1420–1481. [Google Scholar] [CrossRef]
- Bawn, C.E.H.; Margerison, D. Molecular dissociation processes in solution. Part 4—The rate of decomposition of persulphate ion and its catalysis by metal ions. Trans. Faraday Soc. 1955, 51, 925–934. [Google Scholar] [CrossRef]
- Mostafaei, A.; Nasirpouri, F. Epoxy/polyaniline–ZnO nanorods hybrid nanocomposite coatings: Synthesis, characterization and corrosion protection performance of conducting paints. Prog. Org. Coat. 2014, 77, 146–159. [Google Scholar] [CrossRef]
- Du, X.; Xu, Y.; Xiong, L.; Bai, Y.; Zhu, J.; Mao, S. Polyaniline with high crystallinity degree: Synthesis, structure, and electrochemical properties. J. Appl. Polym. Sci. 2014, 131, 40827–40837. [Google Scholar] [CrossRef]
- Park, H.-W.; Kim, T.; Huh, J.; Kang, M.; Lee, J.E.; Yoon, H. Anisotropic Growth Control of Polyaniline Nanostructures and Their Morphology-Dependent Electrochemical Characteristics. ACS Nano 2012, 6, 7624–7633. [Google Scholar] [CrossRef] [PubMed]
- Liu, C.; Hayashi, K.; Toko, K. Template-Free Deposition of Polyaniline Nanostructures on Solid Substrates with Horizontal Orientation. Macromolecules 2011, 44, 2212–2219. [Google Scholar] [CrossRef]
- Dhivya, C.; Anbu Anjugam Vandarkuzhali, S.; Radha, N. Antimicrobial activities of nanostructured polyanilines doped with aromatic nitro compounds. Arab. J. Chem. 2019, 12, 3785–3798. [Google Scholar] [CrossRef]
- Hazarika, J.; Kumar, A. Structural and optical properties of self-assembled polypyrrole nanotubes. J. Polym. Res. 2016, 23, 95–102. [Google Scholar] [CrossRef]
- Hazarika, J.; Kumar, A. Controllable synthesis and characterization of polypyrrole nanoparticles in sodium dodecylsulphate (SDS) micellar solutions. Synth. Met. 2013, 175, 155–162. [Google Scholar] [CrossRef]
- Stejskal, J.; Sapurina, I.; Prokes, J.; Zemek, J. In-situ polymerized polyaniline films. Synth. Met. 1999, 105, 195–202. [Google Scholar] [CrossRef]
- Ćirić-Marjanović, G. Recent advances in polyaniline research: Polymerization mechanisms, structural aspects, properties and applications, Review. Synth. Met. 2013, 177, 1–47. [Google Scholar] [CrossRef]


| PANI | Elements | |||
|---|---|---|---|---|
| C | N | O | S | |
| at.% | at.% | at.% | at.% | |
| 1.0 M | 66.3 | 20.0 | 7.2 | 6.4 |
| 5.0 M | 62.7 | 23.6 | 9.5 | 4.2 |
| Sample | 2θ (°) | HW 1 (°) | H 2 Intensity | HW/H Ratio |
|---|---|---|---|---|
| PANI (1.0 M) | 9.136 | 4.216 | 4258.17 | 9.90 × 10⁻⁴ |
| 16.725 | 9.057 | 10,222.62 | 8.86 × 10⁻⁴ | |
| 20.328 | 3.607 | 7563.24 | 4.77 × 10⁻⁴ | |
| 25.244 | 1.341 | 4374.34 | 3.07 × 10⁻⁴ | |
| 25.514 | 6.738 | 13,225.05 | 5.09 × 10⁻⁴ | |
| 28.127 | 16.458 | 6789.06 | 2.42 × 10⁻³ | |
| PANI (5.0 M) | 9.034 | 3.831 | 4787.73 | 8.00 × 10⁻⁴ |
| 15.424 | 6.827 | 11,261.78 | 6.06 × 10⁻⁴ | |
| 20.491 | 3.553 | 10,899.39 | 3.26 × 10⁻⁴ | |
| 25.273 | 0.974 | 10,620.53 | 9.17 × 10⁻⁵ | |
| 26.088 | 5.783 | 12,943.19 | 4.47 × 10⁻⁴ | |
| 28.269 | 16.317 | 6260.73 | 2.61 × 10⁻³ |
| Positive Ion Mass Spectrum, m/z | Probable Ion Fragment | Positive Ion Mass Spectrum, m/z | Probable Fragment | Negative Ion Mass Spectrum, m/z | Probable Ion Fragment |
|---|---|---|---|---|---|
| 15.0227 | CH3+ | 57.0782 | C4H9+ | 26.0048 | CN− |
| 27.0228 | C2H3+ | 67.0584 | C5H7+ | 41.9994 | CNO− |
| 29.0412 | C2H5+ | 69.0781 | C5H9+ | 50.0068 | C3N− |
| 39.0214 | C3H3+ | 73.0583 | C3H7NO+ | ||
| 41.0404 | C3H5+ | 81.0774 | C6H9+ | ||
| 43.0587 | C3H7+ | 83.0952 | C6H11+ | ||
| 55.0588 | C4H7+ | 95.0957 | C7H11+ |
Publisher’s Note: MDPI stays neutral with regard to jurisdictional claims in published maps and institutional affiliations. |
© 2020 by the authors. Licensee MDPI, Basel, Switzerland. This article is an open access article distributed under the terms and conditions of the Creative Commons Attribution (CC BY) license (http://creativecommons.org/licenses/by/4.0/).
Share and Cite
Golba, S.; Popczyk, M.; Miga, S.; Jurek-Suliga, J.; Zubko, M.; Kubisztal, J.; Balin, K. Impact of Acidity Profile on Nascent Polyaniline in the Modified Rapid Mixing Process—Material Electrical Conductivity and Morphological Study. Materials 2020, 13, 5108. https://doi.org/10.3390/ma13225108
Golba S, Popczyk M, Miga S, Jurek-Suliga J, Zubko M, Kubisztal J, Balin K. Impact of Acidity Profile on Nascent Polyaniline in the Modified Rapid Mixing Process—Material Electrical Conductivity and Morphological Study. Materials. 2020; 13(22):5108. https://doi.org/10.3390/ma13225108
Chicago/Turabian StyleGolba, Sylwia, Magdalena Popczyk, Seweryn Miga, Justyna Jurek-Suliga, Maciej Zubko, Julian Kubisztal, and Katarzyna Balin. 2020. "Impact of Acidity Profile on Nascent Polyaniline in the Modified Rapid Mixing Process—Material Electrical Conductivity and Morphological Study" Materials 13, no. 22: 5108. https://doi.org/10.3390/ma13225108
APA StyleGolba, S., Popczyk, M., Miga, S., Jurek-Suliga, J., Zubko, M., Kubisztal, J., & Balin, K. (2020). Impact of Acidity Profile on Nascent Polyaniline in the Modified Rapid Mixing Process—Material Electrical Conductivity and Morphological Study. Materials, 13(22), 5108. https://doi.org/10.3390/ma13225108