Article

The Effects of Grain Size and Twins Density on High Temperature Oxidation Behavior of Nickel-Based Superalloy GH738

1
School of Energy and Power Engineering, Beihang University, Beijing 100191, China
2
School of Materials Science and Engineering, Beihang University, Beijing 100191, China
3
Beijing Advanced Innovation Centre for Biomedical Engineering, Beihang University, Beijing 100191, China
*
Author to whom correspondence should be addressed.
Materials 2020, 13(18), 4166; https://doi.org/10.3390/ma13184166
Submission received: 12 August 2020 / Revised: 16 September 2020 / Accepted: 18 September 2020 / Published: 19 September 2020
(This article belongs to the Section Corrosion)

Abstract

:
In the present study, surface treatment techniques such as room temperature machining (RTM) and low temperature burnishing (LTB) processing have been used to improve the microstructure of GH738 superalloy. Nano-grains and nano-twins are obtained on the top surface of RTM and LTB specimens. It is found that although the grain size of RTM and LTB specimens is almost the same, different types of nano-twins have been produced. Moreover, the effect of RTM and LTB processing on high temperature oxidation behavior of nickel-based superalloy GH738 at 700 °C is investigated. The result shows that LTB specimen has the best high temperature oxidation resistance owing to the formation of nano-grains and higher twins density, which induce to form a continuous protective Al2O3 layer at the interface between outer oxide layer and matrix. It is observed that this layer inhibits the inward diffusion of O and outward diffusion of Ti and significantly improves oxidation resistance of LTB specimen. Furthermore, the effects of nano-grains and crystal defects on the diffusion mechanism of elements are clarified during the high temperature oxidation test.

Graphical Abstract

1. Introduction

Nickel-based superalloys (GH738 (Chinese code)) are extensively used as the blades and disks of industrial jet engines and gas turbines due to their excellent properties such as fatigue properties [1,2], hot corrosion resistance [3,4,5,6,7], and oxidation resistance at elevated temperatures [8,9,10,11]. However, these alloys degrade during the long-term service in harsh environments. The main failure modes are fatigue fracture, high temperature oxidation, and hot corrosion. Further investigation shows that these failures, which significantly limit the performance and service life of alloys, are closely related to the surface microstructure (grain size and crystal defects) [12]. Therefore, many surface treatment techniques (STTs) [13] such as laser shock peening (LSP) [14,15], surface mechanical attrition treatment (SMAT) [16,17,18], surface mechanical rolling treatment (SMRT) [19], surface mechanical grinding treatment (SMGT) [20,21], ultrasonic shot peening (USSP) [22], machining [23], low temperature (cryogenic temperature) burnishing (LTB) [24,25] and shot peening [26] have been used to change the surface microstructure of alloys by means of severe plastic deformation [27].
In the past few years, coarse grains have been refined to multiscale grains, ranging from several nanometers to micrometers in the surface layer of alloys by these STTs. It can significantly affect the fatigue properties [22,28], high temperature oxidation resistance [29,30], and hot corrosion behavior [31] of alloys. As for fatigue life, it has been reported by Ren et al. [32] and Zhou et al. [28] that the fatigue life of steel [32] and GH4133B [28] after LSP is higher than that of untreated samples due to the surface grain refinement and more stable dislocation arrangement. Moreover, Ritchie et al. [33] demonstrated that the burnishing processing significantly improves the fatigue life of Ti-6Al-4V, even at temperatures as high as 550 °C. Nevertheless, there are two disputed results about the influence of different STTs on high temperature oxidation [34,35,36]. Hua et al. [34] and Tan et al. [35] investigated that the high temperature oxidation resistance of GH586 whose average grain size is 18.5 μm after LSP treatment and alloy 800H whose average grain size is 20 nm after shot peening has been improved, the reason of which could be the selective oxidation of Cr to form protective Cr2O3. In contrast, Wu et al. [36] announced that the oxidation process of K38G at 1000 °C has been accelerated after the sand blasting. The above studies show that the change in grain size may have different influences on the high temperature oxidation resistance of the alloys. It is of great significance to further study the effect of grain refinement induced by different surface treatment techniques on high temperature oxidation behavior of alloys.
To compare with room temperature burnishing, liquid nitrogen is applied at the contact interface between the tool and the sample surface to provide a cryogenic environment during the burnishing process [25,37]. This process is defined as low temperature burnishing (LTB). The processing of LTB which can induce a nanocrystalline layer on the surface of alloys has been developed as a rapid, chipless, and inexpensive STT [37,38]. Recent studies have focused on applying LTB to improve the surface integrity and corrosion resistance of alloys. Jawahir et al. [37] reported that refined grain structure and an improved surface finish are achieved in the severe plastic deformation layer produced by LTB. Pu et al. investigated [39] that an ultrafine-grained surface layer is produced on Mg-Al-Zn alloy by LTB and the corrosion resistance is significantly enhanced. Ritchie et al. [40] found that the nanocrystalline structure formed by LTB could maintain thermal stability, even at high temperatures. Our previous work [38,41,42] also showed that the LTB could improve the surface integrity, such as roughness, hardness, and corrosion resistance of alloys. In addition, one surface treatment technique (RTM) can be used to modify the surface microstructure of alloys. Swaminathan et al. [23] demonstrated that the surface grains of Inconel 718 have been refined and hardness has been improved by RTM. Nouduru et al. [43] reported that fine-grained structure which results in oxidation resistance of Zr-2.5Nb alloy improved has been produced by RTM. However, the high temperature oxidation of GH738 treated by LTB has been scantily studied thus far.
In this work, it is intended to treat GH738 superalloy by LTB and RTM and then study the surface microstructure of treated specimens. High temperature oxidation behavior of GH738 treated by LTB and RTM and untreated is investigated in static air at 700 °C. It is expected to investigate the effect of nano-grains and crystal defects (such as twins density) on the elements diffusion during the high temperature oxidation test, which may provide new insights into improving oxidation resistance at elevated temperatures.

2. Experimental Procedure

2.1. Materials

GH738 superalloy used in this work is in bar form with a diameter of 50 mm. The chemical composition is given in Table 1. The prepared bars initially undergo solution heat treatment in three steps. It is firstly kept at 1080 °C for 4 h, followed by holding at 845 °C for 24 h, and finally at 760 °C for 16 h. Each step is followed by an air cooling process. The schematic of heat treatment process is shown in Figure 1a. The solution heat treated specimen is named as SHT specimen (Figure 1b).

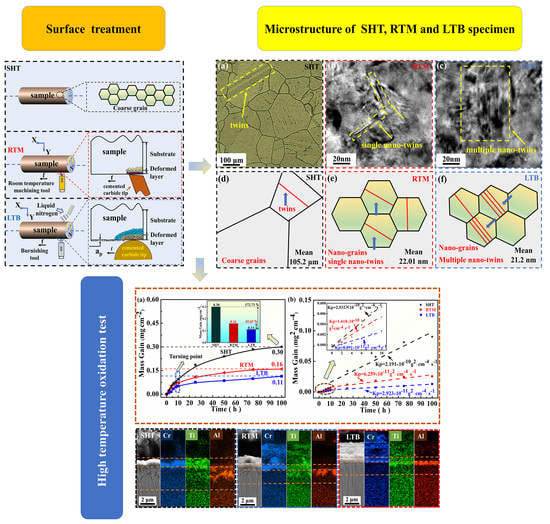
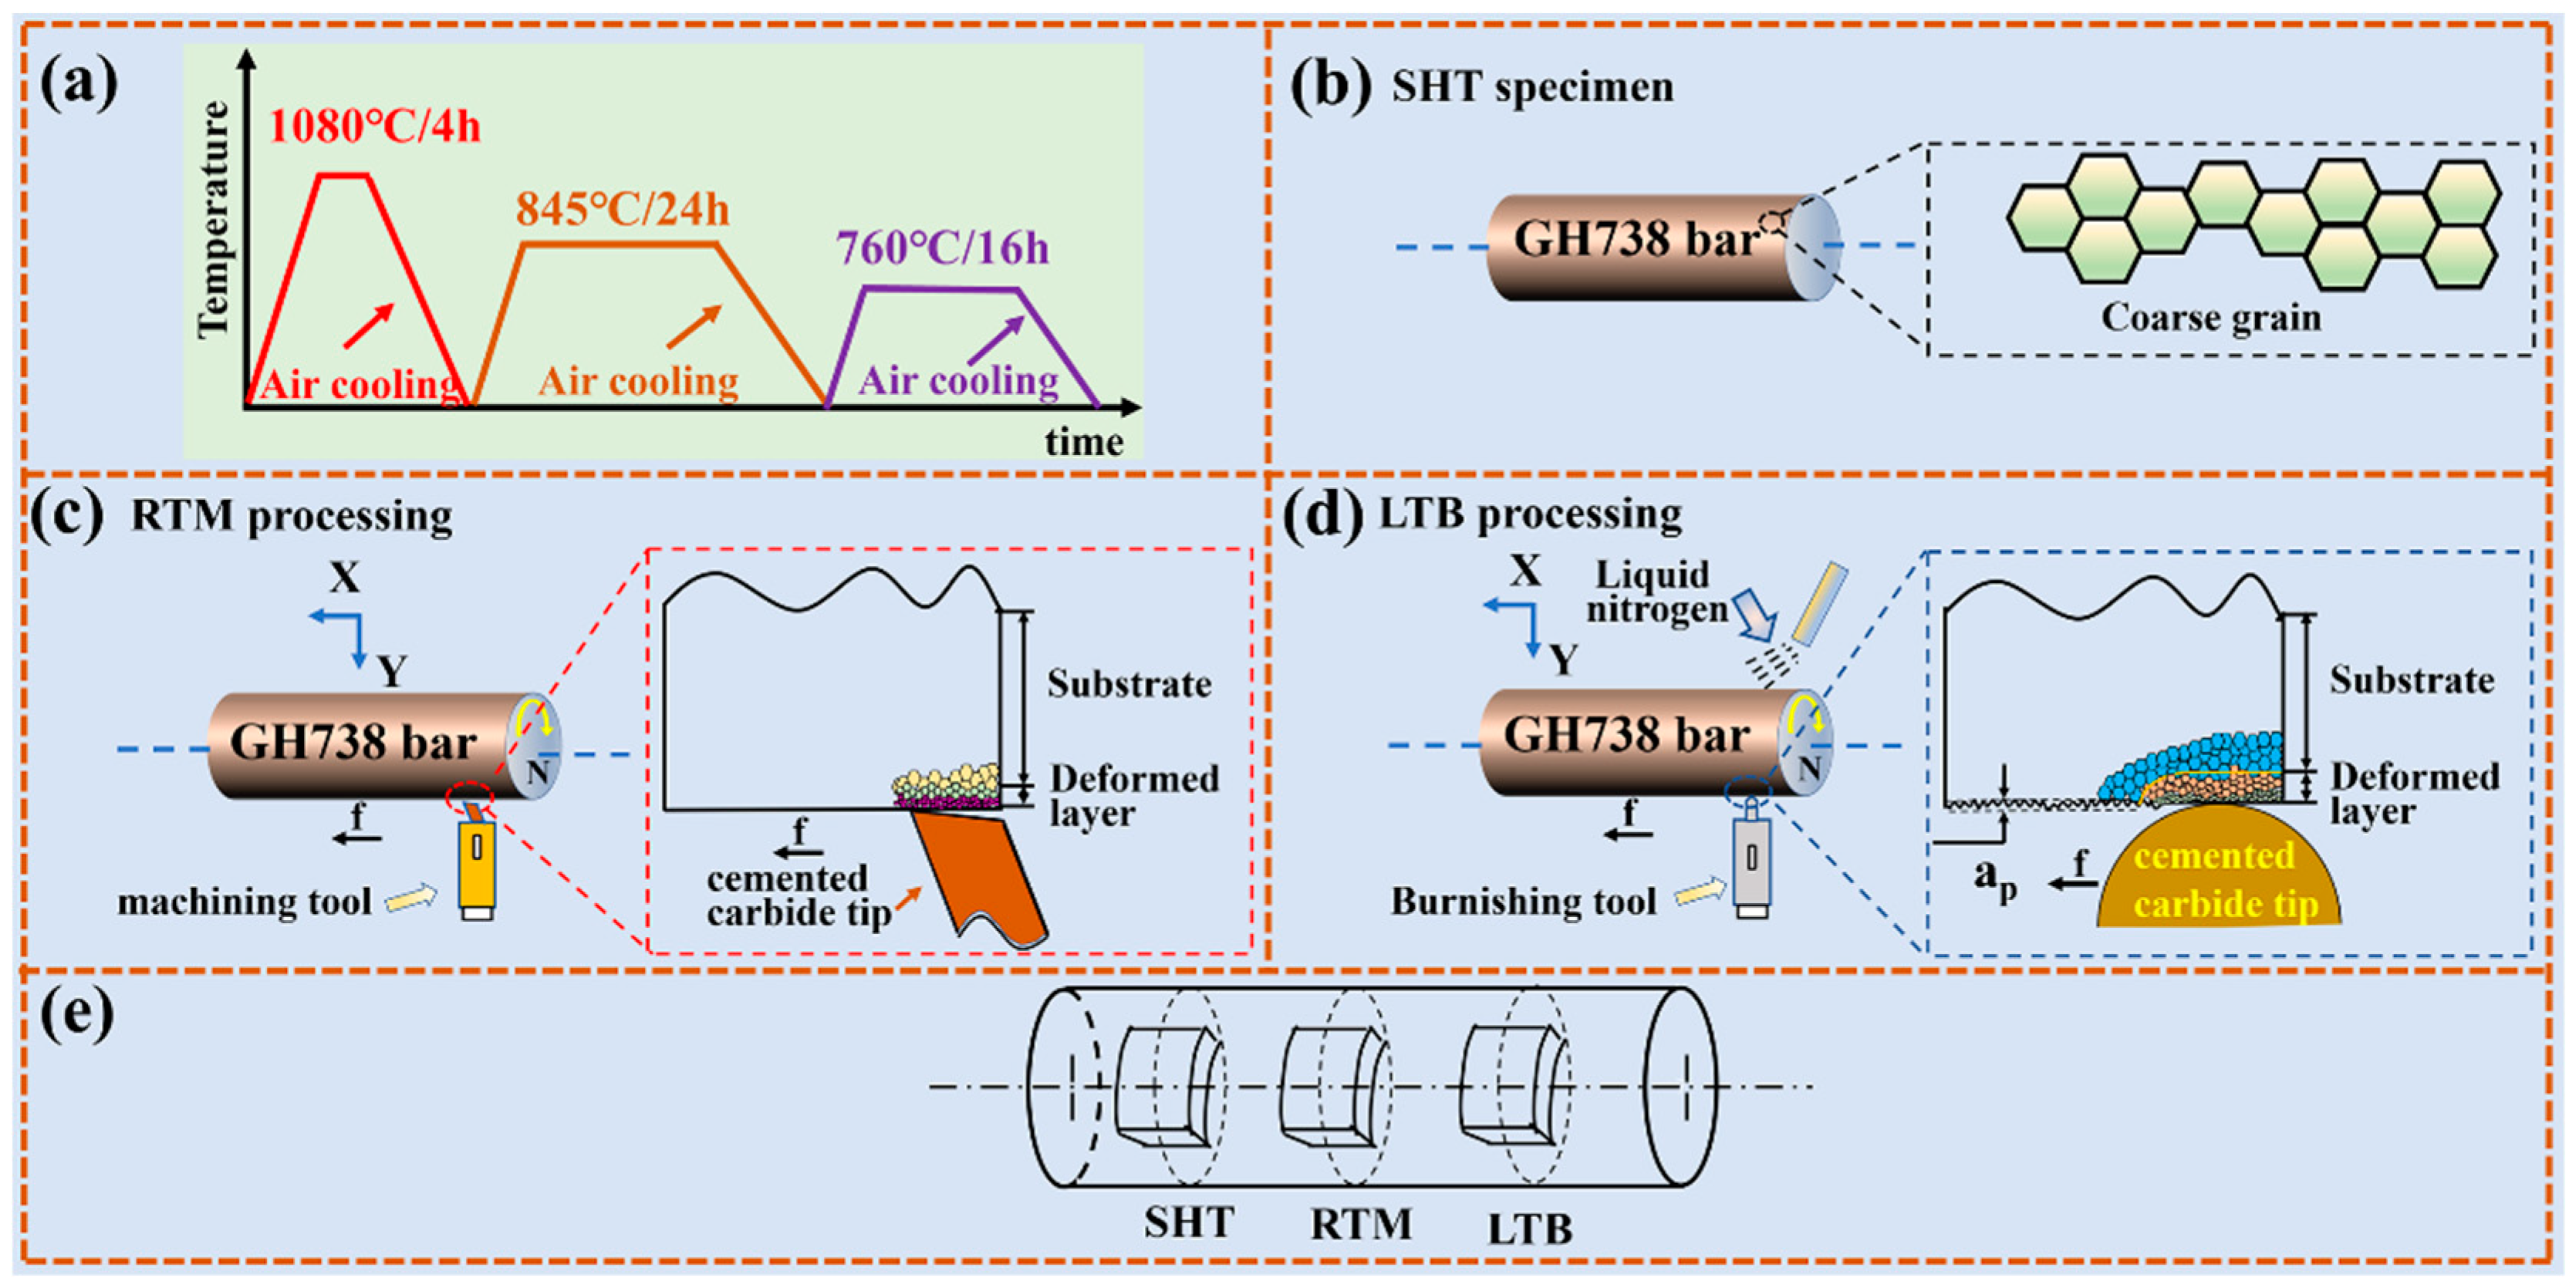
2.2. Surface Treatment Process

In this work, the processing of RTM and LTB are employed to obtain the nano-crystallization layer on the GH738 superalloy surface with a cemented carbide tool. In order to provide standard initial machining and burnishing processing conditions, the topmost surface of GH738 superalloy bar is skimmed off before RTM and LTB processing (about 2 mm). The schematic of RTM and LTB processing are given in Figure 1c,d, respectively. The specimen rotates around the x-axis with a rotating velocity of N and then the cemented carbide tool slowly slides along the positive x-axis with a speed of f. The carbide tip penetrates into the specimen at an appropriate preset depth ap, resulting in the formation of the plastic deformation zone under the tip. The parameters of RTM are set as follows: N = 400 rev/min, f = 40 μm/rev, and ap = 20 μm. The parameters of LTB processing are set as: N = 400 rev/min, f = 5 μm/rev, and ap = 20 μm. It should be indicated that the burnishing processing is carried out at a low temperature (liquid nitrogen, LT) to obtain a nanocrystal microstructure. The detailed burnishing processing could be referred to our previous papers [38,44,45]. The specimens obtained by RTM and LTB processing are hereafter named as RTM and LTB specimens, respectively. Then, the electric discharge wire cutting is used to cut the SHT, RTM, and LTB specimens from the surface of the superalloy bar. The specimens cutting is schematically presented in Figure 1e.

2.3. Oxidation Test

The oxidation experiments are carried out at 700 °C in static air up to 100 h in a silicon carbide furnace. Three types of specimens (SHT, RTM, and LTB specimens) are used in this study. Before oxidation tests, specimens are washed with alcohol and are ultrasonically cleaned in acetone. The alumina crucibles are preheated for 24 h at 750 °C to remove any possible moisture. Therefore, the mass of the crucibles is assumed constant during the experiments. The specimens are weighted at 2 h, 4 h, 6 h, 8 h, 10 h, 25 h, 50 h, 75 h, and 100 h, using an electronic balance with an accuracy of 0.01 mg after cooling down to room temperature by 30 min. The mass change per unit area of three parallel specimens is averaged for each type.

2.4. Microstructure Characterization

After oxidation tests, the surface and cross-sectional microstructure and elements distribution of GH738 are examined under a field emission scanning electron microscope (SEM, Zeiss supra55, Zeiss Corporation, Jena, Germany) equipped with energy dispersive X-ray spectroscope (EDS, Oxford Instruments Corporation, Oxford, UK). Each specimen is cold mounted in epoxy resin, ground up to 2000 grit, and polished with 1.5 mm diamond paste. The grain size and twins morphology are investigated using transmission electron microscopy (TEM, JEM-2100F, Japan Electronics Corporation, Tokyo, Japan) at 200 kV acceleration voltage. The X-ray diffraction (XRD) is used to identify the oxidation product formed on the surface of the corroded specimens after oxidation at 700 °C. The microstructure of the surface layer of SHT, RTM, and LTB specimens are also investigated by XRD. The XRD patterns are obtained using a Rigaku D/max-2500 diffractometer (Rigaku Corporation, Tokyo, Japan) with Cu Kα radiation at 40 kV and 200 mA. The scanning speed is 6°/min. 2θ is scanned from 20° to 80°.

3. Results and Discussion

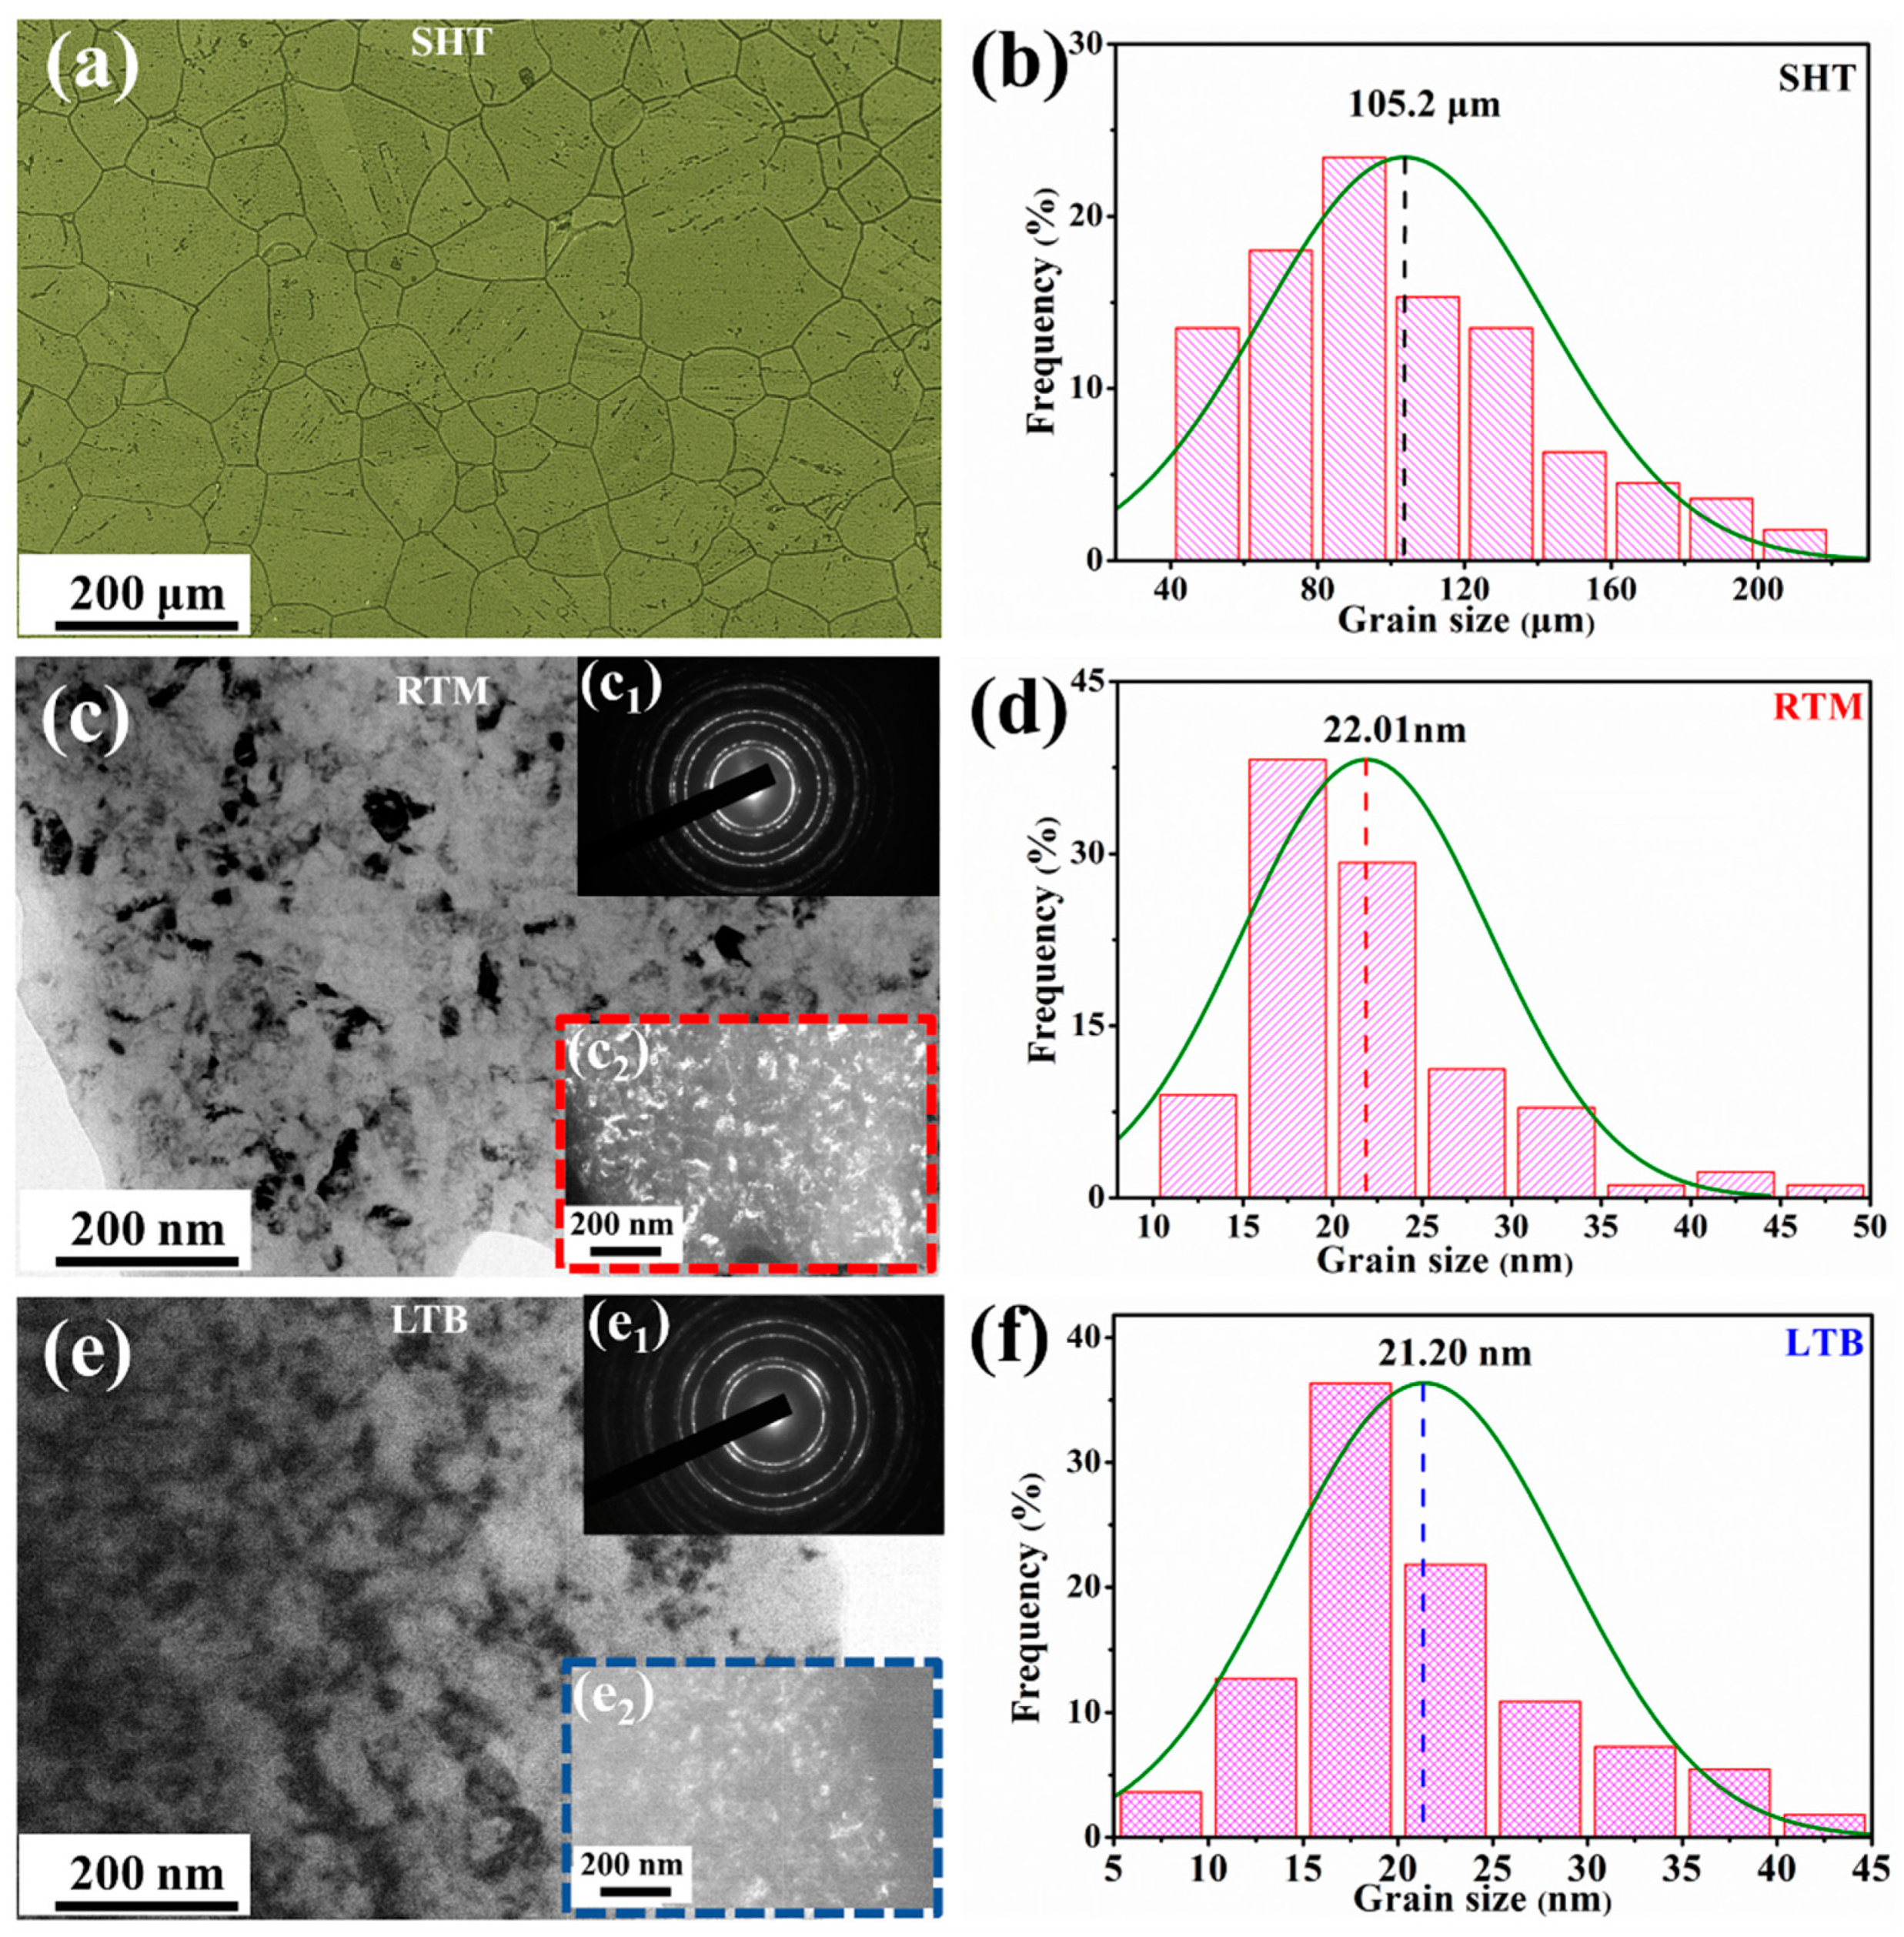
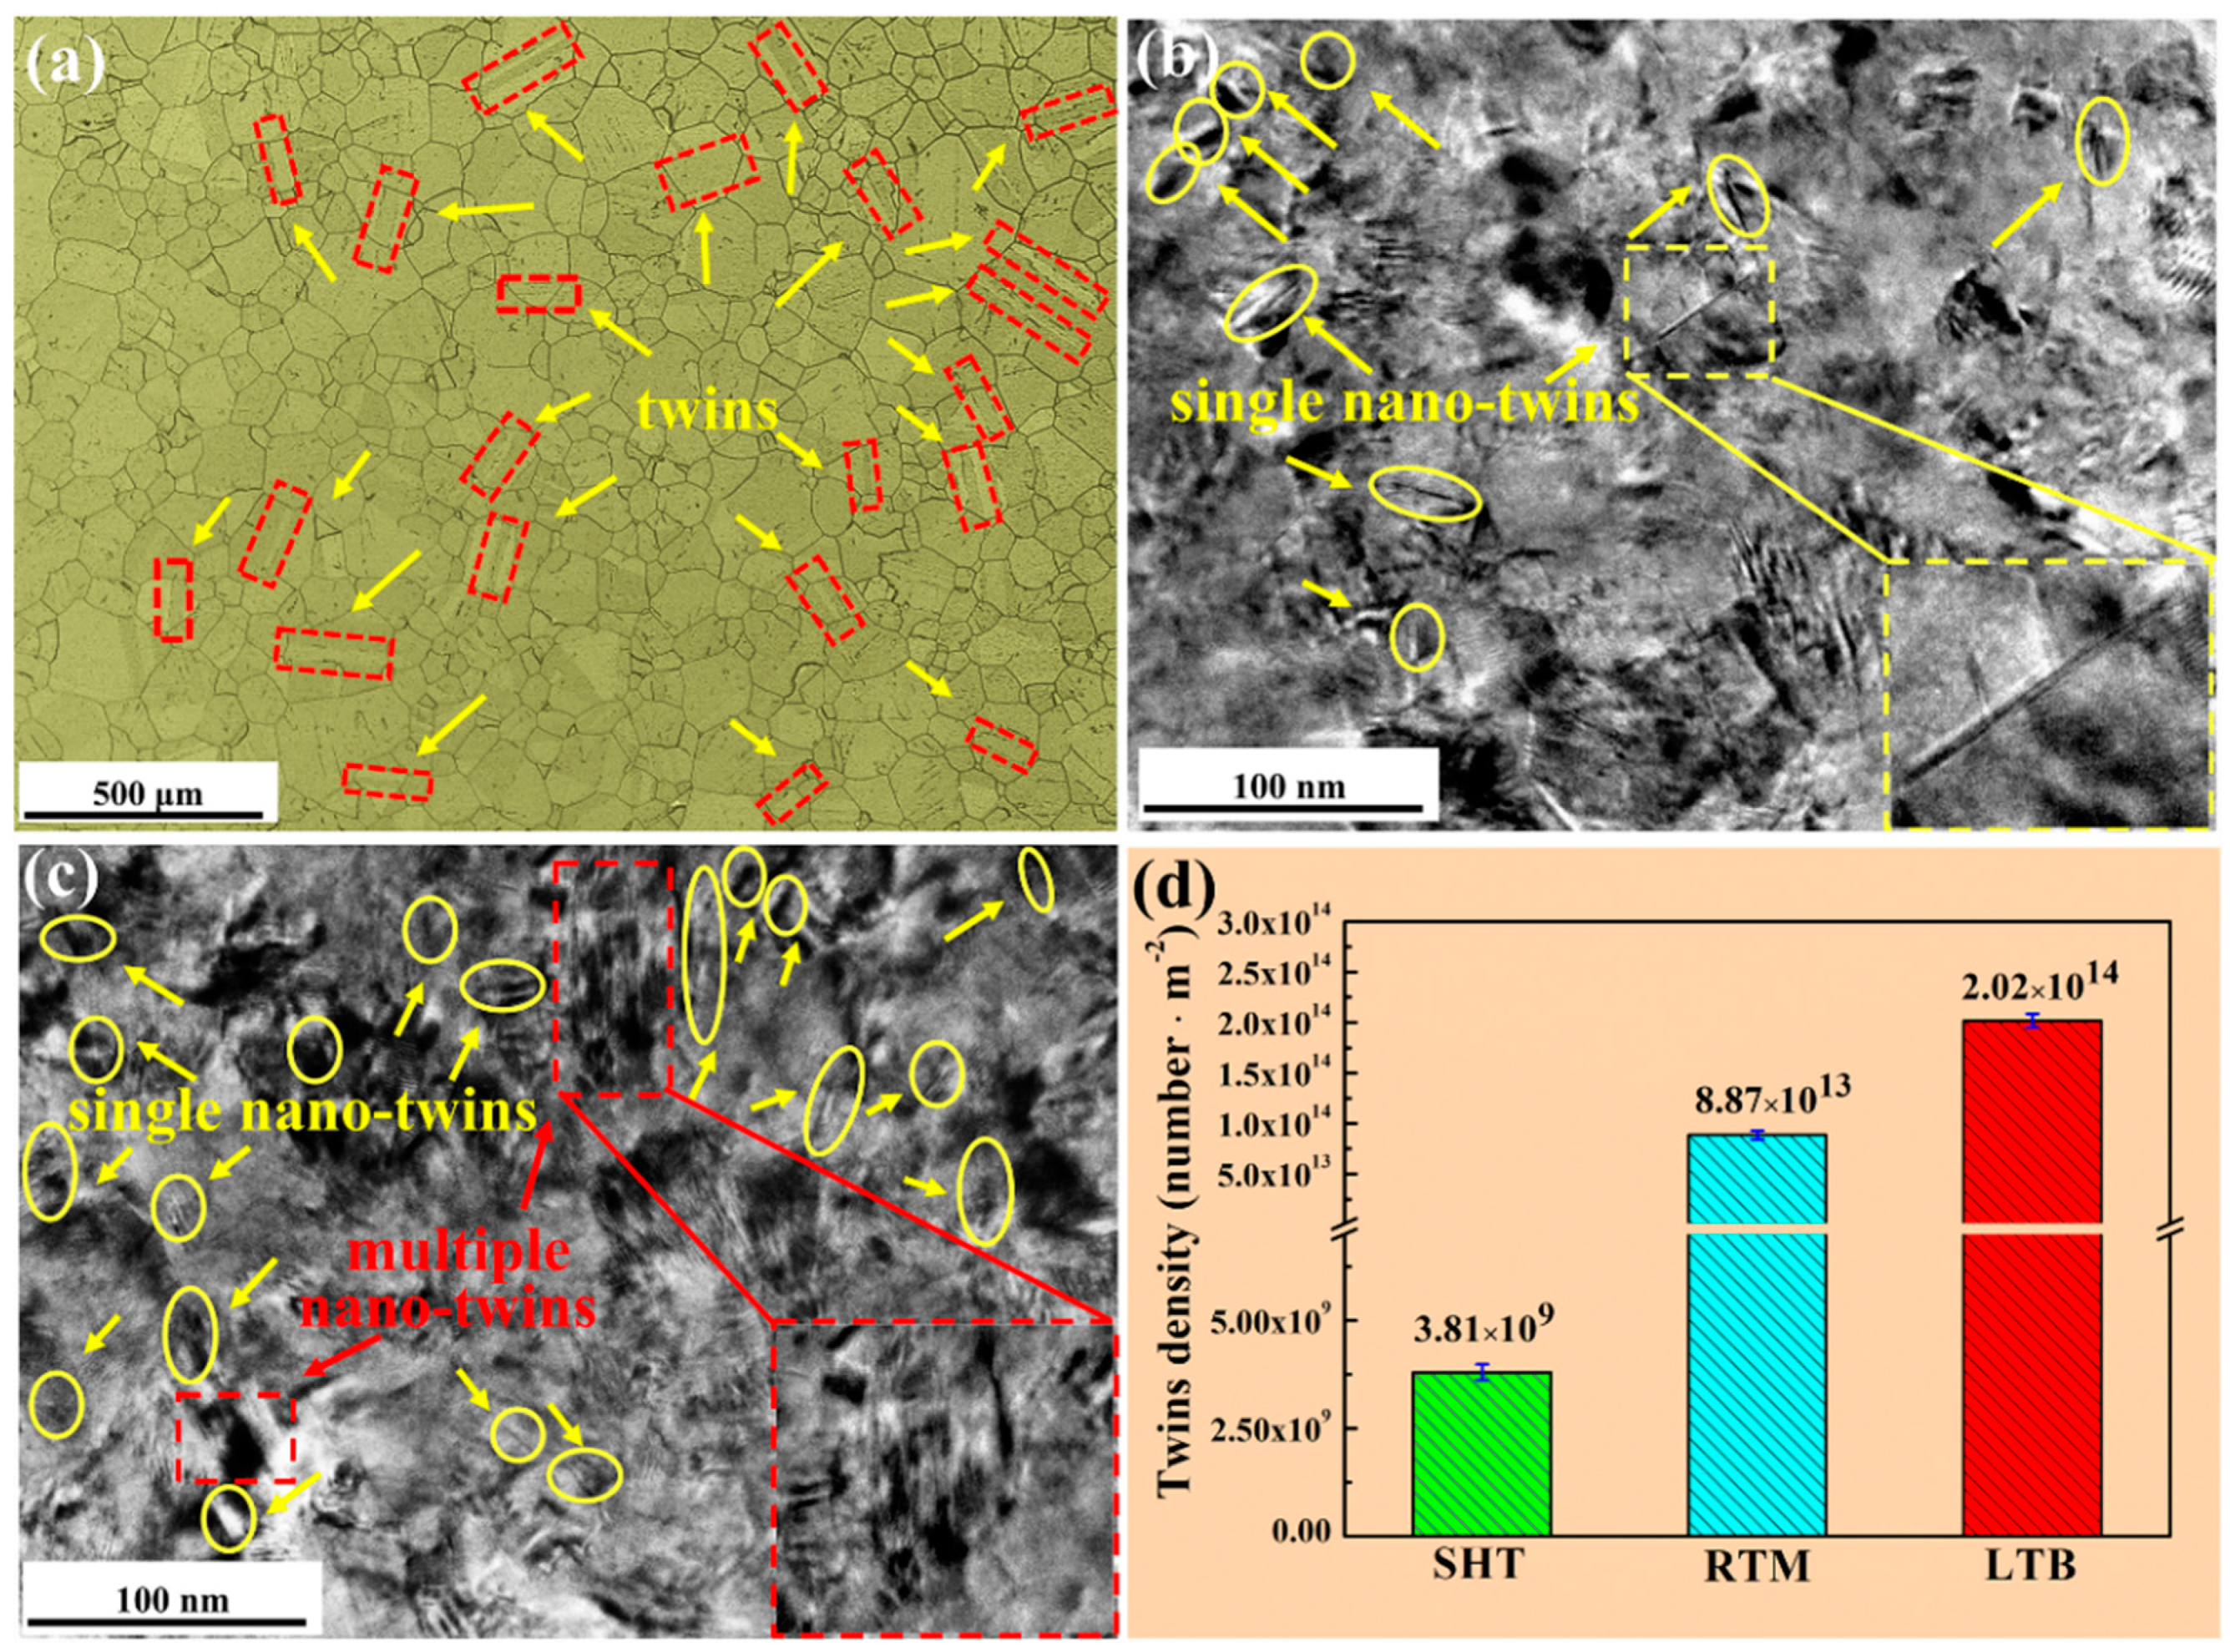
3.1. Surface Layer Characterization

The microstructure and the grain size distribution of these three types of GH738 specimens are shown in Figure 2. After solution heat treatment, the average grain size of the SHT specimen is about 105.2 μm (Figure 2a,b). TEM is carried out on the top surface of the RTM and LTB specimens to further characterize their microstructure as shown in Figure 2c,e. Figure 2c–f illustrate microstructure and grain size distribution of the RTM and LTB specimens, respectively. The grain sizes of the RTM and LTB specimens are obtained by statistical measurement of the bright areas in the dark-field images (Figure 2c2,e2) for more than 200 grains. As can be seen from Figure 2c1,e1, the homogeneous, continuous, and broadened concentric rings in the selected area electron diffraction (SAED) pattern indicate that the grain has been refined [46] due to the severe plastic deformation induced by RTM and LTB processing in the surface layer. It should be noted that uniform nano-grains appear in the surface layer after RTM and LTB processing. The statistical results show that the average grain sizes of the RTM and LTB specimens are 22.01 nm and 21.20 nm, respectively (Figure 2d,f).
Different scales of twins in SHT, RTM, and LTB specimens are displayed in Figure 3. According to the research of Meng et al. [47], the number of twins per unit area can be used to describe twins density of the SHT, RTM, and LTB specimens. There are many micro-scale annealing twins in the SHT specimen shown in Figure 3a, with twins density of 3.81 × 10⁹ number/m2. Nano-twins are twins whose length and thickness are at the nanoscale [19,48]. Typical nano-twins could be found in specimens subjected to RTM and LTB processing in Figure 3b,c. It can be seen from Figure 3b that the RTM specimen forms single nano-twins (marked by yellow arrows), with twins density of 8.87 × 10¹³ number/m2. As shown in Figure 3c, the LTB specimen forms single nano-twins (marked by yellow arrows) and multiple nano-twins (marked by red dash), and the twins density is 2.02 × 10¹⁴ number/m2.
It should be indicated that the formation of nano-twins is derived from ultrahigh strain rate and high peak pressure induced by RTM and LTB processing. The ultrahigh strain rate suppresses the dislocation slip and high peak pressure provides high enough driving energy for twinning [49].

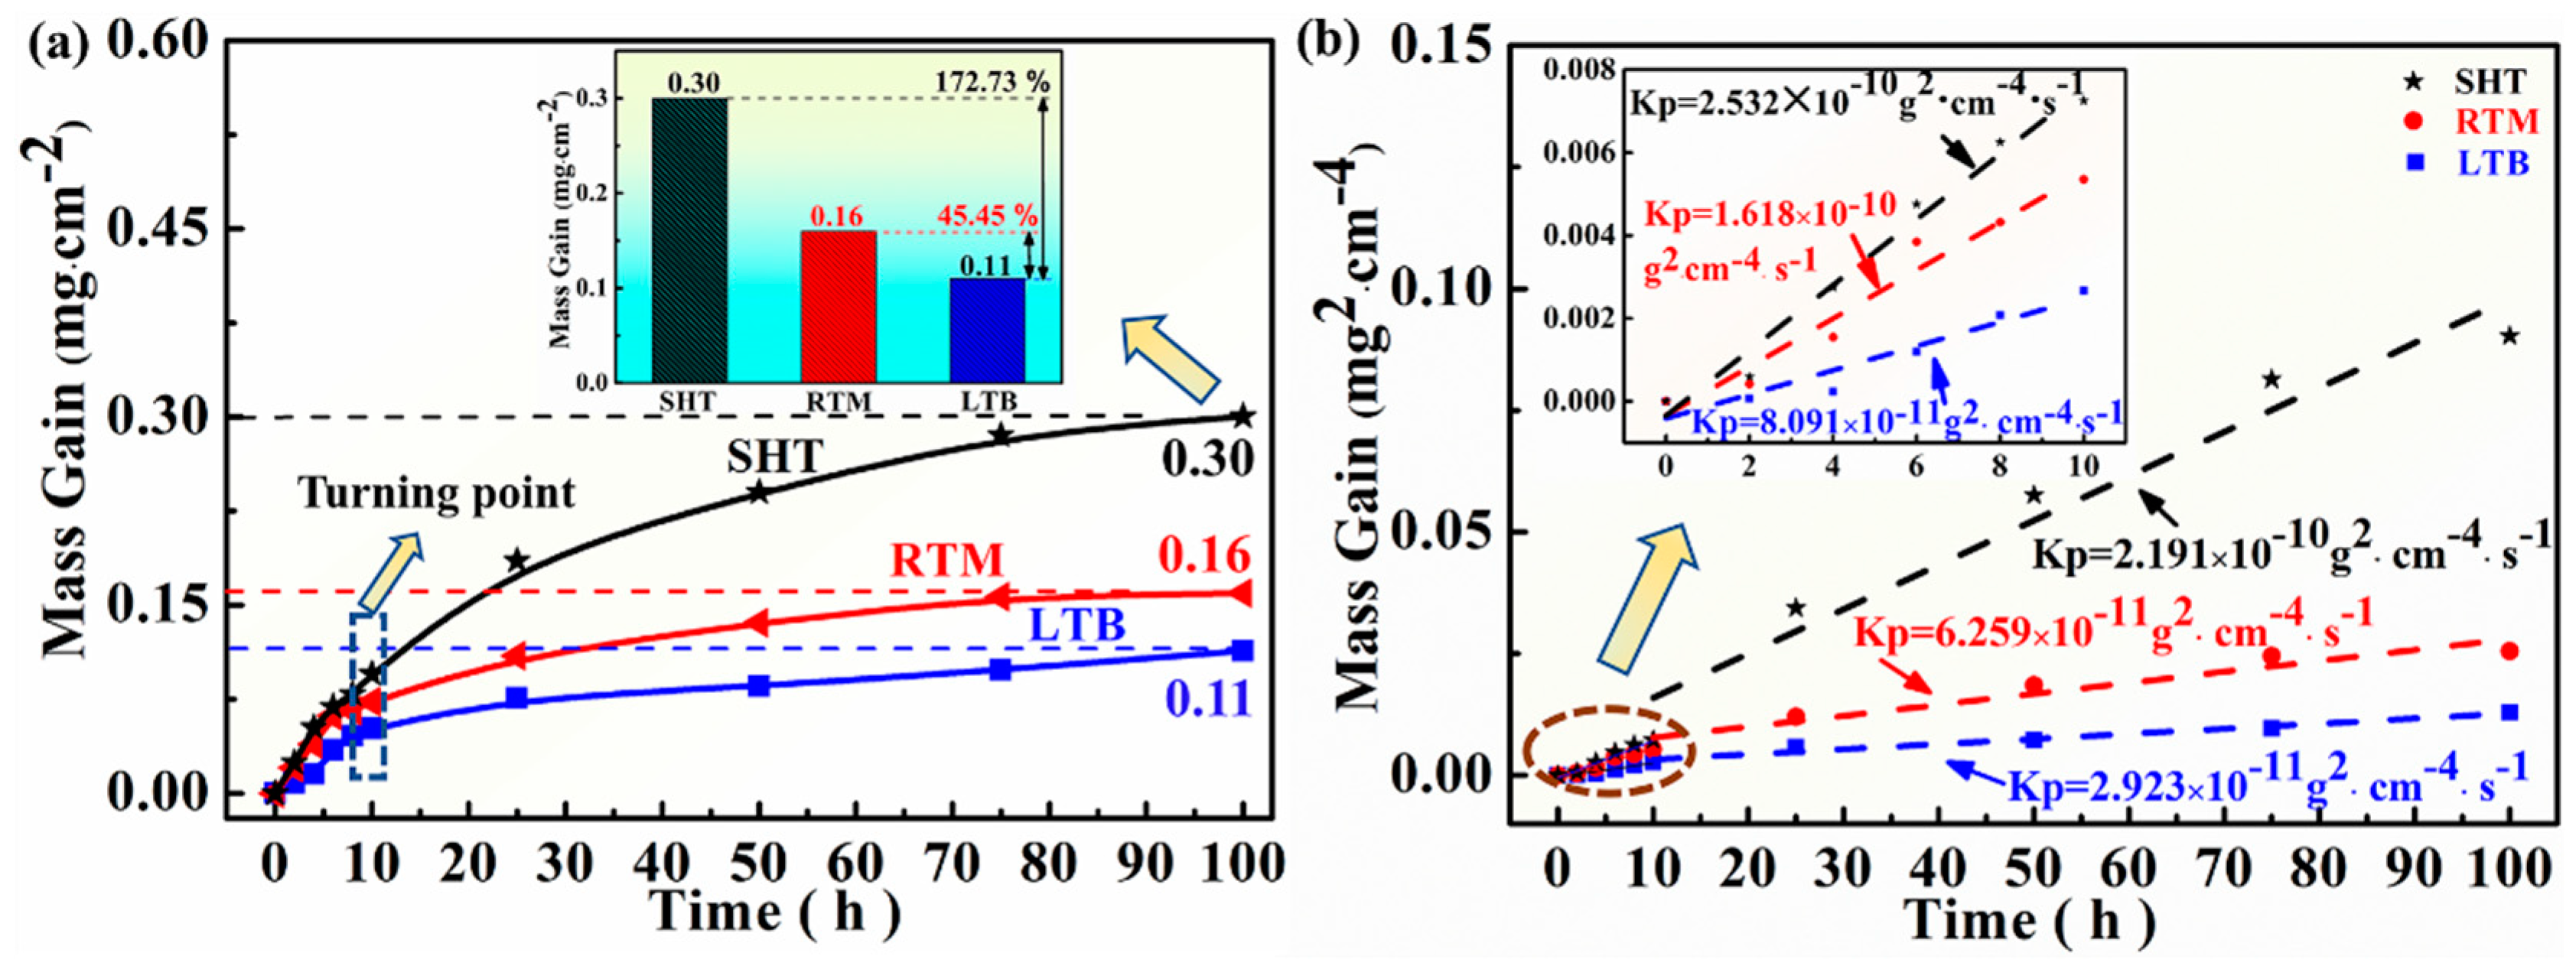
3.2. Oxidation Kinetics Analysis

The oxidation kinetics of the SHT, RTM, and LTB specimens at 700 °C is illustrated in Figure 4. The oxidation kinetics are determined through the relationship of mass gain versus oxidation time. As shown in Figure 4a, the mass gain increases whereas mass gain rate decreases as time extends. The mass gain value of SHT is significantly higher than that of the other two types. After oxidation for 100 h at 700 °C, the average mass gain value of the SHT specimen is 0.3 (mg/cm2), 45.45% higher than that of RTM specimen, and 172.73% higher than that of the LTB specimen. It indicates that the SHT specimen has the worst oxidation resistance among the three kinds of specimens. It is observed from Figure 4b that the oxidation kinetics of GH738 nearly follows parabolic law, indicating that the oxidation process is mainly determined by the diffusion [50]. The oxidation rate can be calculated by Equation (1) [4]:
m/A)2 = Kpt + C
where (Δm/A) is mass gain per unit area; Kp is parabolic rate constant; and C is a constant. (Δm/A) is measured in mg∙cm−2 and time t in seconds. The Kp is calculated in g2cm−4s−1.
Furthermore, Figure 4a shows that the mass gains of the three types of specimens exhibit a relatively rapid increase in the initial 10 h. In addition, the SHT specimen has the largest mass gain while the LTB specimen has the smallest one. In the initial 10 h, the Kp of SHT, RTM, and LTB specimens are determined to be 2.532 × 10¹⁰, 1.618 × 10¹⁰, and 8.091 × 10¹¹ g2cm4s1, respectively (Figure 4b). Then, further mass gain of these specimens is relatively low which means that the oxidation process transits into to a steady stage, with Kp of 2.191 × 10¹⁰, 6.259 × 10¹¹, and 2.923 × 10¹¹ g2cm4s1, respectively (Figure 4b). In steady stage, a continuous stable protective oxide layer is formed [51]. The lower the value of Kp, the higher the oxidation resistance and vice versa [4]. The Kp value of LTB specimen is found to be lower than that of RTM and SHT specimens, which indicates that the LTB specimen has the best oxidation resistance compared to the other specimens.

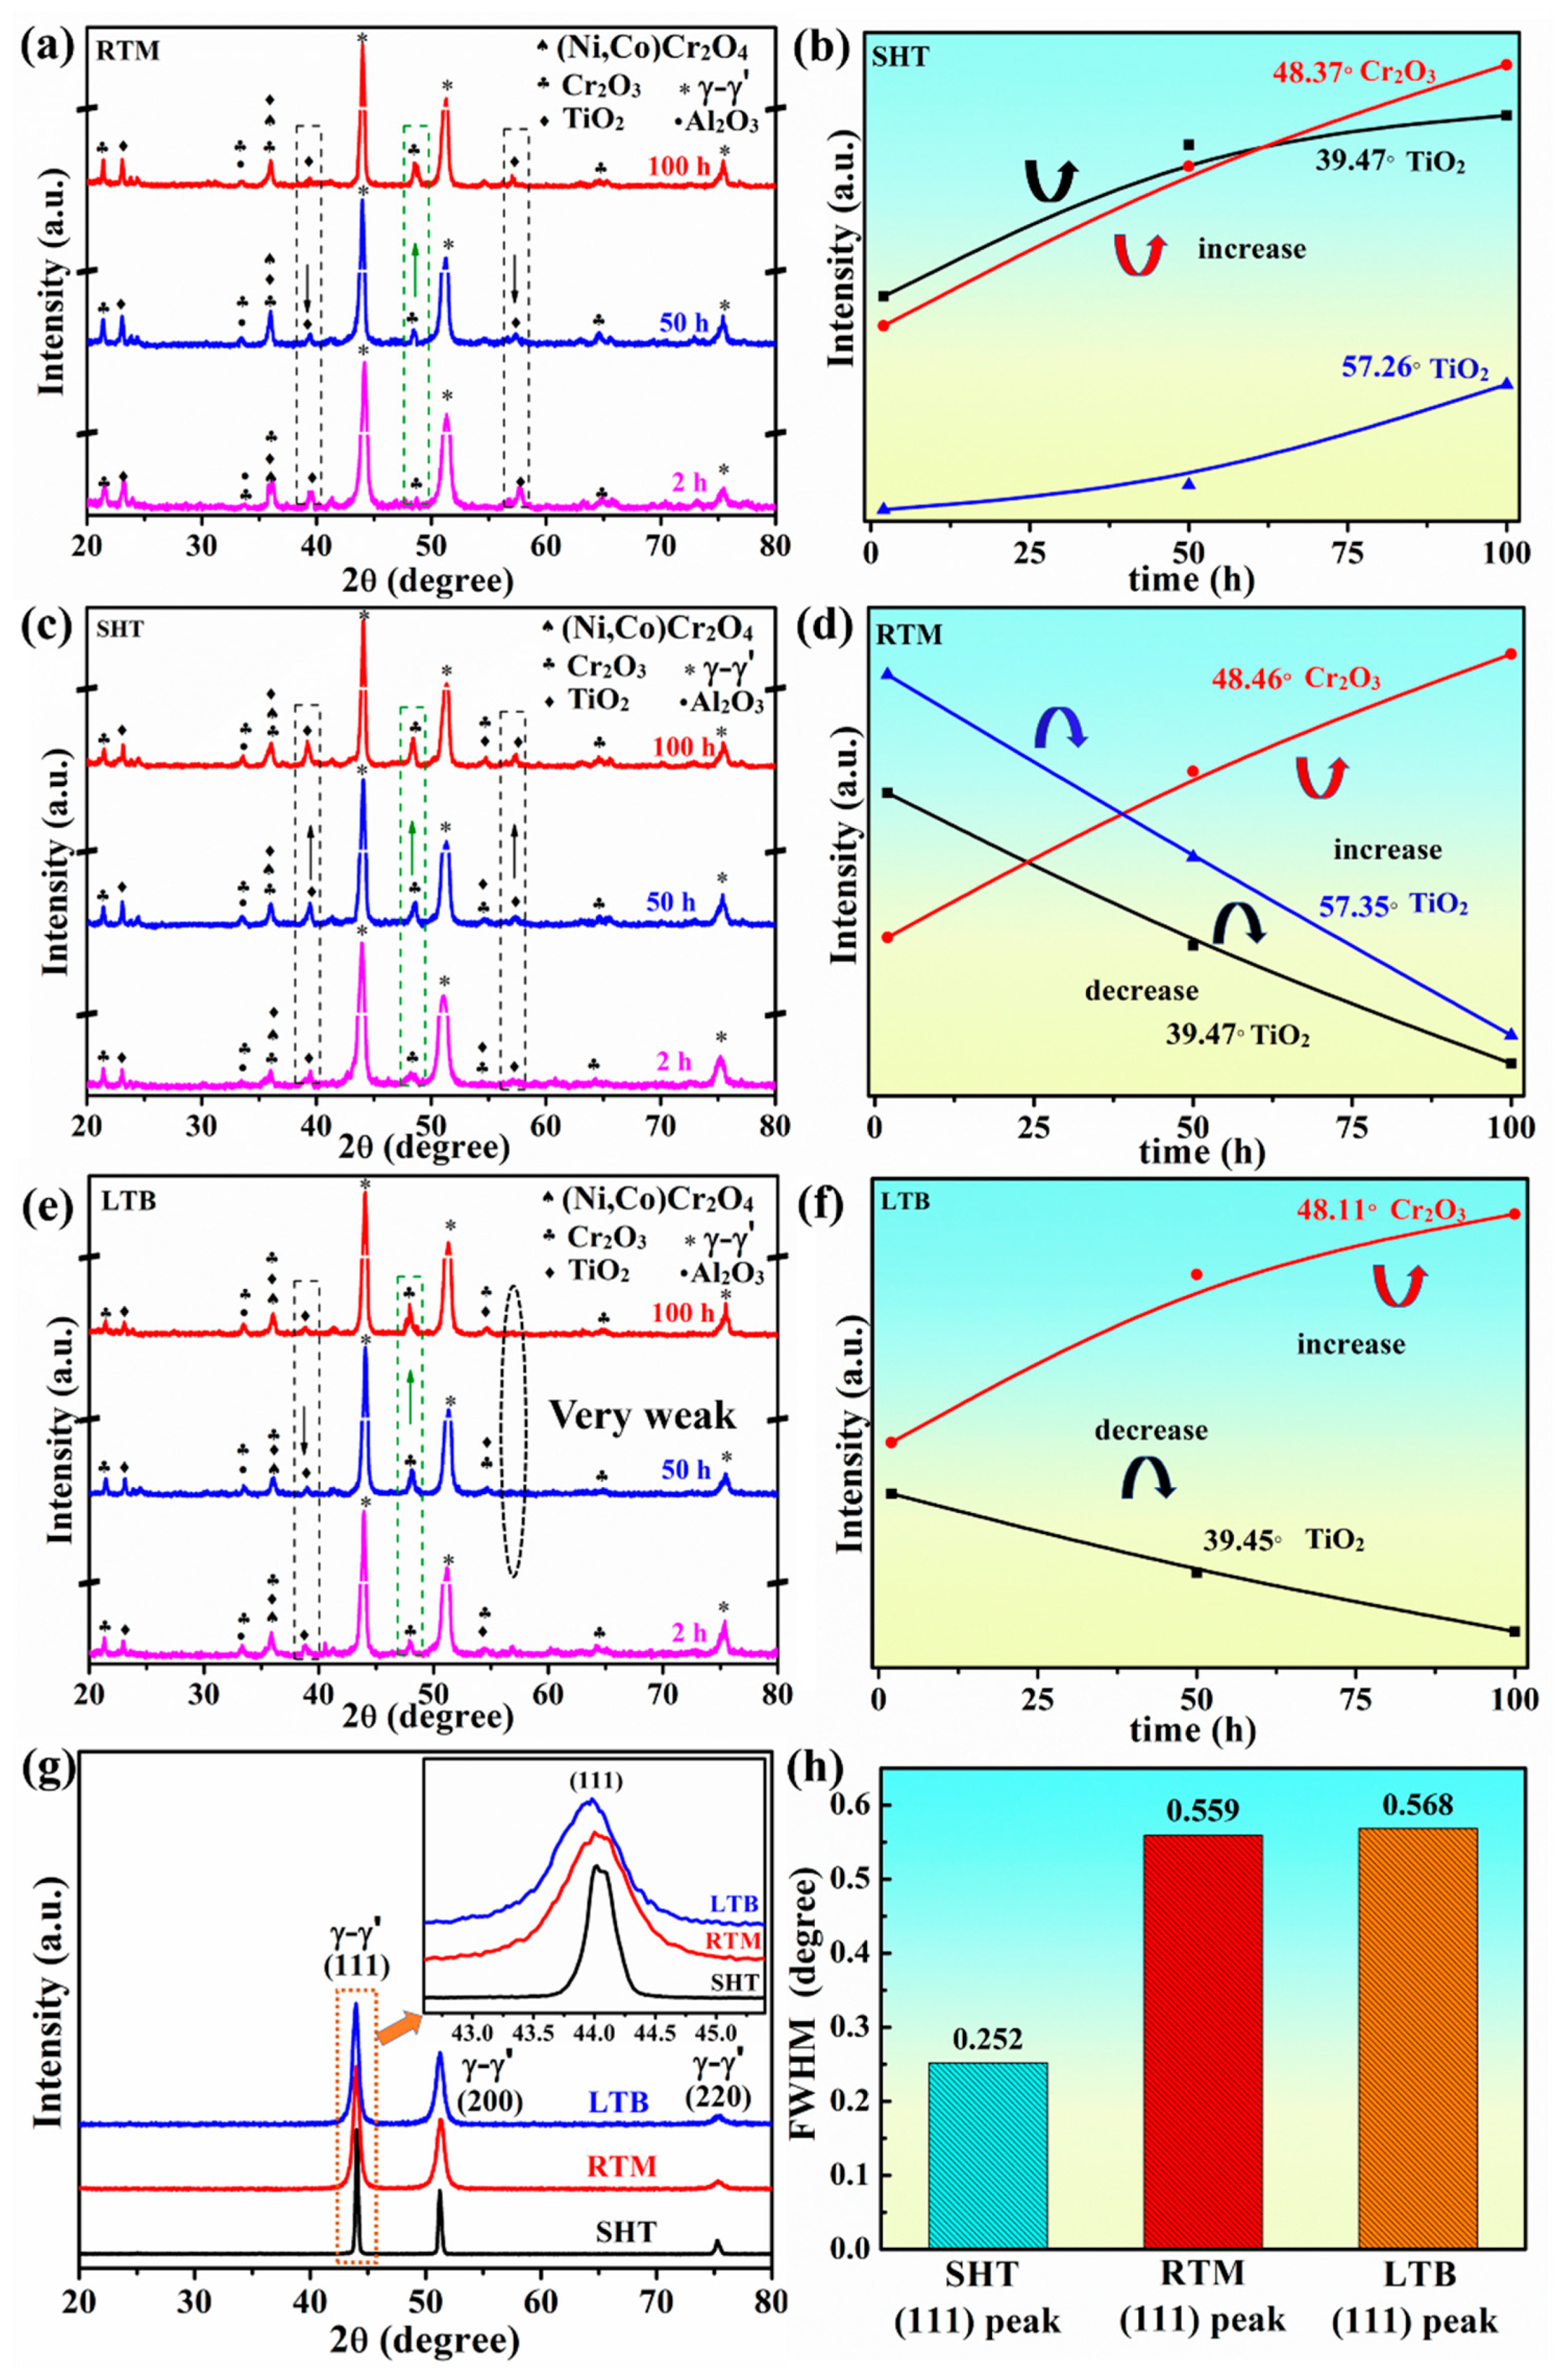
3.3. Phase Constitution of Surface Oxidation Product

High temperature oxidation resistance of superalloys is primarily determined by the protective oxide scale formed on the surface of the superalloys [52]. Moreover, the phase composition of the oxidation product is confirmed by XRD. Figure 5 illustrates the XRD results for the surface oxidation product of all three types of specimens after oxidation test at 700 °C.
The XRD patterns (Figure 5a,c,e) show that after the oxidation test, the oxidation product on the surface of SHT, RTM, and LTB specimens consist of Cr2O3, TiO2, (Ni,Co)Cr2O4, and Al2O3. Al2O3 and Cr2O3 [10,53], which are considered to be the protective oxide for their stable chemical properties at elevated temperatures, inhibit further oxidation of the matrix. Compared with Al2O3 and Cr2O3, TiO2 is considered to be the unprotective oxide. TiO2 loosens the outer oxide layer and provides the path for oxygen to diffuse into matrix [10,54]. It should be indicated that (Ni,Co)Cr2O4 spinel is formed through the solid phase reaction between (Ni,Co)O and Cr2O3 [50]. At high temperatures, Co and Ni have similar physical properties, which result in similar diffusion behaviors. Therefore, they coexist in the oxidation product to form (Ni,Co)Cr2O4 [6].
The XRD curve is normalized, and the relative peak intensity can be used to represent the relative content of oxide [34]. In Figure 5, the black arrow and the green arrow represent the variation of the characteristic diffraction peaks of TiO2 and Cr2O3, respectively. Figure 5a,b shows that the content of TiO2 and Cr2O3 on the surface of SHT specimen gradually increases during the experiment. However, Figure 5c–f indicates that the content of Cr2O3 on the surface of RTM and LTB specimens gradually increase as the time extends, while the content of TiO2 gradually decreases.
The analysis of FWHM (full width at half maximum) can be used to investigate the effect of surface treatment techniques on the grain size change [26,55]. As shown in Figure 5g, the matrix (111), (200), and (220) peaks become broad after RTM and LTB treatment. The magnified view in Figure 5g shows the peak broadening difference at the matrix (111) peak. The FWHM values of matrix (111) peak of SHT, RTM, and LTB specimens are shown in Figure 5h. According to the FWHM values (Figure 5h) and Scherrer’s equation [56], it can be inferred that the grains have been refined after RTM and LTB treatment.

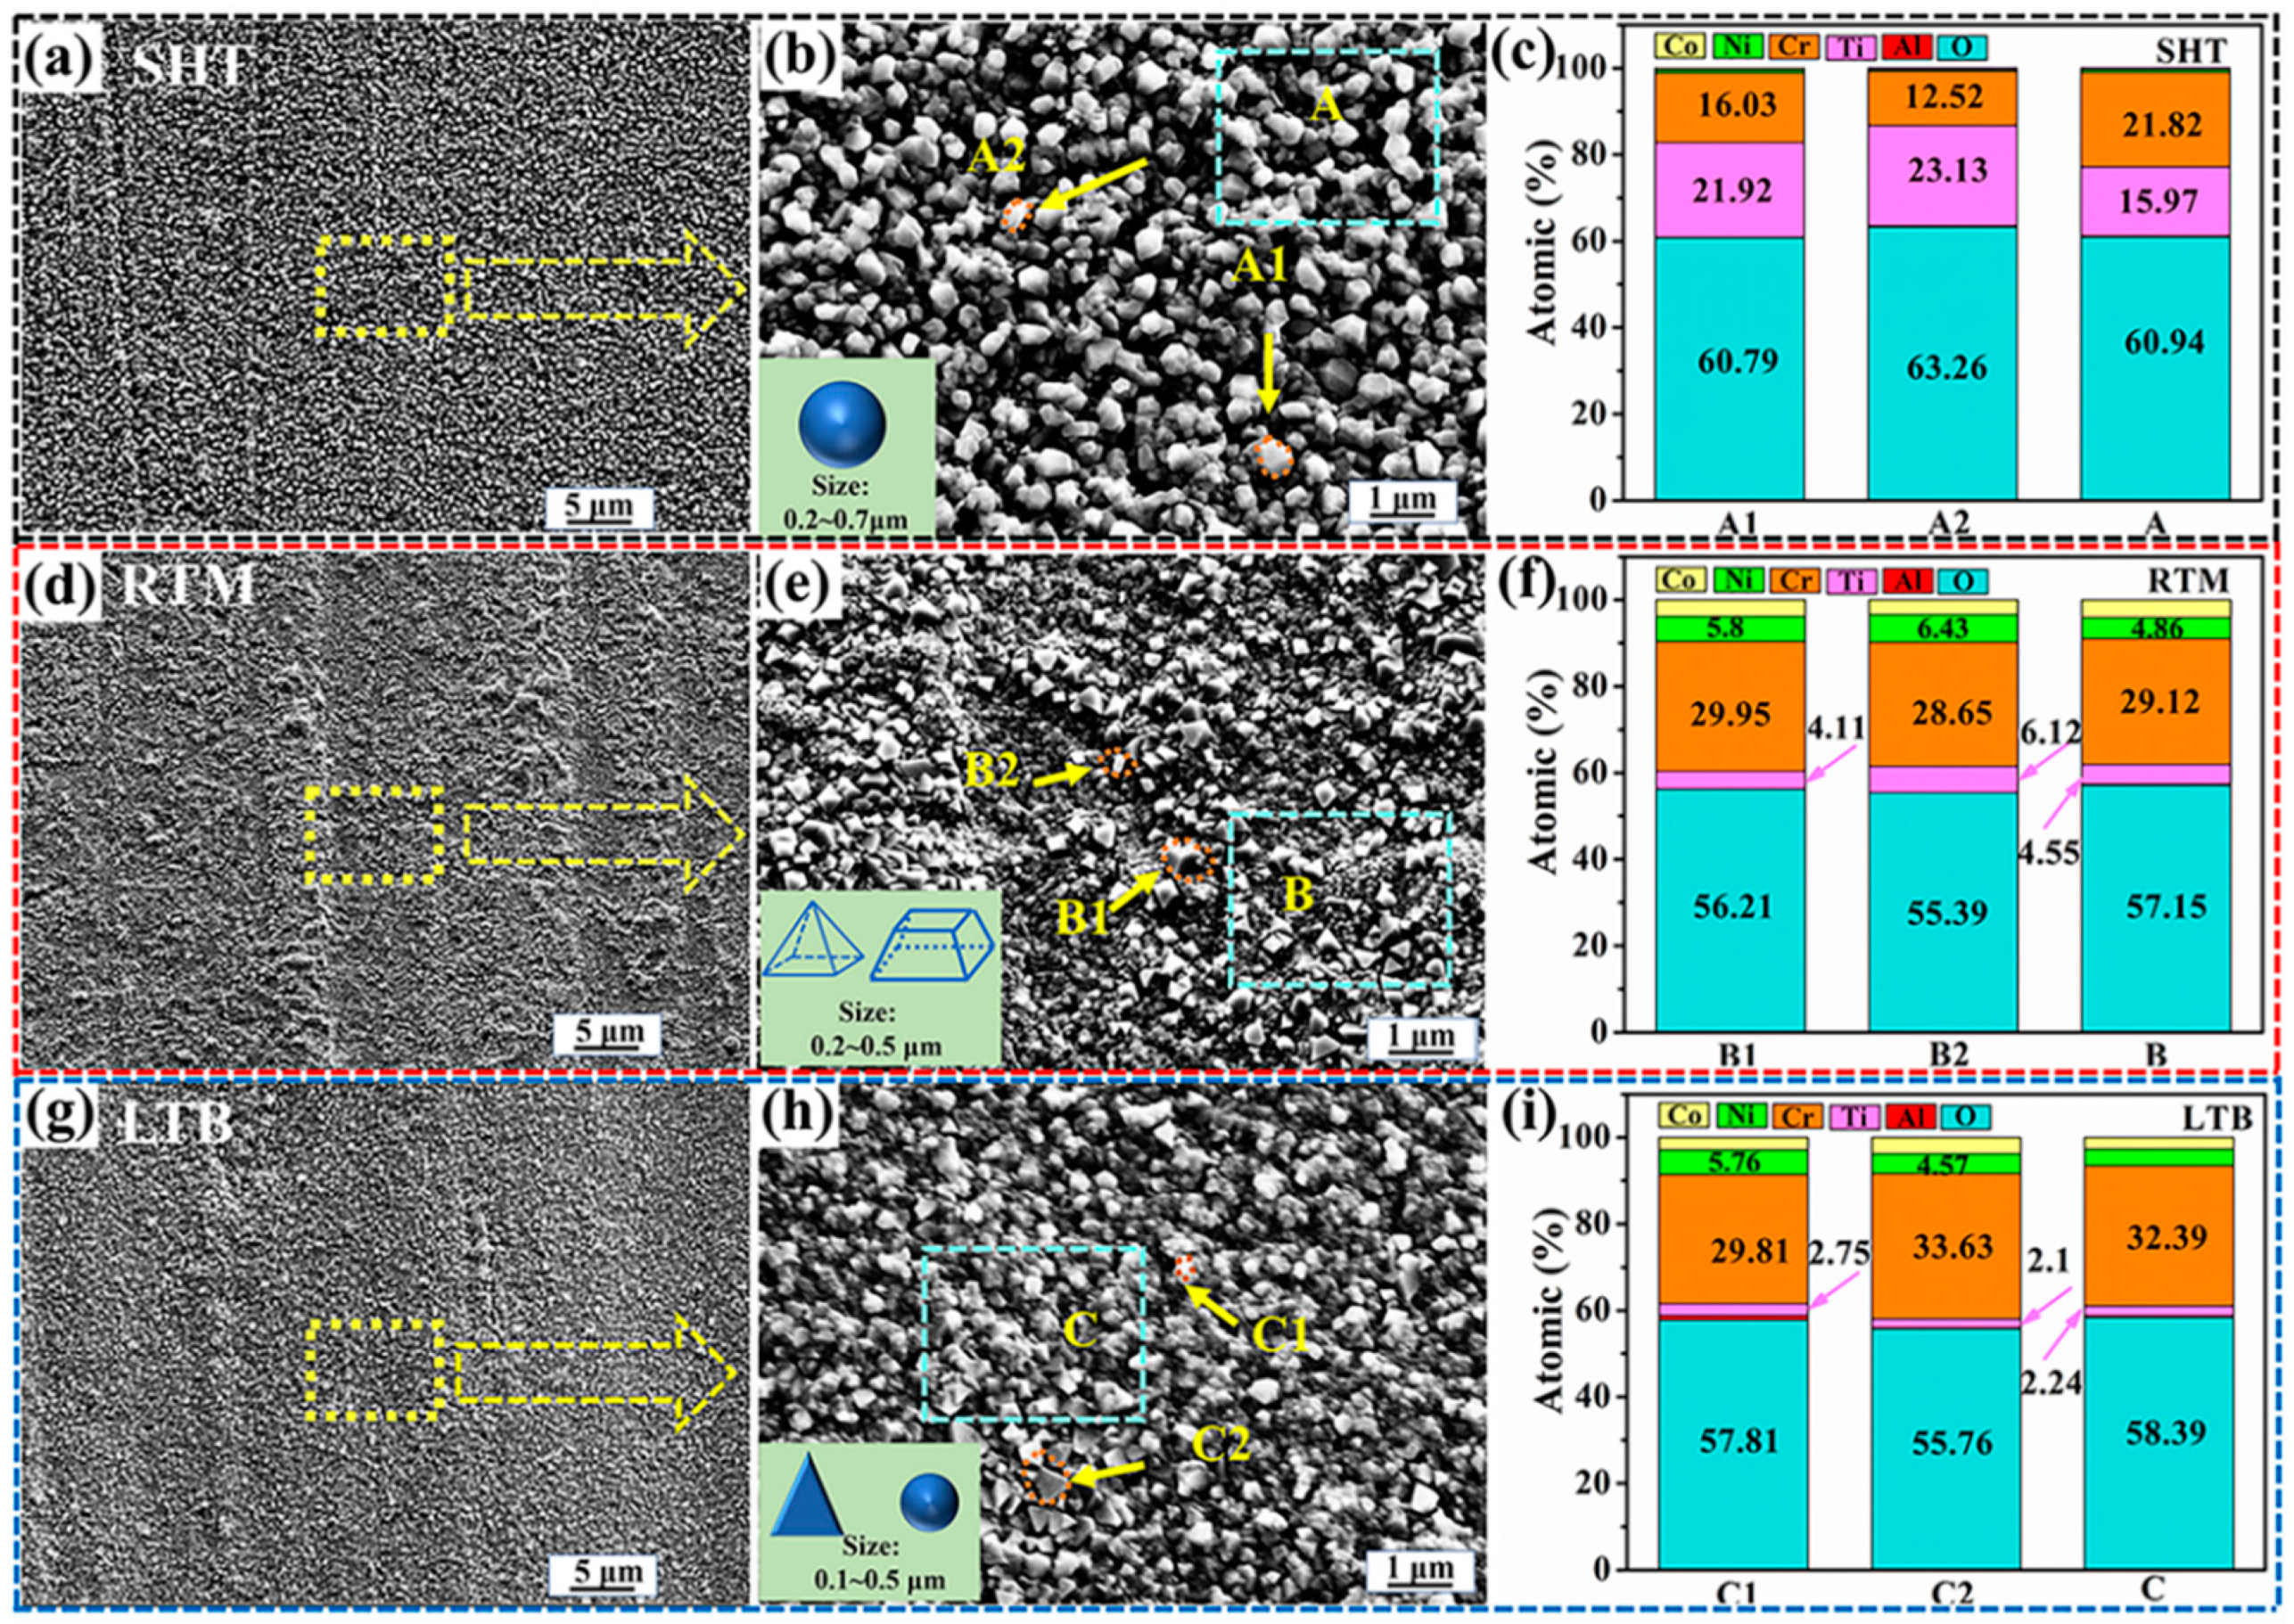
3.4. Surface Morphology and Composition

Figure 6a,d,g show the surface morphology of SHT, RTM, and LTB specimens, respectively, after oxidation at 700 °C for 100 h. Figure 6b,e, and h are the magnified image of the dotted frame zone in Figure 6a,d,g, respectively.
It can be seen from Figure 6b that lots of spherical oxides loosely distribute on the surface of SHT specimen, and the sizes of oxides range from 0.2 to 0.7 μm. The EDS results from Figure 6c (Point A1 and A2) reveal that spherical oxides mainly consists of O, Cr and Ti. In addition, the content of Ti (higher than 20 at. %) is higher than that of Cr (less than 17 at. %). Combining the results of XRD presented in Figure 5a and EDS results, the spherical oxide is mainly composed of TiO2. It should be indicated that loose and porous TiO2 oxide has poor resistance to protect the matrix against oxidation.
It is shown in Figure 6d that oxide particles are finely and evenly distributed on the surface of RTM specimen. It is observed that the surface of the sample is unevenly distributed with pyramidal oxide and prismatic oxide, and the sizes of oxides range from 0.2 to 0.5 μm. Combining the results of XRD presented in Figure 5c and the EDS analysis in Figure 6f (Point B1, B2), it is inferred that pyramidal oxide and prismatic oxide are mainly composed of Cr2O3.
Figure 6h shows that the surface of LTB specimen is continuously and densely covered with oxidation product, which is beneficial for the dispersion of the internal stress in the oxidation layer and prevents further oxidation [34]. Moreover, it is observed that the oxidation product is likely to form three-dimensional triangular and small-sized spherical shapes and the sizes range from 0.1 to 0.5 μm. On the basis of EDS analysis in Figure 6i (Point C1and C2) and XRD pattern in Figure 5e, it is concluded that the main component of three-dimensional triangular oxide and small-sized spherical oxide are Cr2O3.
Combining the results of XRD presented in Figure 5 and the EDS analysis in Figure 6 (zone A, zone B and zone C), the surface of SHT, RTM, and LTB specimens are mainly composed of Cr2O3 and TiO2. Furthermore, the Ti content in the surface of LTB specimen is lowest compared to that of RTM and SHT specimens. It can be inferred that the outward diffusion of Ti is inhibited by LTB processing.

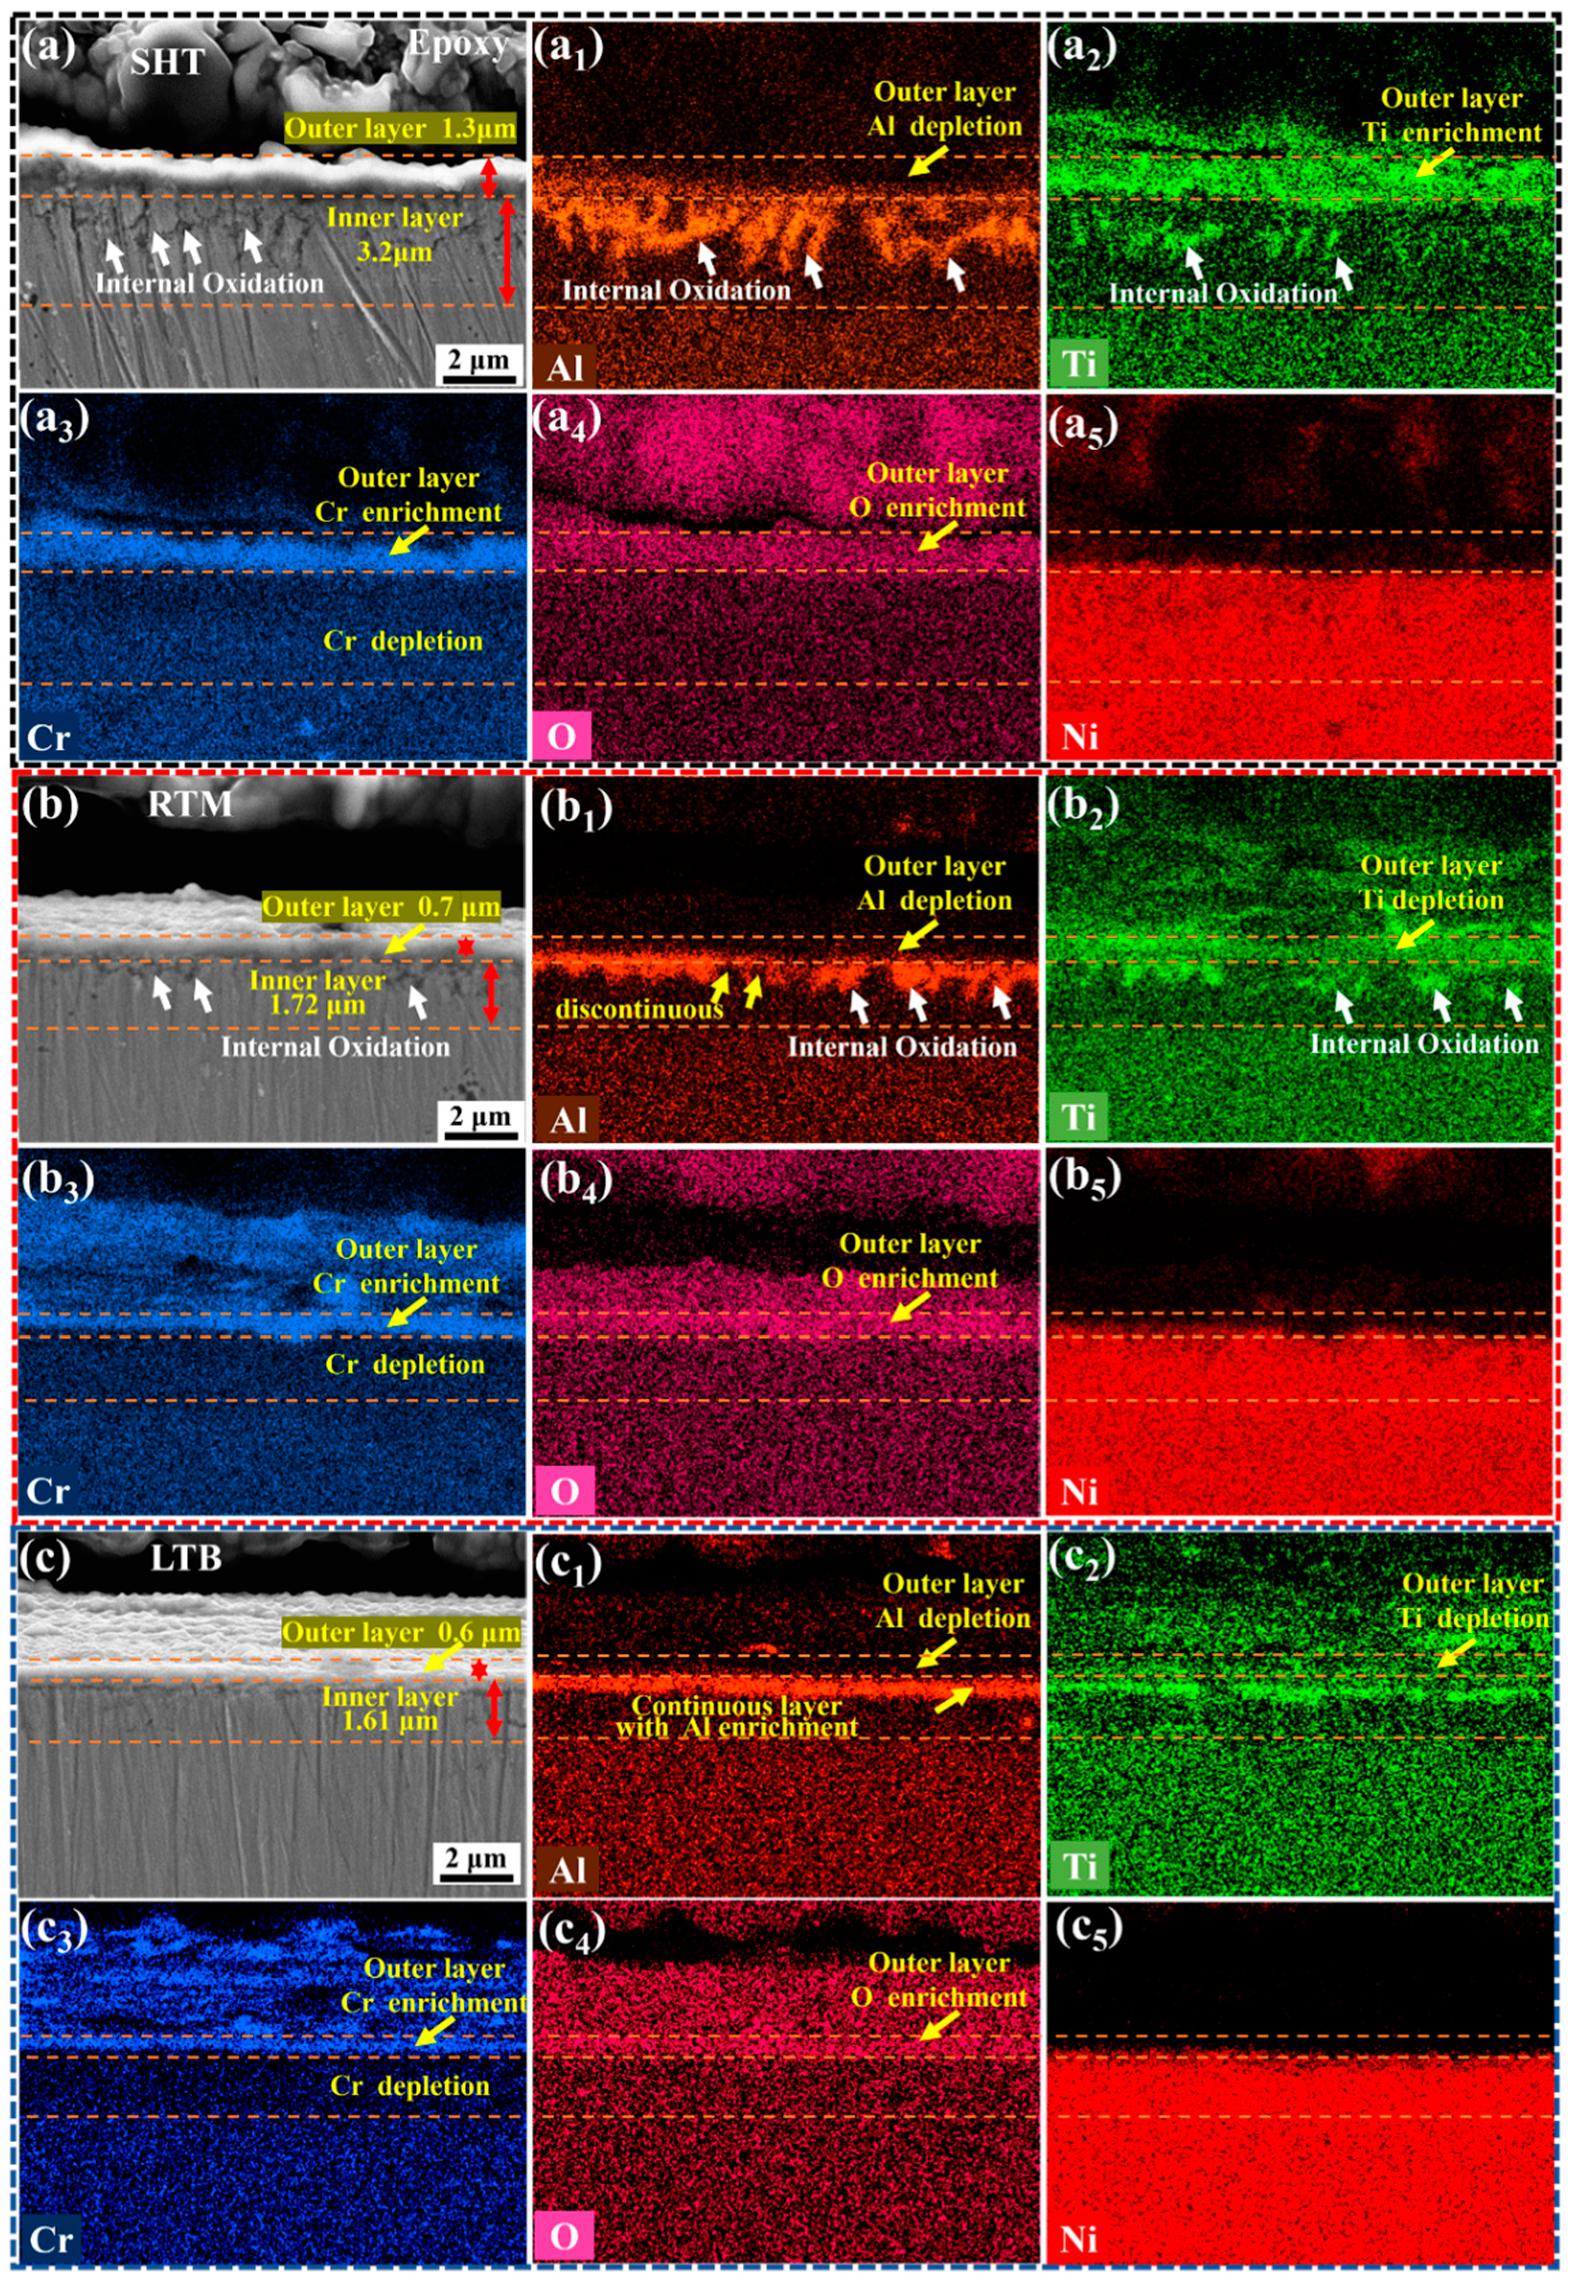
3.5. Cross-Section Microstructure and Composition Distribution of Oxide Scales

In order to further investigate the oxidation mechanism of GH738 superalloy, it is important to analyze the cross-section morphology of the oxide layer. Figure 7 shows the cross-section morphology and EDS elemental mappings of SHT, RTM, and LTB specimens after oxidation at 700 °C for 100 h. It can be seen that the oxide scales of specimens consist of two layers: a continuous outer oxide layer and an inner oxide layer.
Figure 7a shows the cross-section morphology and EDS elemental mappings of the SHT specimen. The thicknesses of the outer and inner oxide layers are approximately 1.3 μm and 3.2 μm, respectively. EDS elemental mapping in Figure 7a1–a4 shows that Cr, O, and Ti are rich in the outer oxide layer to form Cr2O3 and TiO2, while a small amount of Al2O3 forms beneath the outer oxide layer. It can be known from Ellingham diagram that Cr oxidizes at higher oxygen partial pressure than Al. As a result of this, Cr2O3 forms at the outer layer and Al2O3 forms beneath the outer layer [51]. Furthermore, the inner oxide layer shows severe internal oxidation (rich-Al,Ti oxides) (labeled by the white arrow) which occurs along the grain boundaries with a depth of about 3 μm. However, the depth of internal oxidation in RTM specimen is about 1μm, lower than that of the SHT specimen (Figure 7b).
Figure 7b shows the cross-section morphology and EDS elemental mappings of the RTM specimen. The thickness of the outer oxide layer is about 0.7 μm, while that of the inner oxide layer is about 1.72 μm. Figure 7b1–b4 show that the outer oxide layer is mainly rich in Cr and O to form Cr2O3. Al is more continuously distributed at the matrix/outer oxide layer interface of RTM specimen than that of SHT specimen. The internal oxidation of RTM specimen is much lower than that of SHT specimen.
Figure 7c shows the cross-section morphology and EDS elemental mappings of LTB specimen. The outer oxide layer of LTB specimen is with a thickness of approximately 0.6 μm and it is enriched with Cr, O, and a small amount of Ti. Combined with XRD pattern in Figure 5 and EDS results in Figure 6i, it is found that lots of Cr2O3 and minor amount of TiO2 are formed on the surface of LTB specimen. Furthermore, Figure 7c1 shows that a dense and continuous Al2O3 layer has formed at the interface between matrix and the outer oxide layer. Therefore, no obvious internal oxidation is found. Moreover, the continuous protective Al2O3 layer is strongly adhered to the superalloy and suppresses the outward diffusion of Ti and inward diffusion of O [6], which significantly improves the oxidation resistance of LTB specimen.

3.6. High Temperature Oxidation Mechanism of GH738 Superalloy

Figure 8 illustrates the oxidation mechanism of the GH738 superalloy. It is found that low temperature burnished GH738 superalloy produces a continuous and dense Al2O3 layer at the interface between outer oxide layer and matrix, which improves the high temperature oxidation resistance.
Figure 8a is the OM image of the SHT specimen. Furthermore, Figure 8b,c are the TEM images of the RTM and LTB specimens, respectively. Figure 8d–f shows the model of microstructure of the SHT, RTM, and LTB specimens, respectively. As is shown in Figure 8a–c, the SHT and RTM specimens form single twins while the LTB specimen forms single twins and multiple-fold twins. It is observed that nano-grains have formed on the surface layer of the RTM and LTB specimens, while the surface layer of SHT specimen is composed of coarse grains. Figure 8g–i present the cross-sectional model of the SHT, RTM, and LTB specimens, respectively, after oxidation at 700 °C for 100 h. According to the analysis of Figure 6 and Figure 7, the schematic model (Figure 8g–i) is drawn.
According to the previous results (Figure 4), the order of high temperature oxidation resistance is LTB specimen > RTM specimen > SHT specimen. The possible reasons can be described as follows.
During high temperature oxidation of alloys, the relative diffusion rate of metal elements depends on several factors, including the Gibbs free energy of formation of the oxide, kinetics, and microstructure (grain size and crystal defects) [57,58]. Although, according to the thermodynamics data, the Gibbs free energy of the formation of Al2O3 (ΔGΘ = −935.12 kJ/mol) is the most negative, comparing with that of TiO2 (ΔGΘ = −764.35 kJ/mol) and Cr2O3 (ΔGΘ = −575.45 kJ/mol) [59], a continuous Al2O3 layer could not form due to the content of Al being lower than the critical concentration required to form a continuous Al2O3 layer [60] in the SHT specimen. The Cr content (19.31 wt. %) is much higher than that of Ti (3.13 wt. %) in the GH738 superalloy. Therefore, from the viewpoint of kinetics, the growth rate of Cr2O3 is higher than that of TiO2, which results in the fast formation of Cr2O3 in the outer oxide layer. In the meantime, TiO2 grows not only in the outer oxide layer but also at the outer oxide layer/air interface due to the outward diffusion of Ti through Cr2O3 [59,61] (Figure 8g). The island TiO2 forms a loose oxide layer on the top surface of outer oxide layer (Figure 8g). It can be inferred that the loose outer oxide layer provides paths for the inward diffusion of O and makes severe internal oxidation [8].
After RTM processing, coarse grains (~105 μm) on the top surface of GH738 have been refined to nano-grains (~22 nm) and lots of nano-twins are produced, which makes the surface energy of the superalloy is high [34]. The nano-grained structure produces a high density of grain boundaries (GBs). The high density of GBs and nano-twins provide more diffusion paths for Cr, Al and Ti [62,63]. The Cr diffusion is faster along grain boundary than through matrix [51], which may result in the relatively compact and continuous Cr2O3 layer formed on the surface of RTM specimen. The outer oxide layer of RTM specimen is thinner and denser than that of SHT specimen (Figure 7a,b). It is speculated that the relatively compact and continuous Cr2O3 layer inhibits the inward diffusion of O and outward diffusion of Ti, which makes the content of TiO2 decrease in the outer oxide layer (Figure 6f and Figure 8h).
As shown in Figure 8g–i, in LTB specimen, a continuous Al2O3 layer is formed at the interface between the matrix and outer oxide layer, while the continuous Al2O3 layer does not form in the SHT and RTM specimens. This may be the main reason why the LTB specimen has the best high temperature oxidation resistance. Nano-grains and a large amount of single nano-twins and multiple nano-twins have been produced by LTB. Although, the average grain size of the LTB specimen is almost the same as that of RTM specimen, the twins density of LTB specimen is higher than that of RTM specimen for 127.73%. The higher twins density adds more diffusion paths for Cr, which may promote the formation of a more compact and continuous Cr2O3 layer on the surface of the LTB specimen (Figure 8i). In the meantime, the higher twins density promotes Al diffusion outward from the matrix and a continuous Al2O3 layer forms. The effective diffusion rates of O and metal elements through a continuous Al2O3 scale are relatively low [6,64], which improves the oxidation resistance of the LTB specimen. According to the above analysis, it is known that high temperature oxidation resistance of GH738 superalloy has been significantly improved by LTB processing.

4. Conclusions

The effects of RTM and LTB processing on surface microstructures and high temperature oxidation resistance of GH738 superalloys are investigated. The main conclusions can be summarized as follows:
(1) After oxidation for 100 h at 700 °C, the average mass gain of the SHT specimen is 0.3 (mg/cm2h), clearly higher than that of the RTM specimen for 45.45% and LTB specimen for 172.73%, which indicates that the LTB specimen has the best oxidation resistance. Surface treatment techniques (RTM, LTB) could not change the phase constitution of surface oxidation product, but they induce some differences in morphologies. The oxidation products on the surface of the SHT, RTM, and LTB specimens mainly consist of Cr2O3 and TiO2.
(2) Nanocrystalline surface layer is successfully obtained by RTM. The coarse grains on the top surface of RTM specimen have been refined to nano-grains (22.01 nm) which produces a higher density of grain boundaries than that of SHT specimen. Lots of single nano-twins also have formed on the top surface of RTM specimen. The twins density of RTM specimen (8.87 × 10¹³ number/m2) is higher than that of SHT specimen (3.81 × 10⁹ number/m2). The higher density of grain boundaries and twins density can provide more fast diffusion paths for Cr to form a dense and protective Cr2O3 layer whose average thickness is 0.7 μm, clearly thinner than that of SHT specimen. The dense and protective Cr2O3 layer inhibits Ti diffuse outward, O diffuse inward, and then makes the high temperature oxidation resistance of the RTM specimen better than that of the SHT specimen.
(3) Nano-grains (21.2 nm) and large amounts of single nano-twins and multiple nano-twins have been produced by LTB. Although the grain size of LTB specimen is almost the same as that of RTM specimen, the twins density of LTB specimen (2.02 × 10¹⁴ number/m2) is higher than that of RTM specimen (8.87 × 10¹³ number/m2) for 127.73%. The higher twins density provides more diffusion paths for Cr, which promote the formation of more compact continuous Cr2O3 layer. In the meantime, a continuous Al2O3 layer forms at the interface between matrix and out oxide layer in the LTB specimen. The continuous protective Cr2O3 and Al2O3 layer can further inhibit Ti diffusion outward and O diffusion inward, thus decreasing the oxidation rate of LTB specimen. Therefore, LTB significantly improves the high temperature oxidation resistance of GH738. The LTB specimen has the best high temperature oxidation resistance compared with SHT and RTM specimens. In the near future, nickel-based superalloy GH738 treated by LTB may be used for the blades and disks of industrial jet engines and gas turbines to improve their high temperature oxidation resistance in harsh environment.

Author Contributions

W.M.: conceptualization, methodology, investigation, data curation, writing—review and editing; H.L.: project administration, writing—review and editing; X.Y.: resources supervision. All authors have read and agreed to the published version of the manuscript.

Funding

This work is financially supported by National Key Research and Development Program of China (2017YFF0210002) and National Natural Science Foundation of China (No. U1537212).

Conflicts of Interest

The authors declare no conflict of interest.

References

  1. Xu, R.F.; Zhou, Y.X.; Li, X.; Yang, S.L.; Han, K.N.; Wang, S.J. The effect of milling cooling conditions on the surface integrity and fatigue behavior of the GH4169 superalloy. Metals 2019, 9, 1179. [Google Scholar] [CrossRef] [Green Version]
  2. Chen, G.; Zhang, Y.; Xu, D.K.; Lin, Y.C.; Chen, X. Low cycle fatigue and creep-fatigue interaction behavior of nickel-base superalloy GH4169 at elevated temperature of 650 °C. Mater. Sci. Eng. A 2016, 655, 175–182. [Google Scholar] [CrossRef]
  3. Wu, D.L.; Jiang, S.M.; Fan, Q.X.; Gong, J.; Sun, C. Hot corrosion behavior of a Cr-modified aluminide coating on a Ni-based superalloy. Acta Metall. Sin. (Engl. Lett.) 2014, 27, 627–634. [Google Scholar] [CrossRef]
  4. El-Awadi, G.A.; Abdel-Samad, S.; Elshazly, E.S. Hot corrosion behavior of Ni based Inconel 617 and Inconel 738 superalloys. Appl. Surf. Sci. 2016, 378, 224–230. [Google Scholar] [CrossRef]
  5. Mahobia, G.S.; Paulose, N.; Singh, V. Hot corrosion behavior of superalloy IN718 at 550 and 650 °C. J. Mater. Eng. Perform. 2013, 22, 2418–2435. [Google Scholar] [CrossRef]
  6. Cho, S.H.; Kwon, S.C.; Kim, D.Y.; Choi, W.S.; Kim, Y.S.; Lee, J.H. Hot corrosion behaviour of nickel-cobalt-based alloys in a lithium molten salt. Corros. Sci. 2019, 151, 20–26. [Google Scholar] [CrossRef]
  7. Pradhan, D.; Mahobia, G.S.; Chattopadhyay, K.; Singh, V. Salt induced corrosion behaviour of superalloy IN718. Mater. Today Proc. 2018, 5, 7047–7054. [Google Scholar] [CrossRef]
  8. Zhao, L.H.; Tan, Y.; Shi, S.; Zhuang, X.P.; Niu, S.Q.; You, Q.F.; Wang, Y.N. High temperature oxidation behavior of electron beam smelted K417 superalloy. Vacuum 2019, 170, 108979. [Google Scholar] [CrossRef]
  9. Cao, J.D.; Zhang, J.S.; Chen, R.F.; Ye, Y.X.; Hua, Y.Q. High temperature oxidation behavior of Ni-based superalloy GH202. Mater. Charact. 2016, 118, 122–128. [Google Scholar] [CrossRef]
  10. Cao, J.D.; Zhang, J.S.; Hua, Y.Q.; Rong, Z.; Chen, F.R.; Ye, Y.X. High temperature oxidation behavior of Ni-based superalloy GH586 in air. Rare Met. 2017, 36, 878–885. [Google Scholar] [CrossRef]
  11. Park, S.J.; Seo, S.M.; Yoo, Y.S.; Jeong, H.W.; Jang, H.J. Effects of Cr, W, and Mo on the high temperature oxidation of Ni-based superalloys. Materials 2019, 12, 2934. [Google Scholar] [CrossRef] [PubMed] [Green Version]
  12. Zhou, W.F.; Ren, X.D.; Yang, Y.; Tong, Z.P.; Chen, L. Tensile behavior of nickel with gradient microstructure produced by laser shock peening. Mater. Sci. Eng. A 2020, 771, 138603. [Google Scholar] [CrossRef]
  13. Li, X.G.; Lu, L.; Li, J.G.; Zhang, X.; Gao, H.J. Mechanical properties and deformation mechanisms of gradient nanostructured metals and alloys. Nat. Rev. Mater. 2020, 5, 706–723. [Google Scholar] [CrossRef]
  14. Tong, Z.P.; Ren, X.D.; Ren, Y.P.; Dai, F.Z.; Ye, Y.X.; Zhou, W.F. Effect of laser shock peening on microstructure and hot corrosion of TC11 alloy. Surf. Coat. Technol. 2018, 335, 32–40. [Google Scholar] [CrossRef]
  15. Lu, J.Z.; Luo, K.Y.; Yang, D.K.; Cheng, X.N.; Hu, J.L.; Dai, F.Z. Effects of laser peening on stress corrosion cracking (SCC) of ANSI 304 austenitic stainless steel. Corros. Sci. 2012, 60, 145–152. [Google Scholar] [CrossRef]
  16. Tao, N.R.; Wang, Z.B.; Tong, W.P.; Sui, M.L.; Lu, J.; Lu, K. An investigation of surface nanocrystallization mechanism in Fe induced by surface mechanical attrition treatment. Acta Mater. 2002, 50, 4603–4616. [Google Scholar] [CrossRef]
  17. Wen, L.; Wang, Y.M.; Zhou, Y.; Guo, L.X.; Ouyang, J.H. Microstructure and corrosion resistance of modified 2024 Al alloy using surface mechanical attrition treatment combined with microarc oxidation process. Corros. Sci. 2011, 53, 473–480. [Google Scholar] [CrossRef]
  18. Chan, H.L.; Ruan, H.H.; Chen, A.Y.; Lu, J. Optimization of the strain rate to achieve exceptional mechanical properties of 304 stainless steel using high speed ultrasonic surface mechanical attrition treatment. Acta Mater. 2010, 58, 5086–5096. [Google Scholar] [CrossRef]
  19. Huang, H.W.; Wang, Z.B.; Lu, J.; Lu, K. Fatigue behaviors of AISI 316L stainless steel with a gradient nanostructured surface layer. Acta Mater. 2015, 87, 150–160. [Google Scholar] [CrossRef]
  20. Li, W.L.; Tao, N.R.; Lu, K. Fabrication of a gradient nano-micro-structured surface layer on bulk copper by means of a surface mechanical grinding treatment. Scr. Mater. 2008, 59, 546–549. [Google Scholar] [CrossRef]
  21. Fang, T.H.; Li, W.L.; Tao, N.R.; Lu, K. Revealing extraordinary intrinsic tensile plasticity in gradient nano-grained copper. Science 2011, 331, 1587–1590. [Google Scholar] [CrossRef] [PubMed] [Green Version]
  22. Zhang, C.H.; Song, G.D.; Wang, Y.M.; Zheng, M.; Xiao, G.Z.; Yang, J. Effect of surface nanocrystallization on fatigue crack initiation and propagation behavior in pure Zr. Mater. Sci. Eng. A 2020, 794, 139831. [Google Scholar] [CrossRef]
  23. Swaminathan, S.; Ravi, S.M.; Rao, B.C.; Compton, W.D.; Chandrasekar, S.; King, A.H.; Trumble, K.P. Severe plastic deformation (SPD) and nanostructured materials by machining. J. Mater. Sci. 2007, 42, 1529–1541. [Google Scholar] [CrossRef]
  24. Tang, J.; Luo, H.Y.; Guo, J.J.; Lv, J.L.; Zhang, Z.; Ma, Y. Effects of nano-grains and deformation nano-twins on electrochemical corrosion behavior of DZ125 nickel-based superalloy. Adv. Eng. Mater. 2018, 20, 1800279. [Google Scholar] [CrossRef]
  25. Tang, J.; Luo, H.Y.; Qi, Y.M.; Xu, P.W.; Lv, J.L.; Ma, Y.; Zhang, Z. Effect of nano-scale martensite and β phase on the passive film formation and electrochemical behaviour of Ti-10V-2Fe-3Al alloy in 3.5% NaCl solution. Electrochim. Acta 2018, 283, 1300–1312. [Google Scholar] [CrossRef]
  26. Maamoun, A.H.; Elbestawi, M.A.; Veldhuis, S.C. Influence of shot peening on AlSi10Mg parts fabricated by additive manufacturing. J. Manuf. Mater. Process. 2018, 2, 40. [Google Scholar] [CrossRef] [Green Version]
  27. Estrin, Y.; Beygelzimer, Y.; Kulagin, R. Design of architectured materials based on mechanically driven structural and compositional patterning. Adv. Eng. Mater. 2019, 21, 1900487. [Google Scholar] [CrossRef]
  28. Zhou, L.C.; Long, C.B.; He, W.F.; Tian, L.; Jia, W.T. Improvement of high-temperature fatigue performance in the nickel-based alloy by LSP-induced surface nanocrystallization. J. Alloys Compd. 2018, 744, 156–164. [Google Scholar] [CrossRef]
  29. Cao, J.D.; Zhang, J.S.; Hua, Y.Q.; Chen, R.F.; Ye, Y.X. Improving the high temperature oxidation resistance of Ni-based superalloy GH202 induced by laser shock processing. J. Mater. Process. Technol. 2017, 243, 31–39. [Google Scholar] [CrossRef]
  30. Xia, Z.X.; Zhang, C.; Huang, X.F.; Liu, W.B.; Yang, Z.G. Improve oxidation resistance at high temperature by nanocrystalline surface layer. Sci. Rep. 2015, 5, 13027. [Google Scholar] [CrossRef]
  31. Jelliti, S.; Richard, C.; Retraint, D.; Roland, T.; Chemkhi, M.; Demangel, C. Effect of surface nanocrystallization on the corrosion behavior of Ti–6Al–4V titanium alloy. Surf. Coat. Technol. 2013, 224, 82–87. [Google Scholar] [CrossRef]
  32. Ren, N.F.; Yang, H.M.; Yuan, S.Q.; Wang, Y.; Tang, S.X.; Zheng, L.M.; Ren, X.D.; Dai, F.Z. High temperature mechanical properties and surface fatigue behavior improving of steel alloy via laser shock peening. Mater. Des. 2014, 53, 452–456. [Google Scholar] [CrossRef]
  33. Altenberger, I.; Nalla, R.K.; Sano, Y.J.; Wagner, L.; Ritchie, R.O. On the effect of deep-rolling and laser-peening on the stress-controlled low- and high-cycle fatigue behavior of Ti–6Al–4V at elevated temperatures up to 550 °C. Int. J. Fatigue 2012, 44, 292–302. [Google Scholar] [CrossRef]
  34. Hua, Y.Q.; Rong, Z.; Ye, Y.X.; Chen, K.M.; Chen, R.F.; Xue, Q. Laser shock processing effects on isothermal oxidation resistance of GH586 superalloy. Appl. Surf. Sci. 2015, 330, 439–444. [Google Scholar] [CrossRef]
  35. Tan, L.; Ren, X.; Sridharan, K.; Allen, T.R. Effect of shot-peening on the oxidation of alloy 800H exposed to supercritical water and cyclic oxidation. Corros. Sci. 2008, 50, 2040–2046. [Google Scholar] [CrossRef]
  36. Wu, M.Y.; Chen, M.H.; Zhu, S.L.; Wang, F.H. Effect of sand blasting on oxidation behavior of K38G superalloy at 1000 °C. Corros. Sci. 2015, 92, 256–262. [Google Scholar] [CrossRef]
  37. Caudill, J.; Huang, B.; Arvin, C.; Schoop, J.; Meyer, K.; Jawahir, I.S. Enhancing the surface integrity of Ti-6Al-4V alloy through cryogenic burnishing. Procedia CIRP 2014, 13, 243–248. [Google Scholar] [CrossRef] [Green Version]
  38. Tang, J.; Luo, H.Y.; Zhang, Y.B. Enhancing the surface integrity and corrosion resistance of Ti-6Al-4V titanium alloy through cryogenic burnishing. Int. J. Adv. Manuf. Technol. 2016, 88, 2785–2793. [Google Scholar] [CrossRef]
  39. Pu, Z.; Yang, S.; Song, G.L.; Dillon, O.W.; Puleo, D.A.; Jawahir, I.S. Ultrafine-grained surface layer on Mg-Al-Zn alloy produced by cryogenic burnishing for enhanced corrosion resistance. Scr. Mater. 2011, 65, 520–523. [Google Scholar] [CrossRef]
  40. Altenberger, I.; Stach, E.A.; Liu, G.; Nalla, R.K.; Ritchie, R.O. An in situ transmission electron microscope study of the thermal stability of near-surface microstructures induced by deep rolling and laser-shock peening. Scr. Mater. 2003, 48, 1593–1598. [Google Scholar] [CrossRef]
  41. Lv, J.L.; Luo, H.Y. Effect of surface burnishing on texture and corrosion behavior of 2024 aluminum alloy. Surf. Coat. Technol. 2013, 235, 513–520. [Google Scholar]
  42. Luo, H.Y.; Liu, J.Y.; Wang, L.J.; Zhong, Q.P. Investigation of the burnishing process with PCD tool on non-ferrous metals. Int. J. Adv. Manuf. Technol. 2004, 25, 454–459. [Google Scholar] [CrossRef]
  43. Nouduru, S.K.; Kumar, M.K.; Kain, V.; Khanna, A.S.; Saibaba, N.; Dey, G.K. High temperature and high pressure oxidation behavior of Zr-2.5Nb pressure tube material—Effect of β phase composition and surface machining. J. Nucl. Mater. 2016, 470, 197–207. [Google Scholar] [CrossRef]
  44. Tang, J.; Luo, H.Y.; Qi, Y.M.; Xu, P.W.; Ma, S.; Zhang, Z. The effect of cryogenic burnishing on the formation mechanism of corrosion product film of Ti-6Al-4V titanium alloy in 0.9% NaCl solution. Surf. Coat. Technol. 2018, 345, 123–131. [Google Scholar] [CrossRef]
  45. Xu, P.W.; Luo, H.Y.; Han, Z.Y.; Zou, J. Tailoring a gradient nanostructured age-hardened aluminum alloy using high-gradient strain and strain rate. Mater. Des. 2015, 85, 240–247. [Google Scholar] [CrossRef]
  46. Lou, S.; Li, Y.; Zhou, L.; Nie, X.; He, G.; Li, Y. Surface nanocrystallization of metallic alloys with different stacking fault energy induced by laser shock processing. Mater. Des. 2016, 104, 320–326. [Google Scholar] [CrossRef]
  47. Meng, G.Z.; Li, Y.; Shao, Y.W.; Zhang, T.; Wang, Y.Q.; Wang, F.H.; Cheng, X.Q.; Dong, C.F.; Li, X.G. Effect of microstructures on corrosion behavior of nickel coatings: (II) Competitive effect of grain size and twins density on corrosion behavior. J. Mater. Sci. Technol. 2016, 32, 465–469. [Google Scholar] [CrossRef]
  48. Wang, K.; Tao, N.R.; Liu, G.; Lu, J.; Lu, K. Plastic strain-induced grain refinement at the nanometer scale in copper. Acta Mater. 2006, 54, 5281–5291. [Google Scholar] [CrossRef]
  49. Ren, X.D.; Zhou, W.F.; Ren, Y.P.; Xu, S.D.; Liu, F.F.; Yuan, S.Q. Dislocation evolution and properties enhancement of GH2036 by laser shock processing: Dislocation dynamics simulation and experiment. Mater. Sci. Eng. A 2016, 654, 184–192. [Google Scholar] [CrossRef]
  50. Fan, Q.X.; Peng, X.; Yu, H.J.; Jiang, S.M.; Gong, J.; Sun, C. The isothermal and cyclic oxidation behaviour of two Co modified aluminide coatings at high temperature. Corros. Sci. 2014, 84, 42–53. [Google Scholar] [CrossRef]
  51. Athreya, C.N.; Deepak, K.; Kim, D.I.; Boer, D.B.; Mandal, S.; Sarma, S.V. Role of grain boundary engineered microstructure on high temperature steam oxidation behaviour of Ni based superalloy alloy 617. J. Alloys Compd. 2019, 778, 224–233. [Google Scholar] [CrossRef]
  52. Park, S.J.; Seo, S.M.; Yoo, Y.S.; Jeong, H.W.; Jang, H. Effects of Al and Ta on the high temperature oxidation of Ni-based superalloys. Corros. Sci. 2015, 90, 305–312. [Google Scholar] [CrossRef]
  53. Chen, M.H.; Shen, M.L.; Zhu, S.L.; Wang, F.H.; Wang, X.L. Effect of sand blasting and glass matrix composite coating on oxidation resistance of a nickel-based superalloy at 1000 °C. Corros. Sci. 2013, 73, 331–341. [Google Scholar] [CrossRef]
  54. Liu, P.S.; Liang, K.M.; Gu, S.R. High-temperature oxidation behavior of aluminide coatings on a new cobalt-base superalloy in air. Corros. Sci. 2001, 43, 1217–1226. [Google Scholar] [CrossRef]
  55. Maamoun, A.H.; Elbestawi, M.; Dosbaeva, G.K.; Veldhuis, S.C. Thermal post-processing of AlSi10Mg parts produced by selective laser melting using recycled powder. Addit. Manuf. 2018, 21, 234–247. [Google Scholar] [CrossRef]
  56. Langford, J.I.; Wilson, A.J.C. Scherrer after sixty years A survey and some new results in the determination. J. Appl. Cryst. 1978, 11, 102–113. [Google Scholar] [CrossRef]
  57. Kang, Y.J.; Yang, S.S.; Kima, Y.K.; AlMangour, B.; Lee, K.A. Effect of post-treatment on the microstructure and high-temperature oxidation behaviour of additively manufactured inconel 718 alloy. Corros. Sci. 2019, 158, 108082. [Google Scholar] [CrossRef]
  58. Niu, J.M.; Wang, W.; Zhu, S.L.; Wang, F.H. The scaling behavior of sputtered Ni3Al coatings with and without Pt modification. Corros. Sci. 2012, 58, 115–120. [Google Scholar] [CrossRef]
  59. Zheng, L.; Zhang, M.C.; Dong, J.X. Oxidation behavior and mechanism of powder metallurgy Rene95 nickel based superalloy between 800 and 1000 °C. Appl. Surf. Sci. 2010, 256, 7510–7515. [Google Scholar] [CrossRef]
  60. Nijdam, T.J.; Jeurgens, L.P.H.; Sloof, W.G. Promoting exclusive α-Al2O3 growth upon high-temperature oxidation of NiCrAl alloys: Experiment versus model predictions. Acta Mater. 2005, 53, 1643–1653. [Google Scholar] [CrossRef]
  61. Abe, F.; Araki, H.; Yoshida, H.; Okada, M. The role of Aluminiu and Titanium on the oxidation process of a nickel-based superalloy in steam at 800. Oxid. Met. 1987, 27, 21–36. [Google Scholar] [CrossRef]
  62. Wang, Z.B.; Tao, N.R.; Tong, W.P.; Lu, J.; Lu, K. Diffusion of chromium in nanocrystalline iron produced by means of surface mechanical attrition treatment. Acta Mater. 2003, 51, 4319–4329. [Google Scholar] [CrossRef]
  63. Jiang, L.; Fu, C.T.; Leng, B.; Jia, Y.Y.; Ye, X.X.; Zhang, W.Z. Influence of grain size on tellurium corrosion behaviors of GH3535 alloy. Corros. Sci. 2019, 148, 110–122. [Google Scholar] [CrossRef]
  64. Prescott, R.; Graham, M.J. The formation of aluminum oxide scales on high-temperature alloys. Oxid. Met. 1992, 38, 233–254. [Google Scholar] [CrossRef]
Figure 1. The schematic of high temperature oxidation: (a) solution heat treatment process; (b) solution heat treated specimen; (c) room temperature machining processing; (d) low temperature burnishing processing; (e) specimen cutting.
Materials 13 04166 g001
Figure 2. Optical Microscopy observations of the solution heat treated (SHT) specimen and TEM observations of the room temperature machining (RTM) and low temperature burnishing (LTB) specimen surfaces: (a,b) OM image and the grain size distribution of the topmost layer on the SHT specimen; (c,d) bright-field TEM image and the grain size distribution of the topmost layer on the RTM specimen; (c1,c2) the selected area electron diffraction pattern and dark-field TEM image of the topmost layer on the RTM specimen; (e,f) bright-field TEM image and the grain size distribution of the topmost layer on the LTB specimen; (e1,e2) the selected area electron diffraction pattern and dark-field TEM image of the topmost layer on the LTB specimen.
Materials 13 04166 g002
Figure 3. The different scales of twins in (a) the SHT specimen; (b) the RTM specimen; and (c) the LTB specimen and (d) the twins density.
Materials 13 04166 g003
Figure 4. The oxidation kinetic curves of SHT, RTM, and LTB specimens at 700 °C. (a) Mass gain versus oxidation time; (b) mass gain square versus oxidation time.
Materials 13 04166 g004
Figure 5. (af) XRD patterns of oxidation product; (g) XRD patterns of GH738 specimens under different surface treated and (h) FWHM values of (111) peak of SHT, RTM, and LTB specimens.
Materials 13 04166 g005
Figure 6. Surface morphology after high temperature oxidation of 100 h and results of EDS: (ac) SHT specimen; (df) RTM specimen; and (gi) LTB specimen.
Materials 13 04166 g006
Figure 7. The cross-sectional images and EDS elemental mappings for different specimens after oxidation at 700 °C for 100 h: (a) SHT specimen; (a1a5) Al, Ti, Cr, O and Ni mapping in the cross-section of SHT specimen, respectively; (b) RTM specimen; (b1b5) Al, Ti, Cr, O and Ni mapping in the cross-section of RTM specimen, respectively; and (c) LTB specimen; (c1c5) Al, Ti, Cr, O and Ni mapping in the cross-section of LTB specimen, respectively.
Materials 13 04166 g007
Figure 8. (ac) The twins in the specimens of SHT, RTM, and LTB, respectively; (df) the model of twins in the specimens of SHT, RTM, and LTB, respectively; (gi) the cross-section model after oxidation at 700 °C for 100 h of SHT, RTM, and LTB specimens, respectively.
Materials 13 04166 g008
Table 1. Chemical composition of GH738 (wt.%).
CCoAlFeMoBCrTiMgNi
0.0413.251.460.24.380.00619.313.130.006Balance

