Abstract
Epoxy resin-based nanocomposites have been widely researched for being potential insulating materials in high voltage power equipment. In this paper, nano-TiO2 particles were chosen and surface-modified by a silane coupling agent containing an epoxy group. The effect of functionalized nano-TiO2 doping on the physical properties of epoxy resin was studied. The results of differential scanning calorimetry show that Tg increased significantly and can be increased by up to 35 °C. Therefore, it is believed that the suppression of molecular motion by the addition of nanofillers works effectively in the case of this functionalized nano-TiO2 and a strong interaction between the epoxy resin and the nano-TiO2 was formed after surface modification. Consequently, dynamic mechanical properties, thermal conductivity, electrical conductivity, and trap characteristics of epoxy resin are all adjusted after introducing functionalized nano-TiO2. All of these physical properties were analyzed from the perspective of suppression of molecular motion, and it is of significance to establish the theory of a nanocomposite dielectric. Besides, the results show that the epoxy/TiO2 nanocomposite is expected to be applied in the insulation system of electrical equipment.
1. Introduction
The epoxy resin insulating system is widely used in high voltage insulators, transformers, cable terminations, bushings, power apparatus and so on. Epoxy resin-based nanocomposites used as a new generation of dielectric materials in power equipment have been extensively researched for more than ten years, and many modified physical properties have been obtained and analyzed from different aspects. However, we still need more detailed data and analysis to enrich the theoretical system of epoxy resin-based nanocomposites for a lot of fundamental questions have not been answered.
Glass transition temperature (Tg) of an epoxy resin-based nanocomposite, the most basic parameter, is determined by the preparation process and surface modification of the doping nanoparticles. Based on reported results, the introduction of silane coupling agents-modified nano-SiO2 decrease the Tg of epoxy resin according to the loss factor of mechanical modulus [1]. Similar results of decreased Tg have been reported about nano-Al2O3 [2,3,4,5], nano-TiO2 [3,6], nano-ZnO [7], and nano-MgO [8] fillers. There have been similar reports of increased Tg, although the same kind of nanofiller was used. As reported, Tg of epoxy resin was increased by 8 °C with the incorporation of 1 wt.% TiO2 nanoparticles surface modified with gallic acid esters [9]. The introduction of nano-SiO2 modified by poly(propylene glycol)bis(2-aminopropyl ether) can increase the Tg slightly, no more than 6 °C [10]. There are few reports indicating that a composite metal-oxide nanofiller has led to a significant increase in Tg of epoxy resins. In terms of engineering application, the existing methods to increase the Tg have limited effect. Above all, there is no consistent conclusion on the effect of metal-oxide nanofiller on the Tg, and it is not very clear how metal-oxide nanofillers affect the movement of the molecular chains in epoxy resin. Besides, Tg is a parameter that reflects not only the glass transition process but also many related physical properties.
In this paper, epoxy/TiO2 nanocomposites were prepared with significantly improved Tg. The effect of functionalized nano-TiO2 on the motion of molecular chains was analyzed. The properties related to molecular motion were investigated for a better understanding of the internal principle in an epoxy resin-based nanocomposite dielectric.
2. Materials and Methods
2.1. Materials
The studied epoxy resin was a bisphenol-A resin (E51). As a curing agent methyl, tetrahydrophthalic anhydride hardener (MTHPA) was used at 80 phr. Tris (dimethylaminomethyl) phenol (DMP-30) was used as an accelerator at 1.5 phr. For nano-fillers, highly pure grades of commercial particles of rutile titanium dioxide (TiO2, the average diameter of 25 nm) were added by the weight ratio. γ-(2,3-epoxypropoxy) propytrimethoxy silane (KH560) was used as a coupling agent for surface modification of TiO2 particles. The samples prepared were unfilled sheets of epoxy resin and four kinds of epoxy/nanocomposites which contain 0.1 wt.%, 1 wt.%, 3 wt.% and 5 wt.% addition of TiO2 nanoparticles.
2.2. Fabrication of Epoxy Nanocomposites
Nanoparticles need to be well dispersed and distributed in a matrix for better unleashing potential. To reduce the agglomeration and improve the good adhesion between fillers and matrix, the surface functionalization of nano-TiO2 was performed by a solution mixing method. A moderate amount of nano-TiO2 particles was firstly dispersed in ethanol and then the mixed solution was dispersed using a homogeniser instrument (Stansted Fluid Power LTD., Essex, UK). A Silane coupling agent (KH560) having a mass ratio of 1.5% to the nanoparticles was added to the mixed solution of ethanol and water. Then, two solutions were mixed in a beaker and subjected to ultrasonic vibration for 10 min. Alkoxy group of silane was hydrolyzed to produce silanol, which was connected on the surface of nanoparticles, as shown in Figure 1.
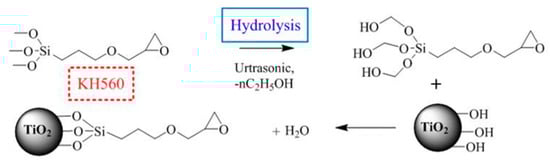
Figure 1.
Reaction of surface functionalization of nano-TiO2 and epoxy curing.
Before the process of preparing epoxy resin specimens, epoxide was pre-heated to 60 °C in an oven to reduce its viscosity then mixed with the epoxy resin in a three-necked, round-bottomed flask. Heating during the stirring process allowed the nanoparticles to be uniformly mixed with the epoxy and evaporated the solvent. The hardener was added into the epoxy/nano-filler solutions and then the mixture was stirred for 15 min. This step was accomplished in a vacuum chamber to remove the gas bubbles. Next, the mixture was poured into the mold and placed into the oven at 80 °C to cure for 2 h, 105 °C to cure for 2 h followed by 4 h at 120 °C.
During the curing process, the mixing functionalized nano-TiO2 particles were connected to the molecular chain of epoxy resin through the crosslinking reactions of epoxy groups. In epoxy/TiO2 nanocomposites, tight reticulate structures connecting epoxy, silane coupling agent, nano-TiO2 and curing agent were formed though a reaction. Neat epoxy as well as functionalized epoxy/TiO2 nanocomposites with weight proportion of 0.1%, 0.5%, 1%, 3% and 5% were prepared. Before experiments, all samples were vacuum dried at 80 °C for 48 h.
2.3. Characterization
A scanning electron microscope (Keyence, Osaka, Japan) was used to verify the uniform dispersion of the nano-TiO2 in the samples. Samples were broken in liquid nitrogen and sputter-coated with gold, and the fracture surface was showed in Figure 2. It can be observed that the fracture surface of neat epoxy resin shows no impurity particles. The fracture surface of the epoxy/TiO2 sample with 5 wt.% presents spherical particles. The nanoparticles were uniformly distributed without the introduction of voids and other defects. From the perspective of flatness, the fracture surface of neat epoxy resin was obviously smoother compared with the nanocomposite sample. For the influence of nano-TiO2 to the mechanical properties of the epoxy resin matrix, the fracture surface represented beach stripes like crack.
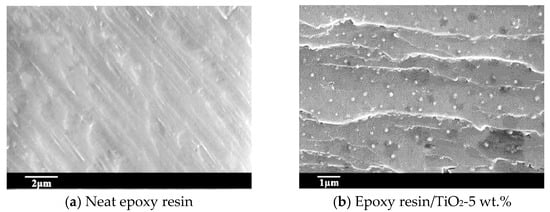
Figure 2.
Micrograph of fracture surface of neat epoxy resin and its nanocomposite. (a) Neat epoxy resin; (b) Epoxy resin/TiO2-5 wt.%.
Tg was measured using Differential Scanning Calorimetry (Mettler Toledo, Zurich, Switzerland). The samples were heated from 20 °C to 200 °C at a rate of 10 °C per minute under nitrogen atmosphere. This cycle was repeated twice for each sample and the second cycle was considered for calculation.
Changes in the viscoelastic properties of the samples were determined by Dynamic mechanical analysis using a DMA 861 analyzer (Mettler Toledo, Zurich, Switzerland). Briefly, samples were subjected to oscillating loading (Force was 3 N and frequency was 1 Hz) under bend load from −90 °C to temperature higher than the peak temperature of the transition (Rate of temperature rise was 3 °C/min).
Thermal conductivity was measured by the laser flash diffusivity instrument (NETZSCH LFA447, Bavaria, Germany) at different temperatures. The samples were 1 mm × 10 mm × 10 mm with a graphite coating surface.
Absorption currents under dc voltage were measured using electrometer (Keithley 6517B, Johnston, IA, USA) and three-electrode system. For the purpose of electrical measurements, gold electrodes were deposited on the sample surface to form additional electrodes. The dc voltage was 500 V and the samples were with the thickness of 1.5 mm.
Surface potential decay (SPD) curves of the samples after charged under dc voltage were obtained to calculate the surface trap parameters [11,12]. Samples with a thickness of 0.5 mm were charged by a needle-mesh electrode (needle electrode and mesh grid were applied with −8 kV and −4 kV) for 3 min, before quickly moved to the Kelvin probe of an electrostatic voltmeter(Trek, New York, NY, USA), and the surface potential was recorded [11].
3. Results
3.1. Glass Transition Temperature
Figure 3a shows DSC spectra. The glass transition process was clear in the temperature range between 80 and 120 °C. In Figure 3a, a black arrow was drawn as a guide for the Tg variation. The Tg increases with the increasing nano-TiO2 content, and it can be estimated to be 81 °C for the neat epoxy sample, and 116 °C, with a remarkable increment, for the sample with 5 wt.% nano-TiO2. The increment was up to 35 °C. Figure 3b gives the relation between Tg and nano-TiO2 content. Tg is directly depending on the property of molecular motion. It obviously indicates that the molecular chain of the nanocomposites needs a higher temperature to undergo the glass transition process, which means that the movement of the molecular chains is inhibited by the doping of functionalized nano-TiO2. As mentioned above, it is meaningful that insulating material used epoxy resin has a relatively high Tg. Compared with the similar reports of nanocomposites, the increment of Tg in this paper is prominent and needs more research. Thus, molecular motion in epoxy/TiO2 nanocomposites and its effects were analyzed from the perspective of several physical properties.
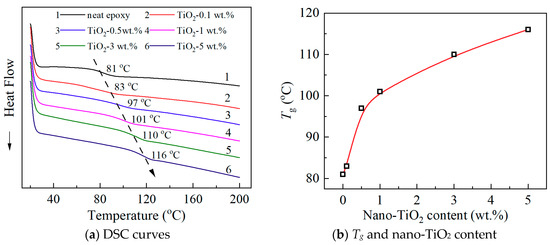
Figure 3.
DSC curves and Tg of neat epoxy and epoxy/TiO2 nanocomposites. (a) DSC curves; (b) Tg and nano-TiO2 content.
3.2. Dynamic Mechanical Analysis
Dynamic mechanical analysis of neat epoxy resin and its nanocomposites at different filler loadings have been carried out in this study to investigate the variation of loss factor (tan δ), which is the ratio of loss modulus and storage modulus and a ratio of viscous to the elastic response. The value of tan δ can be used to analyze the physical property of the interface region in polymer-based nanocomposites. As shown in Figure 4, the peak value of the loss factor gives no obvious change indicating similar viscous behavior. Therefore, damping properties of epoxy resin were not changed, which means the nano-TiO2 filler and the matrix resin are well bonded together, and an interface between the nano-TiO2 filler and the matrix resin is ideal, with no apparent voids and other defects. As shown in Figure 4, the peak temperature of the loss factor increases significantly with the increasing nanofiller content. The right shift of the curves tan δ–T indicated not only the increase of Tg but also the improvement of the crosslinking degree of the materials. By the way, the Tg obtained from the results of dynamic mechanical analysis is different from the DSC results. This is mainly due to the different principles of different test methods, and in addition, the test parameters including the heating rate are also different.
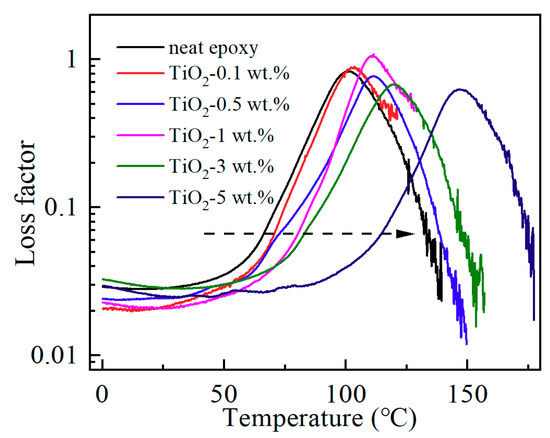
Figure 4.
Loss factor of epoxy/TiO2 samples.
3.3. Thermal Conductivity
Figure 5 shows the thermal conductivity of neat epoxy and epoxy/TiO2 nanocomposites at different temperatures. A distinct broad peak appears at the Tg. This peak was caused by the leap of heat capacity during the glass transition process. As mentioned above, nano-TiO2 introduction obviously increased the Tg, thus the broad peak shifted to the high temperature.
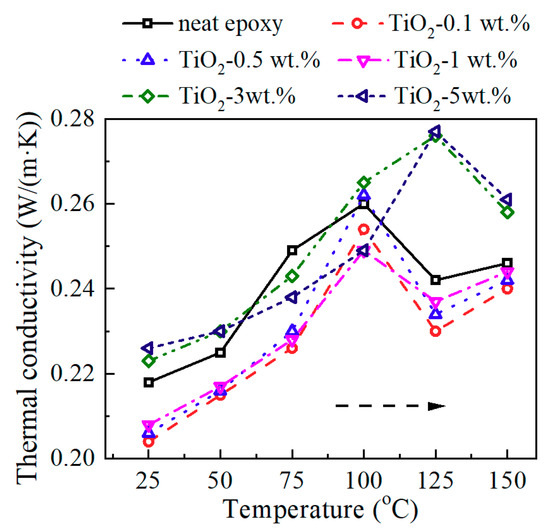
Figure 5.
Thermal conductivity of epoxy/TiO2 samples at different temperature.
Figure 6 shows the relation between thermal conductivity and nanofiller loading content at 25 °C. The thermal conductivity decreased after introducing nano-TiO2, and then it increased with the increasing nano-TiO2 content. The thermal conductivity of the composite depends mainly on the thermal conductivity of the filler and the epoxy resin matrix, the content, and distribution of the filler, as well as the interface between filler and matrix. Since the filler and the matrix are two phases with different thermal conductivities, respectively, this will lead to scattering phenomena of phonons that transmit thermal vibrations, caused by factors such as reflection, refraction, interference, and retardation. These phenomena are like the scattering phenomena of vibration and waves at the two-phase interface with different elastic coefficients. At the same filler content, the fillers with smaller particle sizes have larger specific surface areas. Thus, in composites with nano-sized particles, the phonon scattering at the thermal conduction path will be more severe for more two-phase interface. Therefore, results in Figure 6 can be interpreted in two parts. At relatively low nanofiller content, 0.1 to 1 wt.%, the thermal conductivity of the filler itself did not contribute much to the nanocomposites. Scattering phenomena of phonons at the epoxy/nano-TiO2 interface lead to the decrease of thermal conductivity. At relatively high nanofiller content, 3–5 wt.%, more TiO2 fillers lead to the slight increase of thermal conductivity, for the contribution of the nano-TiO2 filler itself with high thermal conductivity. Of course, it may also include the role of heat transfer channels brought about by nanofiller agglomeration at relatively high loading content. Note that at high doping content, the phonon scattering at the interface still exists. The variation of thermal conductivity is the result of these two factors.
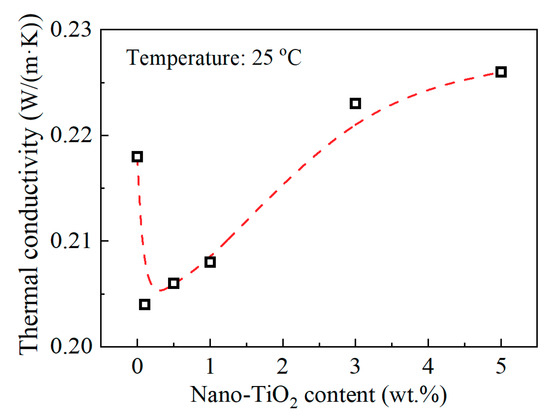
Figure 6.
Thermal conductivity and nano-TiO2 content at 25 °C.
3.4. Electric Conduction
It is well known that the charging current decays with the time immediately after the application of a step-function voltage across an insulating material between two metallic electrodes, and this charging current is also called absorption current. Figure 7 presents the absorption currents of neat epoxy resin and its nanocomposite samples. The currents reach steady state at about 800 s. There are three possible mechanisms that may be responsible for this current decay phenomenon. These mechanisms are ionic conduction, dipolar polarization, and electronic conduction. Because the electric field of measurements is low, electronic conduction is very small and can be neglected here. Hence it is considered that the stable currents are mainly the contribution of ionic conduction. During the fabrication process of the sample in our work, the cleanliness was guaranteed, and a neat epoxy resin sample went through the same fabrication process as the nanocomposite samples besides the introduction of nanofiller. Therefore, the content of impurity in neat epoxy resin and its nanocomposites has no significant difference, which means ionic charge carrier content has no big difference in each sample. The ionic conductivity is related to density of charge carrier and charge mobility.
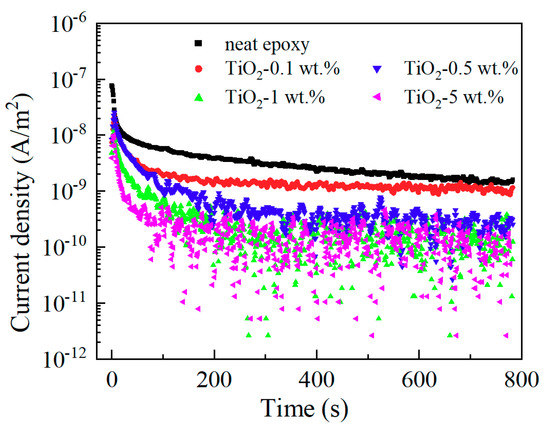
Figure 7.
Absorption current of epoxy/TiO2 samples.
The steady value of absorption current decreased with the increasing nano-TiO2 content, and the electric resistivities calculated by them are shown in Figure 8. Consequently, we draw the conclusion that functionalized nano-TiO2 doping decreases the charge mobility and suppresses ionic conduction of epoxy resin. This result is also related to the restricted movement of molecular chains.
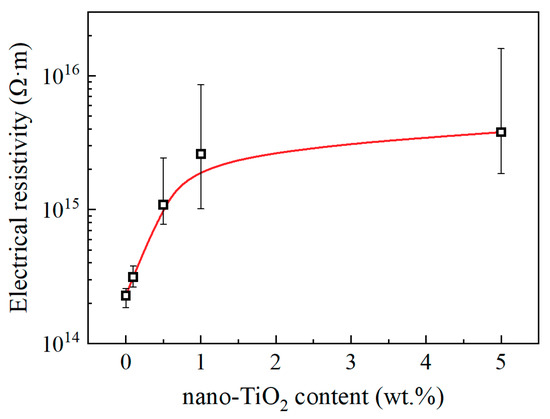
Figure 8.
Electrical resistivity and nano-TiO2 content.
3.5. Charge Trap
The charge trap characteristic is an important property for polymer insulating materials, and it reflects the effect of molecular motion and defects on the transport of charge carriers under an electric field. Different charge trap characteristics will modulate different insulating properties [13,14]. By comparing the surface potential of the epoxy sample and TiO2-1 wt.% sample, it illustrates that nano-TiO2 doping decreased the speed of surface potential decay. According to the theory of Simmons, the trap level and trap charge density could be calculated [12,15,16]. As shown in Figure 9, the surface potential increases and its decay rate decreases after nano-TiO2 doping. The calculated trap energies of neat epoxy sample and TiO2-1 wt.% sample are mainly around 1 eV, which can be regarded as deep traps. The results show the nano-TiO2 doping to epoxy resin insulating materials increased the density of deep traps significantly.
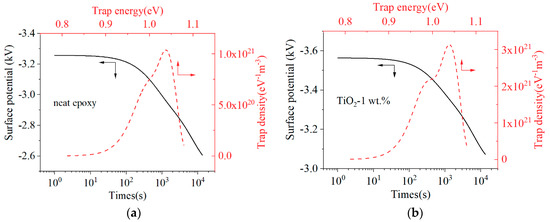
Figure 9.
Surface potential decay curves and trap characteristics: (a) Neat epoxy; (b) Epoxy resin/TiO2-1 wt.%.
4. Discussion
Based on these experimental results, it can be concluded that the introduction of functionalized nano-TiO2 will hinder the motion of molecular chains of epoxy resin insulating materials. As a result, the glass transition process of epoxy resin occurs at a higher temperature range and most related physical properties were regulated accordingly.
First, it can be considered that the restriction of molecular chain movement is mainly related to the interphase, interfacial region of nanofiller and polymer matrix. Interphase can be considered as the third phase in epoxy/TiO2 nanocomposites. It possesses properties that are distinct from the matrix resin. As represented in Figure 10, although the volume ratio of the nanoparticles is very small in the matrix, the interphase with a thickness of tens of nanometers will have a relatively large volume ratio. Therefore, the physical properties of interphase will dominate the physical properties of the nanocomposites, and controlling the properties of interphase is the key to modulate the properties of nanocomposite dielectric. In this paper, interphase in epoxy/TiO2 nanocomposites also plays an important role. As shown in Figure 1, the use of a silane coupling agent containing an epoxy group functionalizes the surface of nano-TiO2 fillers. This allows the nano-TiO2 to be coated with epoxy groups, which can participate in the curing reaction of the epoxy resin. Consequently, the nano-TiO2 was bounded to the molecular backbone. As shown in Figure 10, there will be an interphase region with a certain thickness that affected by the connection effect to nanoparticles. The thermal motion of the molecular chains in the interphase region becomes difficult for the high mass of nano-TiO2. With the increasing nanofiller content, the volume ratio of the interphase region will increase continuously. It is generally considered agglomerations of nanofiller under relatively high doping content will bring defects and voids that will cause the thermal motion of the matrix molecular chain. However, this phenomenon did not occur within the study content ranging up to 5 wt.% in this paper.
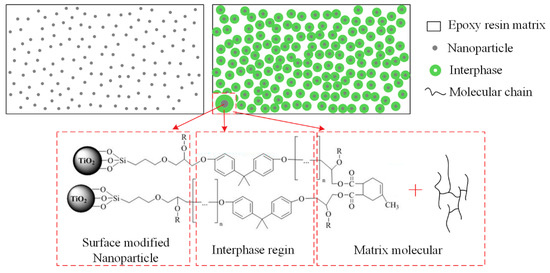
Figure 10.
Absorption currents of epoxy/TiO2 samples.
The interphase region in epoxy/TiO2 nanocomposites represents a stronger structure with restricted molecular chains. The most obvious property of epoxy resin affected by the interphase region is the enhanced Tg. It increases the maximum service temperature of epoxy resin insulating materials in power equipment. Besides, it will decrease the permittivity caused by displacement polarization of molecular chains. The thermal conductivity decreases at low doping content, but not large, which means just a little effect on the heat dissipation efficiency. For electric conduction at relatively low electric fields, it is mainly the impurity molecule, water molecule and other small molecules that are involved in charge transport. Some structures should provide channels, allowing ions space to move. Therefore, the motion of the molecular chain will affect the charge mobility. The inhibition of molecular chain motion will lead to a decrease of carrier mobility, and this is the reason why the Tg has a similar variation trend with the electric resistivity.
Some results reported in the literature usually show that inorganic fillers can improve the thermal conductivity of the composites to different degrees, and even a small amount of nano-sized fillers can improve the thermal conductivity slightly [17,18]. As stated in the introduction, there is no consistent conclusion on many physical properties of epoxy resin-based nanocomposite. Obviously, the results in this paper that thermal conductivity of epoxy/TiO2 nanocomposite decreased at low doping content, are novel and helpful to further understand the diversity of nanocomposite dielectric. It has been explained in the result section that the decrease of thermal conductivity is caused by the scattering phenomena of phonons at the epoxy/nano-TiO2 interface. Combining the concept of interphase, it may be speculated that the interphase has a different thermal conductivity comparing with the epoxy resin matrix. Under this assumption, there will be another interface between interphase and epoxy resin matrix, and phonon scattering at this interface may also be a reason for the reduction of thermal conductivity.
As to the Tg, its value keeps increasing within the doping content range in this paper. It is not known to what extent the Tg can be increased with continuously increasing the nano-TiO2 content. But it is certain that the high content of nanoparticles will degrade the insulation performance. For example, the variation trend of electric resistivity with increasing nanofiller content is not consistent with the variation trend of Tg at relatively high nano-TiO2 content. It is speculated to be caused by more impurities in samples with more nanoparticles, and electric resistivity may be significantly reduced if more nanoparticles are added. As to the breakdown strength, a very important parameter of insulating materials, it reached the maximum at a relatively low nanofiller content as reported [13,19,20]. Therefore, a wide range of physics properties of epoxy/TiO2 nanocomposites including maximum service temperature should all be considered to determine the best loading content of nano-TiO2 in the engineering application as high voltage insulating materials.
It is generally accepted that polymer based nanocomposites have some improved performances comparing with their original polymers. But such improved performances are usually explained in terms of each model or each thought corresponding to each of performances and phenomena. It is necessary to explain as many performances as possible based on one comprehensive model. Therefore, in our work, the effect of functionalized nano-TiO2 on the molecular motion of epoxy resin was studied according to the analysis of Tg, loss factor of modulus, thermal conductivity, electric resistivity, and trap characteristics.
5. Conclusions
The work presented in this paper investigated epoxy/TiO2 nanocomposites with an enhanced glass transition temperature. Several conclusions were achieved.
- (1)
- Nano-TiO2 surface modified by γ-(2,3-epoxypropoxy) propytrimethoxy silane can form a strong interaction with the epoxy resin matrix and moderate content of nano-TiO2 doping effectively adjust the property of epoxy resin.
- (2)
- The Tg increased significantly after nano-TiO2 doping and it can be increased by up to 35 °C. The thermal motion of epoxy resin molecular was suppressed by the addition of functionalized nano-TiO2.
- (3)
- Dynamic mechanical properties, thermal conductivity, electrical conductivity and trap characteristics of epoxy resin are all adjusted after nano-TiO2 doping. All of these physical properties of epoxy/TiO2 nanocomposite dielectric was related to the suppression of molecular motion.
Author Contributions
Conceptualization, S.W. and S.Y.; methodology, S.W., S.Y., J.L. and S.L.; software, S.W.; validation, S.W. and S.L.; formal analysis, S.W. and S.Y.; investigation, S.W. and S.Y.; resources, S.W. and S.Y.; data curation, S.W. and S.Y.; writing—original draft preparation, S.W.; writing—review and editing, S.W. and S.Y.; visualization, S.W.; supervision, J.L. and S.L.; project administration, S.W. and J.L.; funding acquisition, S.W., J.L. and S.L. All authors have read and agreed to the published version of the manuscript.
Funding
This research was supported by the National Natural Science Foundation of China (grant number 51907147) and National Key Research and Development Program of China (grant number 2018YFB0905802). This paper and its related research are supported by grants from the Power Electronics Science and Education Development Program of Delta Group.
Conflicts of Interest
The authors declare no conflict of interest.
References
- Li, G.; Zhu, P.; Huang, L.; Zhao, T.; Sun, R.; Lu, D.D. Investigating the rheological and thermomechanical properties of SiO2/epoxy nanocomposites: Probing the role of silane coupling agent. In Proceedings of the International Conference on Electronic Packaging Technology, Chengdu, China, 12–15 August 2014. [Google Scholar]
- Kyritsis, A.; Vikelis, G.; Maroulas, P.; Pissis, P.; Milosheva, B.; Kotsilkova, R.; Toplijska, A.; Silvestre, C.; Duraccio, D. Polymer dynamics in epoxy/alumina nanocomposites studied by various techniques. J. Appl. Polym. Sci. 2011, 121, 3613–3627. [Google Scholar] [CrossRef]
- Singha, S.; Thomas, M.J. Permittivity and tan delta characteristics of epoxy nanocomposites in the frequency range of 1 MHz-1 GHz. IEEE Trans. Dielectr. Electr. Insul. 2008, 15, 2–11. [Google Scholar] [CrossRef]
- Liu, G.; Zhang, H.; Zhang, D.; Zhang, H.; Zhang, Z.; An, X.; Yi, X. On depression of glass transition temperature of epoxy nanocomposites. J. Mater. Sci. 2012, 47, 6891–6895. [Google Scholar] [CrossRef]
- Chen, Y.; Guo, J.; Shao, Z.; Cheng, Y.; Wu, J.; Tanaka, T. Properties of PAAM Grafted alumina/epoxy nanocomposites. In Proceedings of the IEEE International Conference on the Properties and Applications of Dielectric Materials (ICPADM), Sydney, Australia, 19–22 July 2015. [Google Scholar]
- Polizos, G.; Tuncer, E.; Sauers, I.; More, K.L. Physical properties of epoxy resin/titanium dioxide nanocomposites. Polym. Eng. Sci. 2011, 51, 87–93. [Google Scholar] [CrossRef]
- Singha, S.; Thomas, M.J. Influence of filler loading on dielectric properties of epoxy-ZnO nanocomposites. IEEE Trans. Dielectr. Electr. Insul. 2009, 16, 531–542. [Google Scholar] [CrossRef]
- Yanashima, R.; Hirai, N.; Ohki, Y. Effects of addition of MgO fillers with various sizes and co-addition of nano-sized SiO2 fillers on the dielectric properties of epoxy resin. In Proceedings of the International Symposium on Electrical Insulating Materials (ISEIM), Toyohashi, Japan, 11–15 September 2017. [Google Scholar]
- Radoman, T.S.; Džunuzović, J.V.; Jeremić, K.B.; Grgur, B.N.; Miličević, D.S.; Popović, I.G.; Džunuzović, E.S. Improvement of epoxy resin properties by incorporation of TiO2 nanoparticles surface modified with gallic acid esters. Mater. Des. 2014, 62, 158–167. [Google Scholar] [CrossRef]
- Lizundia, E.; Serna, I.; Axpe, E.; Vilas, J.L. Free-volume effects on the thermomechanical performance of epoxy-SiO2 nanocomposites. J. Appl. Polym. Sci. 2017, 134, 45216. [Google Scholar] [CrossRef]
- Yu, S.; Li, S.; Wang, S.; Huang, Y.; Nazir, M.T.; Phung, B.T. Surface flashover properties of epoxy based nanocomposites containing functionalized nano-TiO2. IEEE Trans. Dielectr. Electr. Insul. 2018, 25, 1567–1576. [Google Scholar]
- Li, J.; Zhou, F.; Min, D.; Li, S.; Xia, R. The Energy Distribution of Trapped Charges in Polymers Based on Isothermal Surface Potential Decay Model. IEEE Trans. Dielectr. Electr. Insul. 2015, 22, 1723–1732. [Google Scholar] [CrossRef]
- Wang, S.; Chen, P.; Yu, S.; Zhang, P.; Li, J.; Li, S. Nanoparticle dispersion and distribution in XLPE and the related DC insulation performance. IEEE Trans. Dielectr. Electr. Insul. 2018, 25, 2349–2357. [Google Scholar] [CrossRef]
- Wang, S.; Chen, P.; Li, H.; Li, J.; Chen, Z. Improved DC performance of crosslinked polyethylene insulation depending on a higher purity. IEEE Trans. Dielectr. Electr. Insul. 2017, 24, 1809–1817. [Google Scholar] [CrossRef]
- Shen, W.; Mu, H.; Zhang, G.; Deng, J.; Tu, D. Identification of electron and hole trap based on isothermal surface potential decay model. J. Appl. Phys. 2013, 113, 083706. [Google Scholar] [CrossRef]
- Molinie, P. A Review of Mechanisms and Models Accounting for Surface Potential Decay. IEEE Trans. Plasma Sci. 2012, 40, 167–176. [Google Scholar] [CrossRef]
- Kochetov, R.; Andritsch, T.; Lafont, U.; Morshuis, P.H.F.; Smit, J.J. Thermal conductivity of nano-filled epoxy systems. In Proceedings of the IEEE Conference on Electrical Insulation and Dielectric Phenomena (CEIDP), Virginia Beach, VA, USA, 18–21 October 2009. [Google Scholar]
- Tsekmes, I.A.; Kochetov, R.; Morshuis, P.H.F.; Smit, J.J. A unified model for the permittivity and thermal conductivity of epoxy based composites. J. Appl. Phys. 2014, 47, 415502. [Google Scholar] [CrossRef]
- Li, S.; Yin, G.; Chen, G.; Li, J.; Bai, S.; Zhong, L.; Zhang, Y.; Lei, Q. Short-term breakdown and long-term failure in nanodielectrics: A review. IEEE Trans. Dielectr. Electr. Insul. 2010, 17, 1523–1535. [Google Scholar] [CrossRef]
- Yu, S.; Wang, S.; Nazir, M.T.; Wang, W.; Li, S.; Phung, T.; Takada, T. Surface trap effects on flashover voltages of epoxy/Al2O3 nanocomposites for high voltage insulation. J. Mater. Sci. Mater. Electron. 2019, 30, 18135–18143. [Google Scholar] [CrossRef]
© 2020 by the authors. Licensee MDPI, Basel, Switzerland. This article is an open access article distributed under the terms and conditions of the Creative Commons Attribution (CC BY) license (http://creativecommons.org/licenses/by/4.0/).