Effect of Flow State of Pure Aluminum and A380 Alloy on Porosity of High Pressure Die Castings

Abstract
1. Introduction
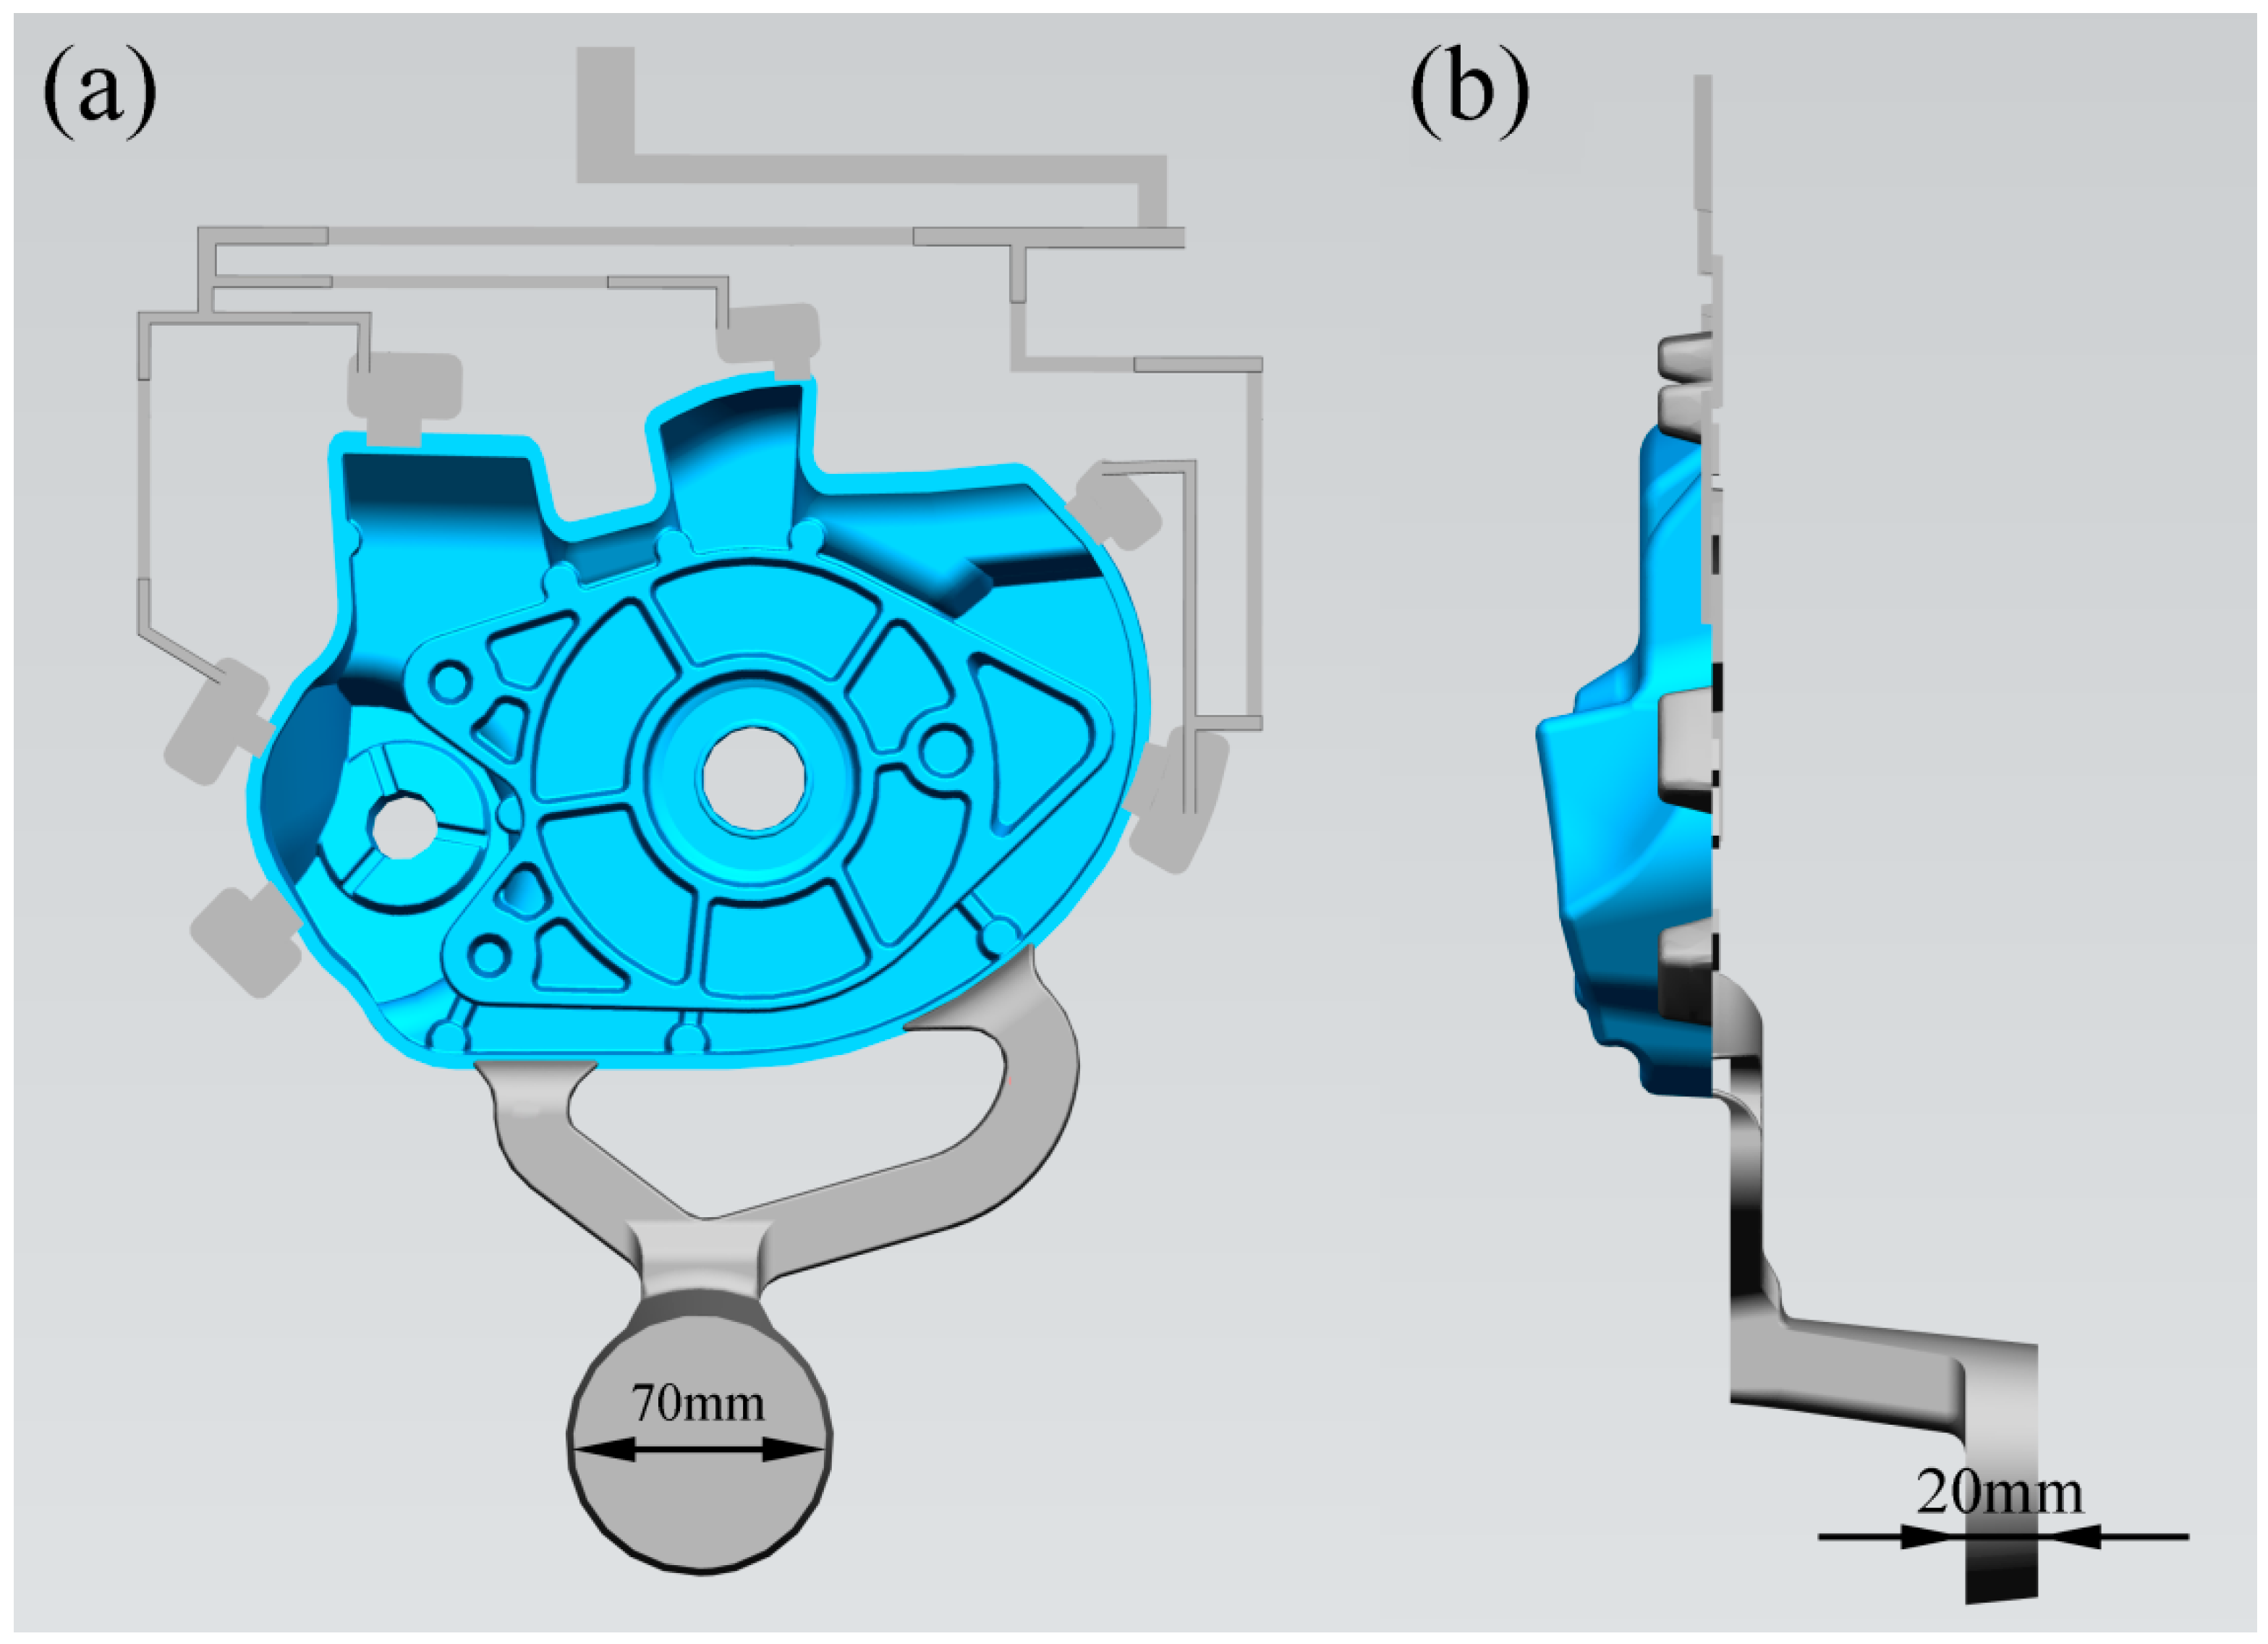
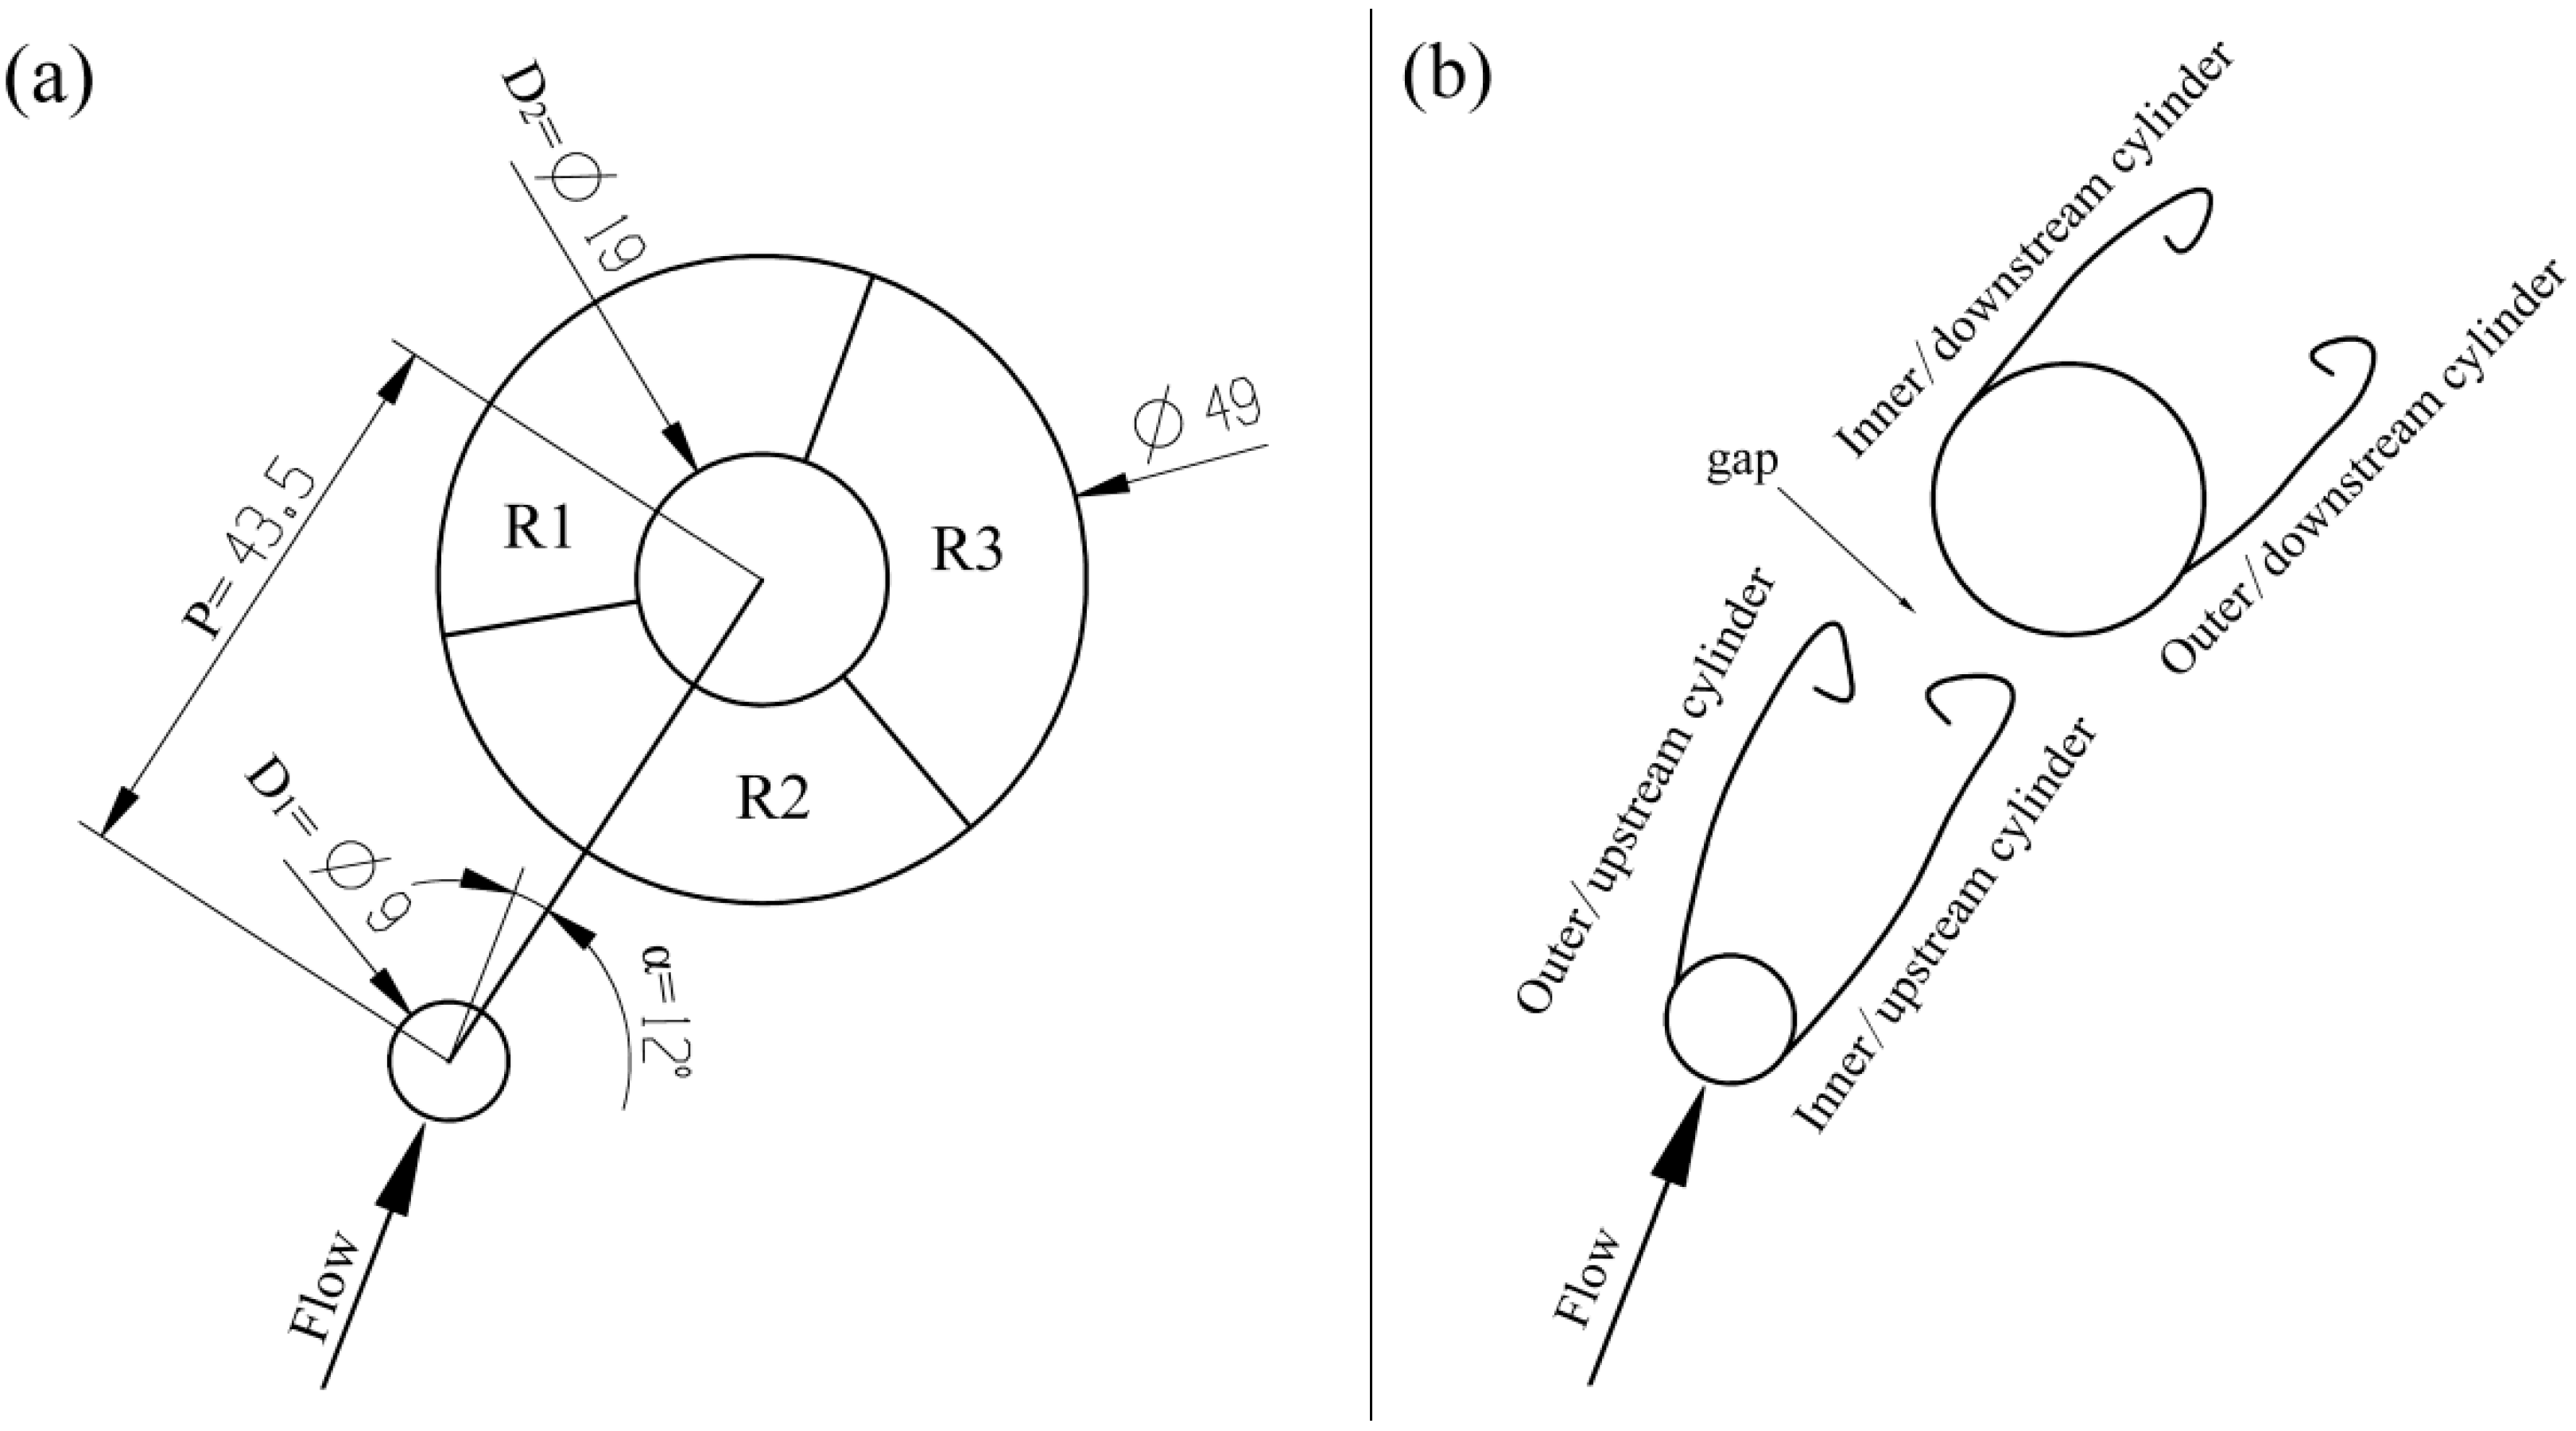
2. Experiments
3. Results and Disscussion
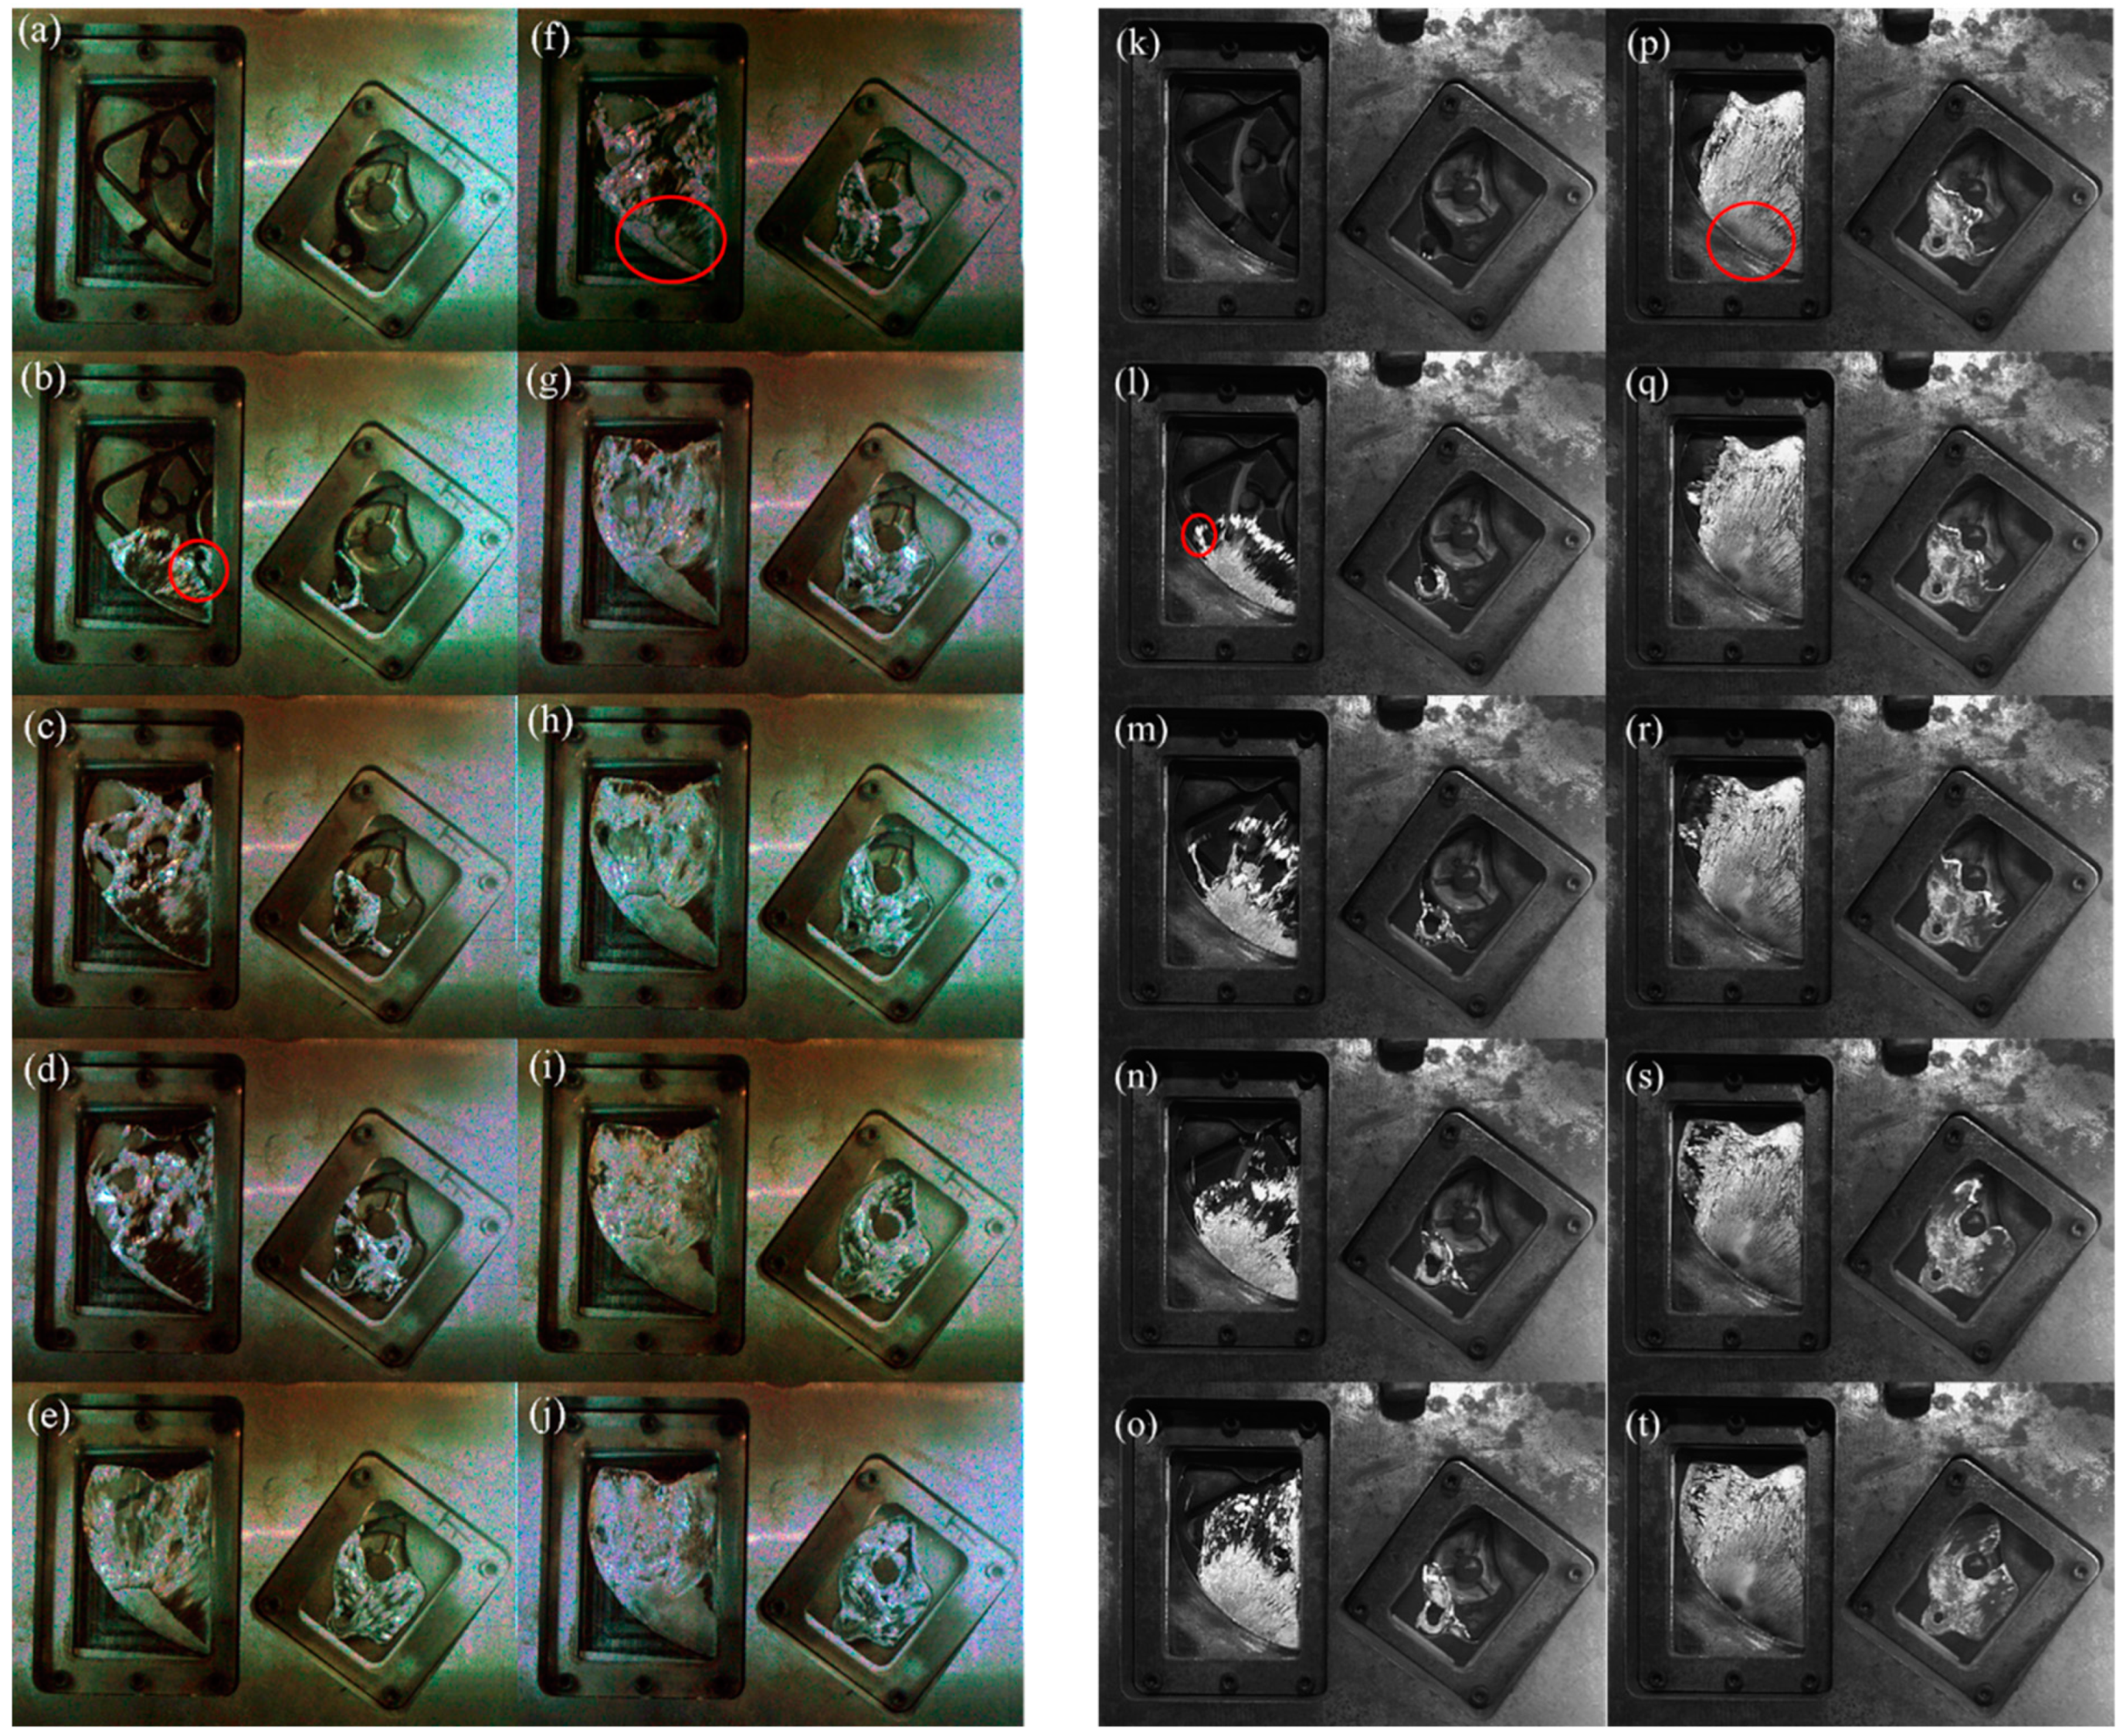
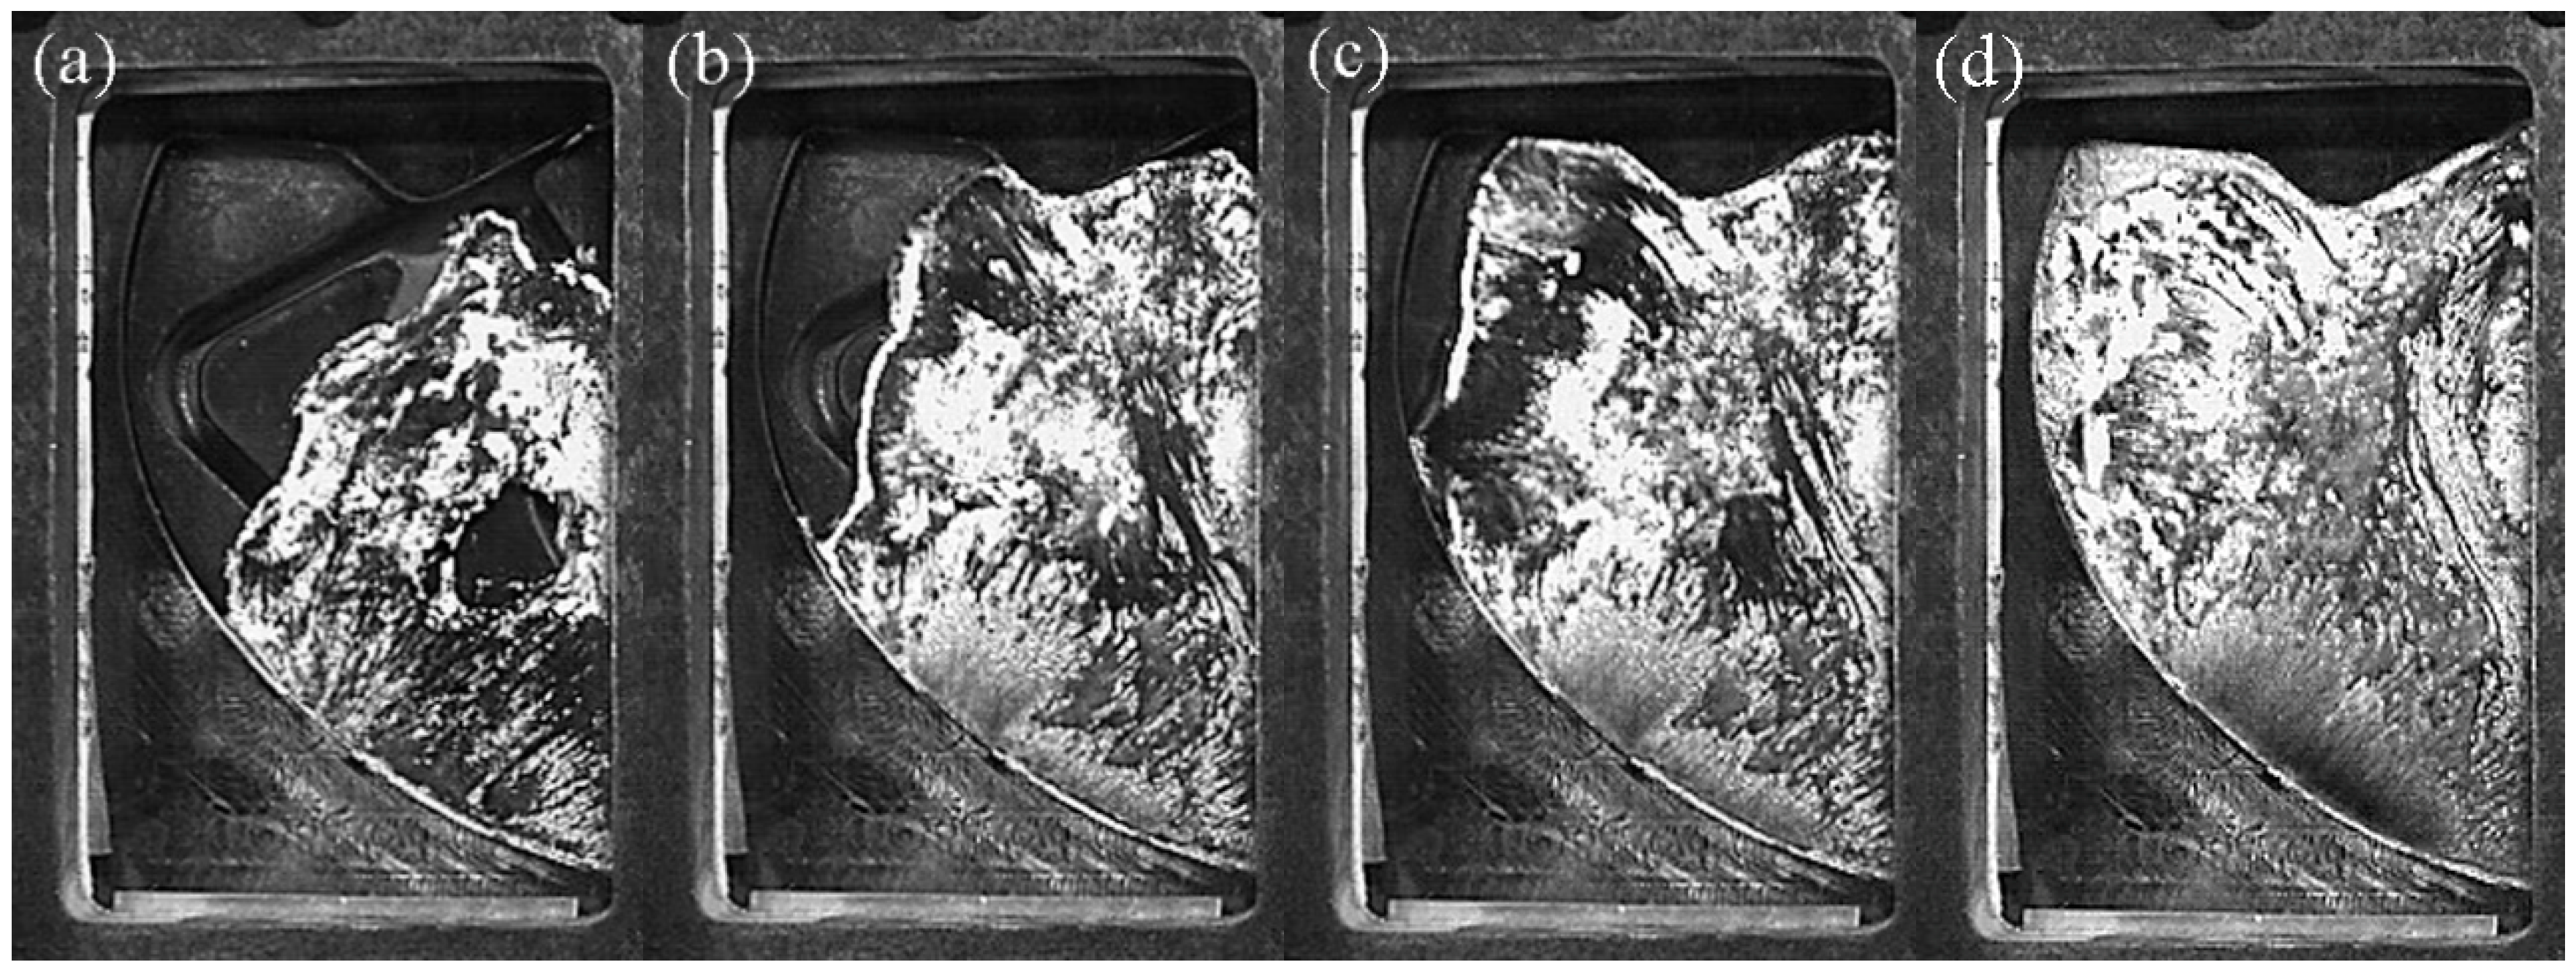
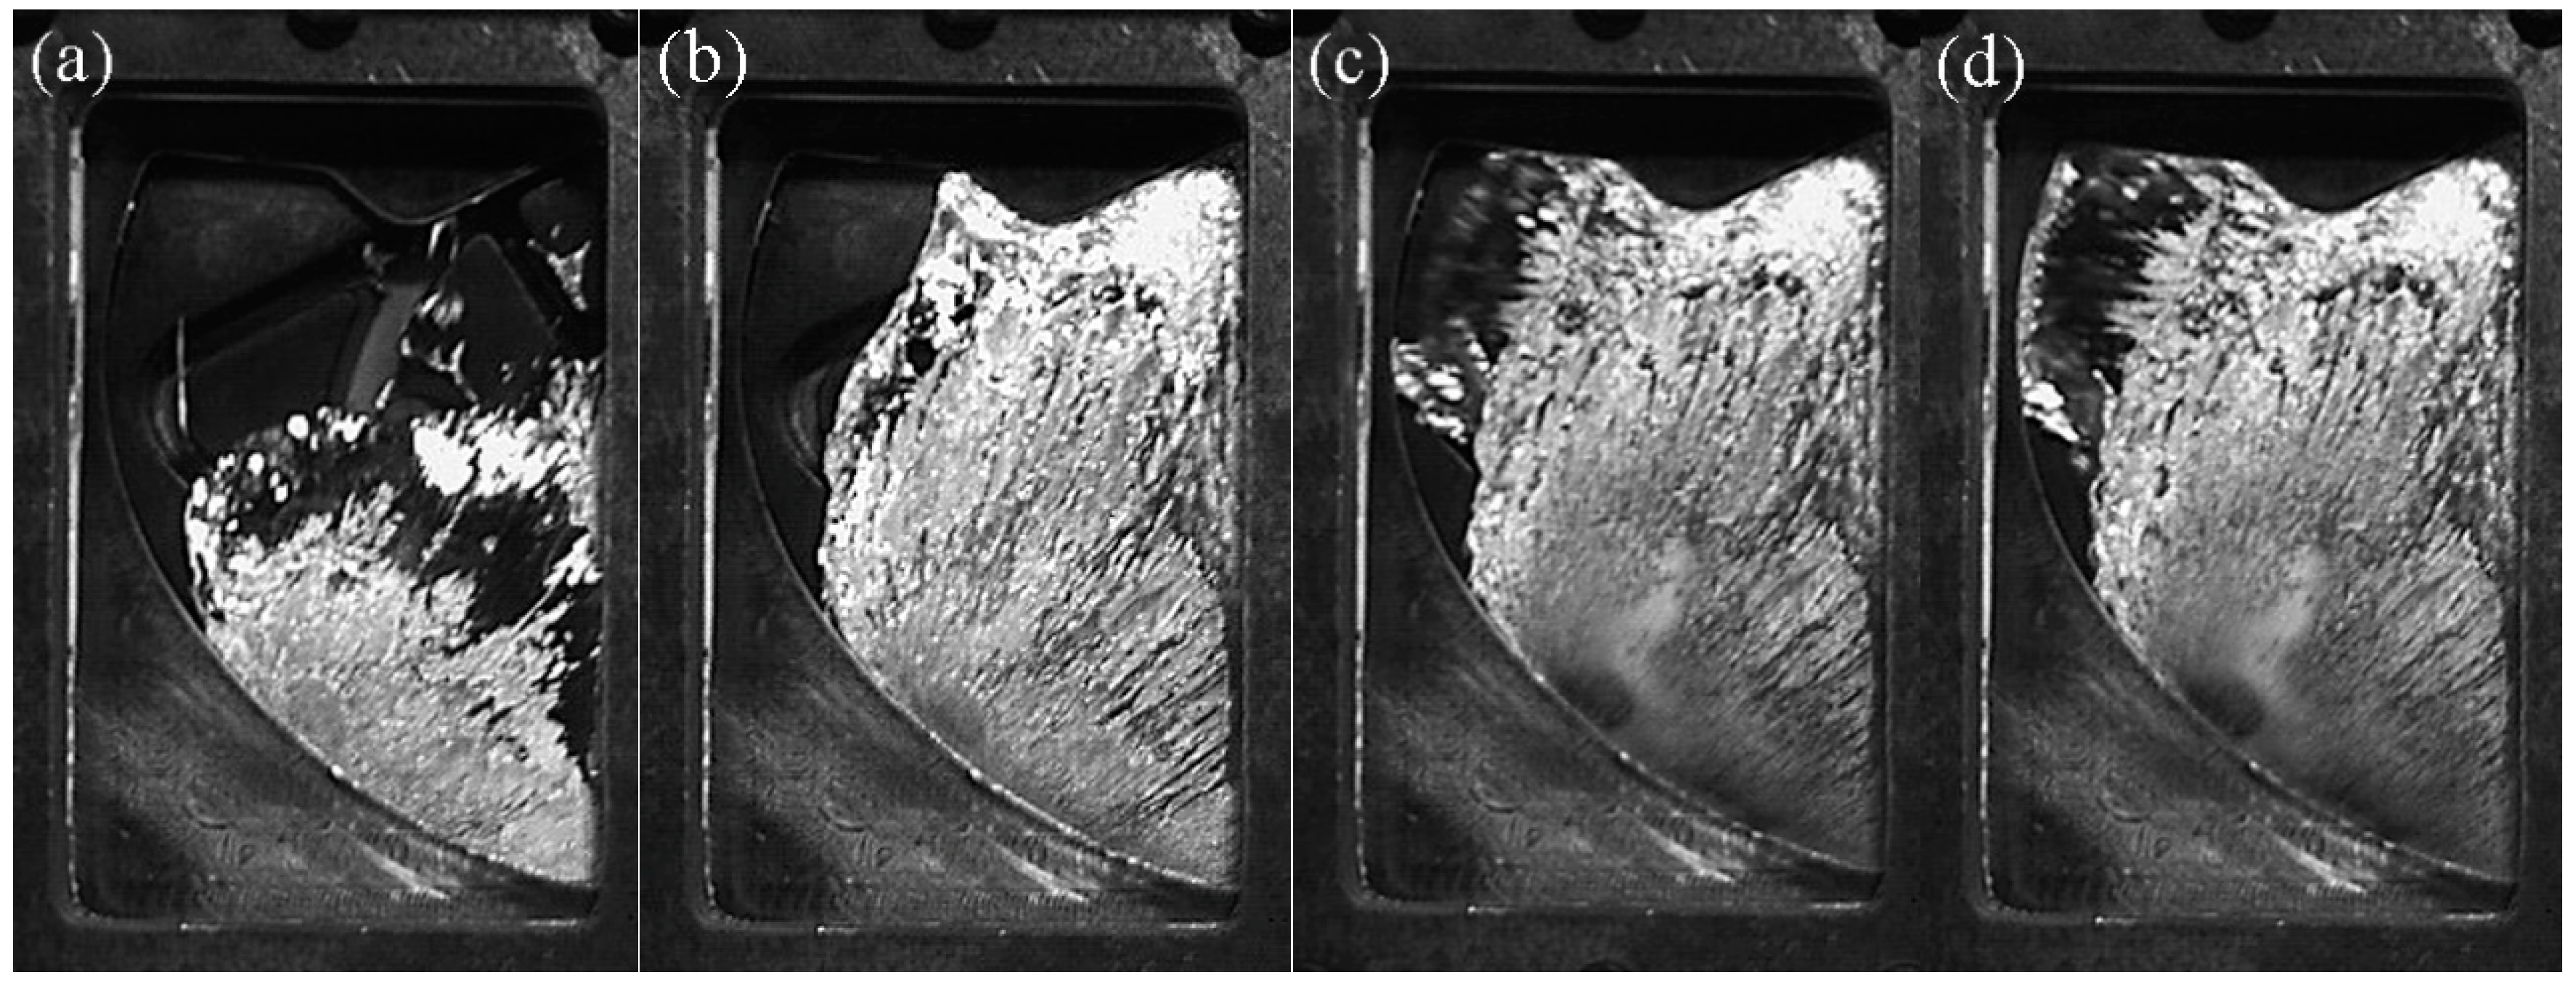
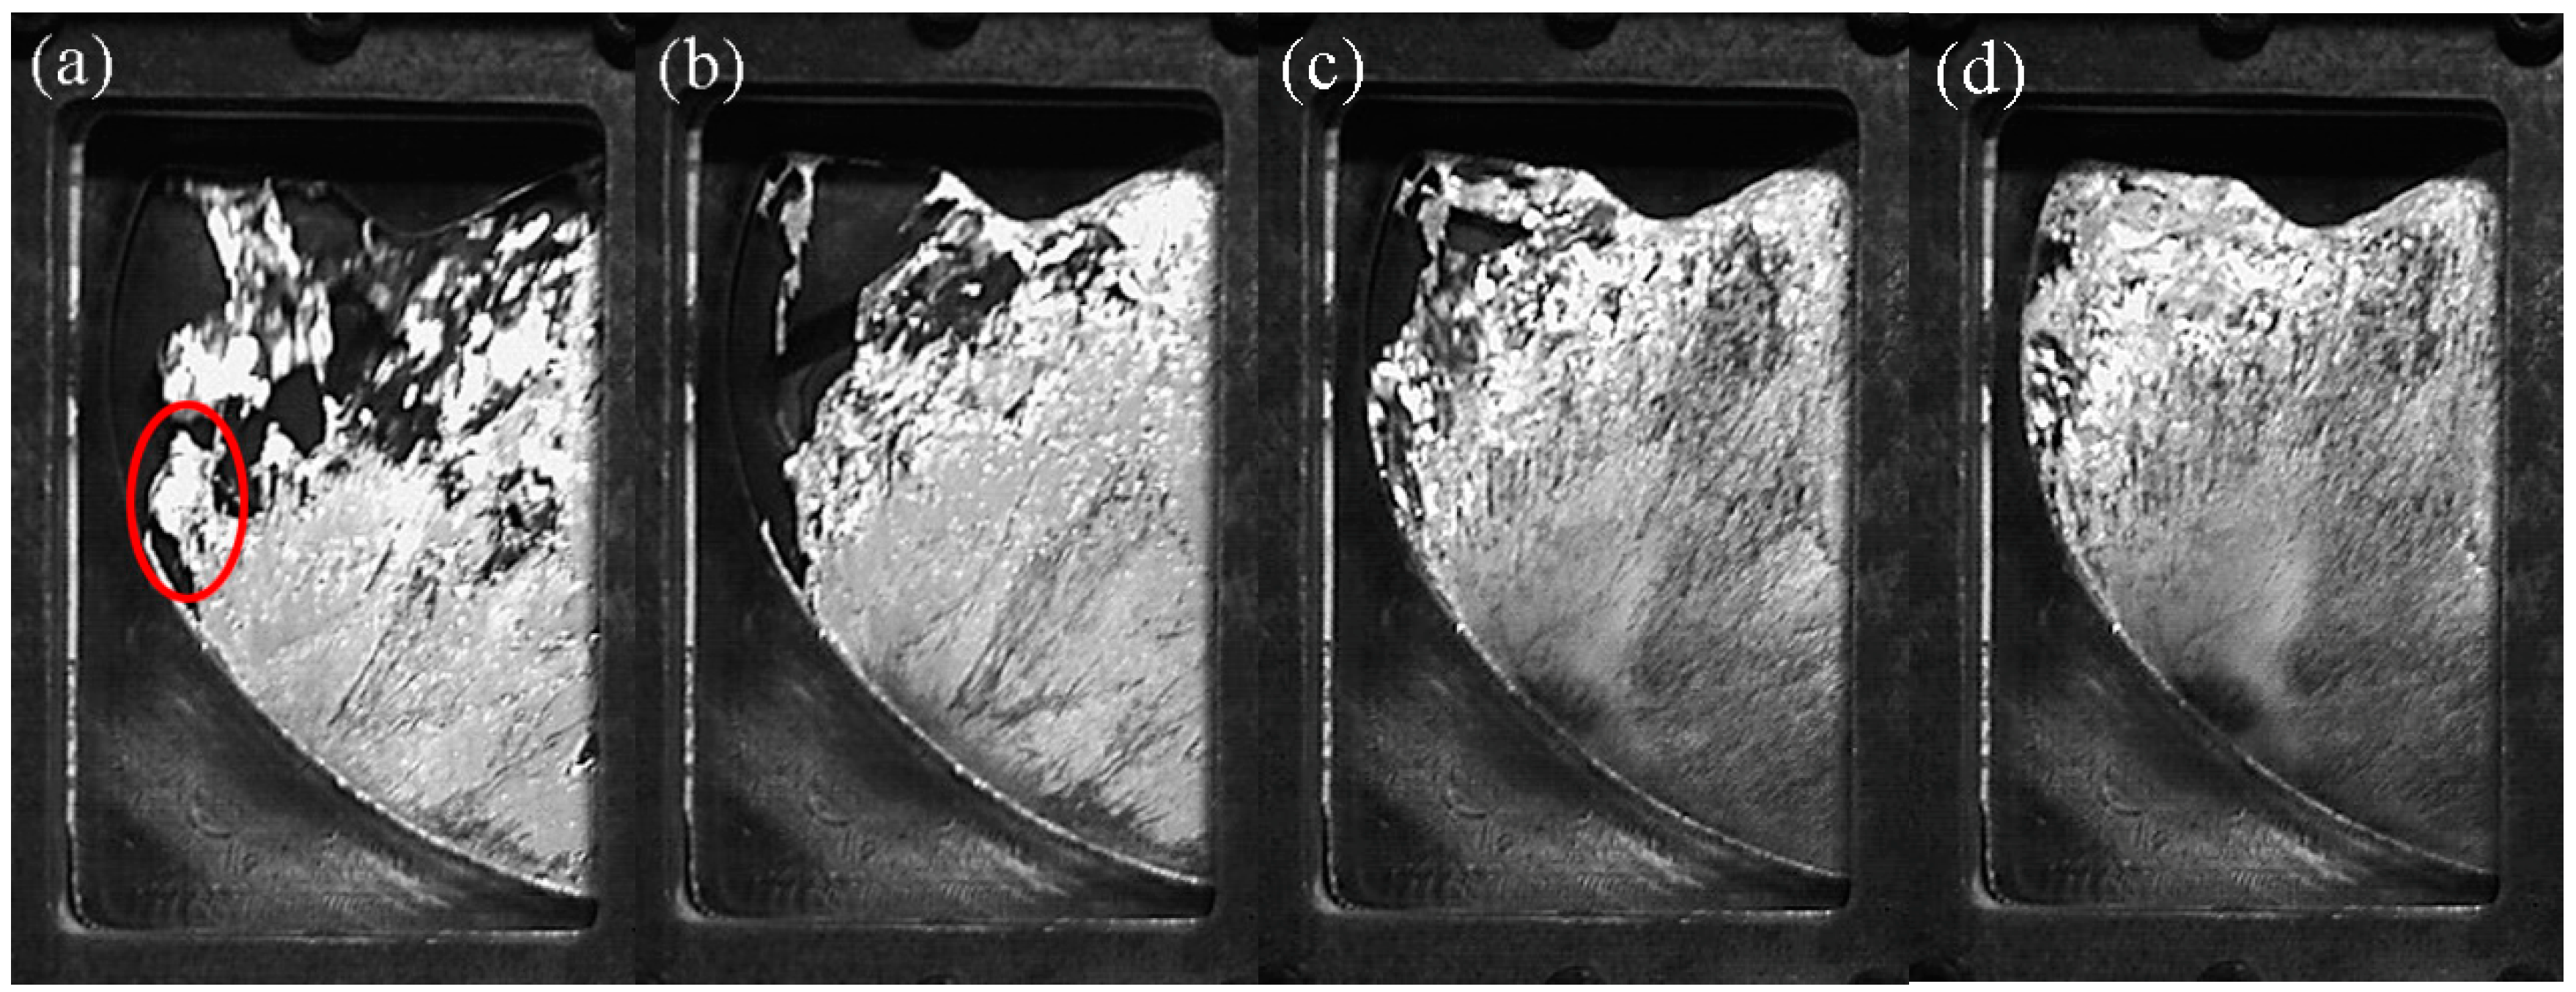
3.1. Comparison of Pure Aluminum and A380 Aluminum Alloy Filling Process
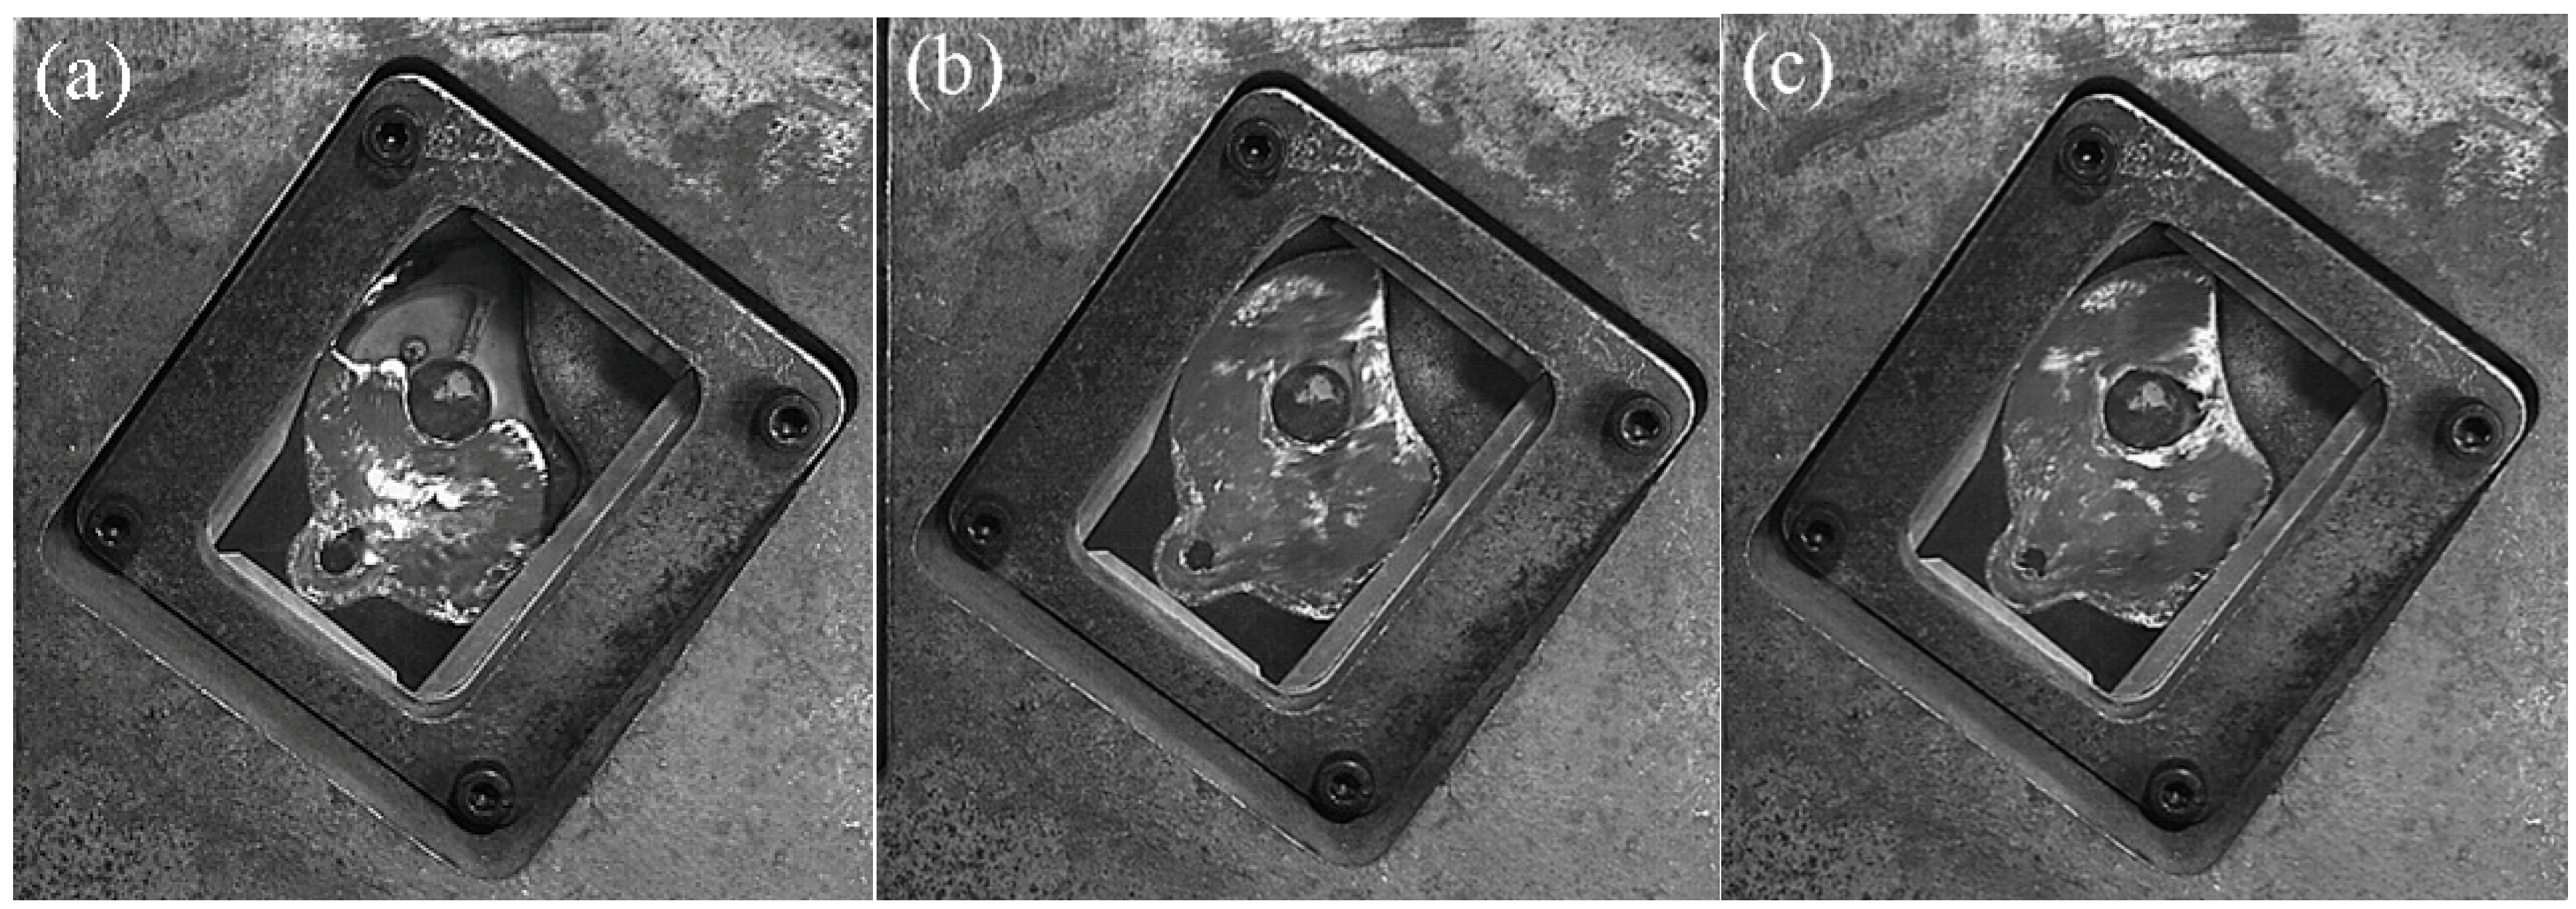
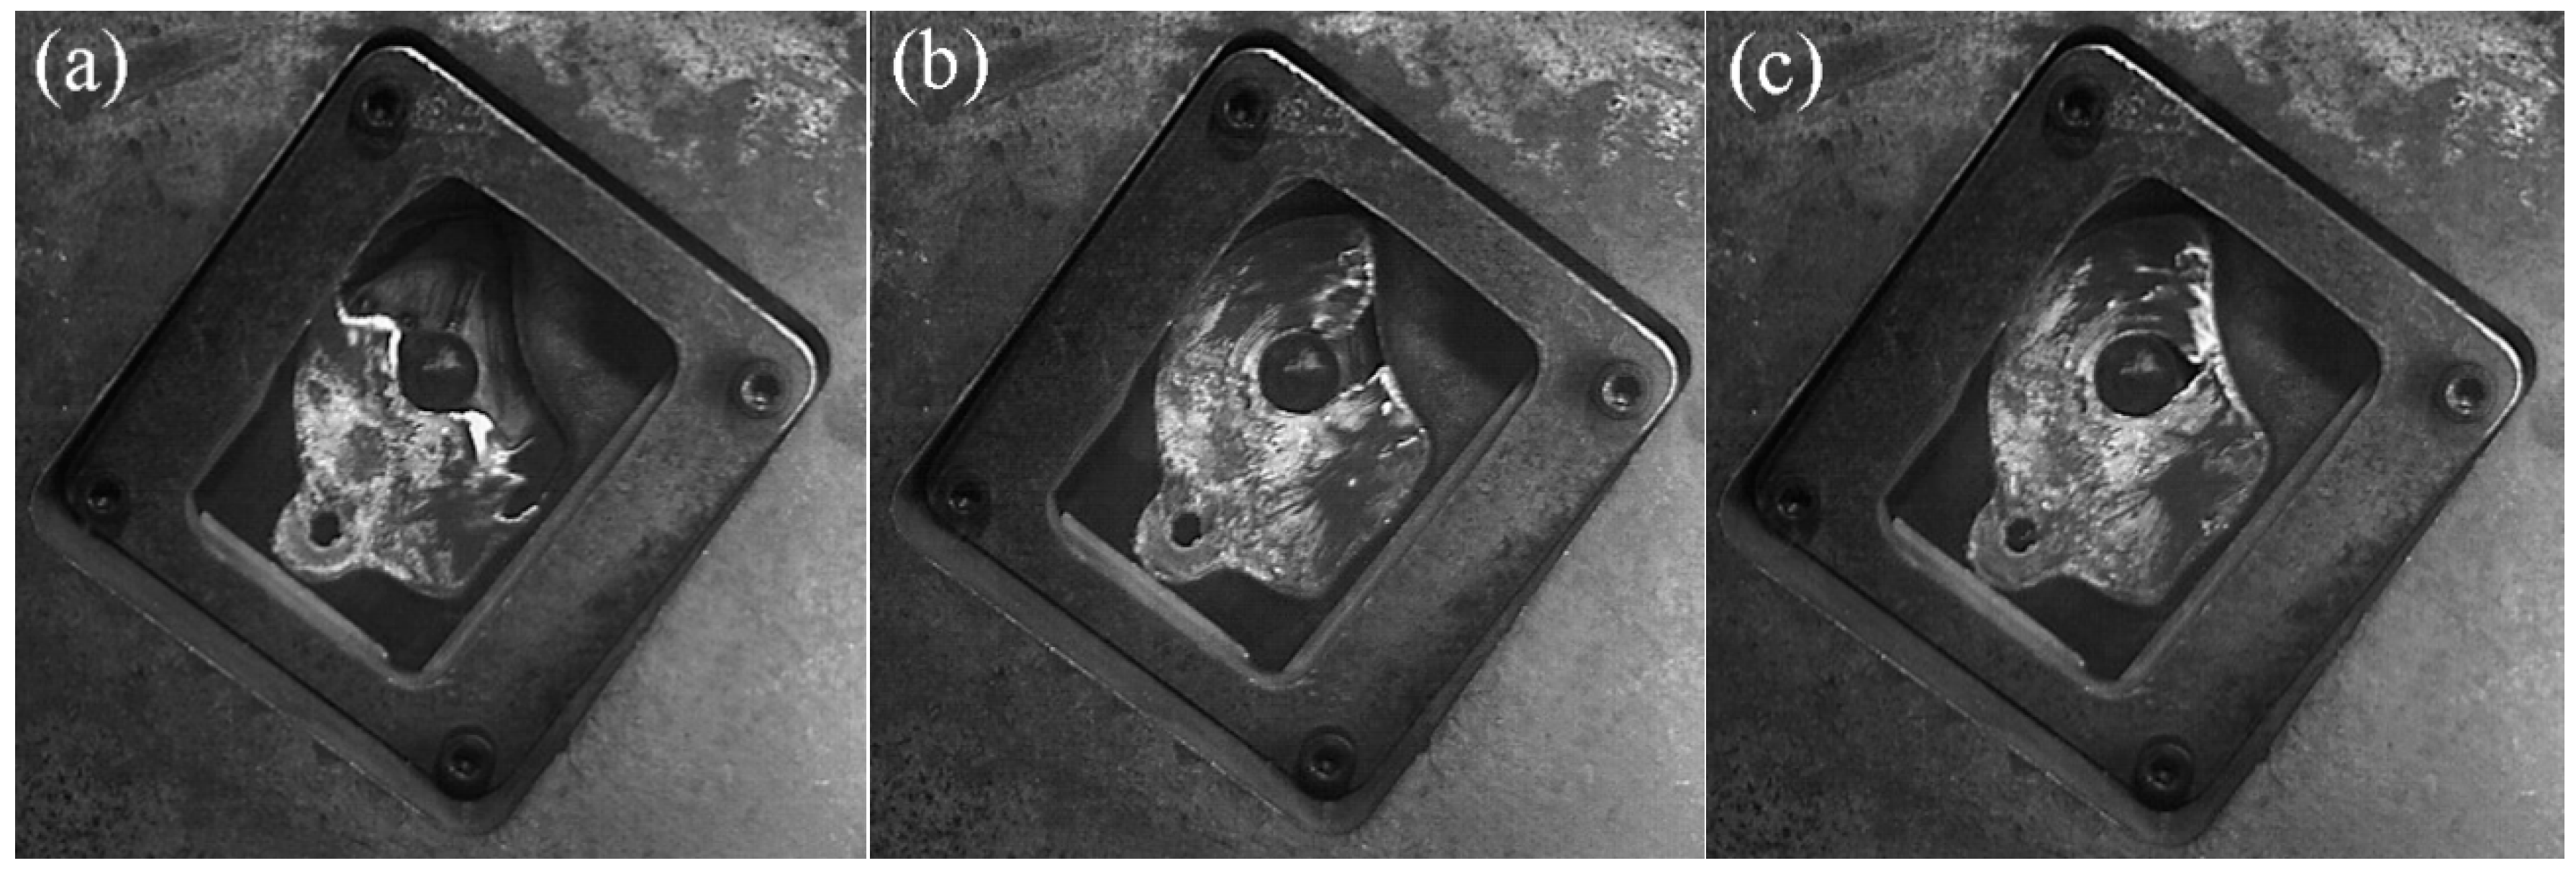
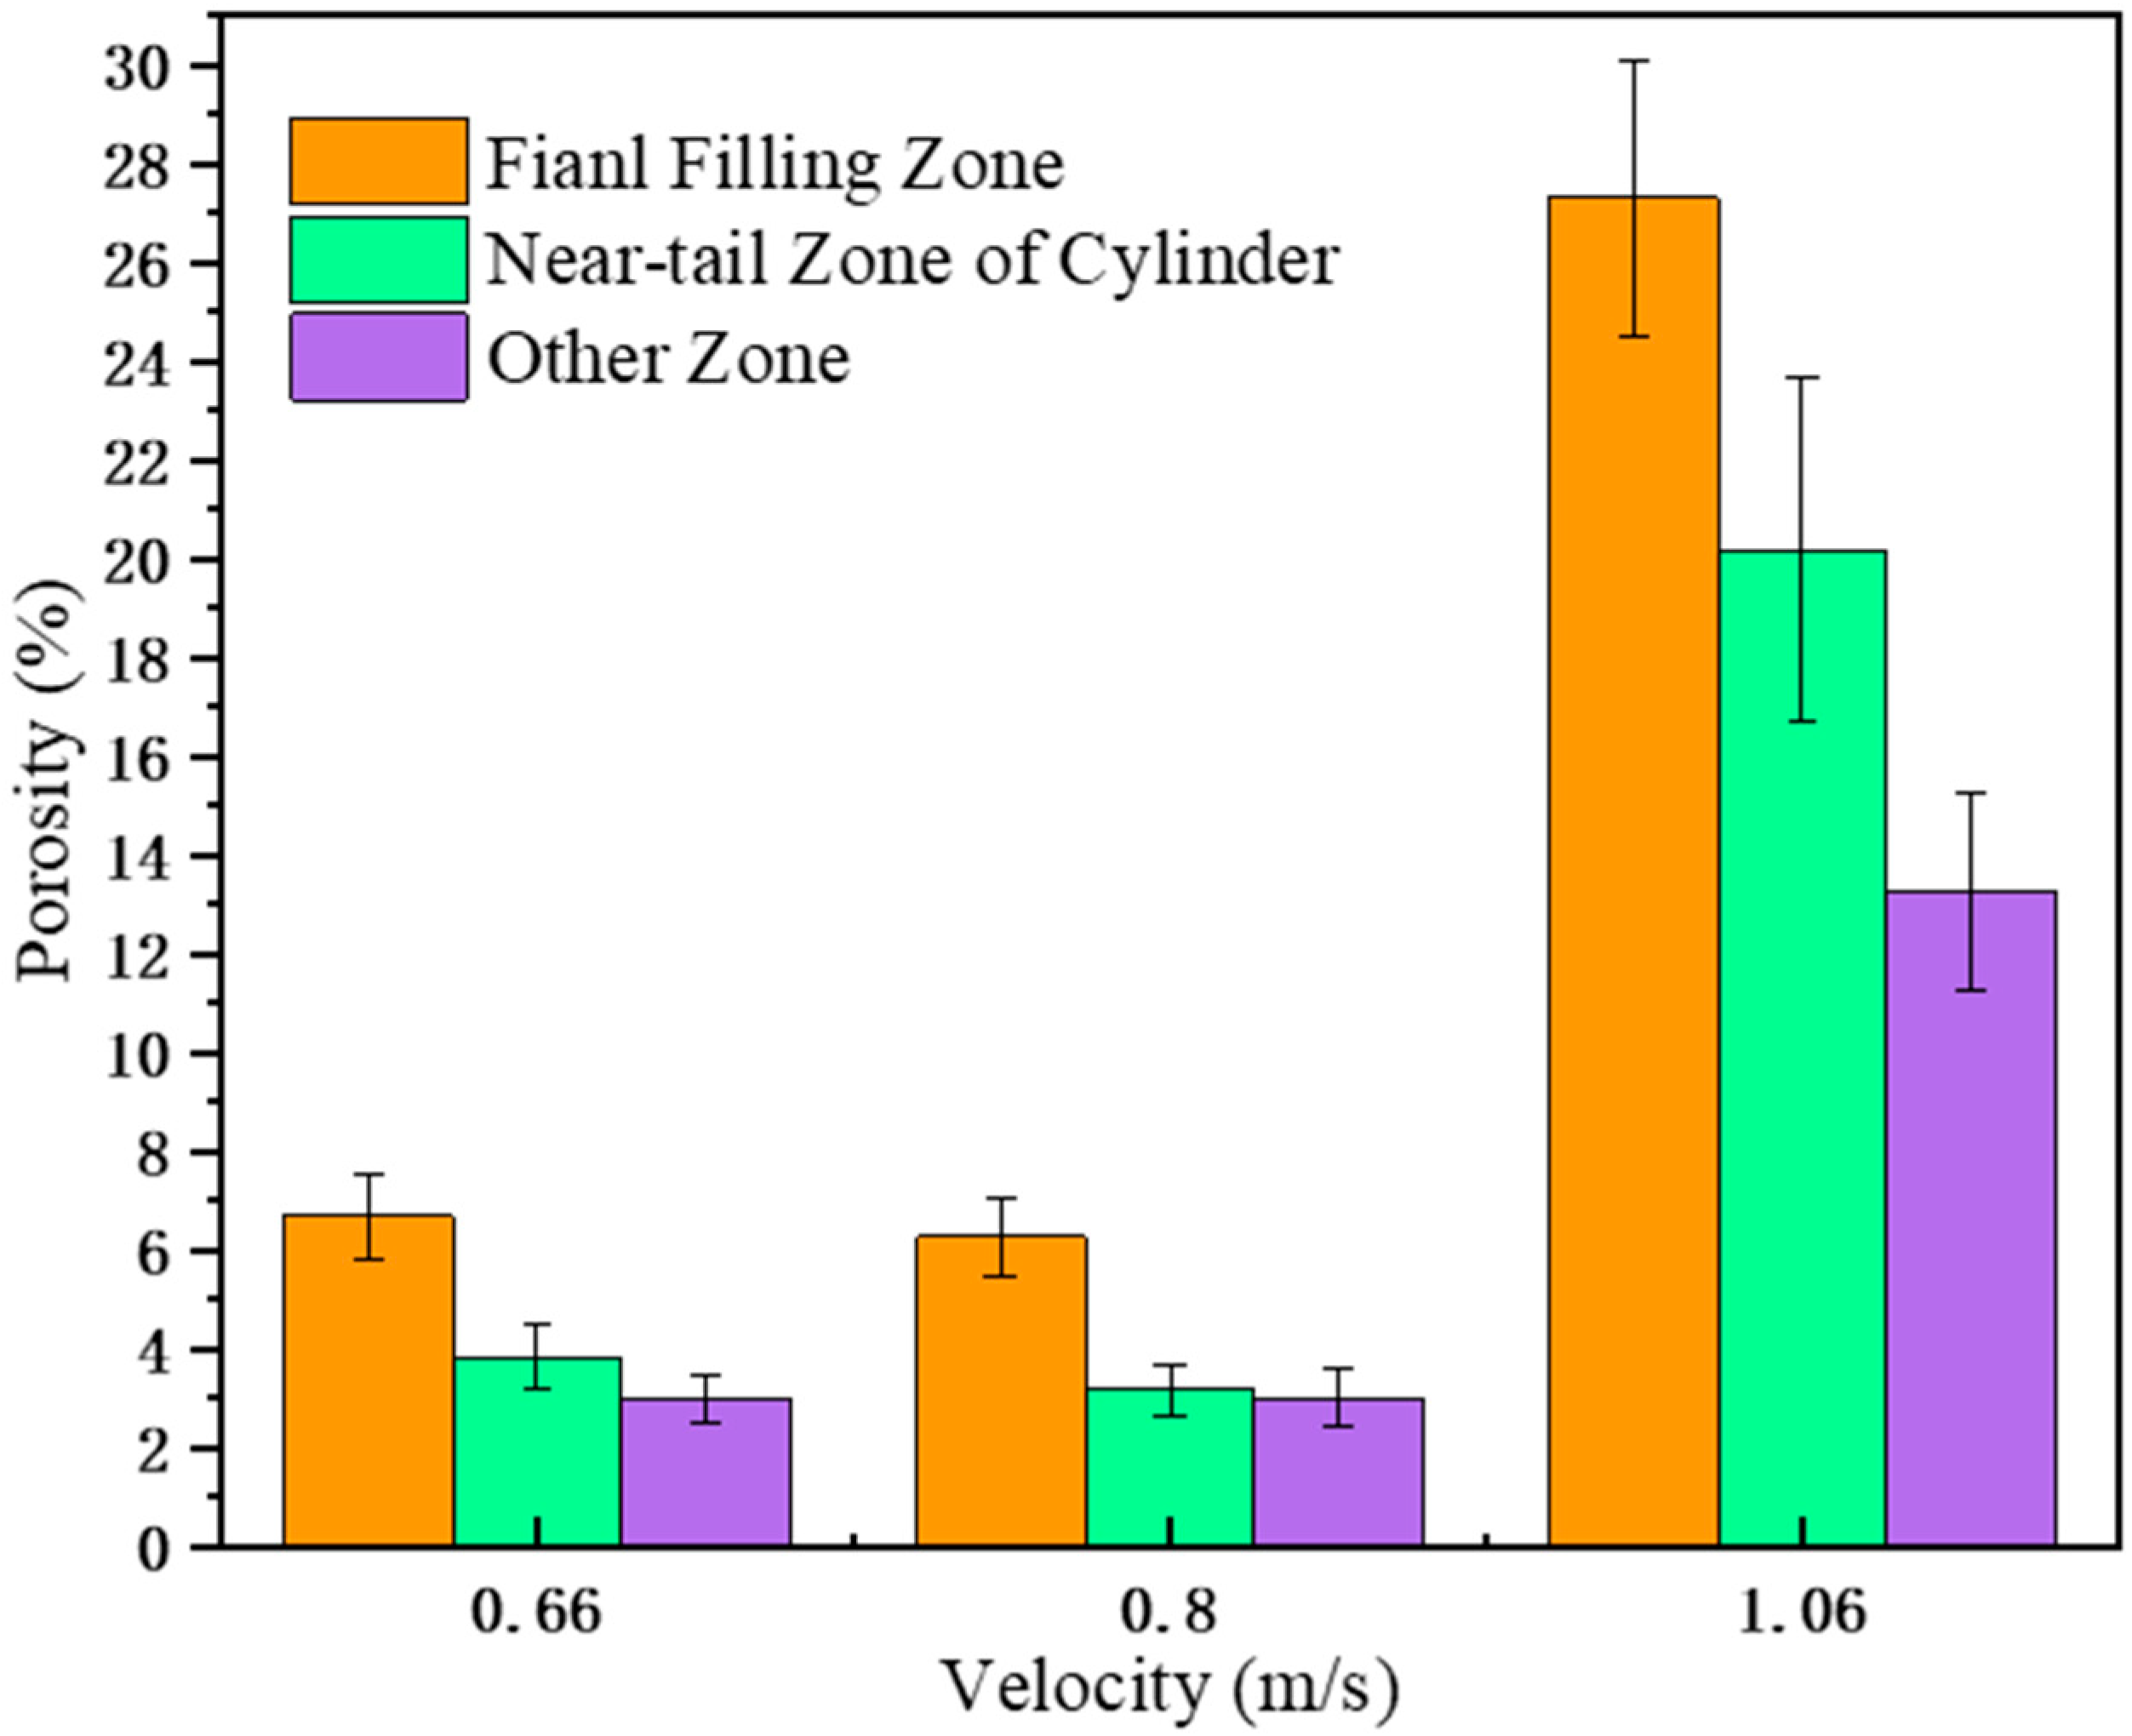
3.2. Effect of Injection Velocity on Melt Flow Pattern and Gas Defects of A380
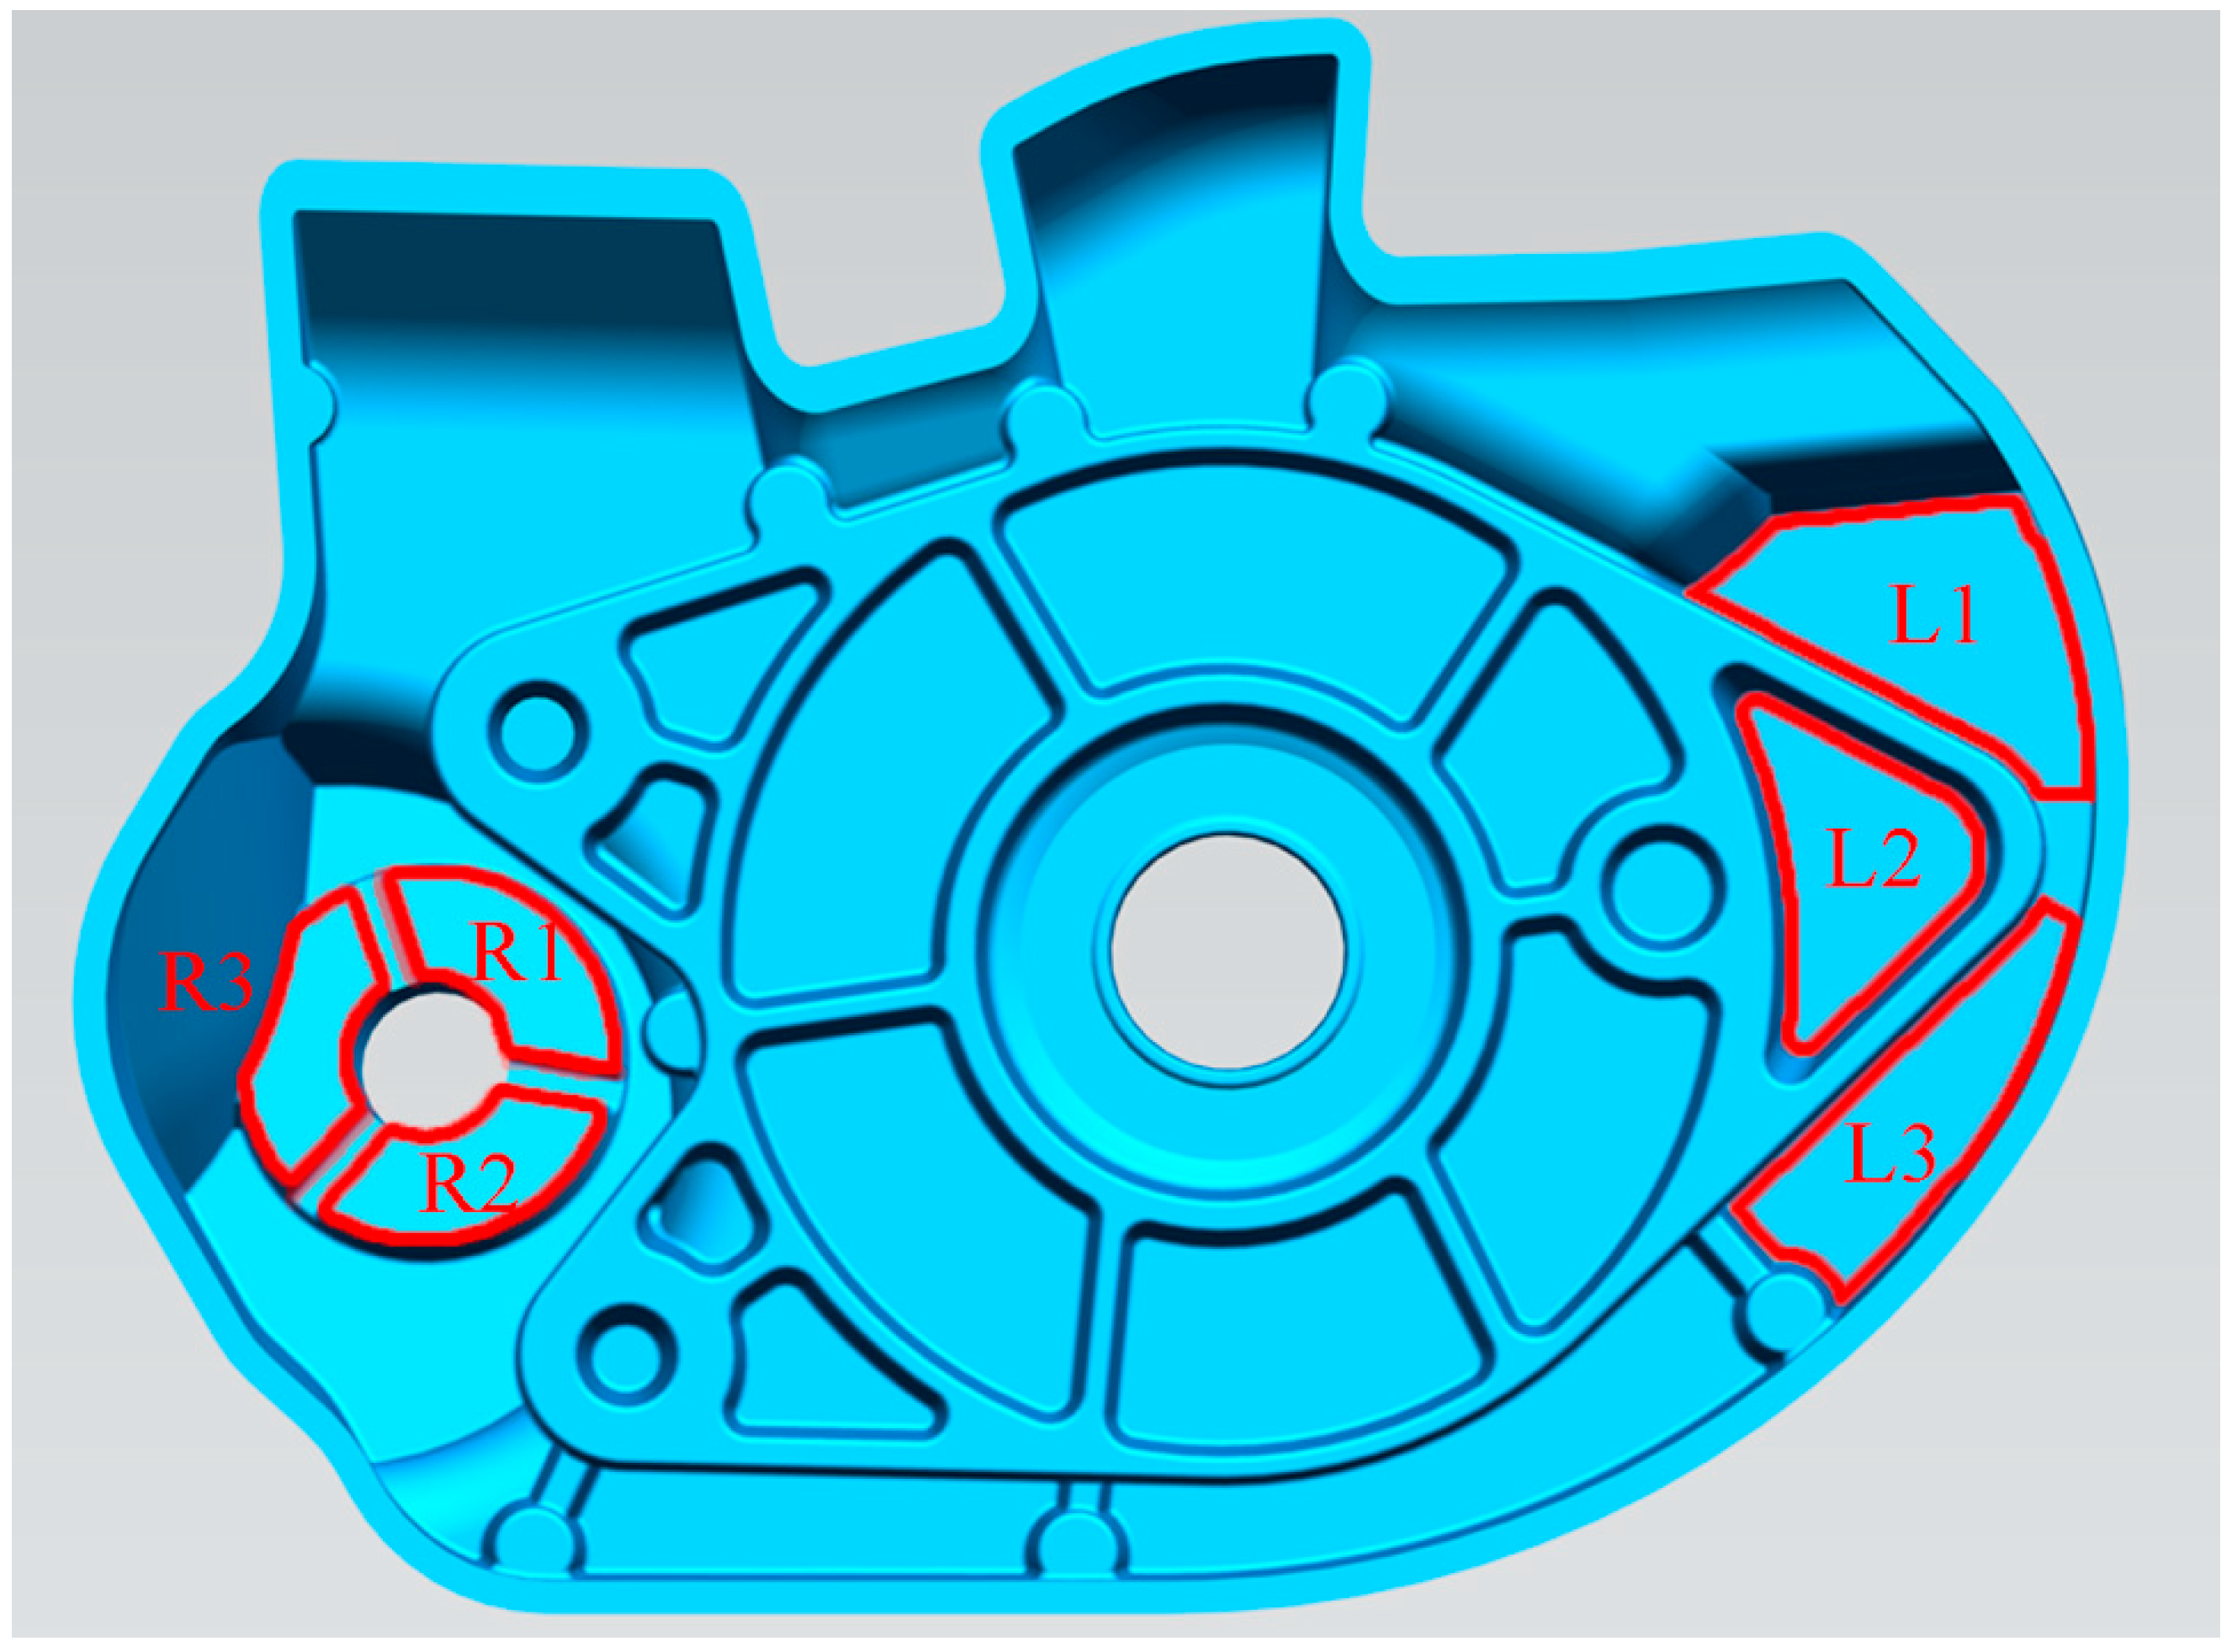
3.2.1. Porosity Prediction in the Left Window
3.2.2. Porosity Prediction in the Right Window
4. Conclusions
- (1)
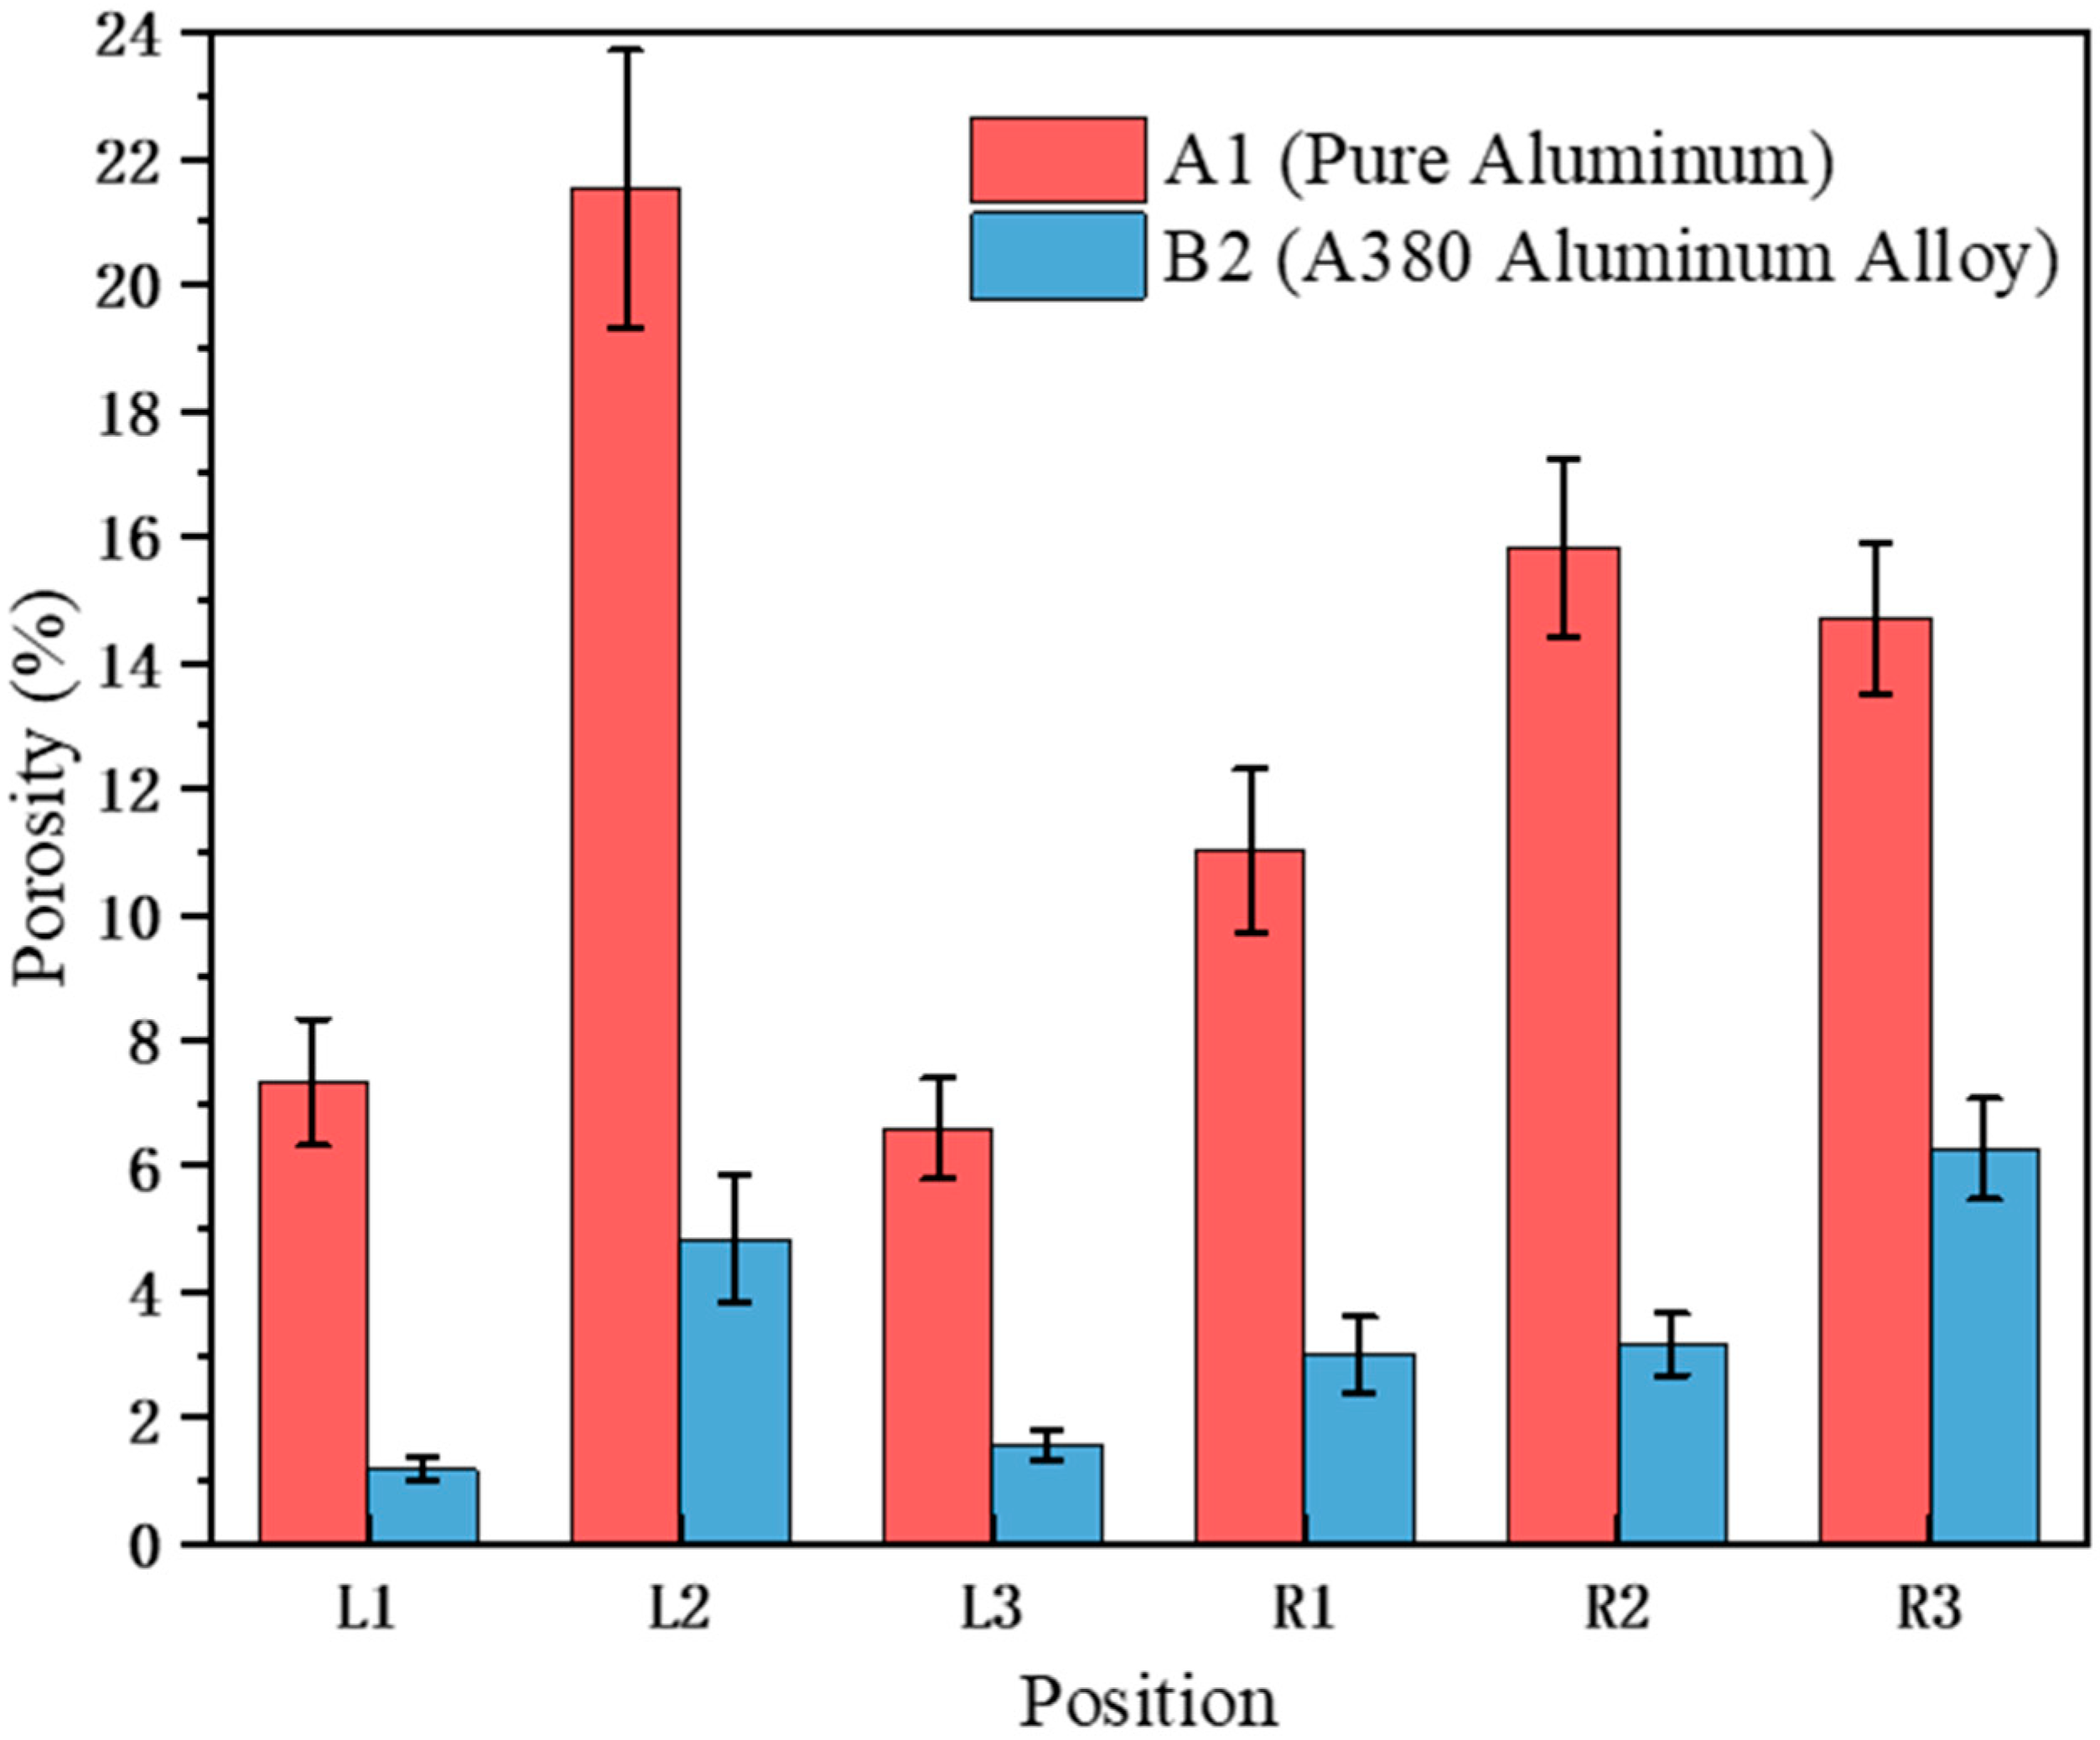
- Under similar injection velocity, the porosity of pure aluminum was significantly greater than the porosity of the aluminum alloy at each position. Pure aluminum had a large degree of fracture in the filling process, whereas the A380 aluminum alloy had a small degree of fracture and basically maintained a continuous state.
- (2)
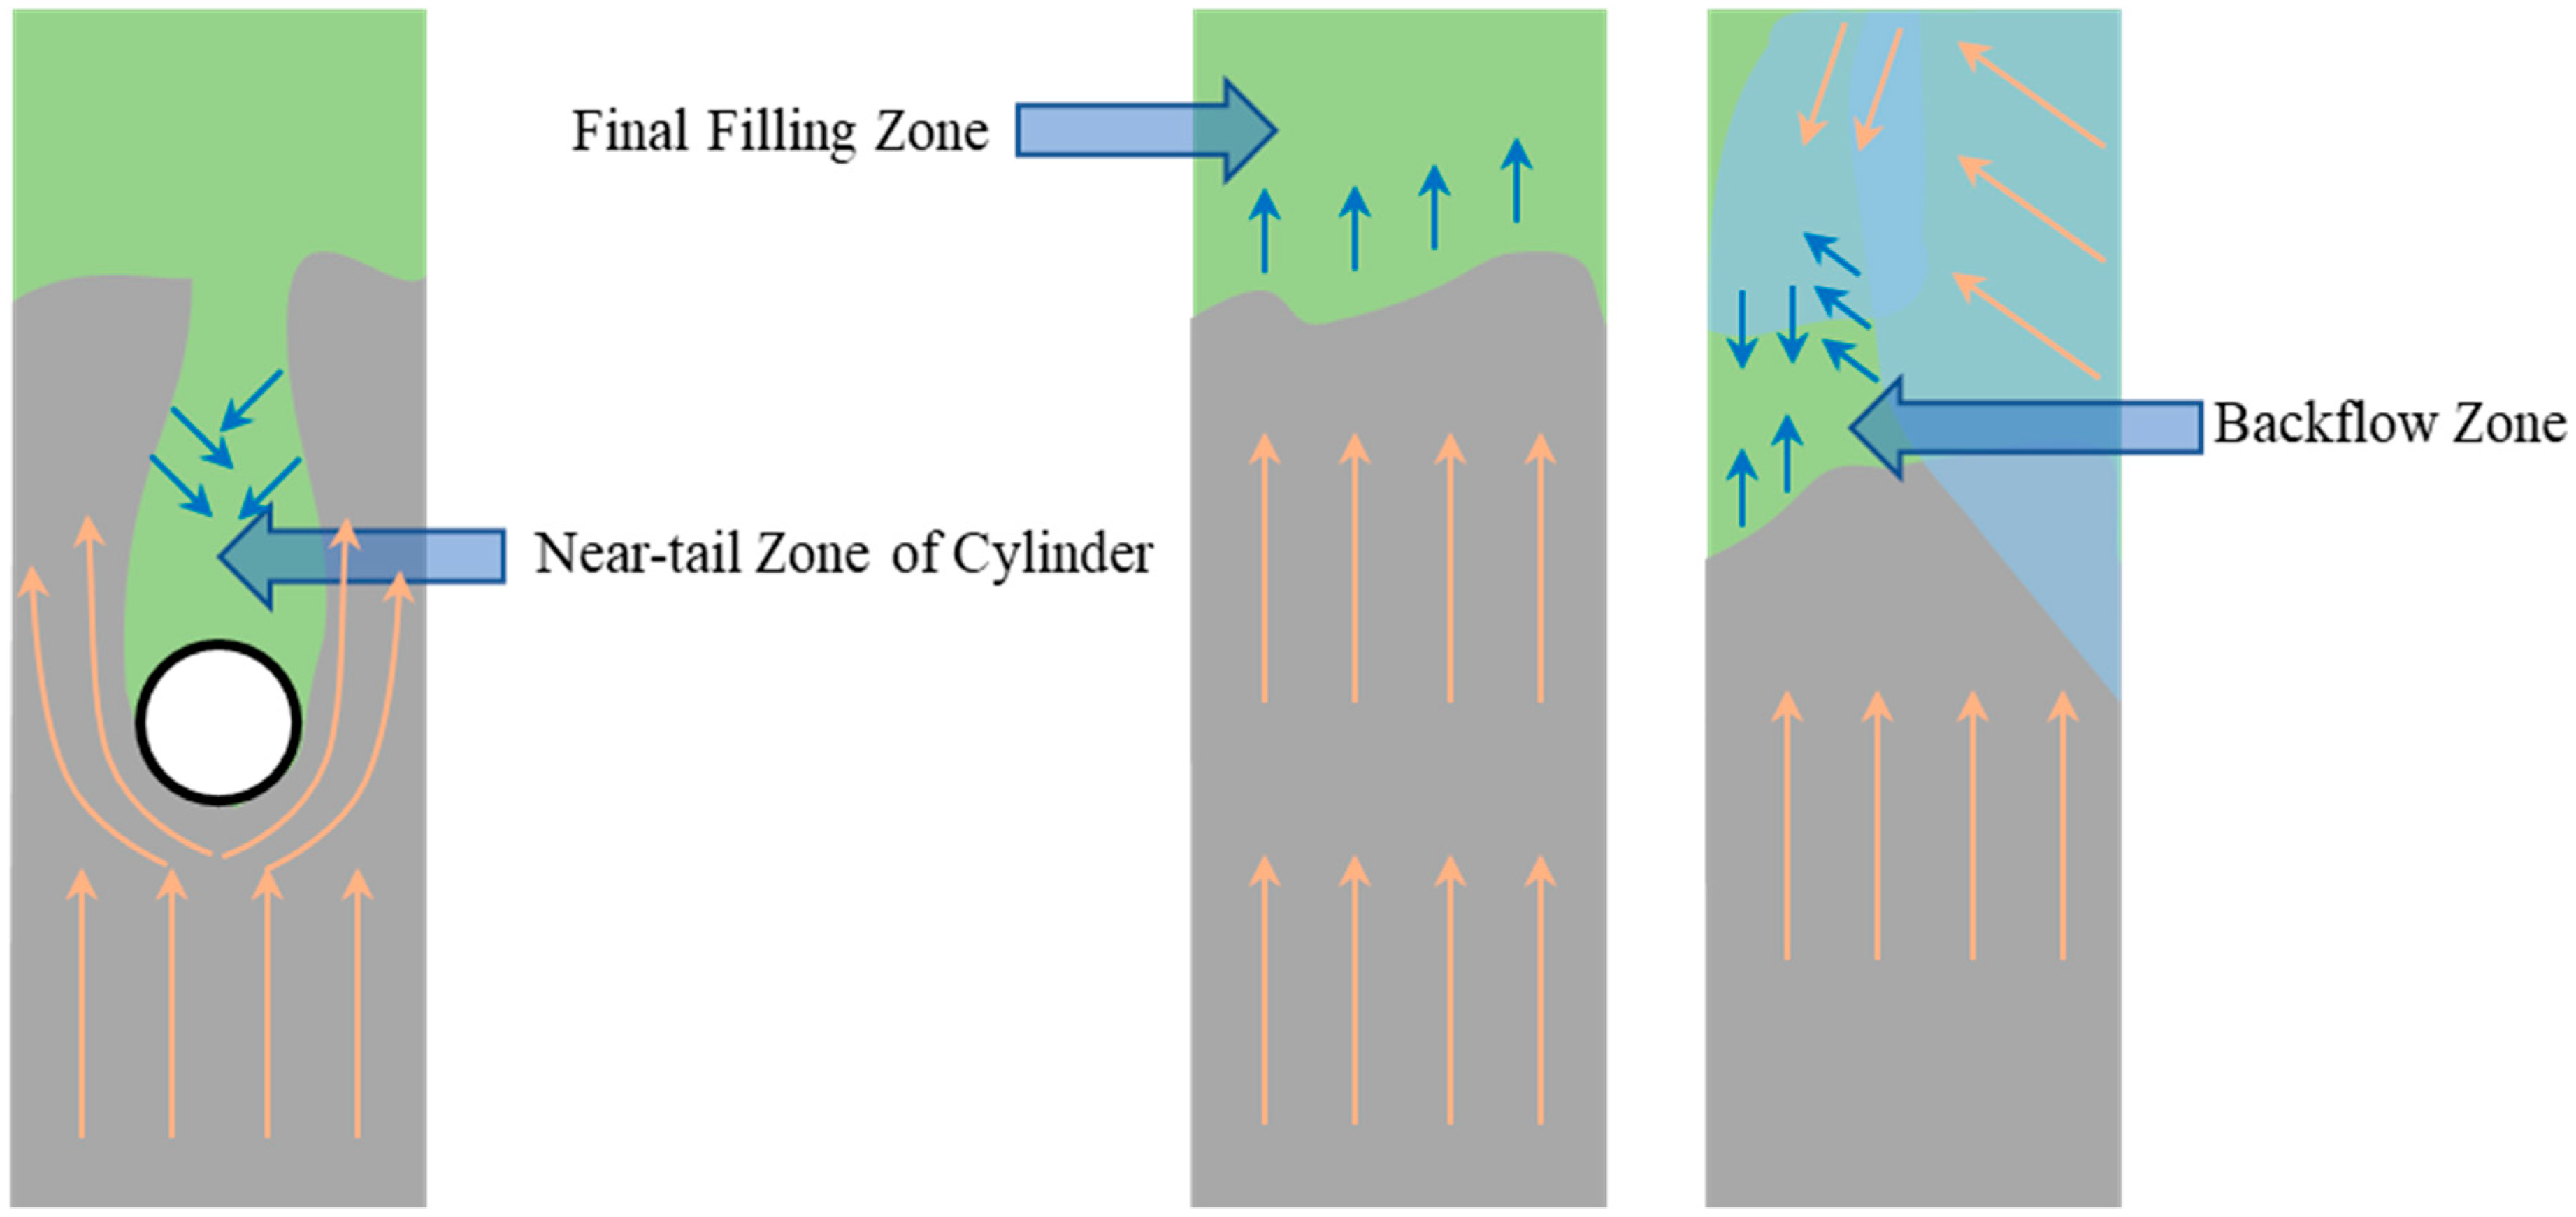
- The porosity of different regions was closely related to the flow state of the aluminum liquid. The highest porosity in the backflow zone, the second highest in the final filling zone, and the near-tail zone of the cylinder were determined from the filling process analysis and porosity calculation results. The final filling position changed as injection velocity changed.
- (3)
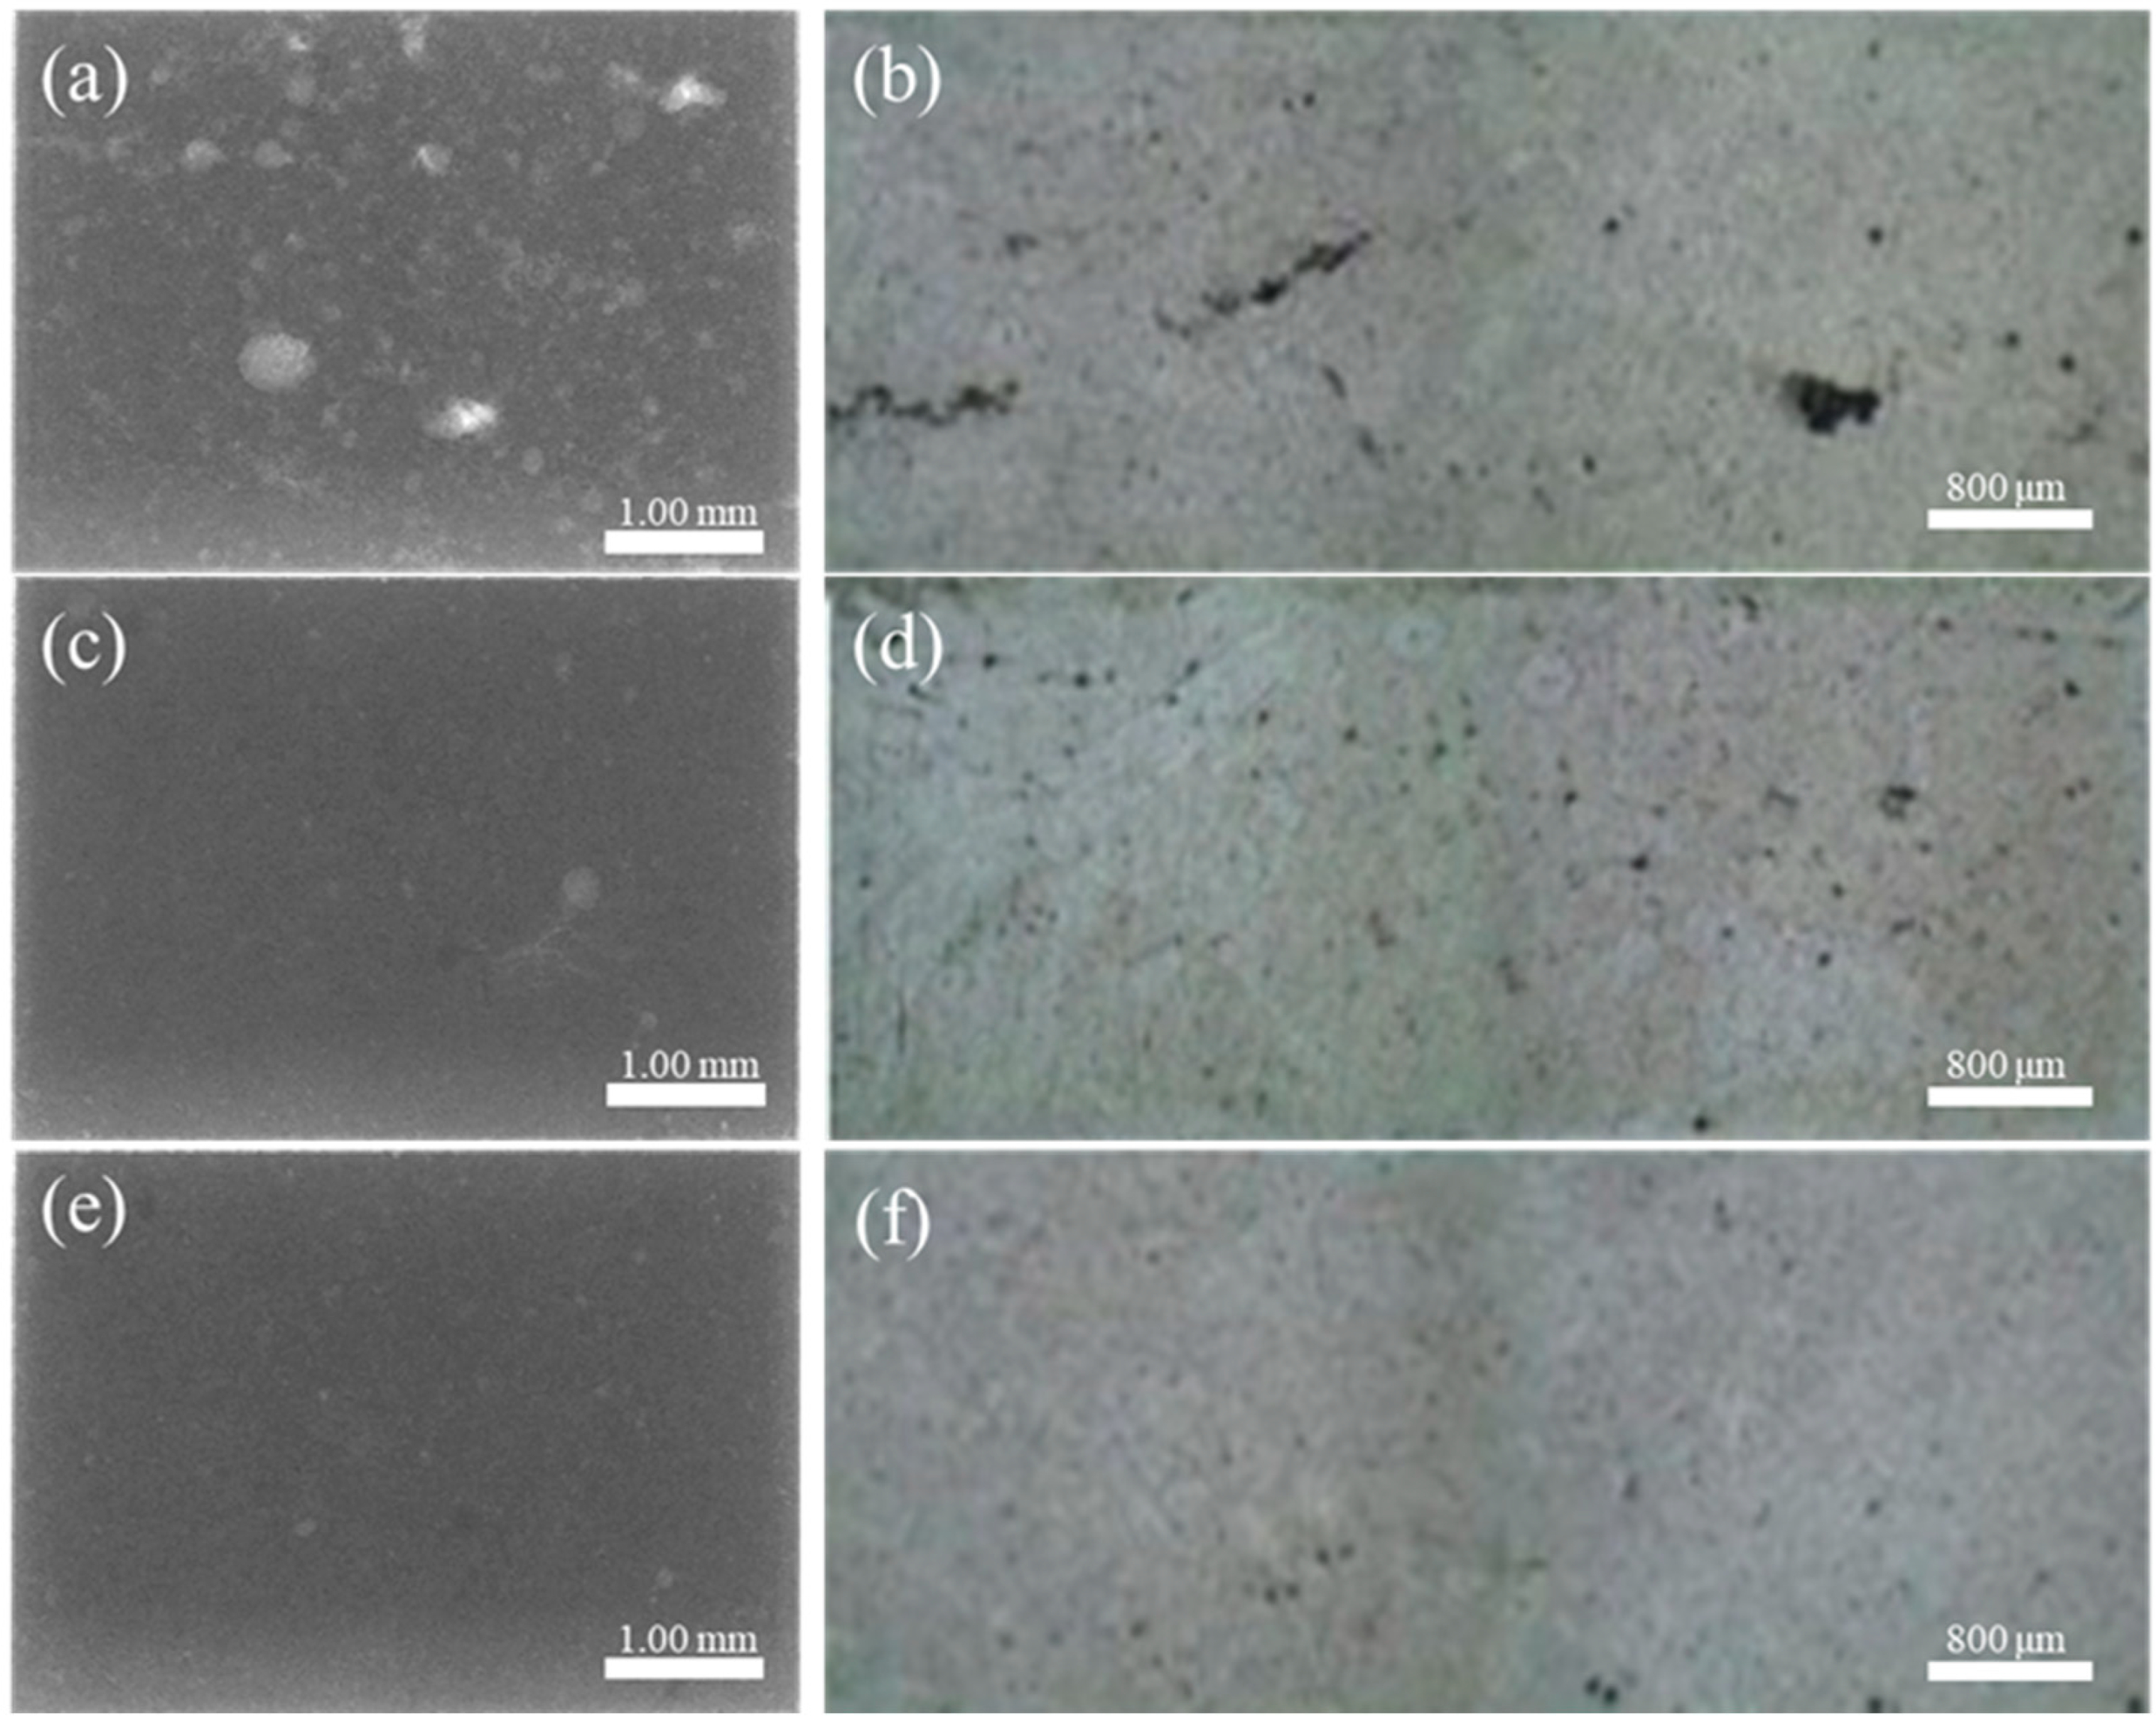
- The pores in the flowback zone and final filling zone are larger and more numerous from the microstructure and pore defects shown in X-ray and OM images, which has the same conclusion as the porosity calculation.
Author Contributions
Funding
Acknowledgments
Conflicts of Interest
References
- Dong, X.; Zhu, X.; Ji, S. Effect of super vacuum assisted high pressure die casting on the repeatability of mechanical properties of Al-Si-Mg-Mn die-cast alloys. J. Mater. Process. Technol. 2019, 266, 105–113. [Google Scholar] [CrossRef]
- Bi, C.; Guo, Z.; Xiong, S. Modelling and simulation for die casting mould filling process using Cartesian cut cell approach. Int. J. Cast Met. Res. 2015, 28, 234–241. [Google Scholar] [CrossRef]
- Cao, L.; Liao, D.; Sun, F.; Chen, T.; Teng, Z.; Tang, Y. Prediction of gas entrapment defects during zinc alloy high-pressure die casting based on gas-liquid multiphase flow model. Int. J. Adv. Manuf. Technol. 2018, 94, 807–815. [Google Scholar] [CrossRef]
- Hernandez-Ortega, J.J.; Zamora, R.; Palacios, J.; Lopez, J.; Faura, F. An Experimental and Numerical Study of Flow Patterns and Air Entrapment Phenomena During the Filling of a Vertical Die Cavity. J. Manuf. Sci. Eng. Trans. ASME 2010, 132, 9. [Google Scholar] [CrossRef]
- Wang, X.J.; Zhu, S.M.; Easton, M.A.; Gibson, M.A.; Savage, G. Heat treatment of vacuum high pressure die cast magnesium alloy AZ91. Int. J. Cast Met. Res. 2013, 27, 161–166. [Google Scholar] [CrossRef]
- Zhao, H.D.; Wang, F.; Li, Y.Y.; Xia, W. Experimental and numerical analysis of gas entrapment defects in plate ADC12 die castings. J. Mater. Process. Technol. 2009, 209, 4537–4542. [Google Scholar] [CrossRef]
- Niu, X.-F.; Fang, Z.; Liang, W.; Hou, H.; Wang, H.-X. New numerical algorithm of gas–liquid two-phase flow considering characteristics of liquid metal during mold filling. Trans. Nonferrous Met. Soc. China 2014, 24, 790–797. [Google Scholar] [CrossRef]
- Chenadec, V.L.; Pitsch, H. A 3D Unsplit Forward/Backward Volume-of-Fluid Approach and Coupling to the Level Set Method. J. Comput. Phys. 2013, 233, 10–33. [Google Scholar] [CrossRef]
- Cleary, P.W.; Savage, G.; Ha, J.; Prakash, M. Flow analysis and validation of numerical modelling for a thin walled high pressure die casting using SPH. Comput. Part. Mech. 2014, 1, 229–243. [Google Scholar] [CrossRef]
- Yuan, L.; Yang, J.; Xiong, S.M.; Liu, B.C. Water analogue validation of numerical model for fluid flow during slow shot phase in die casting process. Int. J. Cast Met. Res. 2013, 21, 401–407. [Google Scholar] [CrossRef]
- Chimani, C.M.; Kretz, R.; Schneiderbauer, S.; Puttinger, S.; Pirker, S. Studies on Flow Characteristics at High-Pressure Die-Casting. In Light Metals; The Minerals, Metals & Materials Society: Pittsburgh, PA, USA, 2012; pp. 443–447. [Google Scholar]
- Faura, F.; Lopez, J.; Hernandez, J. On the optimum plunger acceleration law in the slow shot phase of pressure die casting machines. Int. J. Mach. Tools Manuf. 2001, 41, 173–191. [Google Scholar] [CrossRef]
- Ha, J.; Cleary, P.W. Comparison of SPH simulations of high pressure die casting with the experiments and VOF simulations of Schmid and Klein. Int. J. Cast Met. Res. 2000, 12, 409–418. [Google Scholar] [CrossRef]
- Bonet, J.; Kulasegaram, S. Correction and stabilization of smooth particle hydrodynamics methods with applications in metal forming simulations. Int. J. Numer. Methods Eng. 2000, 47, 1189–1214. [Google Scholar] [CrossRef]
- Shahane, S.; Aluru, N.; Ferreira, P.; Kapoor, S.G.; Vanka, S.P. Finite volume simulation framework for die casting with uncertainty quantification. Appl. Math. Model. 2019, 74, 132–150. [Google Scholar] [CrossRef]
- Fu, J.H.; Coleman, J.; Poole, G.; Krane, M.J.M.; Marconnet, A. Uncertainty Propagation Through a Simulation of Industrial High Pressure Die Casting. J. Heat Transf. Trans. ASME 2019, 141, 7. [Google Scholar] [CrossRef]
- Han, T.-H.; Kuo, J.-H.; Hwang, W.-S. Numerical Simulation of the Liquid-Gas Interface Shape in the Shot Sleeve of Cold Chamber Die Casting Machine. J. Mater. Eng. Perform. 2007, 16, 521–526. [Google Scholar] [CrossRef]
- Griffiths, W.D.; Ainsworth, M.J. Instability of the Liquid Metal–Pattern Interface in the Lost Foam Casting of Aluminum Alloys. Metall. Mater. Trans. A 2016, 47, 3137–3149. [Google Scholar] [CrossRef]
- Ohnaka, I.; Sugiyama, A.; Ikeda, T.; Yasuda, H. Mold filling and prevention of gas entrapment in high-pressure die-casting. J. Mater. Sci. Technol. 2008, 24, 139–140. [Google Scholar]
- Cao, H.; Shen, C.; Wang, C.; Xu, H.; Zhu, J. Direct Observation of Filling Process and Porosity Prediction in High Pressure Die Casting. Materials 2019, 12, 1099. [Google Scholar] [CrossRef]
- Pratten, N.A. The precise measurement of the density of small samples. J. Mater. Sci. 1981, 16, 1734–1747. [Google Scholar] [CrossRef]
- Homayonifar, P.; Babaei, R.; Attar, E.; Shahinfar, S.; Davami, P. Numerical modeling of splashing and air entrapment in high-pressure die casting. Int. J. Adv. Manuf. Technol. 2008, 39, 219–228. [Google Scholar] [CrossRef]
- Armillotta, A.; Fasoli, S.; Guarinoni, A. Cold flow defects in zinc die casting: Prevention criteria using simulation and experimental investigations. Int. J. Adv. Manuf. Technol. 2015, 85, 605–622. [Google Scholar] [CrossRef]
- Kwon, Y.-D.; Lee, Z.-H. The effect of grain refining and oxide inclusion on the fluidity of Al–4.5Cu–0.6Mn and A356 alloys. Mater. Sci. Eng. A 2003, 360, 372–376. [Google Scholar] [CrossRef]
- Sumner, D.; Price, S.J.; Paidoussis, M.P. Flow-pattern identification for two staggered circular cylinders in cross-flow. J. Fluid Mech. 2000, 411, 263–303. [Google Scholar] [CrossRef]
- Gu, Z.; Sun, T. On interference between two circular cylinders in staggered arrangement at high subcritical Reynolds numbers. J. Wind Eng. Ind. Aerodyn. 1999, 80, 287–309. [Google Scholar] [CrossRef]


| Element | Si | Cu | Mg | Fe | Zn | Mn | Ni | Sn | Al |
|---|---|---|---|---|---|---|---|---|---|
| wt.% | 9.146 | 3.140 | 0.104 | 0.154 | 0.141 | 0.103 | 0.101 | 0.100 | REM |
| Experiment | Material | Pouring Temperature | Fast Shoot Speed |
|---|---|---|---|
| A1 | Pure Aluminum | 750 ± 10 °C | 0.88 m/s |
| A2 | Pure Aluminum | 750 ± 10 °C | 1.59 m/s |
| A3 | Pure Aluminum | 750 ± 10 °C | 2.34 m/s |
| B1 | A380 | 700 ± 10 °C | 0.66 m/s |
| B2 | A380 | 700 ± 10 °C | 0.80 m/s |
| B3 | A380 | 700 ± 10 °C | 1.06 m/s |
| Properties | Value |
|---|---|
| Density | 2.23 g/cm3 |
| Hardness | 6.5 Mohs’ |
| Young’s Modulus | 6680 N/mm2 |
| Bending Strength | 120–160 MPa |
| Poisson’s Ratio | 0.20 |
| Thermal Expansion Coefficient (20–350 °C) | 32–35 × 10−6 cm/cm·°C |
| Thermal conductivity (20 °C) | 0.82 W/m·°C |
| Specific Heat | 820 J/kg·°C |
| Chemical Composition (wt.%) | Value |
| SiO2 | 81.0% |
| B2O3 | 12.5% |
| Al2O3 | 2.32% |
| Na2O+K2O | 6.0% |
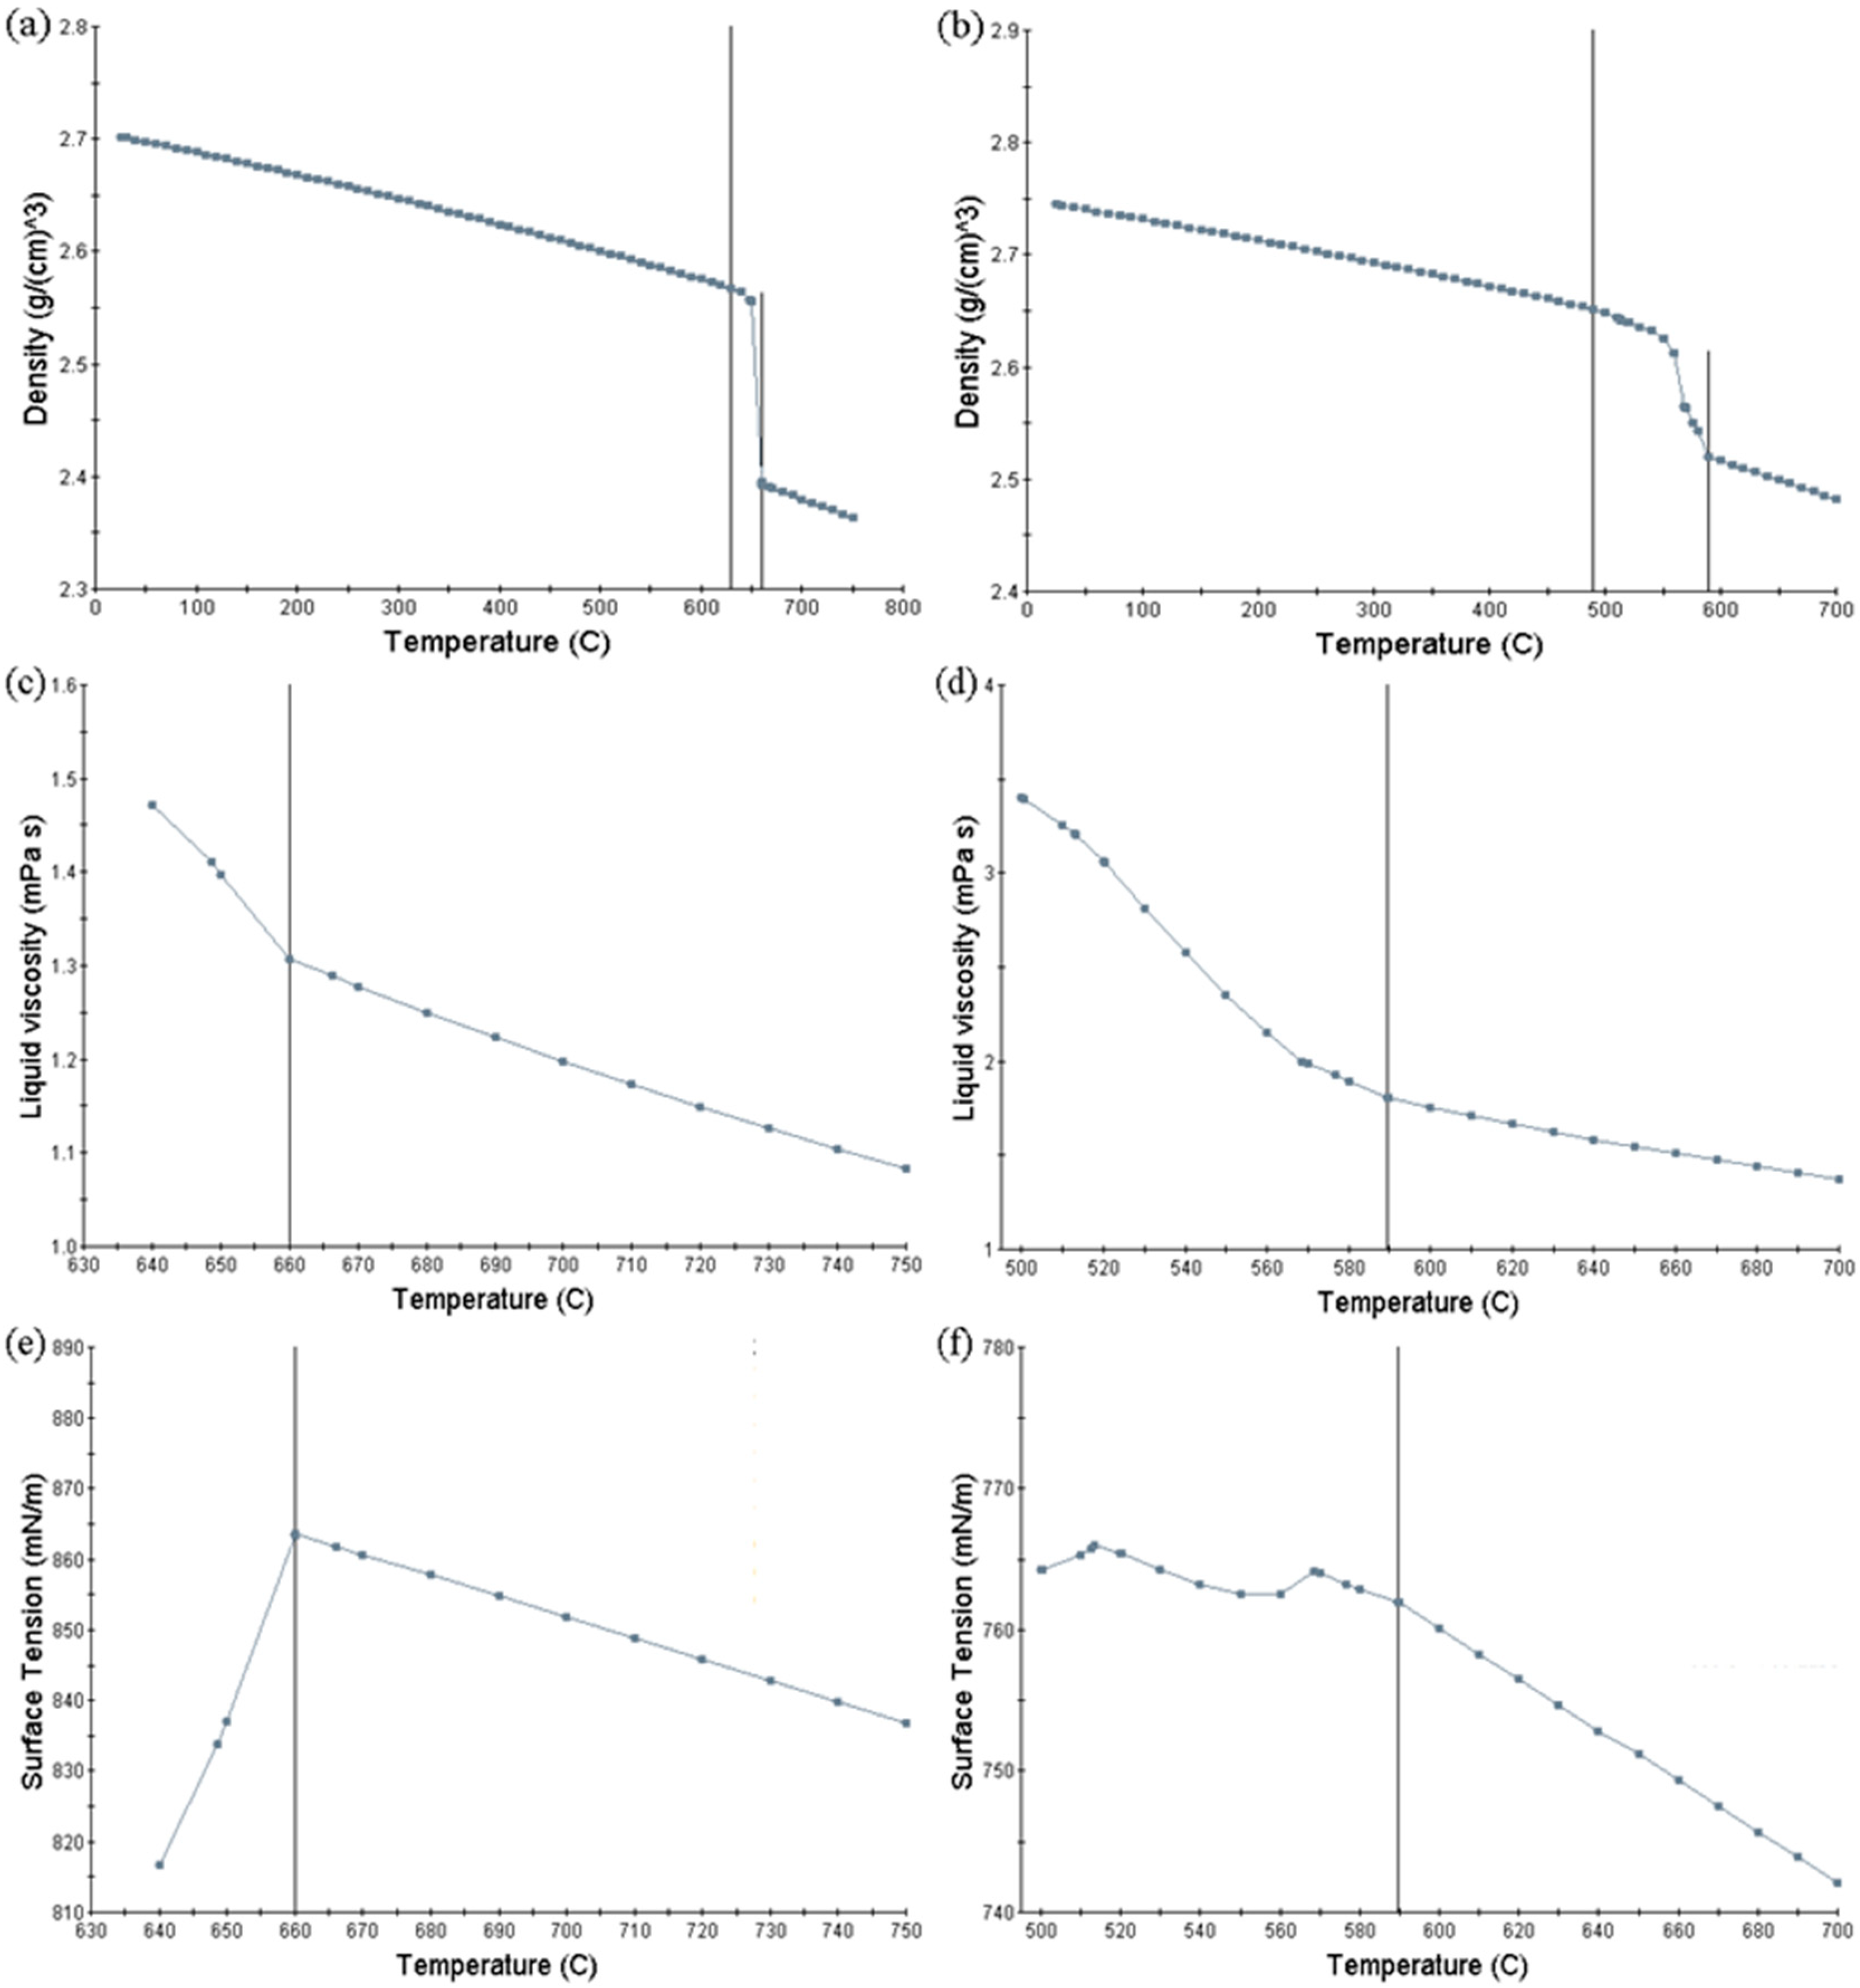
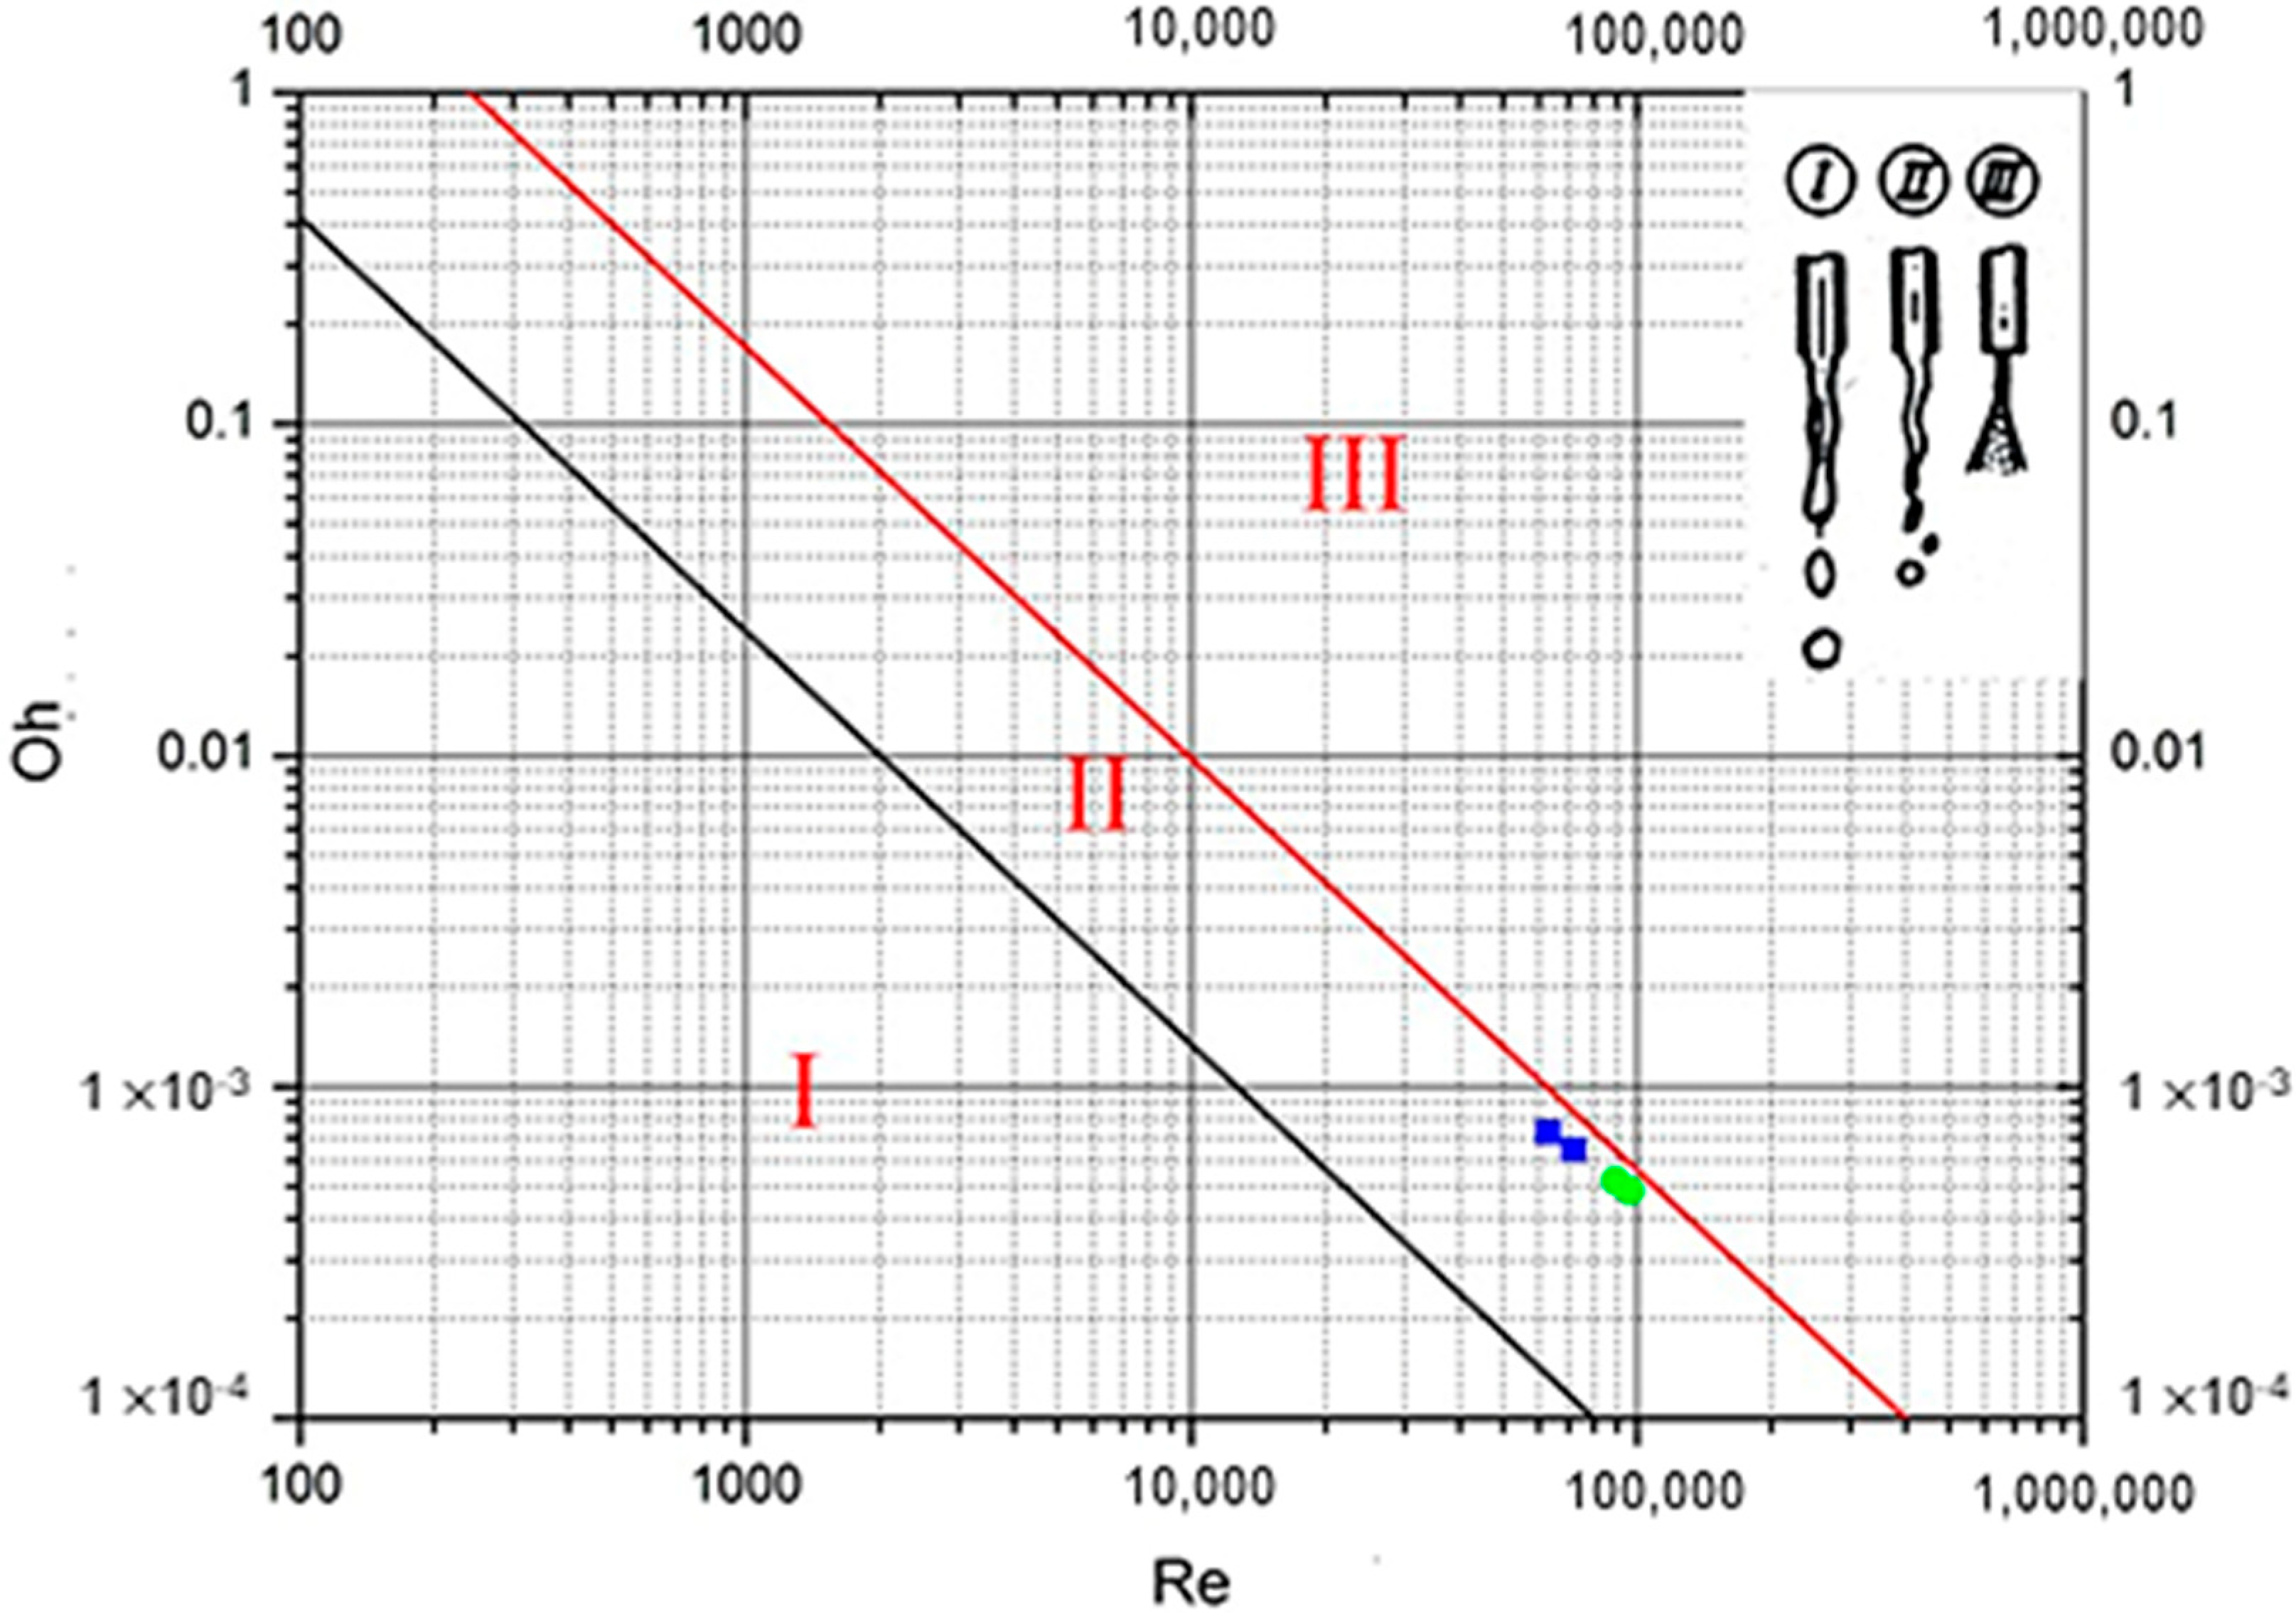
| Material | Temperature (°C) | Density (kg/m3) | Surface Tension (10−3N/m) | Viscosity (10−3 kg/ms) | Ingate Velocity (m/s) | Re | We | Oh (×10−4) |
|---|---|---|---|---|---|---|---|---|
| Pure Aluminum | 750 | 2363.47 | 836.90012 | 1.0837 | 17.6 | 95,960 | 2187 | 4.87 |
| Pure Aluminum | 710 | 2366.81 | 848.90546 | 1.1728 | 17.6 | 88,790 | 2159 | 5.23 |
| A380 | 700 | 2482.5 | 742.06617 | 1.3761 | 16.0 | 72,102 | 2141 | 6.42 |
| A380 | 660 | 2496.2 | 749.34843 | 1.5083 | 16.0 | 66,196 | 2132 | 6.98 |
© 2019 by the authors. Licensee MDPI, Basel, Switzerland. This article is an open access article distributed under the terms and conditions of the Creative Commons Attribution (CC BY) license (http://creativecommons.org/licenses/by/4.0/).
Share and Cite
Cao, H.; Wang, C.; Che, J.; Luo, Z.; Wang, L.; Xiao, L.; Wang, J.; Hu, T. Effect of Flow State of Pure Aluminum and A380 Alloy on Porosity of High Pressure Die Castings. Materials 2019, 12, 4219. https://doi.org/10.3390/ma12244219
Cao H, Wang C, Che J, Luo Z, Wang L, Xiao L, Wang J, Hu T. Effect of Flow State of Pure Aluminum and A380 Alloy on Porosity of High Pressure Die Castings. Materials. 2019; 12(24):4219. https://doi.org/10.3390/ma12244219
Chicago/Turabian StyleCao, Hanxue, Chengcheng Wang, Junqi Che, Ziwei Luo, Luhan Wang, Lang Xiao, Jing Wang, and Tao Hu. 2019. "Effect of Flow State of Pure Aluminum and A380 Alloy on Porosity of High Pressure Die Castings" Materials 12, no. 24: 4219. https://doi.org/10.3390/ma12244219
APA StyleCao, H., Wang, C., Che, J., Luo, Z., Wang, L., Xiao, L., Wang, J., & Hu, T. (2019). Effect of Flow State of Pure Aluminum and A380 Alloy on Porosity of High Pressure Die Castings. Materials, 12(24), 4219. https://doi.org/10.3390/ma12244219