Environmental and Economic Analysis of FDM, SLS and MJF Additive Manufacturing Technologies


Abstract
1. Introduction
2. Materials and Methods
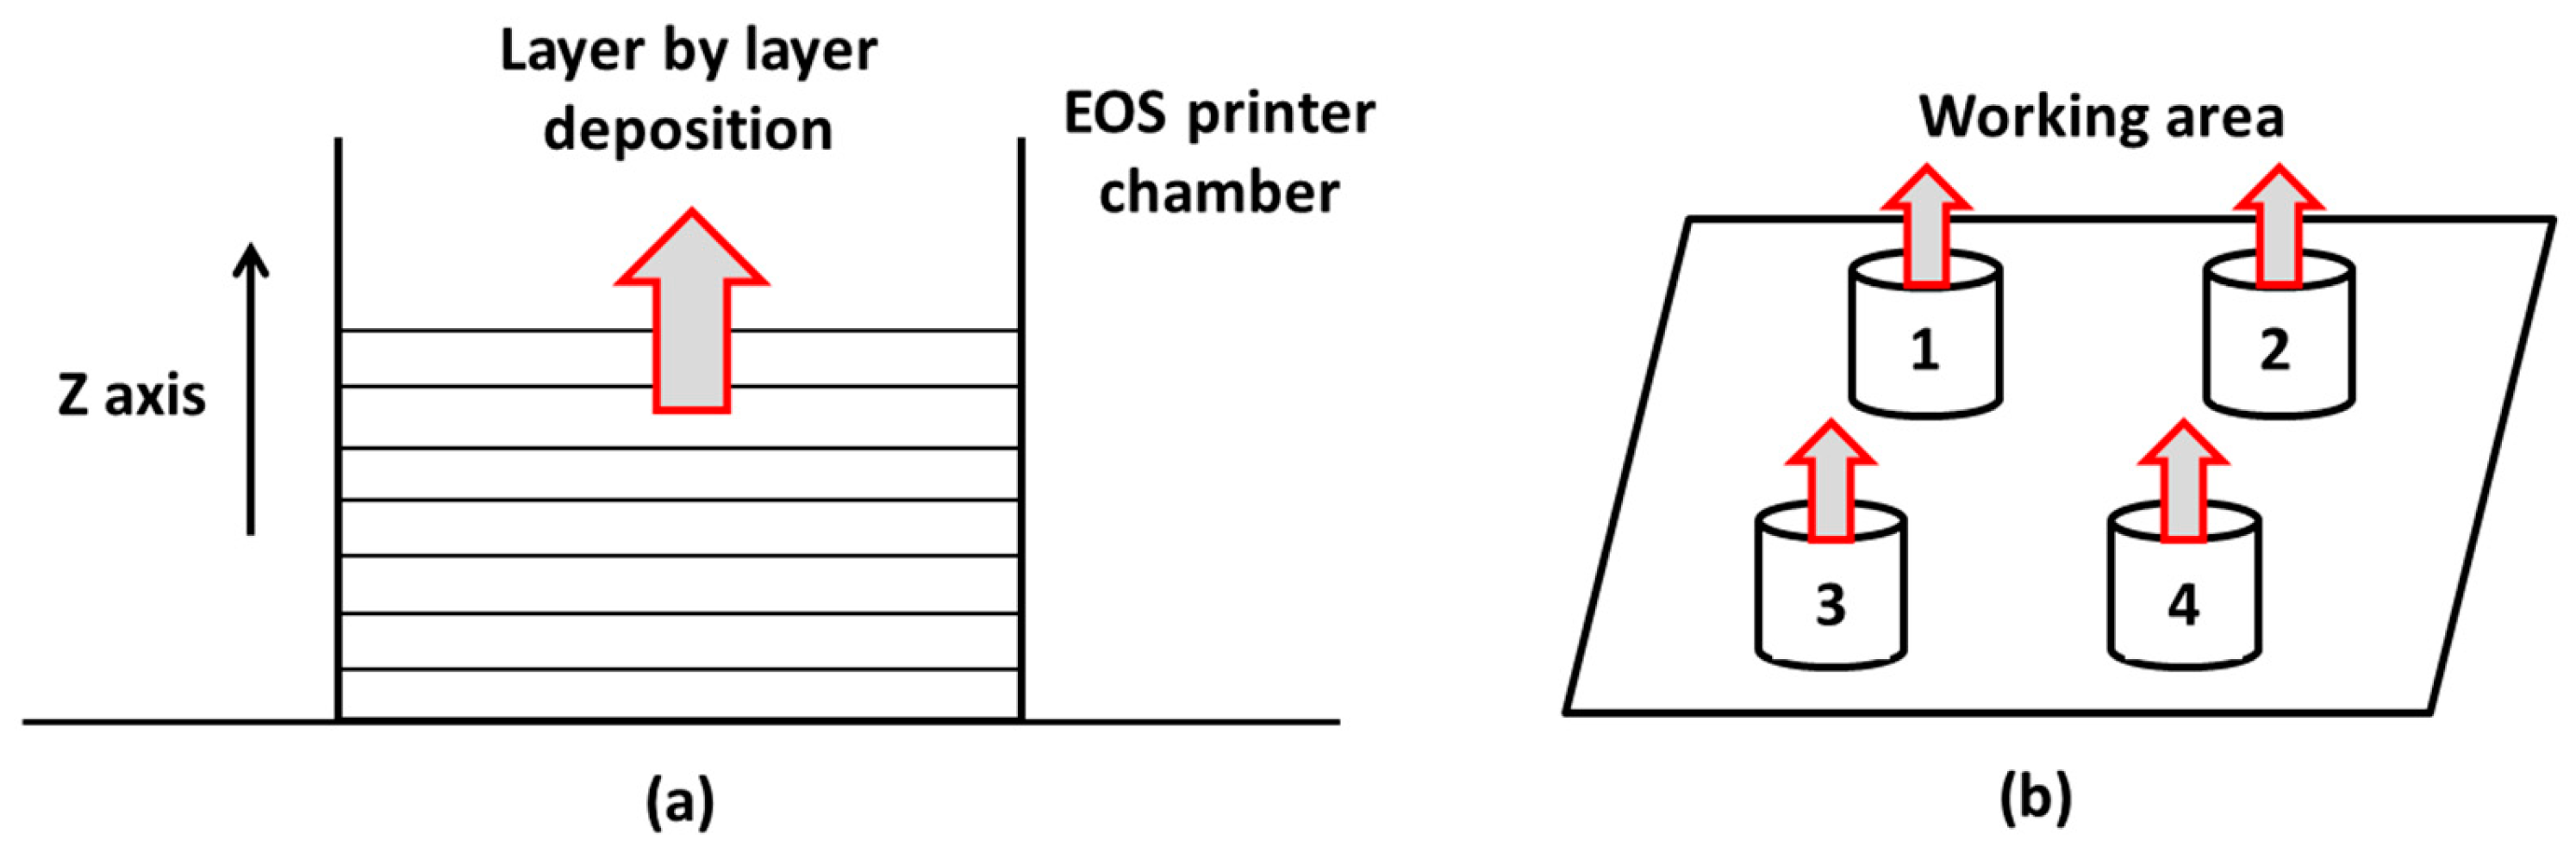
2.1. Experimental
- Preliminary operations: the 3D CAD file is decomposed into layers and positioned to calculate the filament extrusion path, in addition to any supporting materials needed;
- Production: the 3D printer heats the thermoplastic to obtain a semi-liquid state and deposits it in tiny drops along the extrusion path. If necessary, the 3D printer deposits a removable material that serves as a support structure;
- Post-processing: the user removes the support material or dissolves it in water and detergent, such that the piece is ready for use.
2.2. Economic Model
- Raw materials, which are necessary both for the finished product and for the support;
- Labor, which is necessary for the correct operation of the printer;
- Energy, which is necessary to power the printer for all its functions.
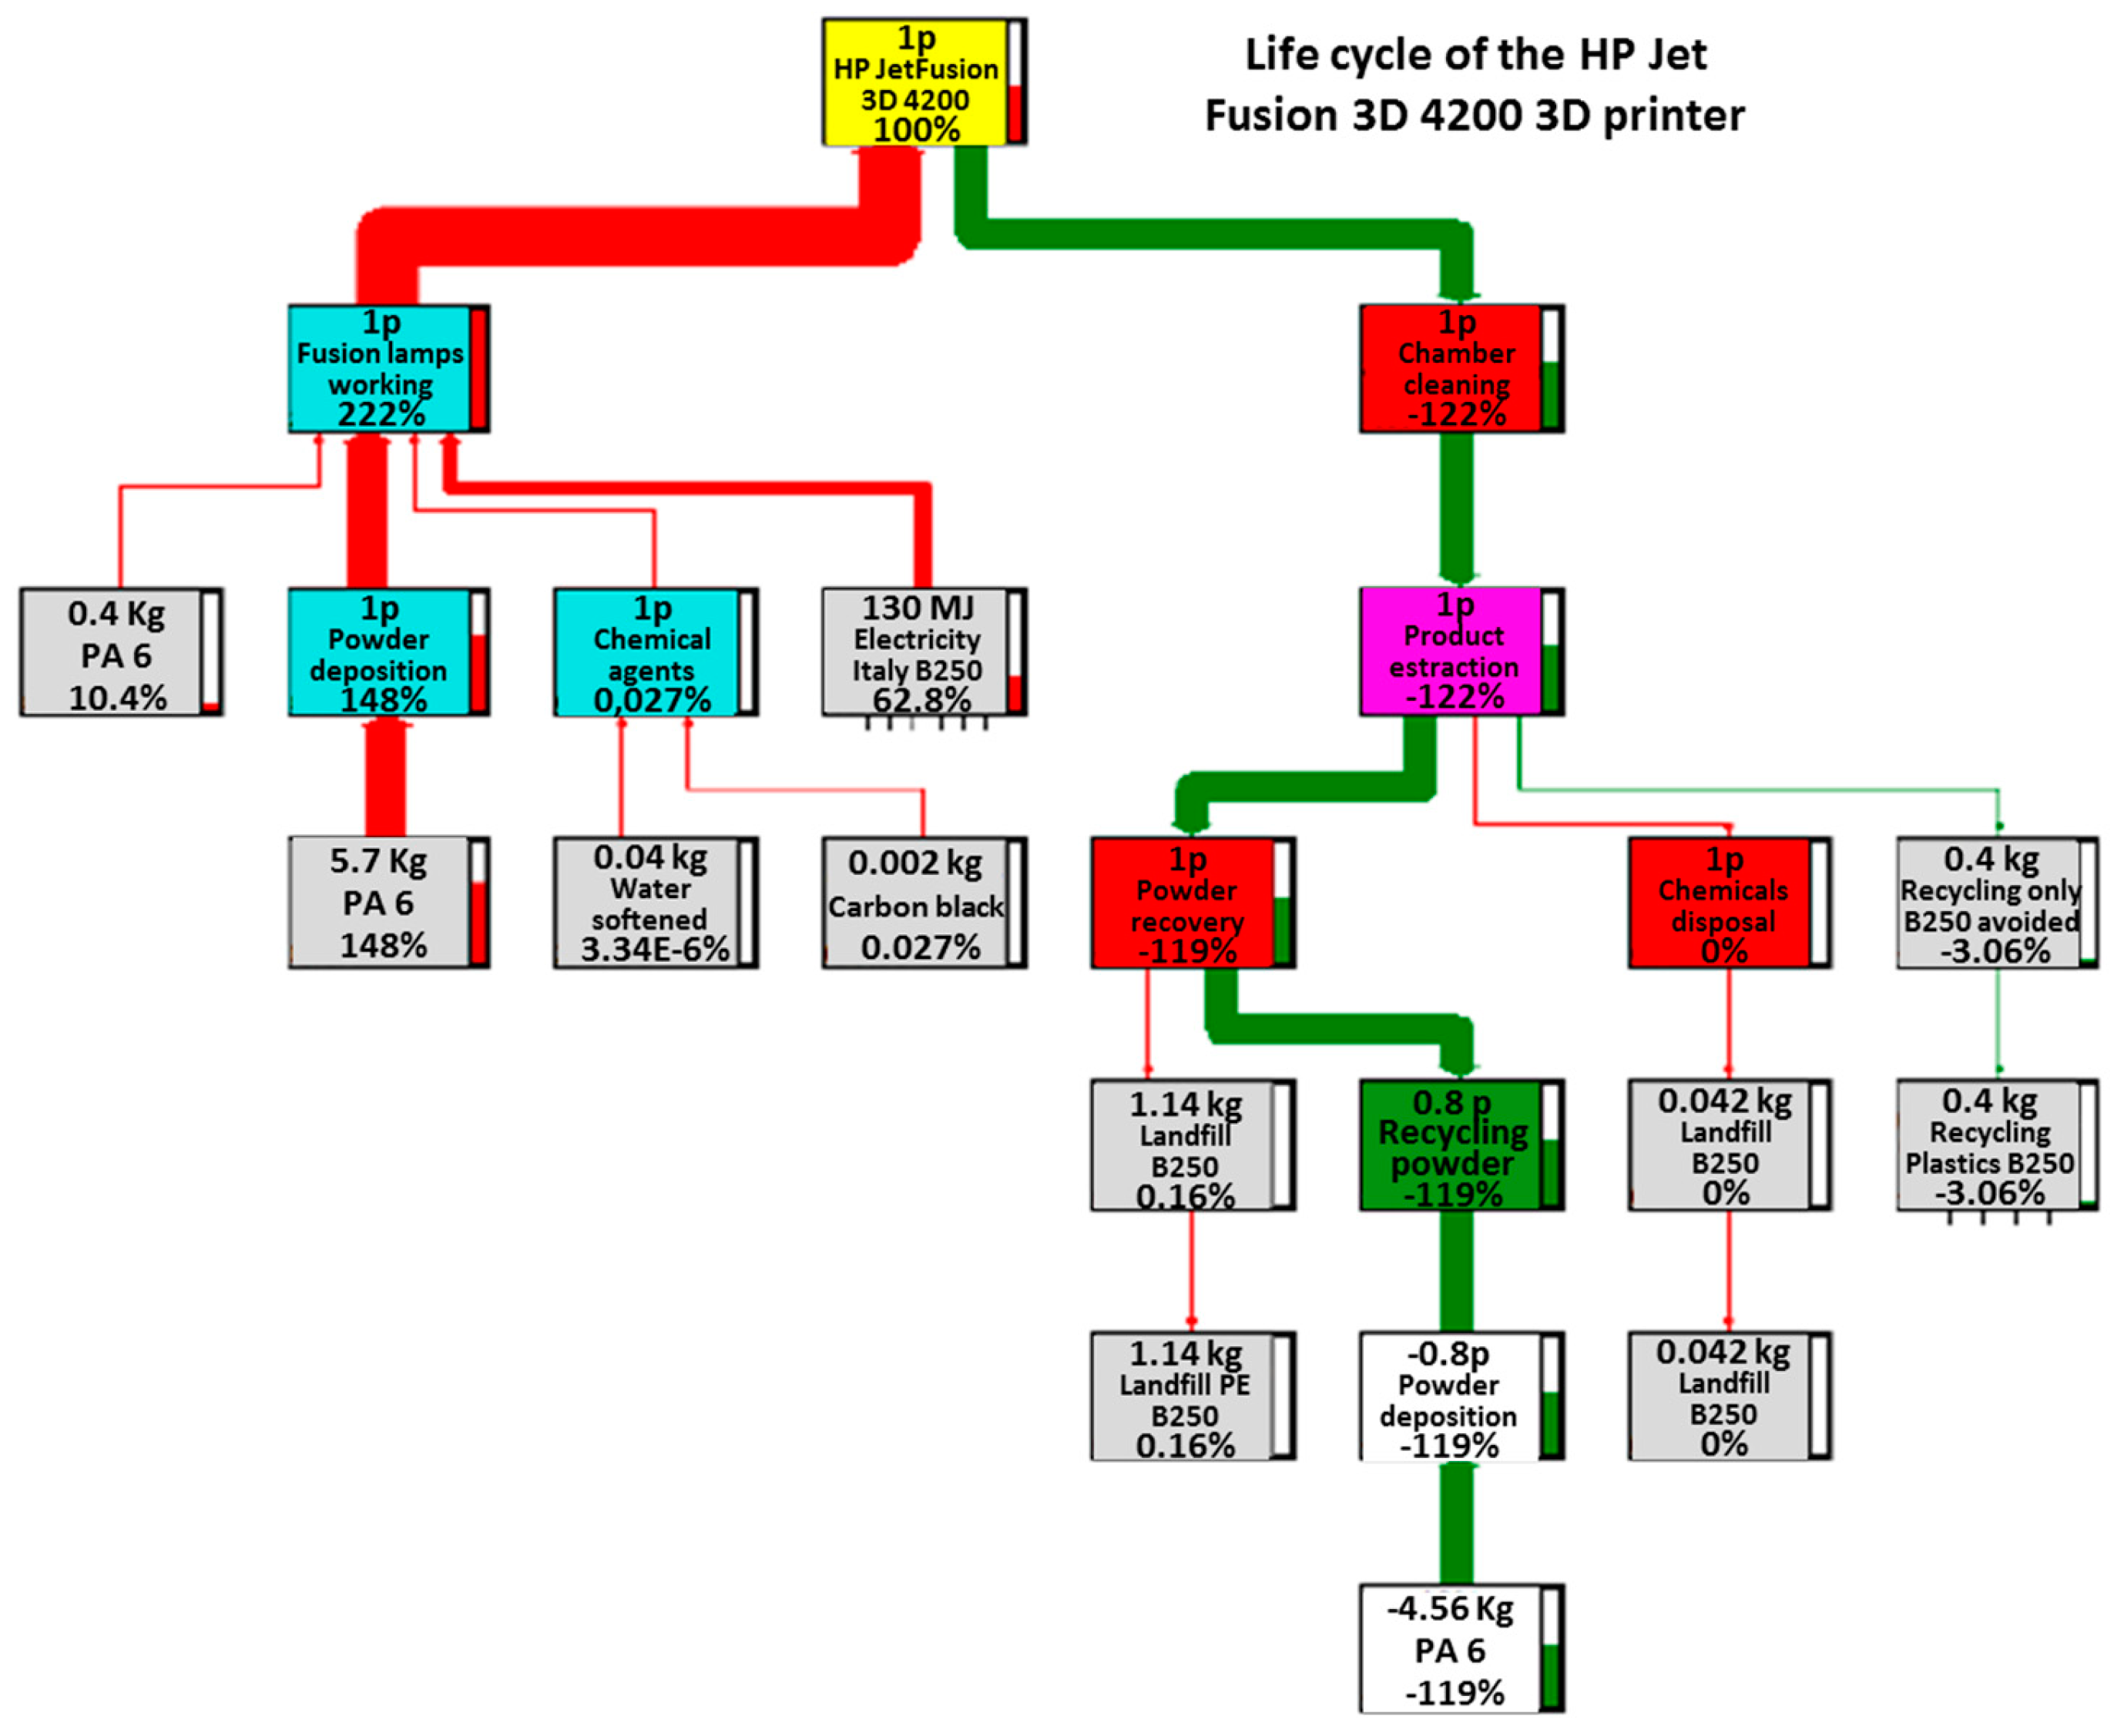
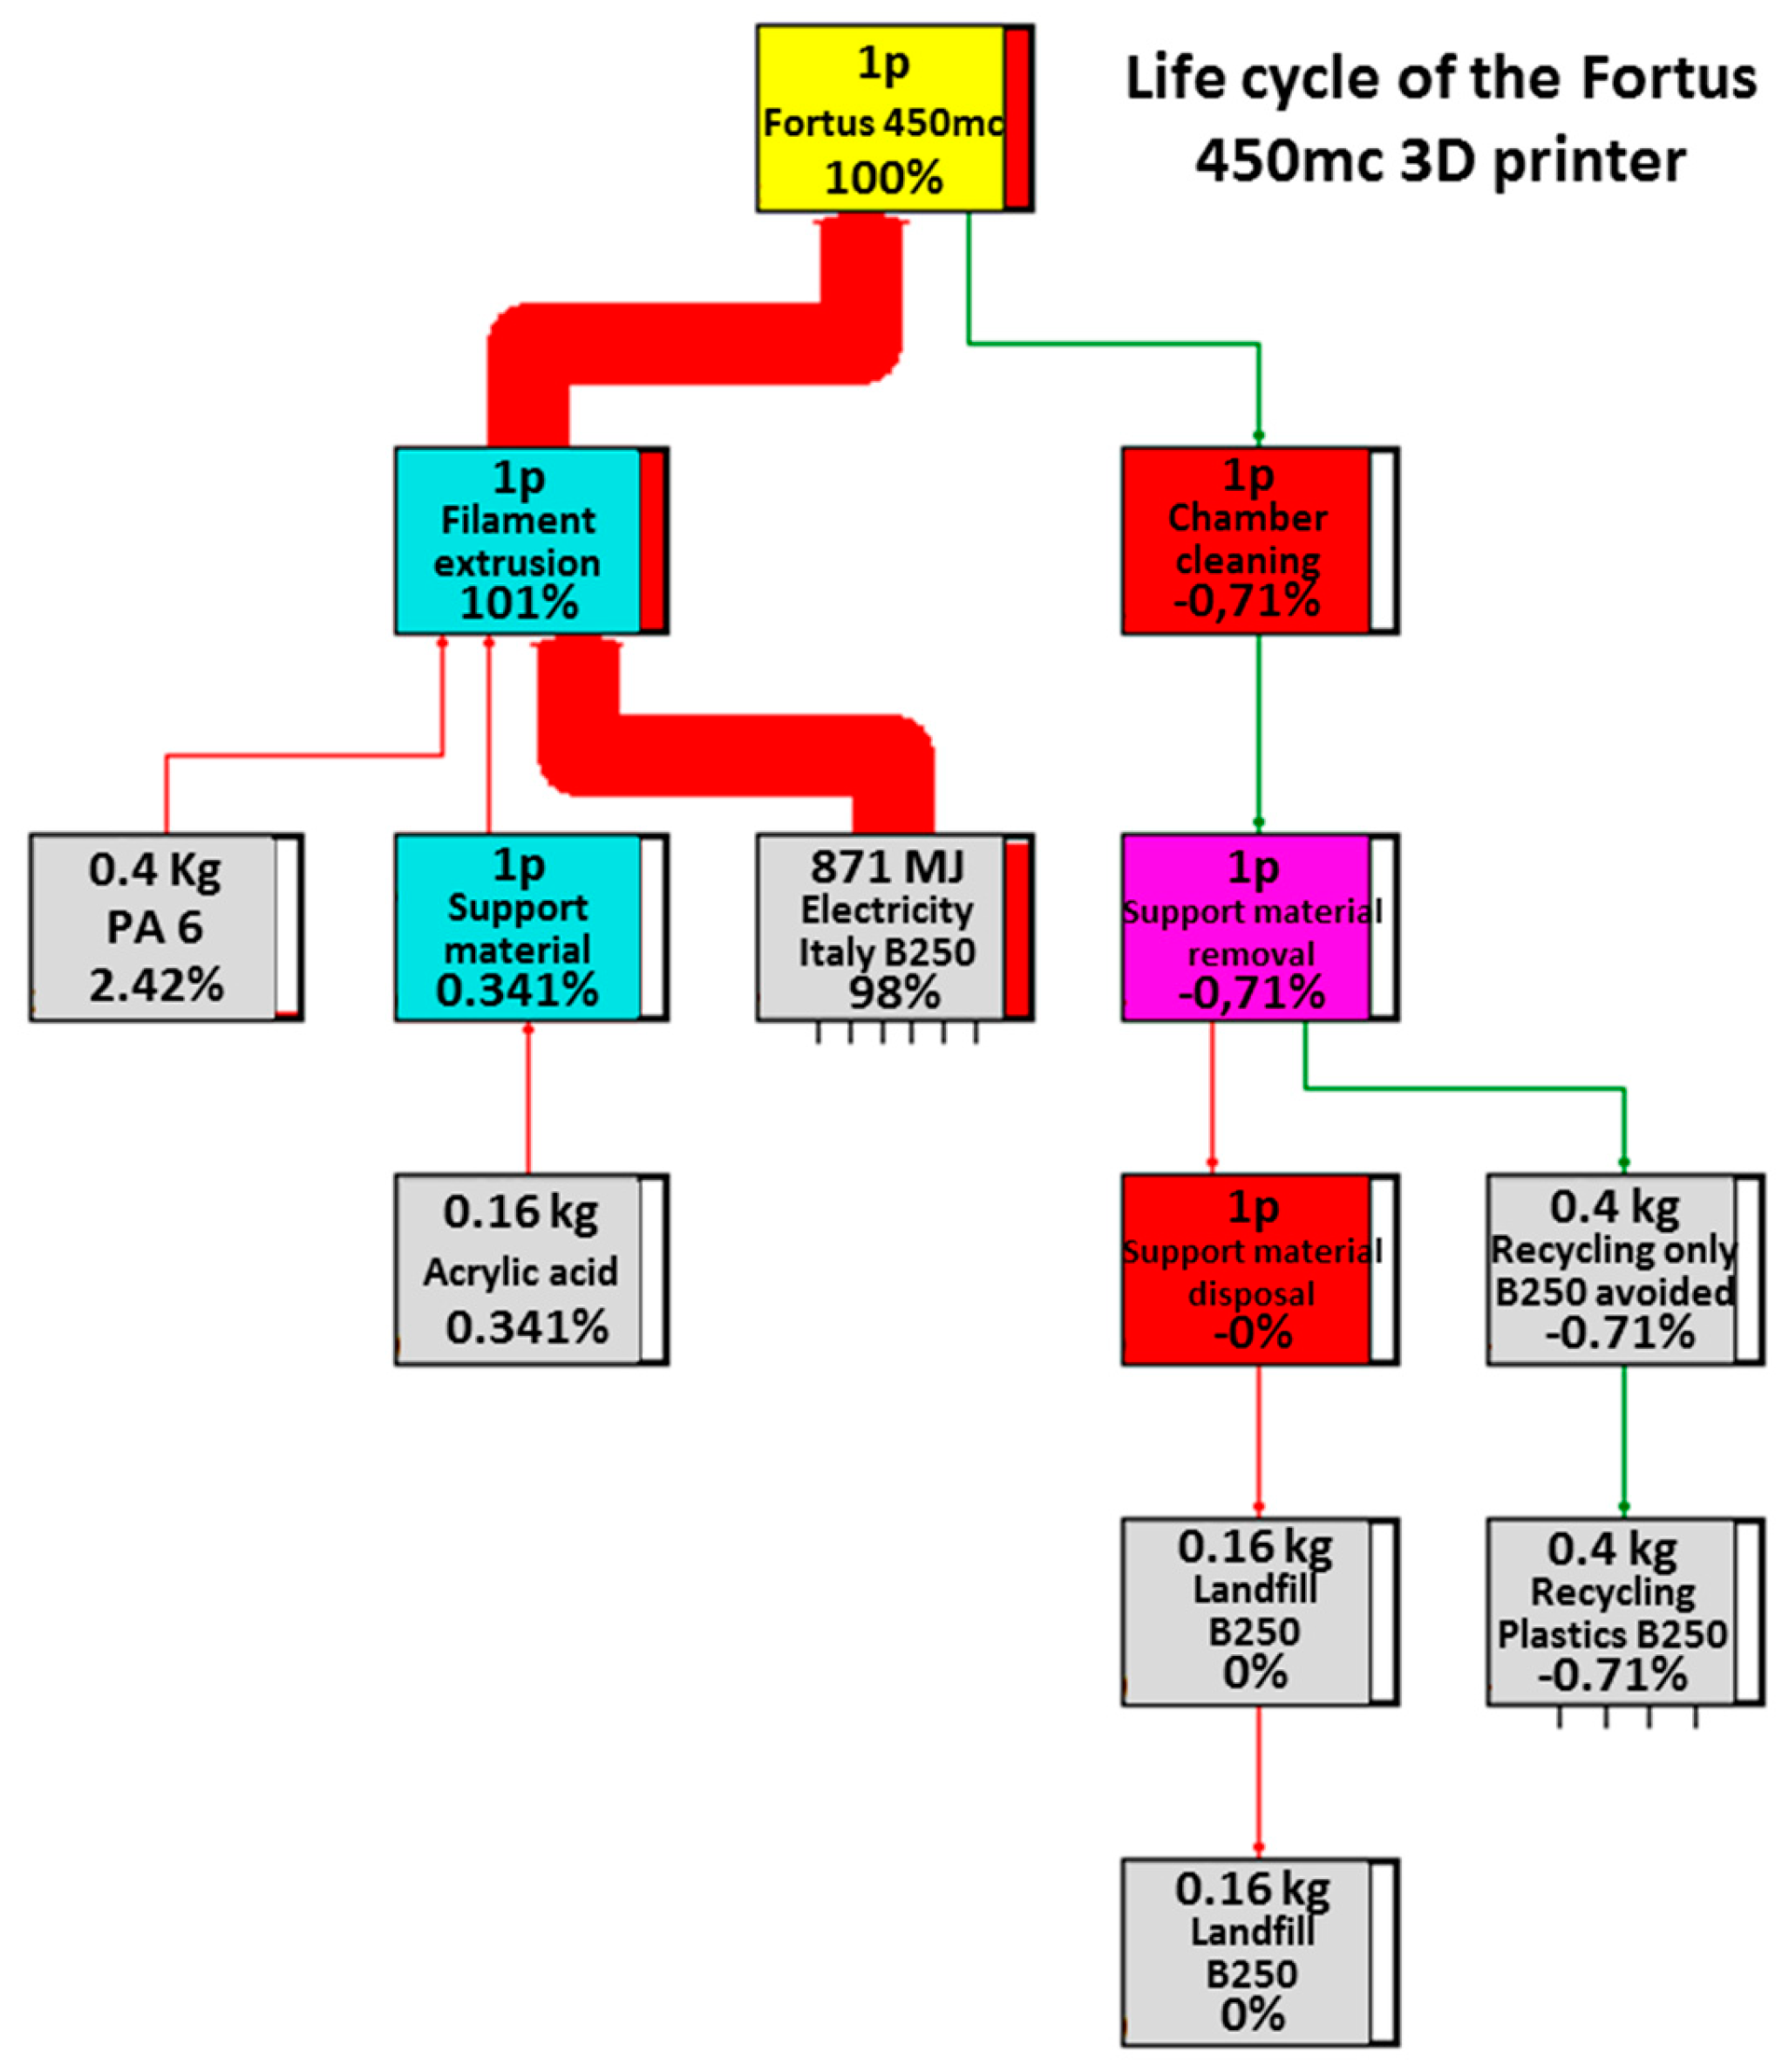
2.3. Life Cycle Analysis
- Scope and objective definition;
- Inventory analysis;
- Impact estimate;
- Interpretation.
- Material: raw material, support material, chemical agents, etc.;
- Energy: compressed air, electricity;
- Disposal: excess powder, finished product;
- Recovery and rework of the excess raw material.
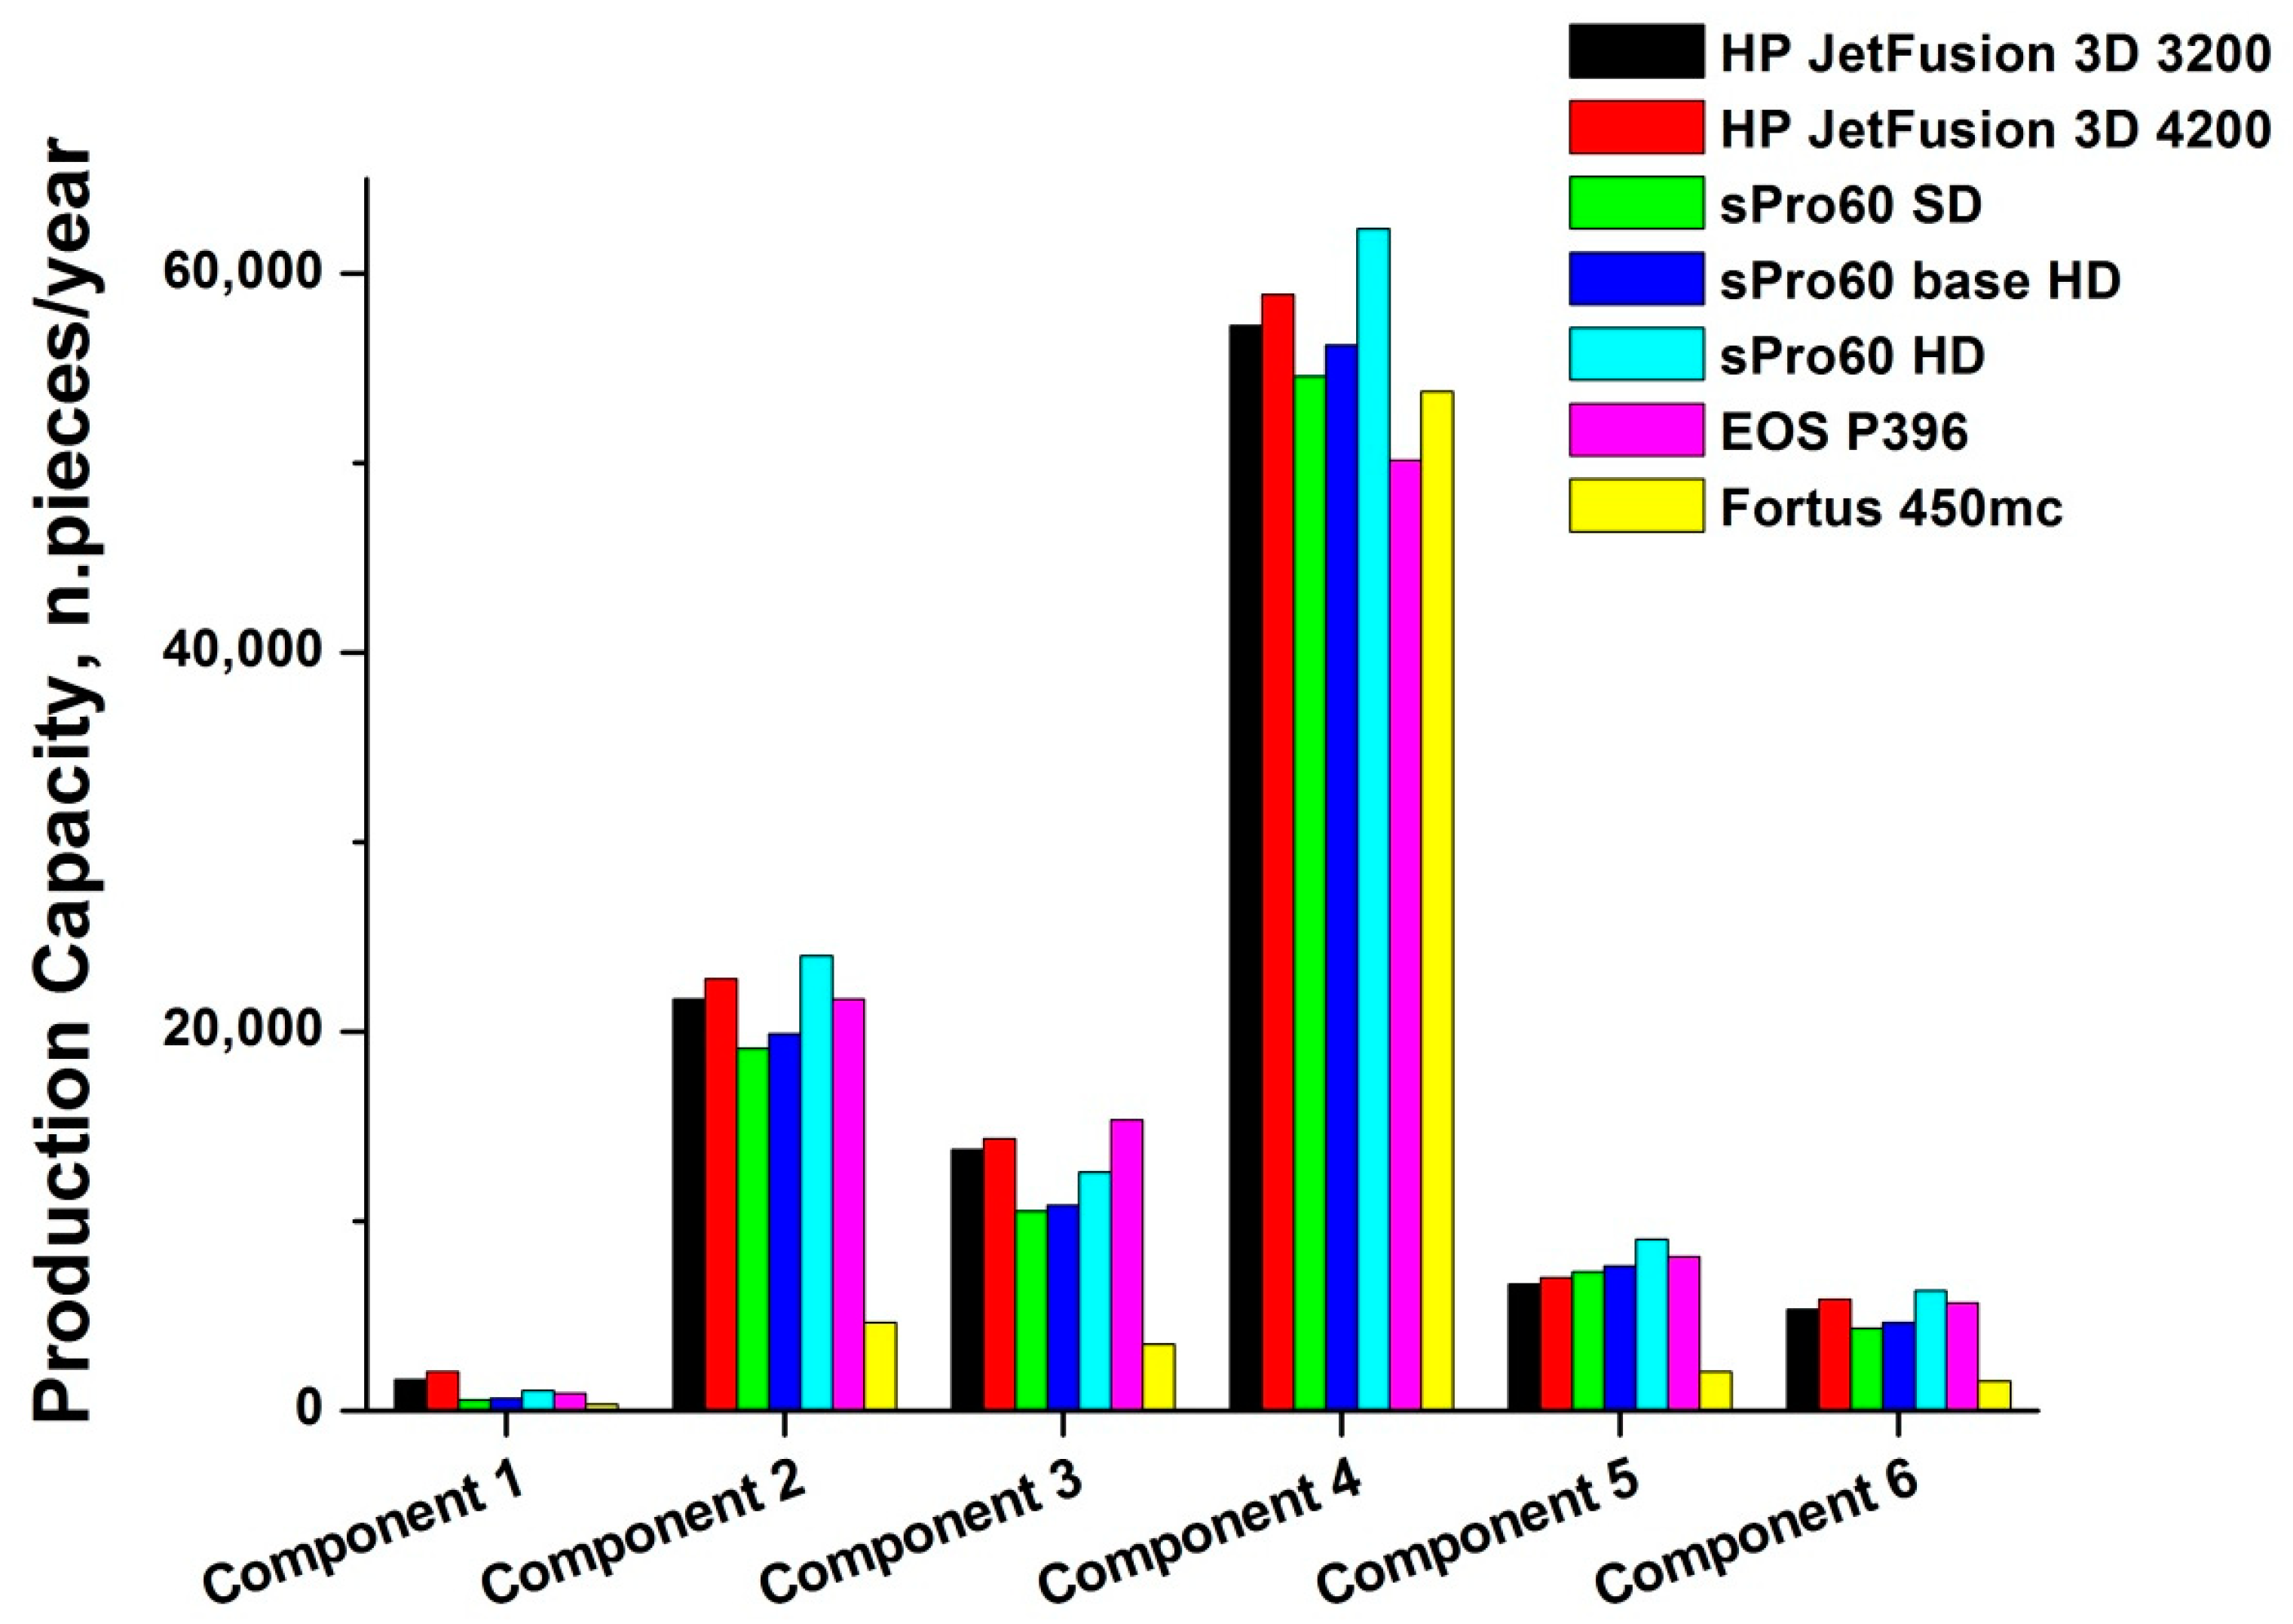
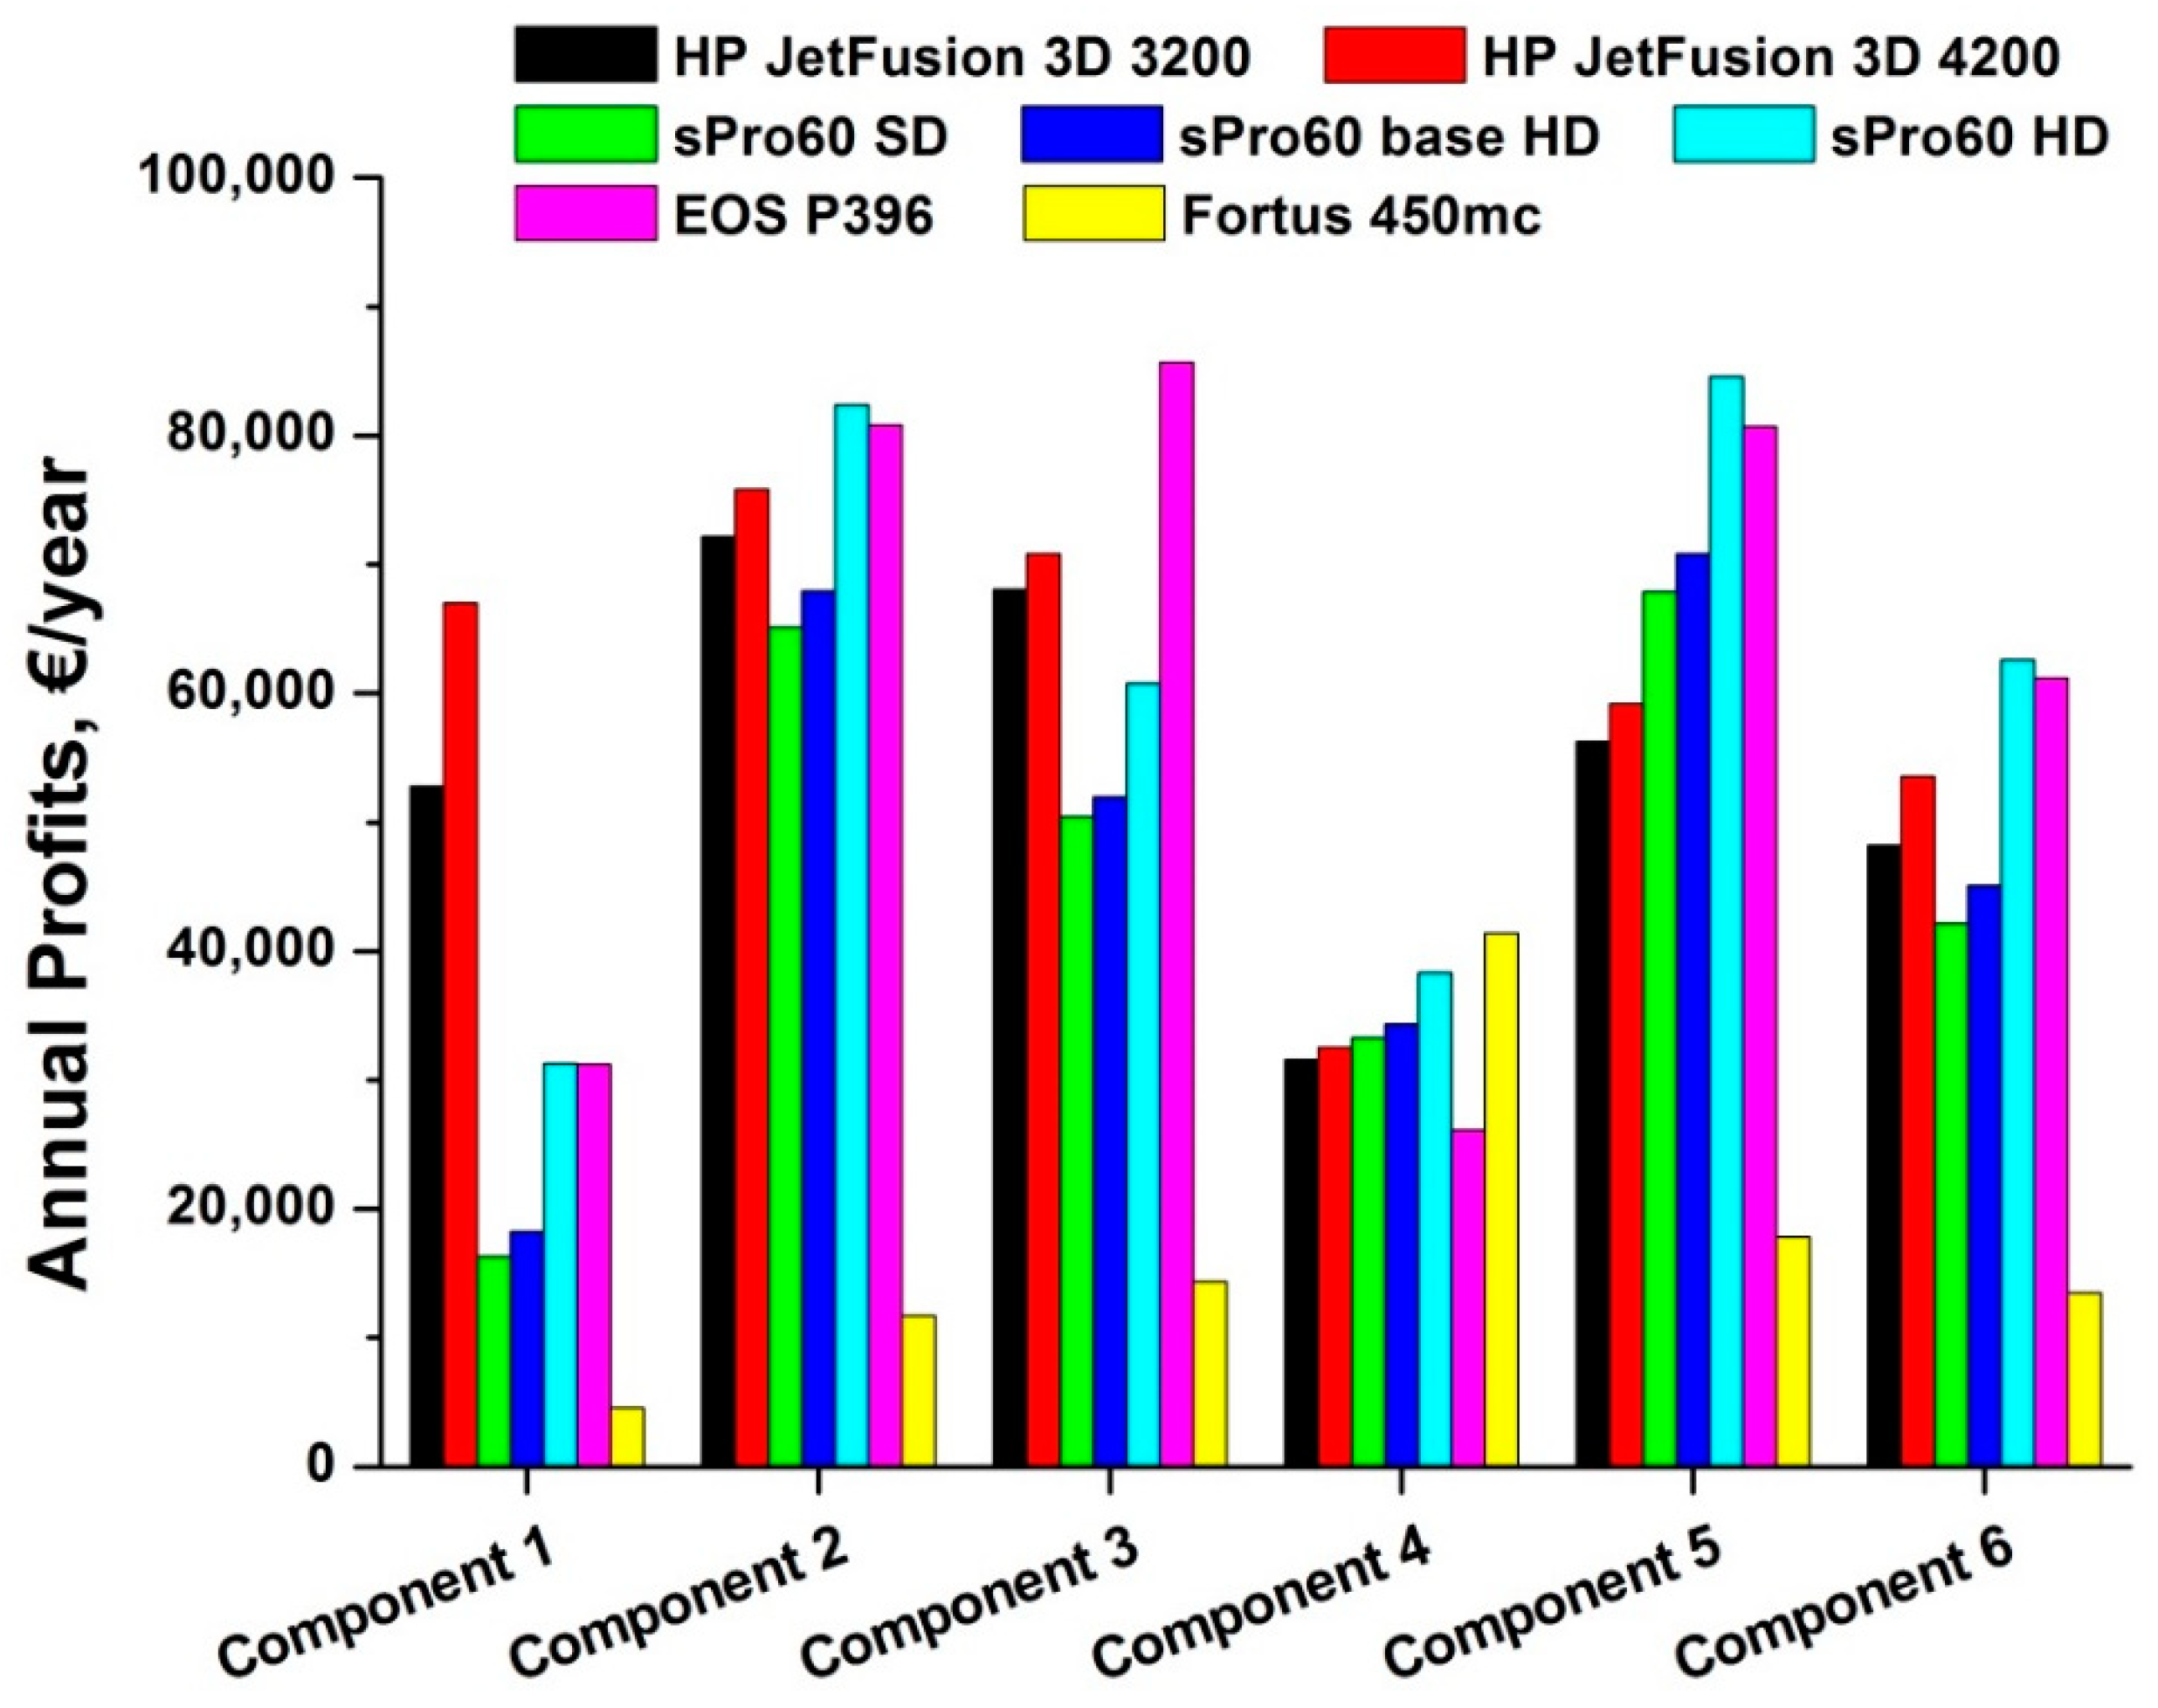
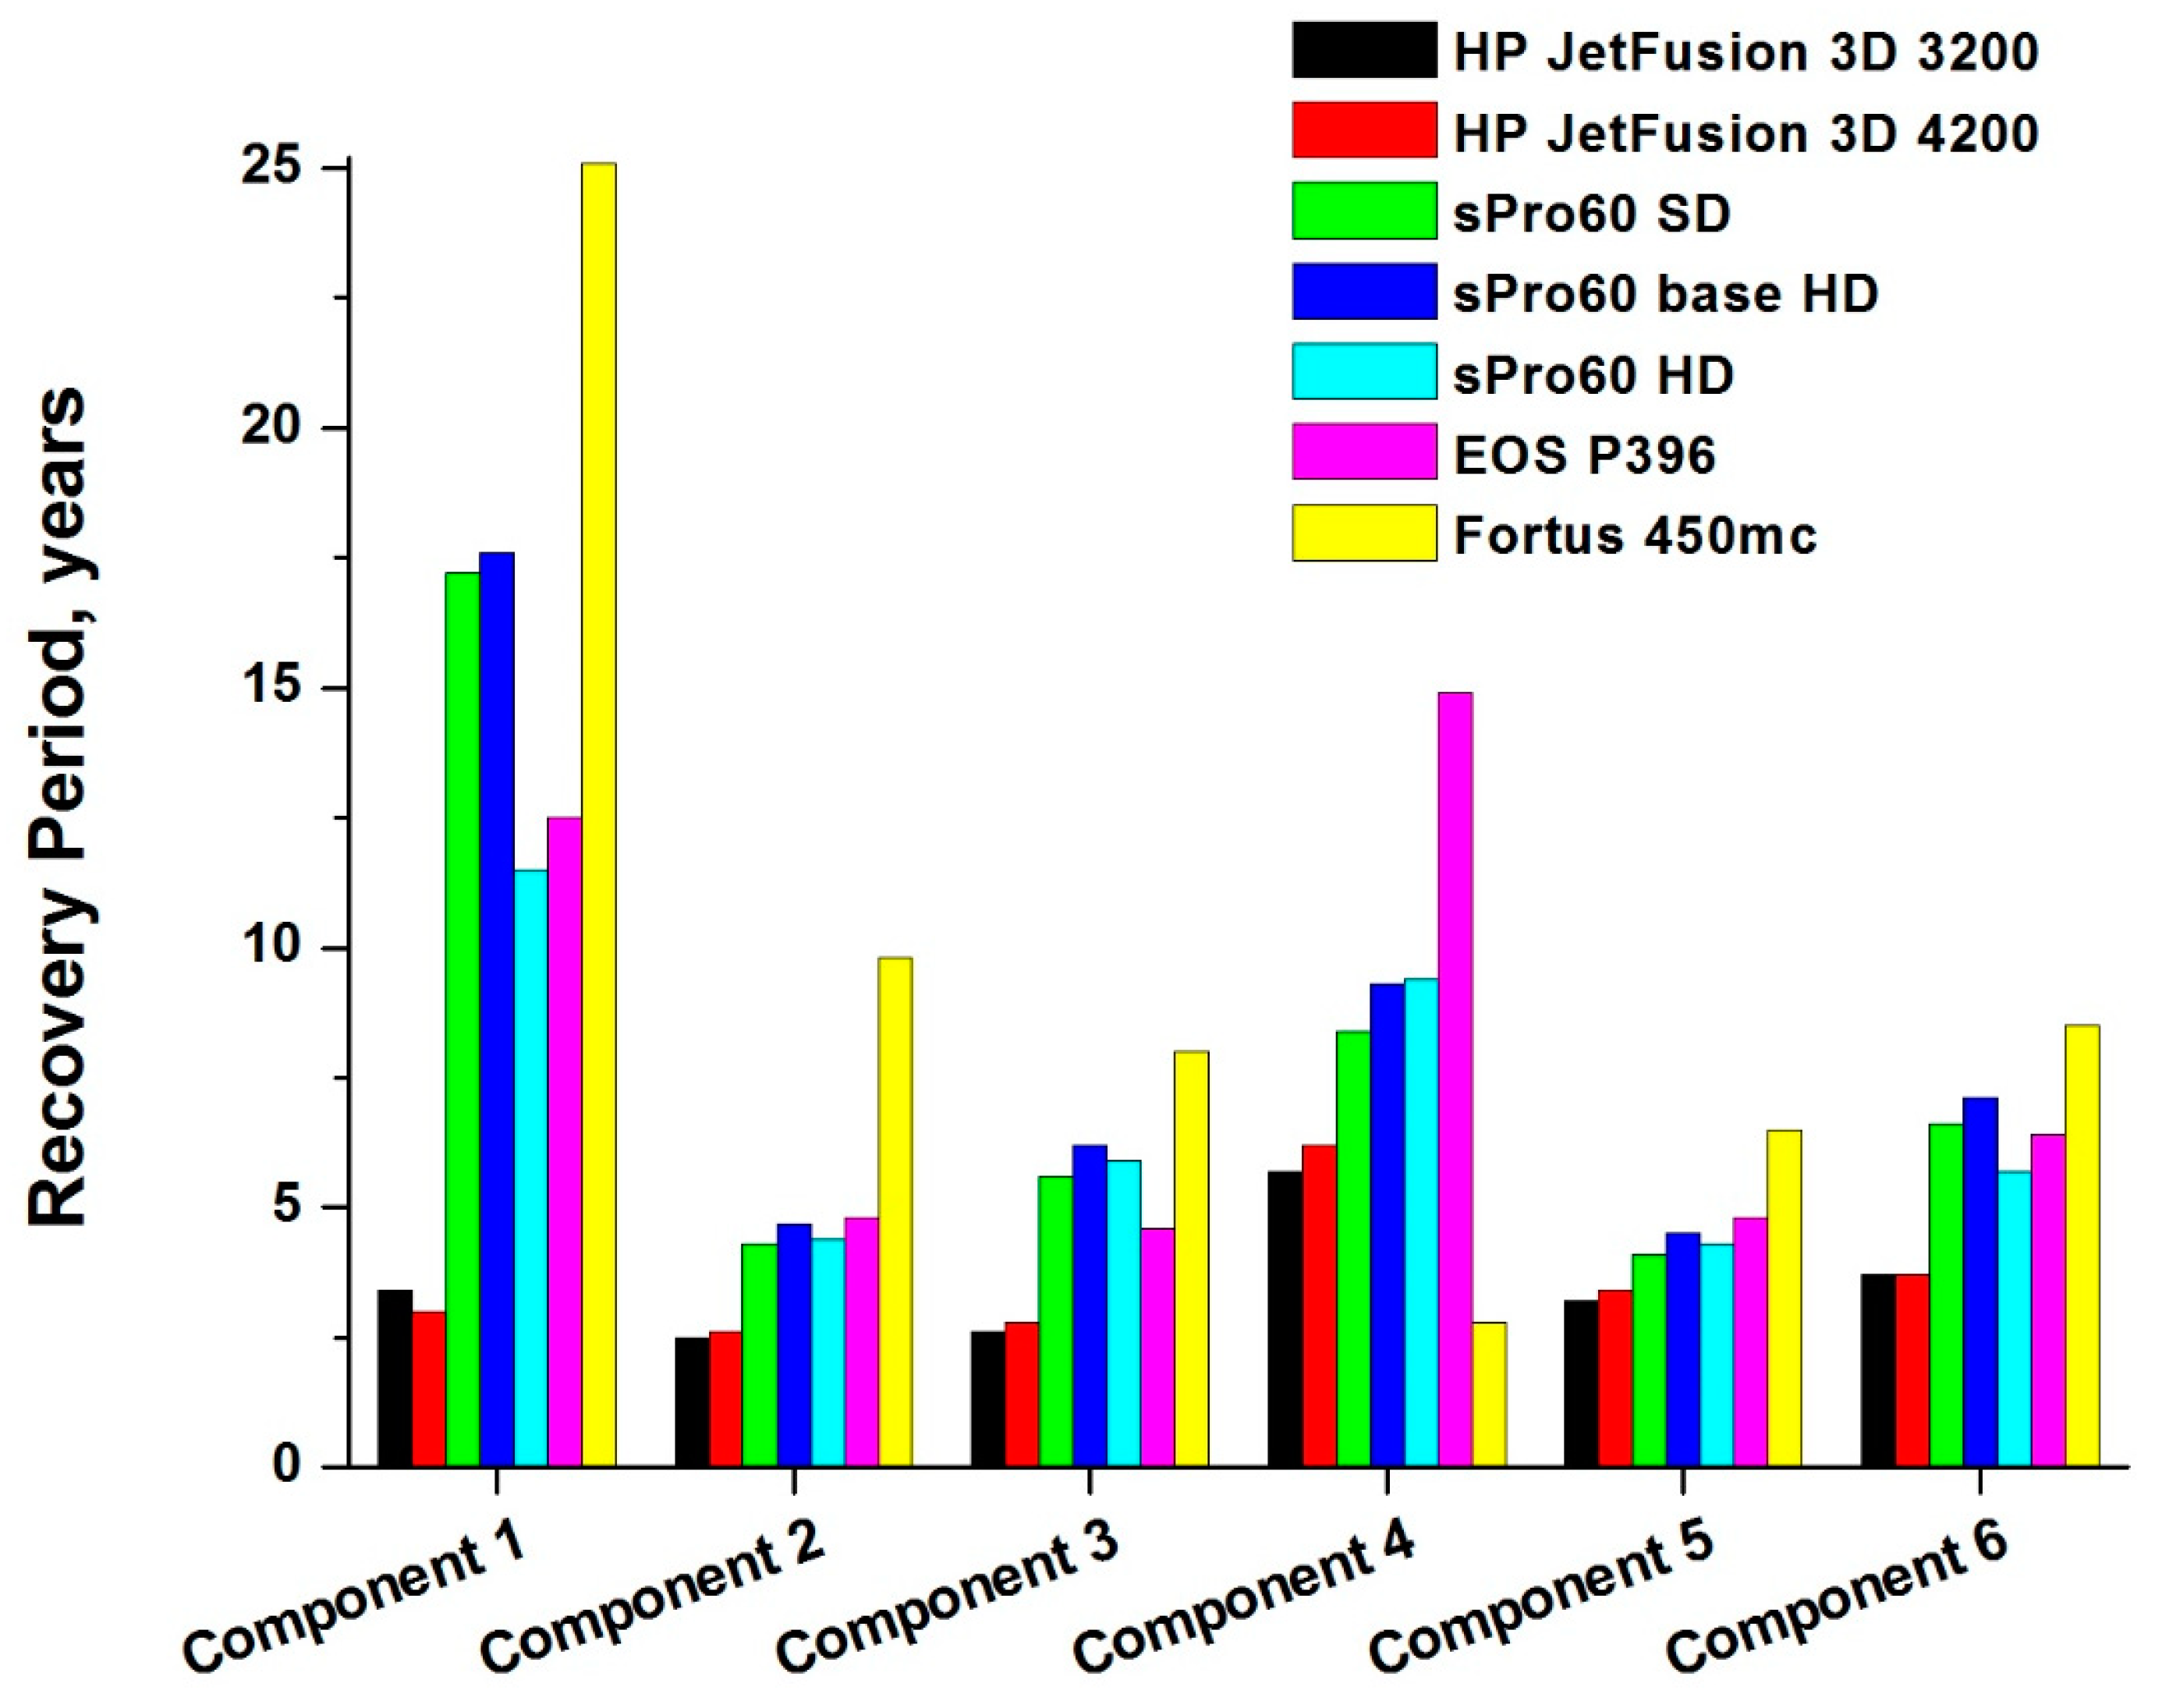
3. Results and Discussion
3.1. Economic Analysis
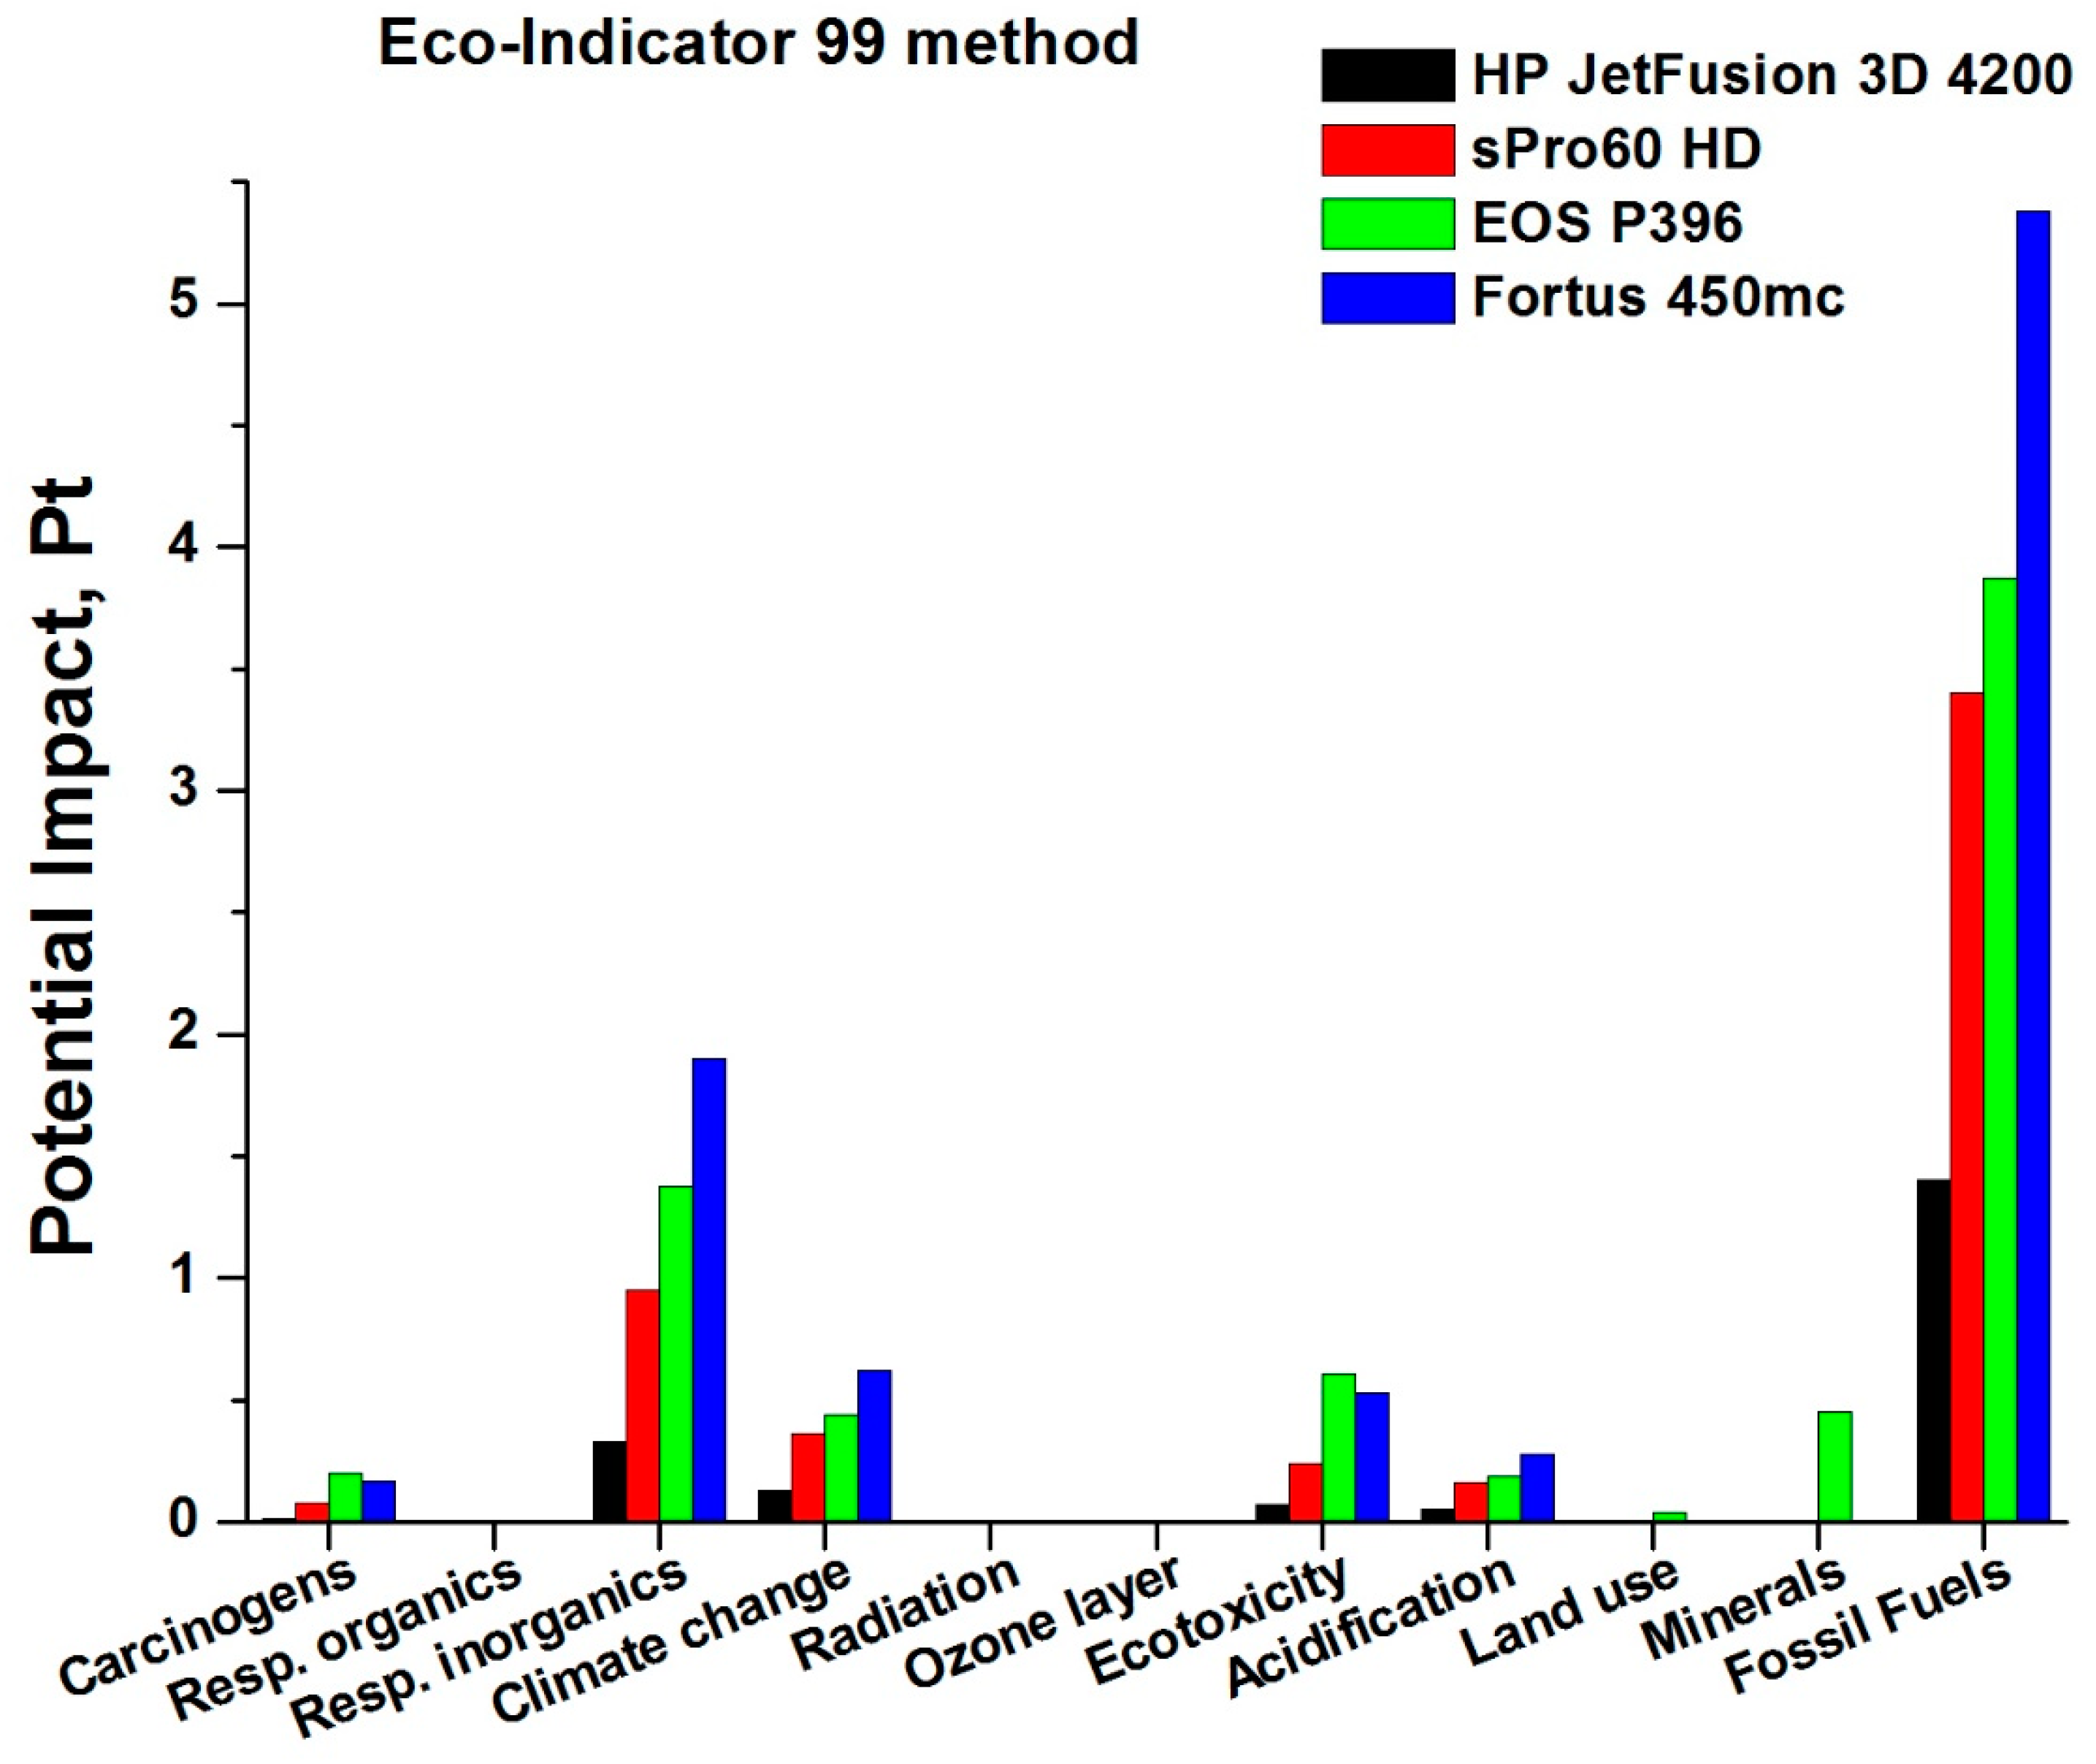
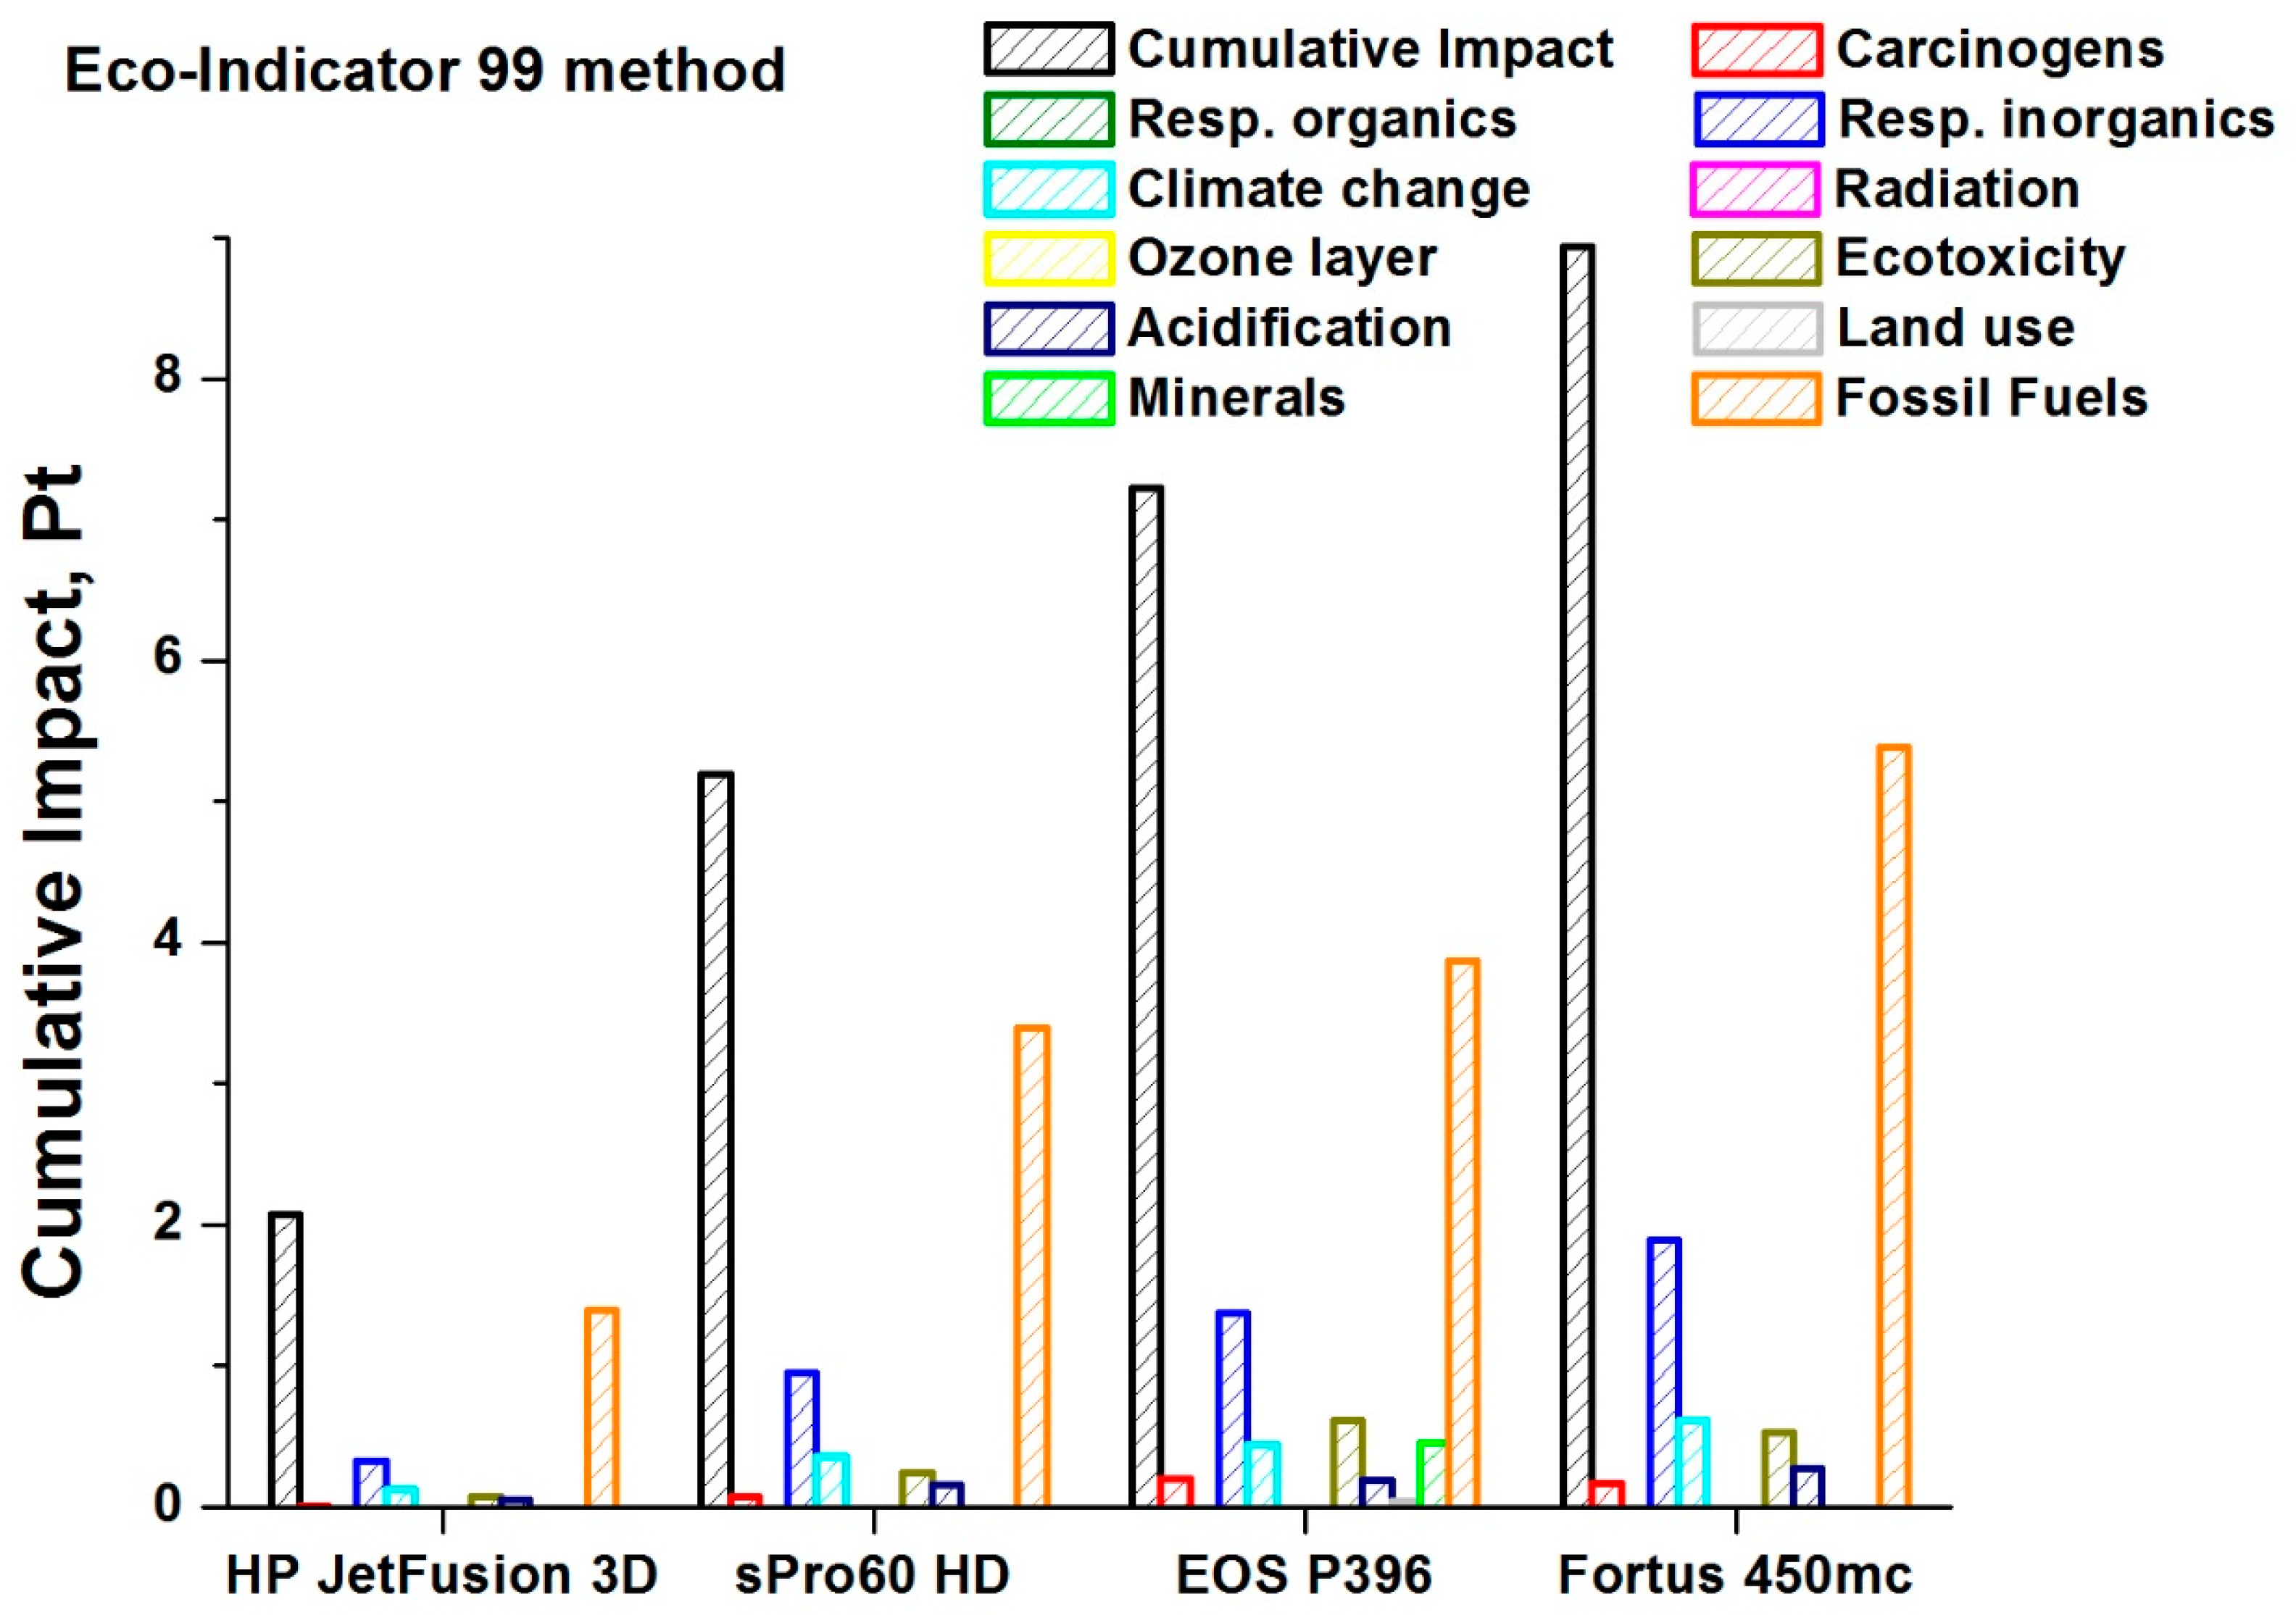
3.2. Impact Evaluation
- Global warming (or climate change);
- Reduction of ozone in the stratosphere;
- Photochemical ozone formation in the troposphere;
- Eutrophication;
- Acidification;
- Toxicity to humans;
- Eco-toxicity;
- Land use;
- Depletion of fossil fuels and mineral resources.
4. Conclusions
Author Contributions
Funding
Acknowledgments
Conflicts of Interest
References
- Bandyopadhyay, A.; Heer, B. Additive Manufacturing of Multi-Material Structures. Mater. Sci. Eng. R Rep. 2018, 129, 1–16. [Google Scholar] [CrossRef]
- Eyers, D.R.; Potter, A.T. Industrial Additive Manufacturing: A Manufacturing Systems Perspective. Comput. Ind. 2017, 92, 208–218. [Google Scholar] [CrossRef]
- Kruth, J.P.; Leu, M.C.; Nakagawa, T. Progress in Additive Manufacturing and Rapid Prototyping. CIRP Ann. Manuf. Technol. 1998, 47, 525–540. [Google Scholar] [CrossRef]
- Bourell, D.; Kruth, J.P.; Leu, M.; Levy, G.; Rosen, D.; Beese, A.M.; Clare, A. Materials for Additive Manufacturing. CIRP Ann. Manuf. Technol. 2017, 66, 659–681. [Google Scholar] [CrossRef]
- Bose, S.; Ke, D.; Sahasrabudhe, H.; Bandyopadhyay, A. Additive Manufacturing of Biomaterials. Prog. Mater. Sci. 2018, 93, 45–111. [Google Scholar] [CrossRef]
- Randazzo, M.; Pisapia, J.M.; Singh, N.; Thawani, J.P. 3D Printing in Neurosurgery: A Systematic Review. Surg. Neurol. Int. 2016, 7 (Suppl. S33), S801. [Google Scholar] [CrossRef]
- Scerrati, A.; Trovalusci, F.; Albanese, A.; Ponticelli, G.S.; Tagliaferri, V.; Sturiale, C.L.; Cavallo, M.A.; Marchese, E. A workflow to generate physical 3D models of cerebral aneurysms applying open source freeware for CAD modeling and 3D printing. Interdiscip. Neurosurg. Adv. Tech. Case Manag. 2019, 17, 1–6. [Google Scholar] [CrossRef]
- Włodarczyk-Biegun, M.K.; del Campo, A. 3D Bioprinting of Structural Proteins. Biomaterials 2017, 134, 180–201. [Google Scholar] [CrossRef]
- An, J.; Teoh, J.E.M.; Suntornnond, R.; Chua, C.K. Design and 3D Printing of Scaffolds and Tissues. Engineering 2015, 1, 261–268. [Google Scholar] [CrossRef]
- Murphy, S.V.; Atala, A. 3D Bioprinting of Tissues and Organs. Nat. Biotechnol. 2014, 32, 773–785. [Google Scholar] [CrossRef]
- Berman, B. 3-D Printing: The New Industrial Revolution. Bus. Horiz. 2012, 55, 155–162. [Google Scholar] [CrossRef]
- Ju, S.G.; Kim, M.K.; Hong, C.S.; Kim, J.S.; Han, Y.; Choi, D.H.; Lee, S.B. New Technique for Developing a Proton Range Compensator with Use of a 3-Dimensional Printer. Int. J. Radiat. Oncol. *Biol. *Phys. 2014, 88, 453–458. [Google Scholar] [CrossRef] [PubMed]
- Nickels, L. 3D Printing the World’s First Metal Bicycle Frame. Met. Powder Rep. 2014, 69, 38–40. [Google Scholar] [CrossRef]
- Harrys, M.; Ian, H. 3D Printing of Plastic and Titanium Parts for Racing Bicycles. Met. Powder Rep. 2013, 68, 30–32. [Google Scholar] [CrossRef]
- Fabian. 3D Printed Jewelry: The Revolution of Jewelry Designers; Pinterest: San Francisco, CA, USA, 2016. [Google Scholar]
- Kwok, S.W.; Goh, K.H.H.; Tan, Z.D.; Tan, S.T.M.; Tjiu, W.W.; Soh, J.Y.; Goh, K.E.J. Electrically Conductive Filament for 3D-Printed Circuits and Sensors. Appl. Mater. Today 2017, 9, 167–175. [Google Scholar] [CrossRef]
- Flowers, P.F.; Reyes, C.; Ye, S.; Kim, M.J.; Wiley, B.J. 3D Printing Electronic Components and Circuits with Conductive Thermoplastic Filament. Addit. Manuf. 2017, 18, 156–163. [Google Scholar] [CrossRef]
- Mu, Q.; Wang, L.; Dunn, C.K.; Kuang, X.; Duan, F.; Zhang, Z.; Wang, T. Digital Light Processing 3D Printing of Conductive Complex Structures. Addit. Manuf. 2017, 18, 74–83. [Google Scholar] [CrossRef]
- Guo, N.; Leu, M.C. Additive Manufacturing: Technology, Applications and Research Needs. Front. Mech. Eng. 2013, 8, 215–243. [Google Scholar] [CrossRef]
- Atzeni, E.; Barletta, M.; Calignano, F.; Iuliano, L.; Rubino, G.; Tagliaferri, V. Abrasive Fluidized Bed (AFB) Finishing of AlSi10Mg Substrates Manufactured by Direct Metal Laser Sintering (DMLS). Addit. Manuf. 2016, 10, 15–23. [Google Scholar] [CrossRef]
- Barletta, M.; Guarino, S. High Speed Finishing of a CuZn15 Brass Alloy by Abrasive Recirculating Fluidized Bed (ARFB). Powder Technol. 2010, 203, 591–602. [Google Scholar] [CrossRef]
- Wong, K.V.; Hernandez, A. A Review of Additive Manufacturing. ISRN Mech. Eng. 2012. [Google Scholar] [CrossRef]
- Yoon, H.S.; Lee, J.Y.; Kim, H.S.; Kim, M.S.; Kim, E.S.; Shin, Y.J.; Ahn, S.H. A Comparison of Energy Consumption in Bulk Forming, Subtractive, and Additive Processes: Review and Case Study. Int. J. Precis. Eng. Manuf. Green Technol. 2014, 1, 261–279. [Google Scholar] [CrossRef]
- Kruth, J.P.; Wang, X.; Laoui, T.; Froyen, L. Lasers and Materials in Selective Laser Sintering. Assem. Autom. 2003, 23, 357–371. [Google Scholar] [CrossRef]
- Parandoush, P.; Lin, D. A Review on Additive Manufacturing of Polymer-Fiber Composites. Compos. Struct. 2017, 182, 36–53. [Google Scholar] [CrossRef]
- Guarino, S.; Ucciardello, N.; Venettacci, S.; Genna, S. Life Cycle Assessment of a New Graphene-Based Electrodeposition Process on Copper Components. J. Clean. Prod. 2017, 165, 520–529. [Google Scholar] [CrossRef]
- Bikas, H.; Stavropoulos, P.; Chryssolouris, G. Additive manufacturing methods and modelling approaches: A critical review. Int. J. Adv. Manuf. Technol. 2016, 83, 1–4. [Google Scholar] [CrossRef]
- Bikas, H.; Lianos, A.K.; Stavropoulos, P. A design framework for additive manufacturing. Int. J. Adv. Manuf. Technol. 2019, 103, 1–4. [Google Scholar] [CrossRef]
- Goedkoop, M.; Heijungs, R.; Huijbregts, M.; De Schryver, A.; Struijs, J.; Van Zelm, R. ReCiPe 2008, A Life Cycle Impact Assessment Method Which Comprises Harmonized Category Indicators at the Midpoint and the Endpoint Level e Report I: Characterisation, 1st ed.; Ministry of Housing Spatial Planning and Environment (VROM): Hague, The Netherlands, 2013. [Google Scholar]
- Gibson, I.; Rosen, D.W.; Stucker, B. Additive Manufacturing Technologies. In Additive Manufacturing Technologies: Rapid Prototyping to Direct Digital Manufacturing; Emerald Publishing Limited: Bradford, UK, 2010. [Google Scholar] [CrossRef]
- Costabile, G.; Fera, M.; Fruggiero, F.; Lambiase, A.; Pham, D. Cost Models of Additive Manufacturing: A Literature Review. Int. J. Ind. Eng. Comput. 2017, 8, 263–283. [Google Scholar] [CrossRef]
- Carneiro, O.S.; Silva, A.F.; Gomes, R. Fused Deposition Modeling with Polypropylene. Mater. Des. 2015, 83, 768–776. [Google Scholar] [CrossRef]
- Ligon, S.C.; Liska, R.; Stampfl, J.; Gurr, M.; Mülhaupt, R. Polymers for 3D Printing and Customized Additive Manufacturing. Chem. Rev. 2017, 117, 10212–10290. [Google Scholar] [CrossRef]
- Le Bourhis, F.; Kerbrat, O.; Dembinski, L.; Hascoët, J.Y.; Mognol, P. Predictive Model for Environmental Assessment in Additive Manufacturing Process. Procedia CIRP 2014, 15, 26–31. [Google Scholar] [CrossRef]
- Huang, S.H.; Liu, P.; Mokasdar, A.; Hou, L. Additive Manufacturing and Its Societal Impact: A Literature Review. Int. J. Adv. Manuf. Technol. 2013, 67, 1191–1203. [Google Scholar] [CrossRef]


| Case Study | 3D Printer | Print Technology |
|---|---|---|
| I | Fortus 450mc – Stratasys | FDM |
| II | EOS P396 | SLS |
| III | sPro 60 HD – 3D Systems | SLS |
| IV | HP Jet Fusion 3D | MJF |
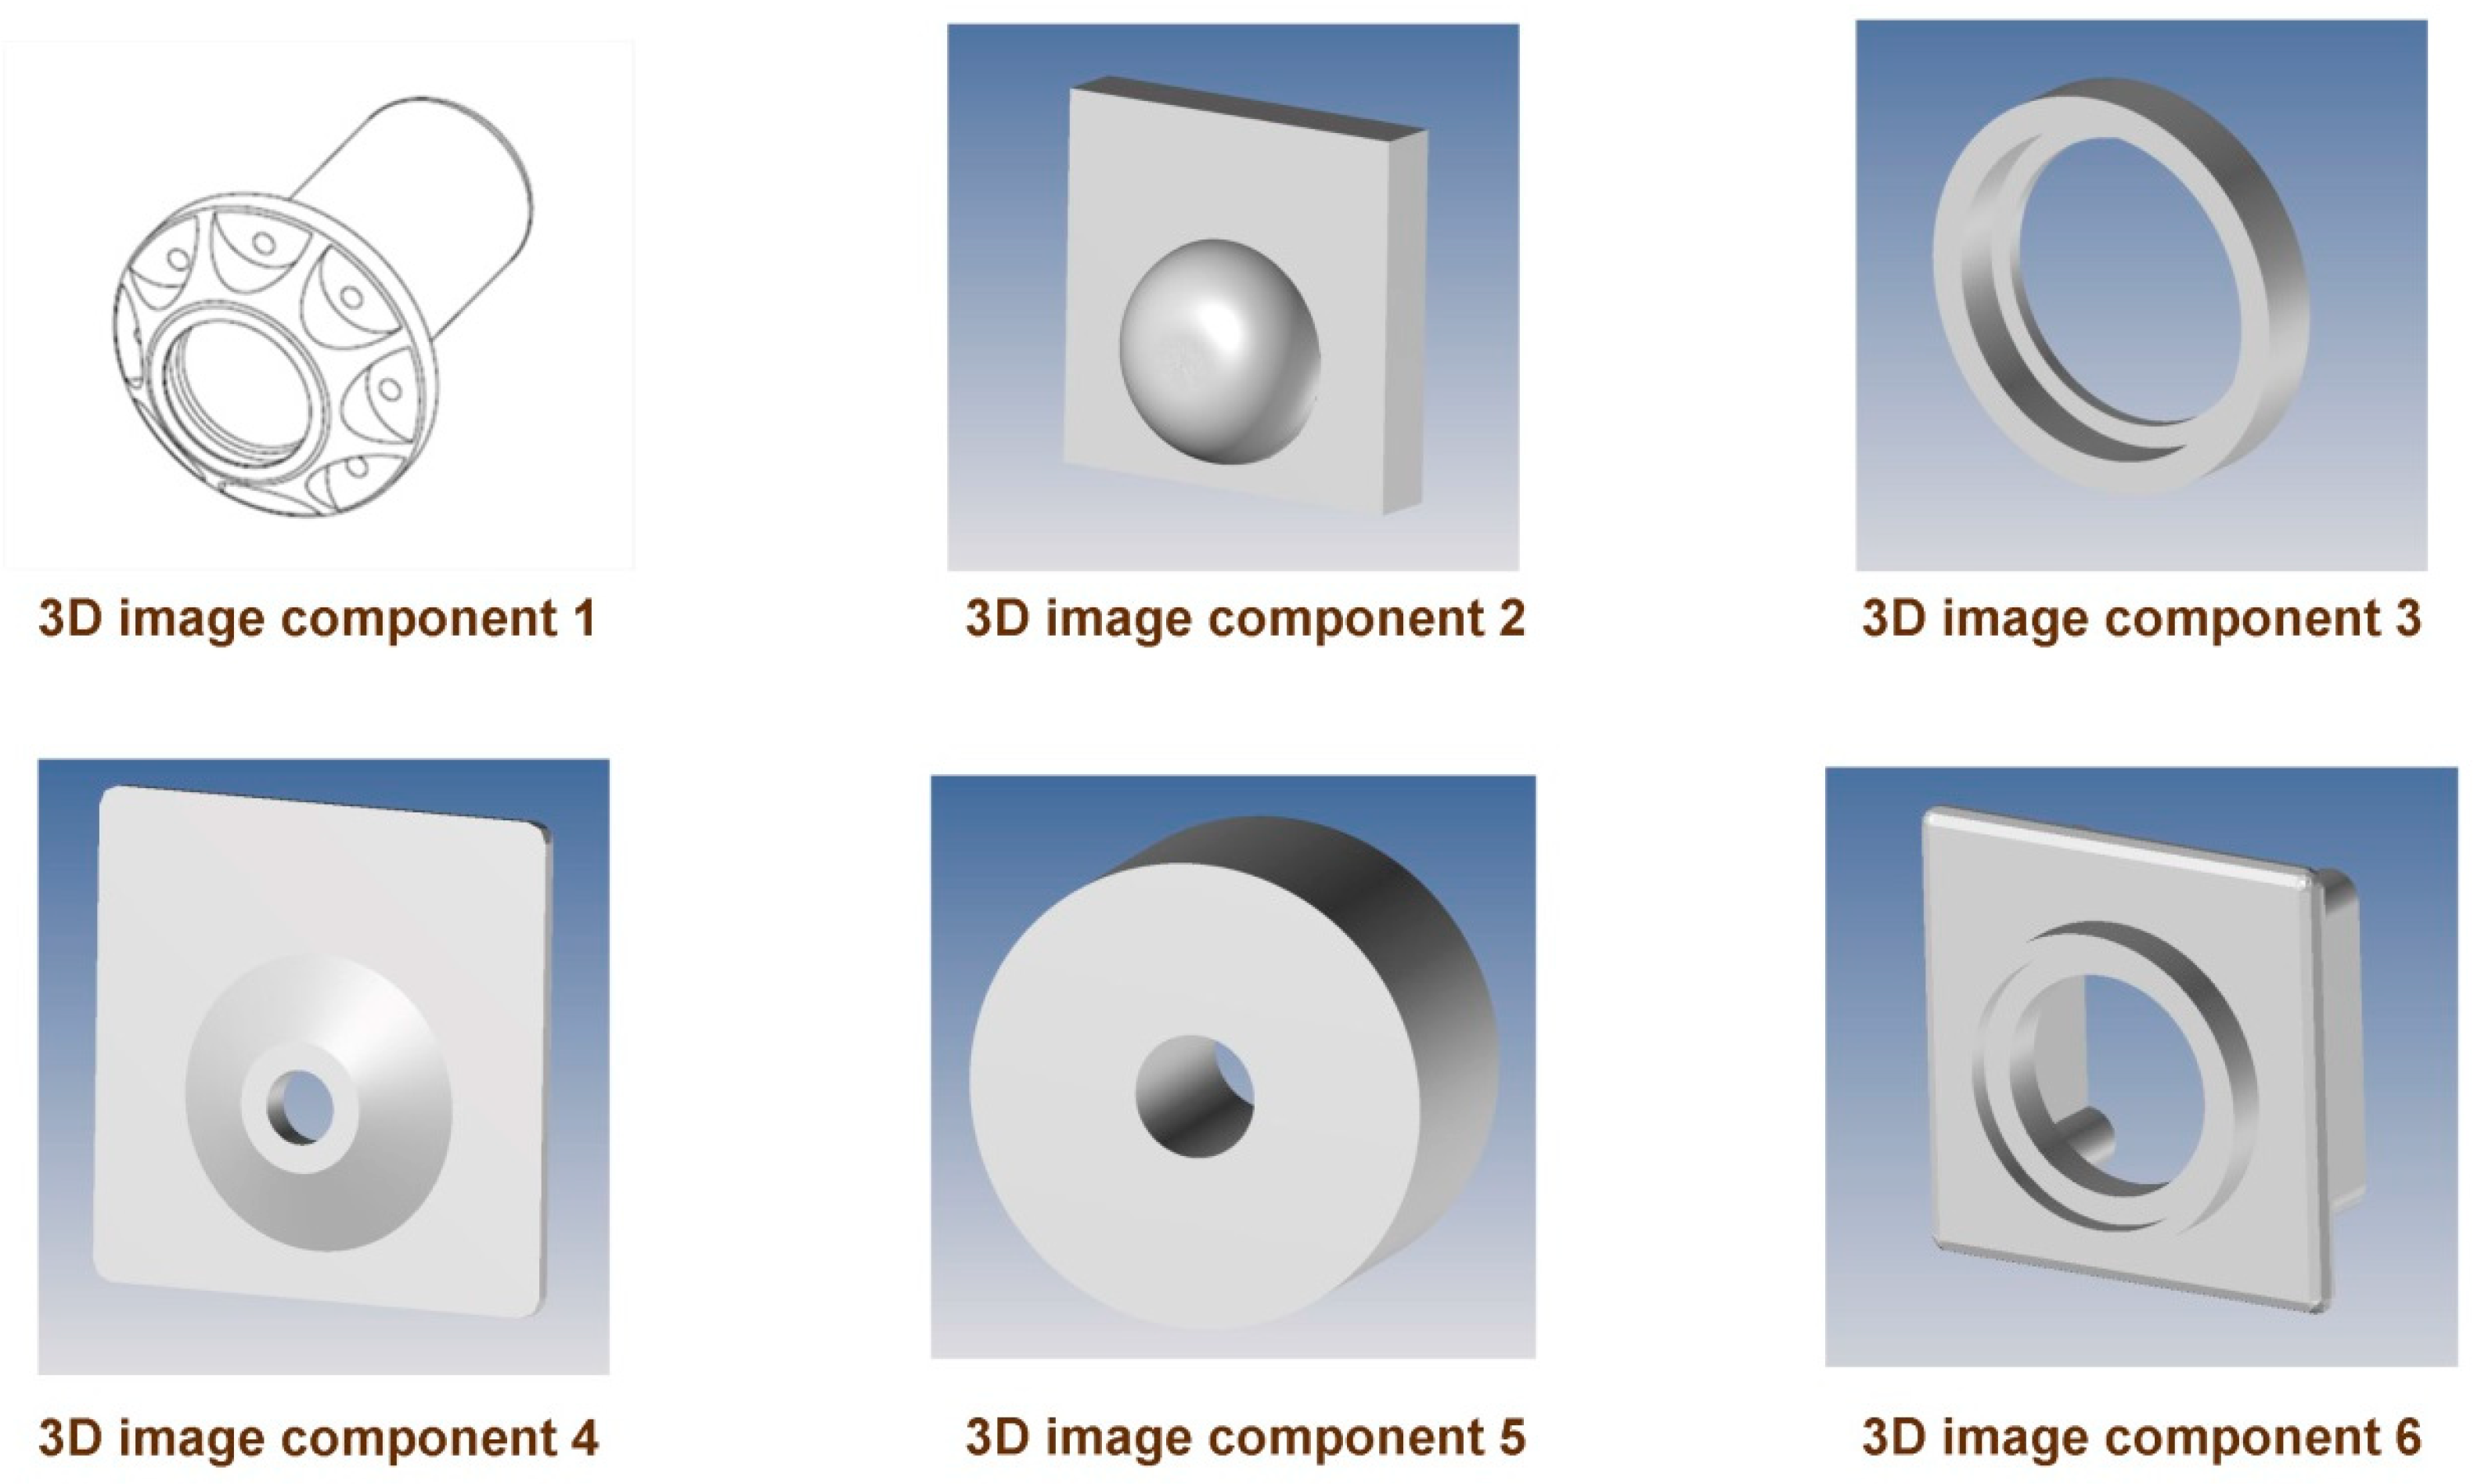
| Components (n°) | Powder Volume in the Chamber (mm3) | Powder Weight in the Chamber (kg) | Component Volume (mm3) | Component Weight (kg) |
|---|---|---|---|---|
| 1 | 15,398,000 | 6.78 | 100,700 | 0.044 |
| 4 | 15,398,000 | 6.78 | 402,800 | 0.177 |
| Raw Material Cost (€/component) | HP JetFusion 3D 3200 | HP JetFusion 3D 4200 | sPro60 SD | sPro60 baseHD | sPro60 HD | EOS P396 | Fortus 450mc |
|---|---|---|---|---|---|---|---|
| Component 1 | 8.33 | 8.33 | 9.96 | 9.96 | 9.96 | 4.24 | 26.50 |
| Component 2 | 0.58 | 0.58 | 0.68 | 0.68 | 0.68 | 0.29 | 1.83 |
| Component 3 | 0.75 | 0.75 | 0.84 | 0.84 | 0.84 | 0.39 | 2.33 |
| Component 4 | 0.04 | 0.04 | 0.03 | 0.03 | 0.03 | 0.02 | 0.10 |
| Component 5 | 1.31 | 1.31 | 1.52 | 1.52 | 1.52 | 0.67 | 3.07 |
| Component 6 | 1.74 | 1.74 | 2.03 | 2.03 | 2.03 | 0.87 | 4.10 |
| UCM (€) | HP JetFusion 3D 3200 | HP JetFusion 3D 4200 | sPro60 SD | sPro60 baseHD | sPro60 HD | EOS P396 | Fortus 450mc |
|---|---|---|---|---|---|---|---|
| Component 1 | 32.72 | 32.95 | 28.52 | 28.85 | 30.19 | 35.27 | 14.29 |
| Component 2 | 3.36 | 3.36 | 3.44 | 3.45 | 3.46 | 3.75 | 2.57 |
| Component 3 | 4.99 | 5.00 | 4.84 | 4.85 | 4.88 | 5.62 | 4.19 |
| Component 4 | 0.56 | 0.56 | 0.62 | 0.62 | 0.62 | 0.53 | 0.78 |
| Component 5 | 8.51 | 8.53 | 9.38 | 9.39 | 9.44 | 9.99 | 8.82 |
| Component 6 | 9.17 | 9.20 | 9.83 | 9.86 | 9.99 | 10.87 | 8.76 |
© 2019 by the authors. Licensee MDPI, Basel, Switzerland. This article is an open access article distributed under the terms and conditions of the Creative Commons Attribution (CC BY) license (http://creativecommons.org/licenses/by/4.0/).
Share and Cite
Tagliaferri, V.; Trovalusci, F.; Guarino, S.; Venettacci, S. Environmental and Economic Analysis of FDM, SLS and MJF Additive Manufacturing Technologies. Materials 2019, 12, 4161. https://doi.org/10.3390/ma12244161
Tagliaferri V, Trovalusci F, Guarino S, Venettacci S. Environmental and Economic Analysis of FDM, SLS and MJF Additive Manufacturing Technologies. Materials. 2019; 12(24):4161. https://doi.org/10.3390/ma12244161
Chicago/Turabian StyleTagliaferri, Vincenzo, Federica Trovalusci, Stefano Guarino, and Simone Venettacci. 2019. "Environmental and Economic Analysis of FDM, SLS and MJF Additive Manufacturing Technologies" Materials 12, no. 24: 4161. https://doi.org/10.3390/ma12244161
APA StyleTagliaferri, V., Trovalusci, F., Guarino, S., & Venettacci, S. (2019). Environmental and Economic Analysis of FDM, SLS and MJF Additive Manufacturing Technologies. Materials, 12(24), 4161. https://doi.org/10.3390/ma12244161