Article

Impact of Ag2O Content on the Optical and Spectroscopic Properties of Fluoro-Phosphate Glasses

1
Laboratoire de Caractérisations, Applications et Modélisation des Matériaux LR18ES08, Sciences Faculty of Tunis, University of Tunis El Manar, Tunis 2092, Tunisia
2
Photonics Laboratory, Tampere University, FI-33101 Tampere, Finland
3
Graduate School of Engineering, Nagoya University, 2-24-16 Furo-cho, Chikusa-ku, Nagoya, Aichi 464-8603, Japan
4
Physics Department, College of Sciences, University of Bisha, P.B. 551, Bisha 61922, Saudi Arabia
5
Sciences Faculty of Tunis, University of Tunis El Manar, Tunis 2092, Tunisia
*
Author to whom correspondence should be addressed.
Materials 2019, 12(21), 3516; https://doi.org/10.3390/ma12213516
Submission received: 24 September 2019 / Revised: 10 October 2019 / Accepted: 22 October 2019 / Published: 26 October 2019

Abstract

:
Glasses with the system (84.60-x) NaPO3-5 ZnO-(9.40-x) NaF-x Ag2O-1 Er2O3, (x = 0, 2, 4, and 6) (mol%) were synthesized by the conventional melt-quenching method. The impact of the addition of Ag2O on the physical, thermal, structural, and optical properties of the glasses is discussed. The Judd-Oflet analysis was used to evaluate the radiative properties of the emission transitions of the glasses. The enhancement of luminescence properties due to Ag2O is discussed in terms of consequent changes in the local electromagnetic field, symmetry, and the ligand field around the Er3+ ion. The heat treatment of the glass was performed in order to precipitate Ag nanoparticles (NPs), which form as a layer at the surface of the heat-treated glasses as confirmed using scanning electron microscopy (SEM). The Ag NPs were found to increase the intensity of the emission at 1.5 µm.

1. Introduction

Glass materials present several unique characteristics such as excellent transparency in wide spectral range, low cost, high optical damage threshold, and ease of doping with rare earth (RE) and transition metal ions [1]. Glasses have been of great interest for the development of various devices and optical components for photonics application due to their relatively easy manipulation. Glasses can be easily prepared in different shapes and sizes [2,3,4]. Among them, fluoro-phosphate-based glasses are considered as a prospective candidate due to their excellent transparency, low phonon energy, good mechanical and chemical stability, low melting point, and high ability to incorporate a large amount of rare earth dopants compared to silicate glasses, due to their two dimensional structure [5].
Recently, particular interest has been paid to glasses containing Ag nanoparticles (NPs) due to the spectacular improvement of luminescence properties, which benefit photonic applications [6,7]. In fact, collective charge density oscillations at the Ag NP surface, known as surface plasmon resonance (SPR), offers an opportunity to improve the photoluminescence (PL) properties of RE in glasses. In order to significantly enhance the PL, SPR absorption should overlap with the emission wavelength of RE. At present, the location of the absorption band relative to SPR depends on the size and morphology of the Ag NPs [8]. Approaching the particle size to the Fermi wavelength leads to discrete energy levels instead of a continuous band structure. The formed particle, in this case, is known as a nanocluster (NC) which is capable of intense light absorption and attractive tunable emission in the visible range [2]. Such characteristics are suitable for efficacy energy transfer (ET) from the NCs to RE ions, leading to a large enhancement of the luminescence in visible and near-infrared range [9].
The goal of this work is to improve the luminescence properties of Er3+ ions doped with fluoro-phosphate glass containing Ag species by seeking the best conditions to assure efficient energy transfer from silver NCs to Er3+ ions. Fluoride was reported to be suitable for the dispersion of the Ag NCs [10,11]. Furthermore, J–O analysis was performed to determine the radiative properties of Er3+ in the investigated glasses. The underlying mechanisms of luminescence intensity enhancement were clarified.

2. Materials and Methods

Sodium fluoro-phosphate glasses with compositions (84.60-x) NaPO3-5 ZnO-(9.40-x) NaF-x Ag2O-1 Er2O3 (in mol%) (x = 0, 2, 4, and 6, denoted as Ag0, Ag2, Ag4, and Ag6, respectively) were prepared by the conventional melt-quenching technique. The 10 g batches were melted in an electric furnace using quartz crucibles, in air atmosphere, at 875 °C for 5 min. The batches were prepared using (NaPO3)6 (Alfa Aesar, Tewksbury, MA, USA, 99.99%), NaF (Sigma Aldrich, Saint Louis, MO, USA, ≥99.0%), ZnO (Sigma Aldrich, Saint Louis, MO, USA, ≥99.5%), Ag2SO4 (Sigma Aldrich, Saint Louis, MO, USA, 99.999%), and Er2O3 (MV Laboratories Inc., Frenchtown, NJ, USA, 99.5%) as raw materials. The melt was then casted into a brass plate and annealed at 200 °C for 6 h, in order to avoid the internal mechanical stress. Afterward, the obtained samples were cut and optically polished for optical measurements.
In order to analyze the composition and morphology of the investigated glasses, scanning electron microscopy (SEM)-type Zeiss Crossbeam 540 (Carl Zeiss, Oberkochen, Germany) equipped with Oxford Instruments X-MaxN 80 Energy Dispersive Spectroscopy Systems (EDS) detector (Oxford Instruments, Abingdon-on-Thames, UK) was used. The glasses were coated with a carbon layer. SEM was mainly used to characterize the cross section and the silver profile of the glasses. For this reason, samples were placed in the epoxy before the measurement. The accuracy of the elemental analysis was ±1.5 mol%.
The glass density was determined on bulk samples by a simple Archimedes method. Ethanol was used as the immersion liquid. The accuracy of the measurement was ± 0.02 g/cm3.
Thermal properties of the glasses were measured using the Netszch F1 instrument (PerkinElmer Inc., Waltham, MA, USA) at a heating rate of 10 °C/min on glass powder. The measurements were performed on ~30 mg samples in an N2 atmosphere using platinum pans. All the temperatures were obtained with an accuracy of ±3 °C. The Tg (glass transition temperature) was determined as the inflection point of the endotherm which is the first derivative of the differential thermal analysis (DTA) curve. Tx and Tp were taken as the onset and the maximum point of the first exothermic peak, respectively.
The IR spectra of the glasses were obtained using Perkin Elmer Spectrum One FTIR Spectrophotometer (PerkinElmer Inc., Waltham, MA, USA) in attenuated total reflectance (ATR) mode in the range of 650–1500 cm−1. The spectra were normalized to the band with maximum intensity.
Perkin Elmer lambda 1050 spectrophotometer (PerkinElmer Inc., Waltham, MA, USA) was used for the measurement of the UV–Vis near-infrared (NIR) absorption spectra. The absorption cross section σa (λ) was calculated using the following equation [12]:
σ a ( λ ) = α a ( λ ) N
where α a ( λ ) is the absorption coefficient at λ and N is the concentration of Er3+ ions (ions/cm3) calculated from the glass density.
From the absorption spectra, the measured oscillator line strength (Smeas) for each absorption transition was estimated according to the following equation [13,14]:
S meas ( J J ) = 3 c h ( 2 J + 1 ) 8 π 3 λ e 2 N 0 [ 9 n ( n 2 + 2 ) 2 ] α ( λ ) d λ
where, J and J’ are the total angular momentum quantum number of the initial and final states, respectively; c is the velocity of the light; h is the Planck constant; e is the charge of the electron; λ is the mean wavelength of the absorption band; and N is the concentration of Er3+ ions per unit volume. 9 n ( n 2 + 2 ) 2 represents the Lorentz local field correction for the ion in the dielectric medium and n is the refractive index. It was estimated using Equation (3) [9]:
n 2 1 n 2 + 1 = 1 E g 20
where Eg is the optical band gap energy estimated by the Tauc model [15].
In addition, there was the theoretical oscillator line strength (Scal) introduced by Judd [13] and Ofelt [14]:
S cal ( J J ) = i = 2 , 4 , 6 Ω i | ( S , L ) J | | U i | | ( S , L ) J | 2
where Ωi (i = 1, 2, 3) are the Judd-Ofelt intensity parameters and U ( i ) are the doubly reduced matrix elements of the unit tensor operator U ( i ) of row i = 2, 4, and 6, which are evaluated from the ground state ( | ( S , L ) J ) to the upper state ( | ( S , L ) J ) by the intermediate coupling approximation. Here, the reduced matrix elements values for Er3+ ion bands calculated by Carnall et al. were used [16]. An adjustment between the measured and the calculated oscillator strengths can be used to estimate the phenomenological Ω2, Ω4, and Ω6 parameters.
The quality of fit can be evaluated using the root-mean-square deviation determined by Equation (5) [4]:
Δ S rms = [ ( q p ) 1 ( Δ S ) 2 ] 1 / 2
where q and p are the numbers of the used transition bands, and the unknown parameters (p = 3), respectively.
The spectroscopic quality factor (χ) can be determined by the equation [17]:
χ = Ω 4 Ω 6 ,
The Judd-Ofelt intensity parameters were used to predict the radiative emission transition probabilities, A(J → J’) by the following equation [18]:
A ( J J ) = A ed + A md = 64 π 4 e 2 3 h ( 2 J + 1 ) λ 3 [ n ( n 2 + 2 ) 2 9 S ed + n 3 S md ]
where Sed and Smd are the emission electric and magnetic dipolar line strengths, respectively. Sed is determined by Equation (3) and presents a host medium dependence through the J–O parameters.
Smd is calculated by:
S md = h 2 16 π 2 m 2 c 2 | ( S , L ) J | | L + 2 S | | ( S , L ) J | 2
where | ( S , L ) J | | L + 2 S | | ( S , L ) J | 2 are the reduced matrix elements of the operator L + 2S.
In our study, the values of Amd were deduced from Er3+-doped LaF3 crystal A md values and corrected by considering the difference of the refractive index [19]:
A md = ( n n ) 3 A md
where n and n represent the refractive indexes of the investigated glass host and LaF3 crystal, respectively.
The radiative lifetime (τr) of an emitting level can be determined from the spontaneous transition probability of the possible emission transitions from this level using the equation:
τ r = 1 J A ( J J )
The fluorescence branching ratio β(J → J’) is related to the radiative decay rates by:
β ( J J ) = A ( J J ) J A ( J J ) = A ( J J ) τ r
This ratio characterizes the possibility of attaining stimulated emission transition from any specific level.
The emission spectra in the visible were collected from bulk samples in air at room temperature using a multi-channel optical analyzer (spectrometer coupled to Charge Coupled Device (CCD) camera; Princeton Instruments, Acton, MA, USA) and a He-Cd laser (λexc = 325 nm). A filter (SCF-50S-38L, Sigma-Koki, Tokyo, Japan) was used to cut the excitation and record the PL signal above 390 nm. The IR emission measurements were recorded at room temperature with a 0.5 nm interval using a Jobin Yvon iHR320 spectrometer (Horiba Jobin Yvon SAS, Unterhaching, Germany) equipped with a Hamamatsu P4631-02 detector (Hamamatsu Photonics K.K., Hamamatsu, Japan) and a Thorlabs FEL 1500 filter (Thorlabs Inc., Newton, NJ, USA). The samples were excited with a single-mode monochromatic fiber (λexc = 976 nm) pigtailed laser diode (CM962UF76P-10R, Oclaro Inc., San Jose, CA, USA). In order to compare the emission intensities of samples, the emission spectra were collected from glasses crushed into powder and from bulk glasses with the same thickness. The errors on the measurement of the emission intensity were estimated to be less than 10%.
The effective bandwidth (Δλeff) was calculated from the emission band by the following equation [20]:
Δ λ eff = I ( λ ) d λ I max
where I(λ) is the emission intensity at λ wavelength and Imax is its maximum. The full-width at half-maximum (FWHM) can be also deduced from the emission bands.
The emission cross section (σe) of the investigated glasses was obtained according to the Füchtbauer–Ladenburg method by [21]:
σ e = λ 4 A R 8 п cn 2 Δ λ eff
A R = 8 п cn 2 ( 2 J + 1 ) λ p 4 ( 2 J + 1 ) kdk
where AR is the spontaneous emission probability, kdk is the integrated absorption cross section, Δ λ eff is the fluorescence effective linewidth, n is the refractive index, J’ and J are the total momentums for the excited and ground states, respectively, and λp is the absorption peak wavelength.
For the IR lifetime measurements, a photomultiplier tube (Hamamatsu Photonics H10330A-75, Shizuoka, Japan) coupled to an oscilloscope was used. The samples were excited using a laser diode (λexc = 980 nm). The measurements were performed from bulk glasses at room temperature. The errors of these measurements are estimated to be ±0.1 ms.

3. Results and Discussion

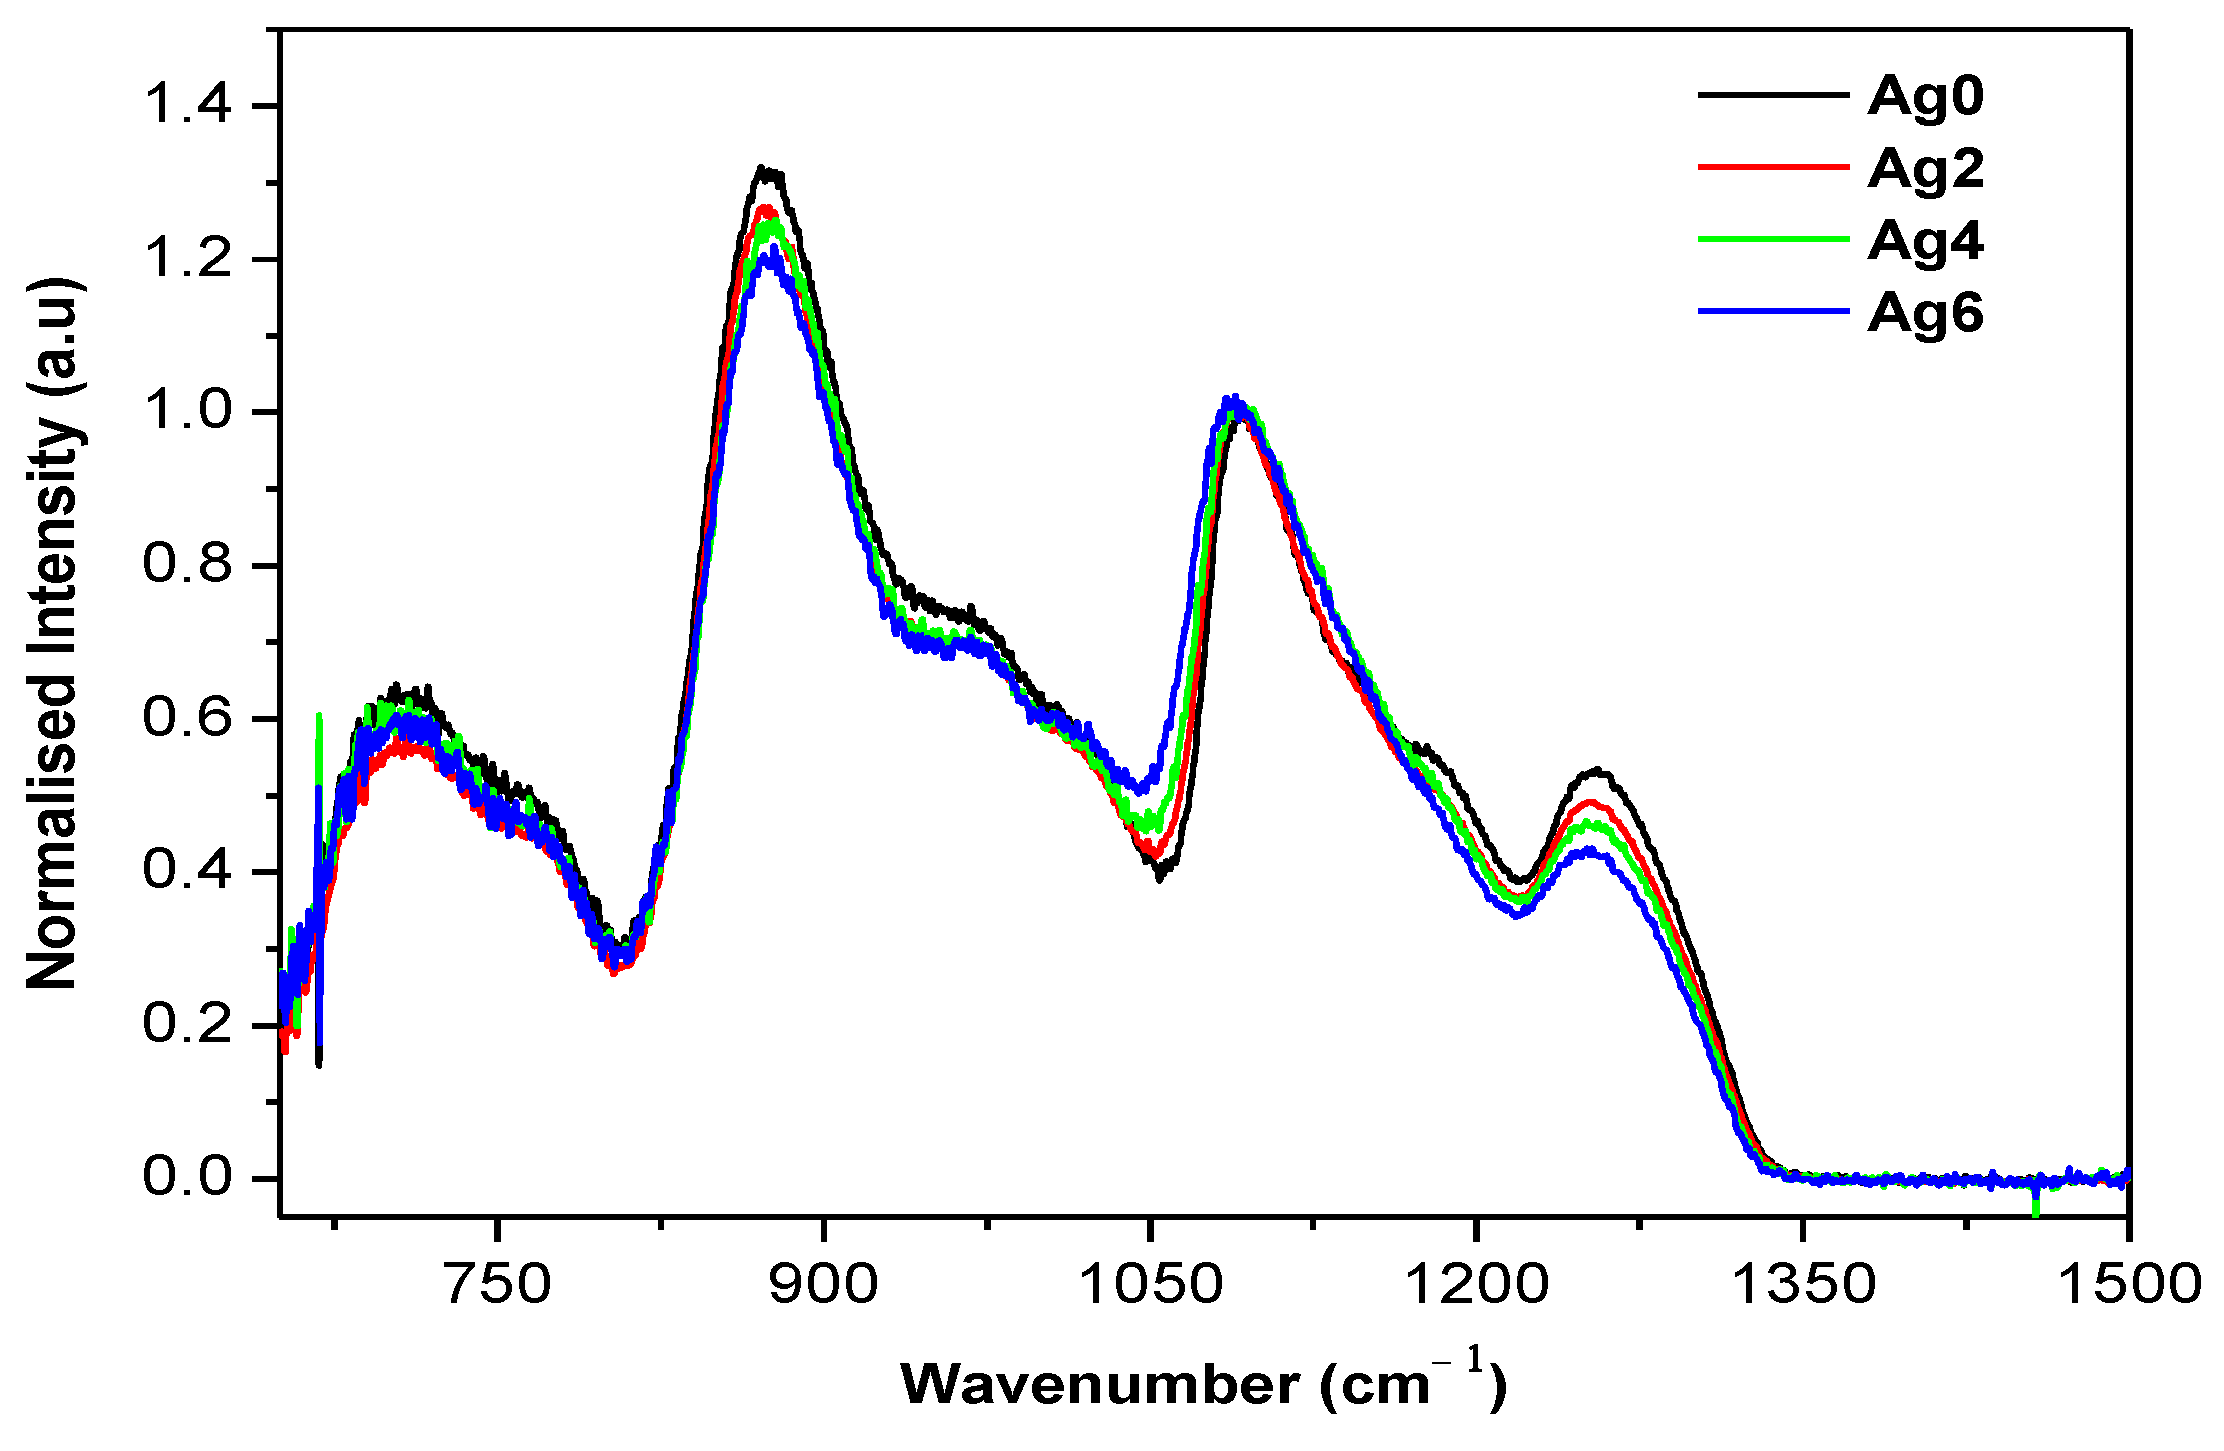
3.1. Thermal and Structural Properties of the Glasses

The thermal properties and the density of the glasses are displayed in Table 1.
As x increases, the glass transition and the crystallization temperatures decrease while the density increases. One notices that Tp increases when x increases from 2 to 6 suggesting that different crystals precipitate depending on Ag2O content. Furthermore, the increase of x slightly decreases the molar volume (Vm) of the glasses. This indicates that the addition of Ag2O slightly decreases the interstitial spaces already presented in the glass network, as suspected from the decrease in the thermal properties. Therefore, the addition of Ag2O in the glass networks is suspected to result in a small reduction in the compactness and connectivity of the glass network [22]. Finally, the introduction of Ag2O into this glass matrix leads to a decrease in the thermal stability of the glasses as evidenced by the decrease in ΔT (ΔT = Tx – Tg). Similar results were reported by Yuebo Hu et al. [23] for Tm3+/Er3+/Yb3+ co-doped oxyfluorogermanate glasses containing Ag nanoparticles.
The changes in the glass structure can be evidenced from the FTIR spectra presented in Figure 1.
The spectra exhibit four absorption bands located at ~1255, 1085, 875, and 700 cm−1 and also four shoulders at ~1183, 1015, 970, and 780 cm−1, which are all characteristics of the metaphosphate network. No IR band existed at the wavenumber range >1300 cm−1, where P = O vibration modes usually appear, which confirmed that these glasses were free of Q3 units. The attribution of the FTIR bands is listed in Table 2 [24,25,26,27,28,29].
As observed in Figure 1, an increase in Ag2O content decreases the number of Q2 units and increases the amount of Q1 units, as seen by the decrease in intensity of the bands at 875 and 1057 cm−1 compared to the intensity of the band at 1085 cm−1. Therefore, the addition of Ag2O is expected to depolymerize the glass network and form a greater number of non-bridging oxygens (NBOs). Similar results were reported by Mishra et al. [30] when adding Ag2O in glasses with the system 0.5P2O5-0.2CaO-0.2SrO-0.1Na2O. One also notices that an increase in Ag2O content shifts the IR band at 1092 cm−1 to lower wavenumbers suggesting that the addition of Ag2O decreases the covalence of the P-O-P [25,30]. This is in agreement with the decrease of Tg and Vm as x increases (Table 1).

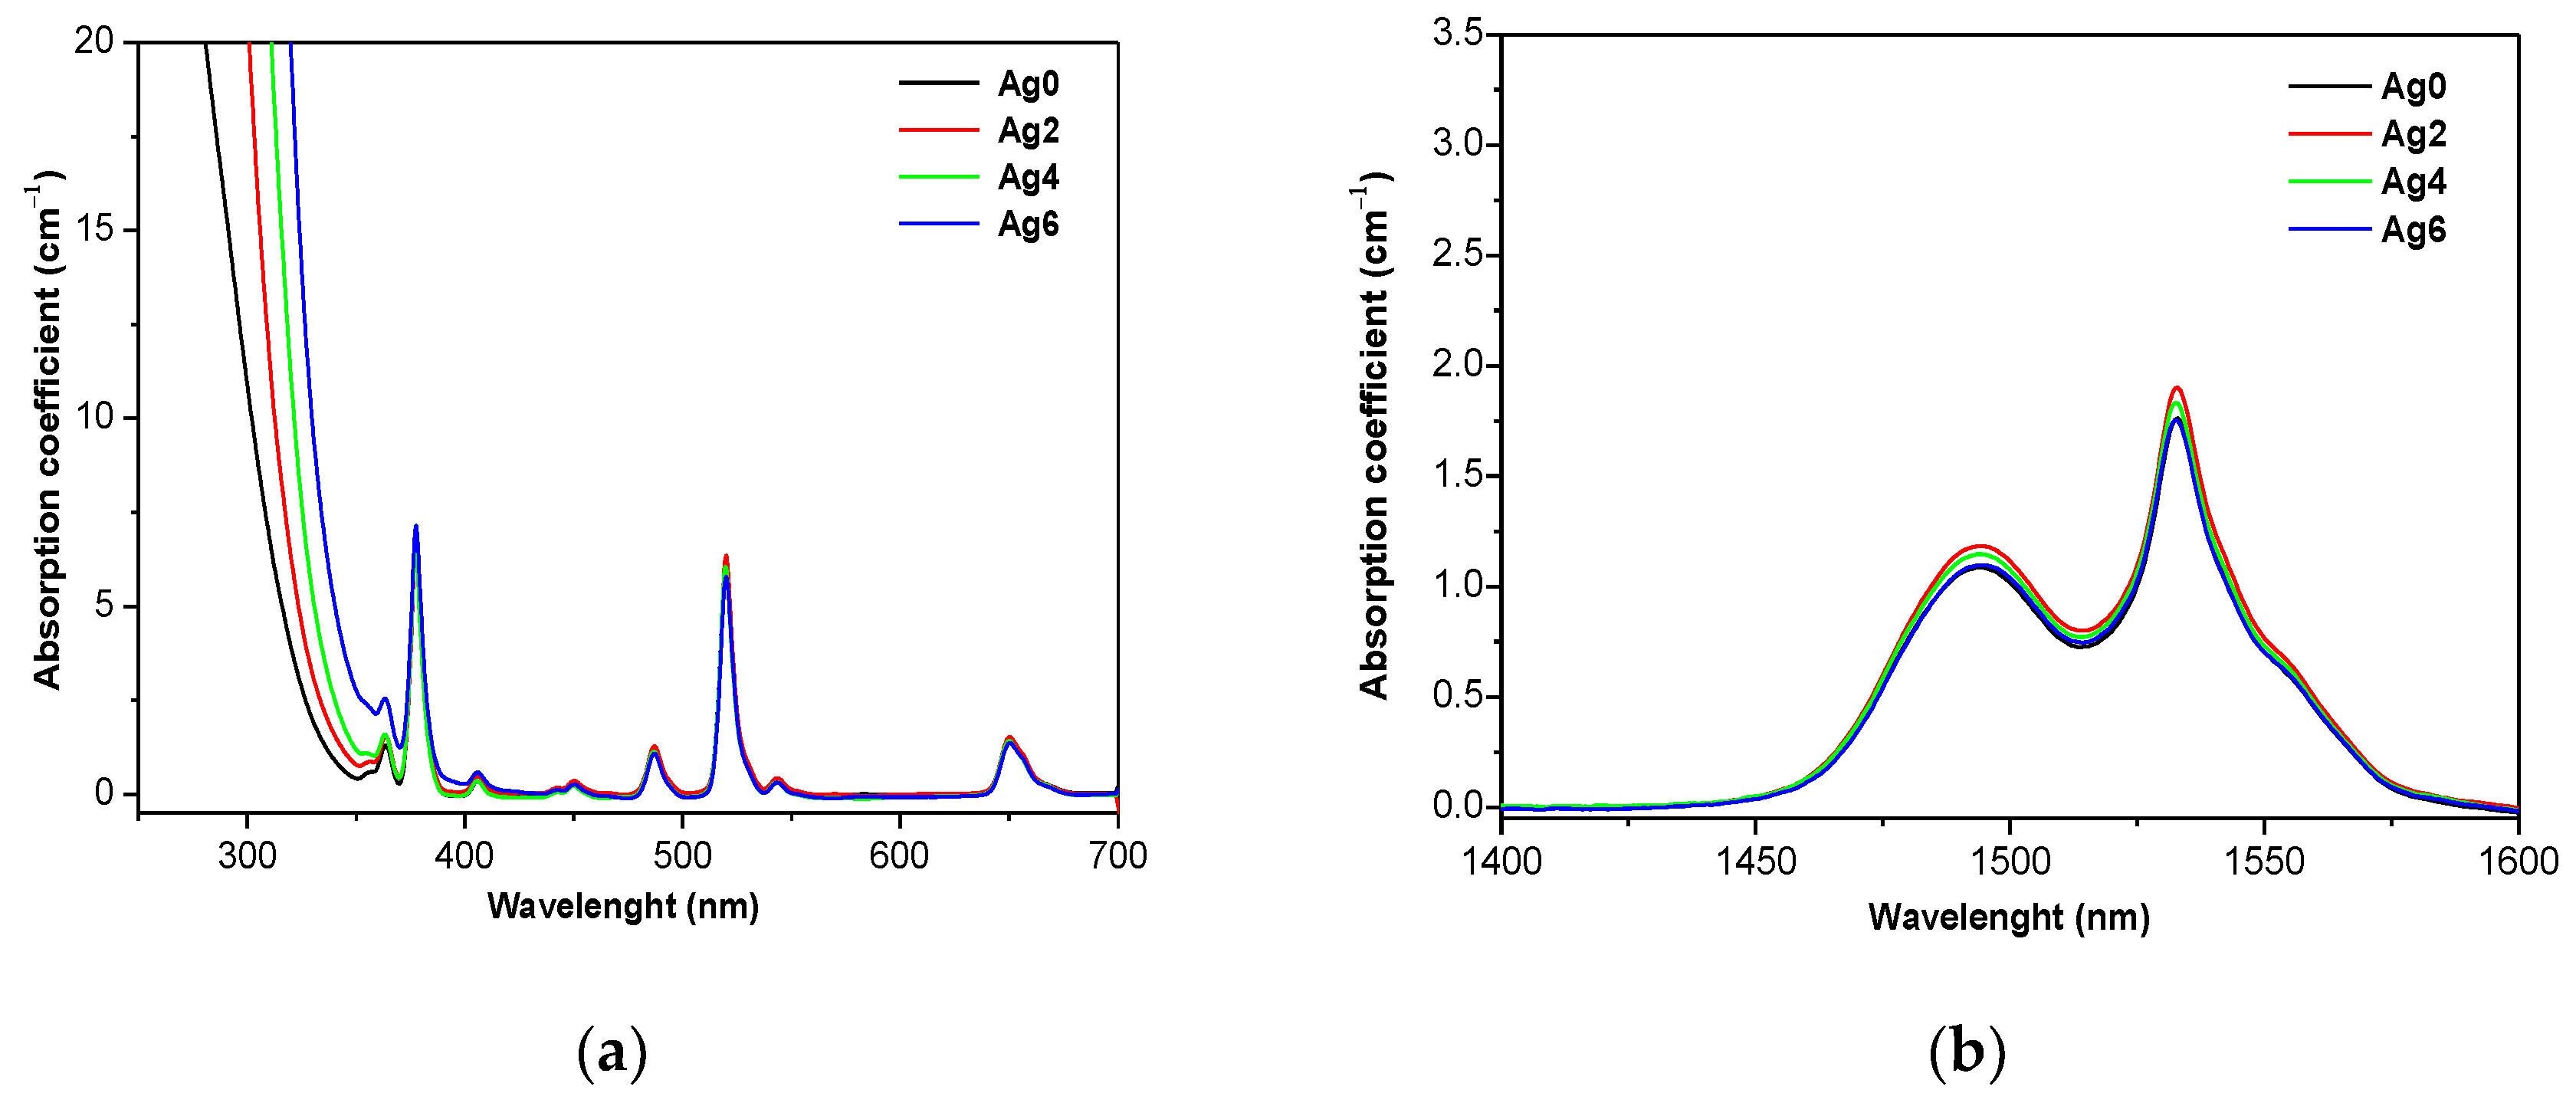
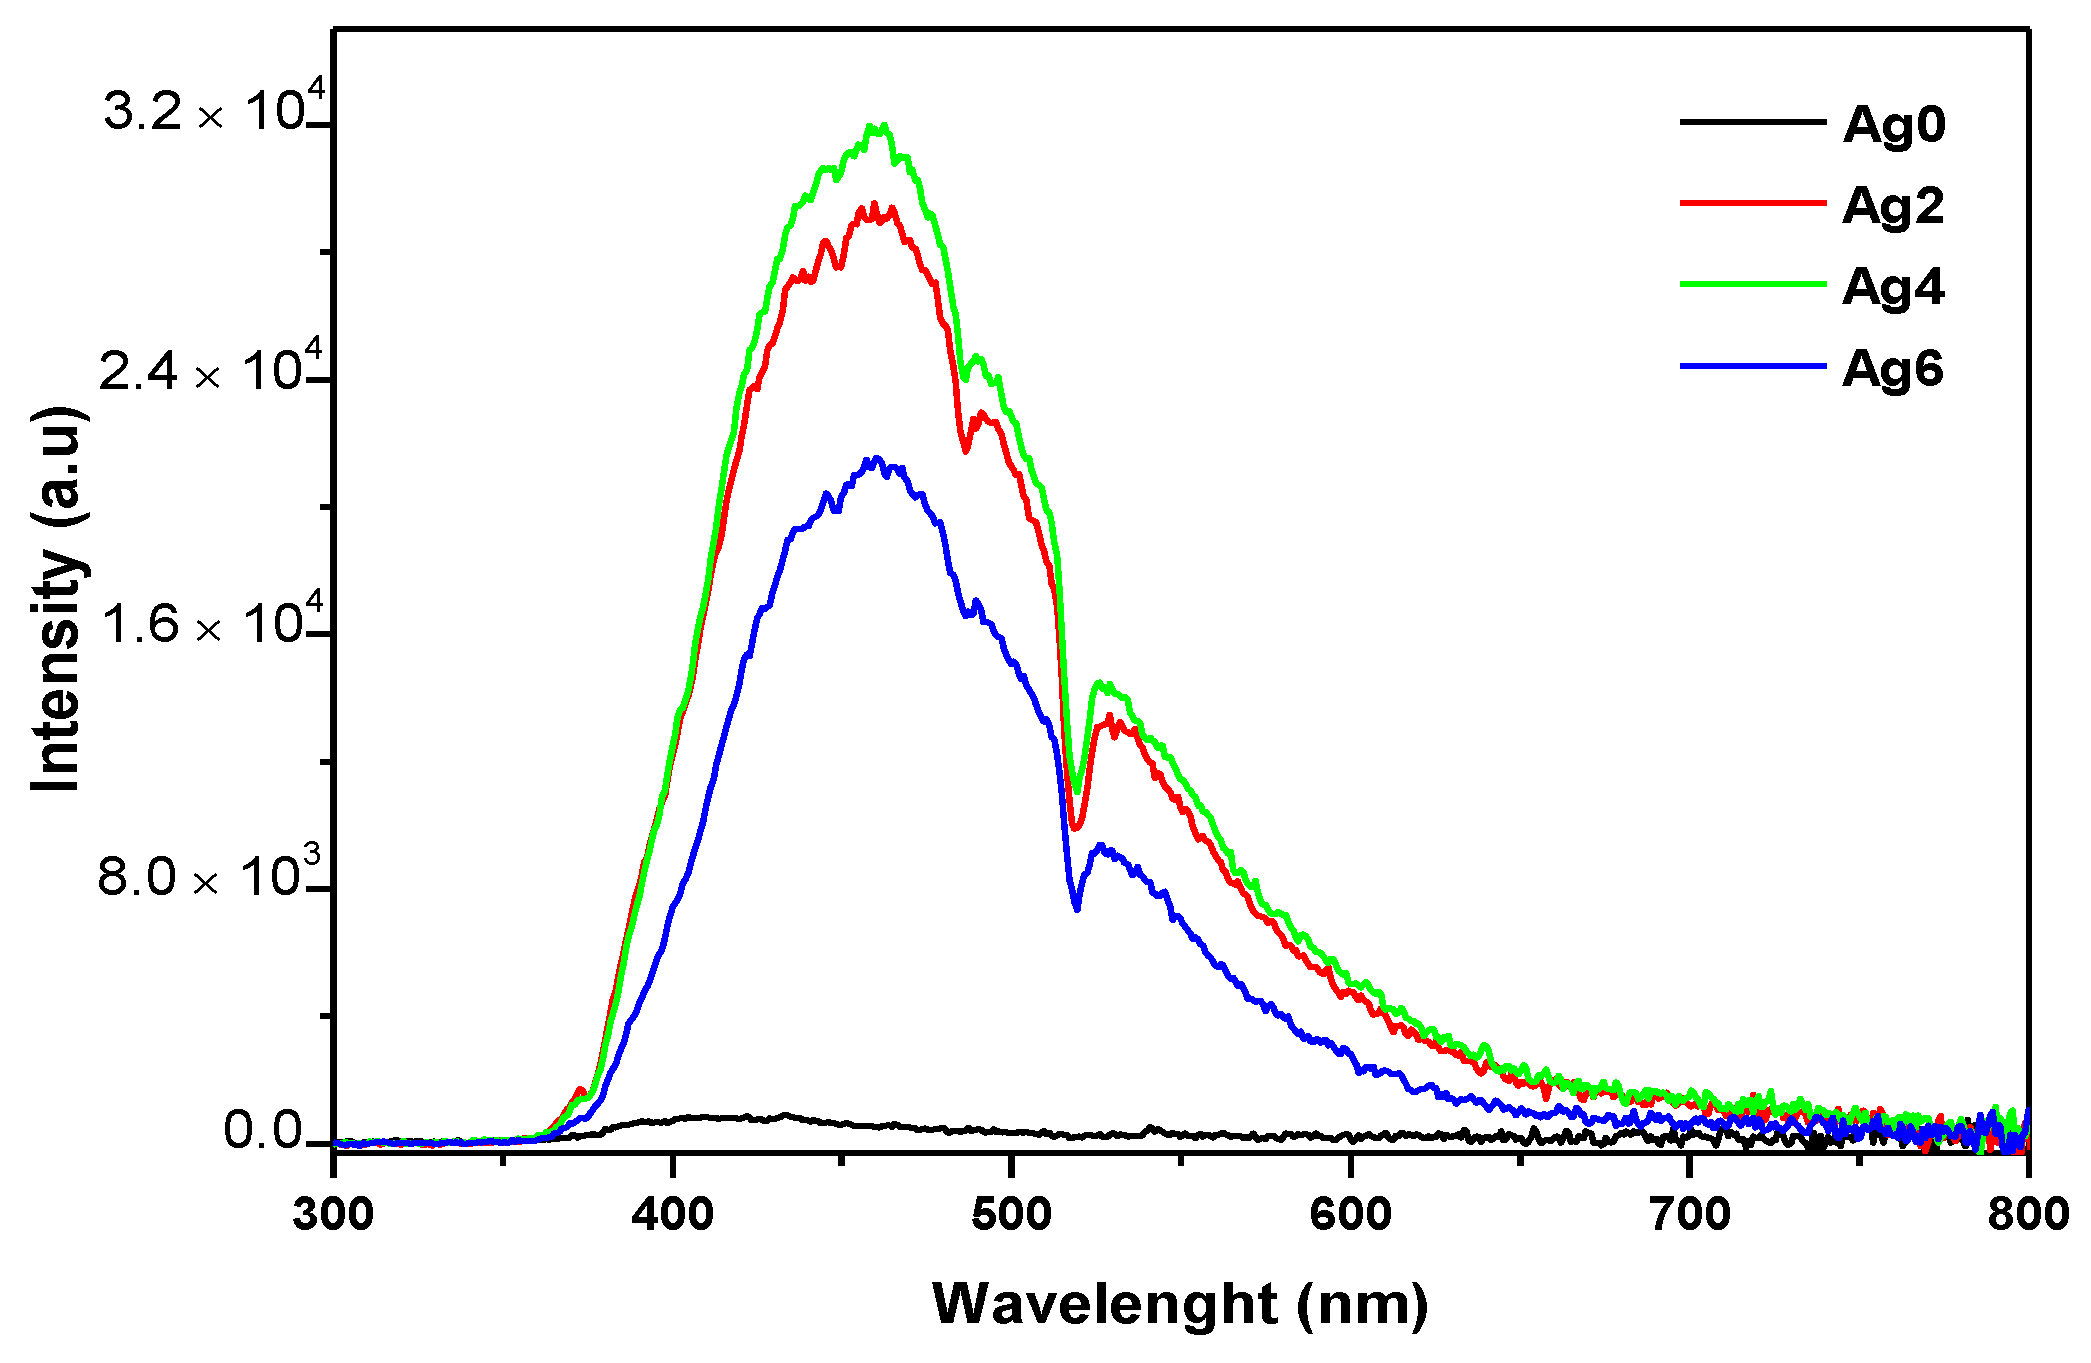
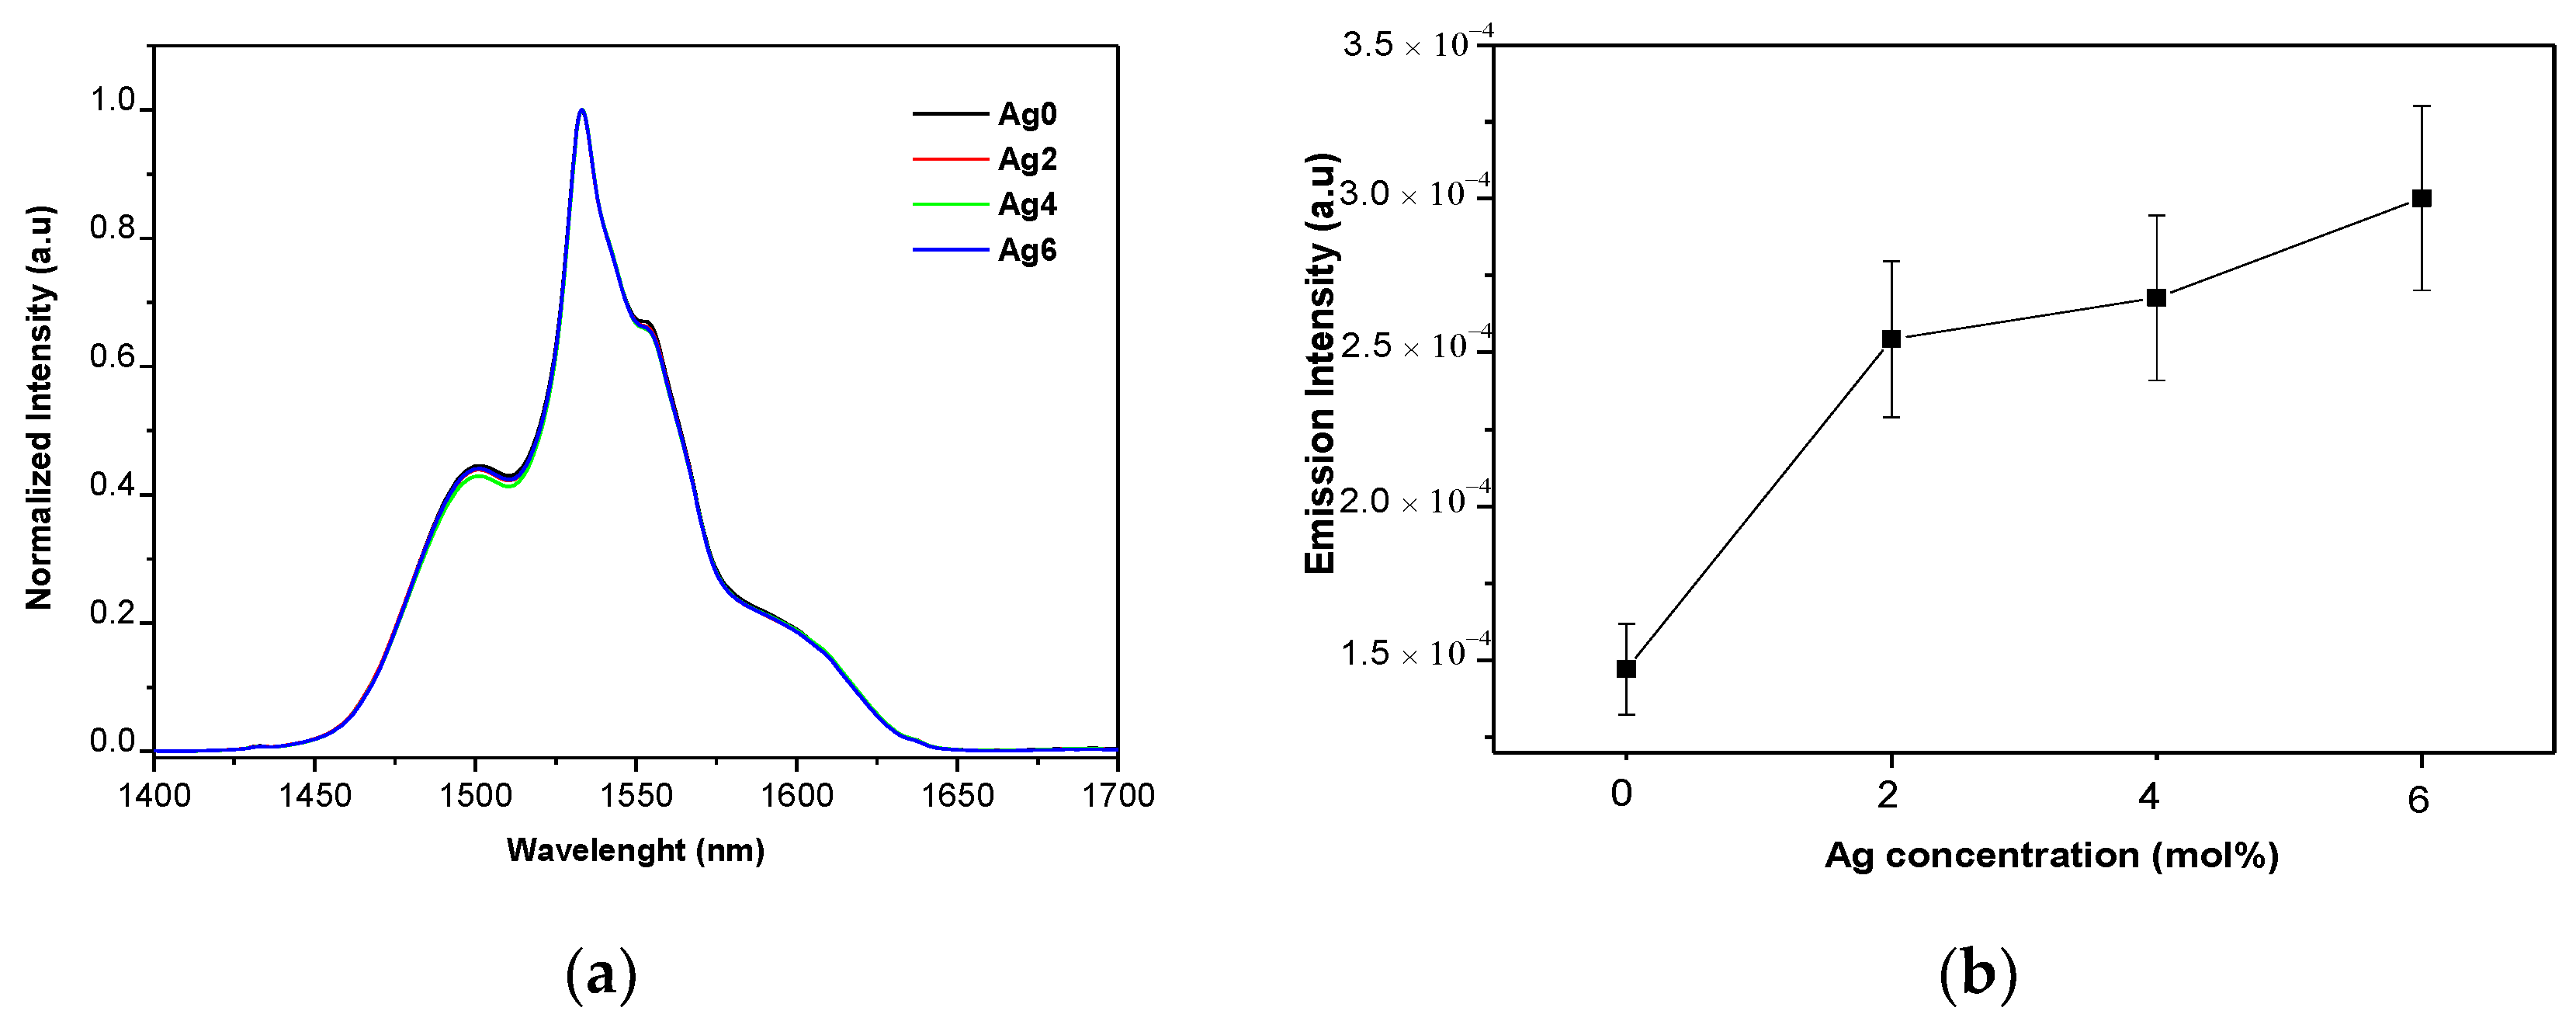
3.2. Optical and Spectroscopic Properties of the As-Prepared Glasses

Figure 2 illustrates the UV–Vis–NIR absorption spectra of the investigated glasses.
The spectra exhibit absorption bands located at 1532, 980, 650, 543, 520, 487, 450, 405, and 376 nm which are due to the f–f transitions of the Er3+ ion, from the ground state 4I15/2 to their excited states 4I13/2, 4I11/2, 4I9/2, 4F9/2, 4S3/2, 2H11/2, 4F7/2, 4F5/2, 4F3/2, and 2G9/2, respectively. One notices that the optical band gap shifts progressively to a longer wavelength with the increase of x; this might be a consequence of the formation of a greater number of non-bridging oxygens (NBOs), as mentioned in the previous section. A similar shift in the band gap due to the addition of Ag2O was also reported in [30]. The presence of silver nanoparticles is known to lead to an absorption band at ~400 nm, due to the surface plasmon resonance (SPR) of Ag NPs [2,7]. As shown in Figure 2a, no absorption band at ~400 nm can be seen indicating that Ag are dispersed in the network in a small size of Ag species. As seen in Figure 2b, the addition of Ag2O has no significant impact on the shape of the absorption band centered at 1.5 µm, neither on the absorption cross sections at 980 nm and 1.5 µm (see Table 1) indicating that the Er3+ ions have similar sites in the investigated glasses.
Judd-Ofelt theoretical analysis was investigated to predict important spectroscopic and laser parameters of the glasses. The J–O intensity parameters (Ωt), the root-mean-square deviation (ΔSrms) and the spectroscopic quality factor (χ) of our glasses compared with thus of other glass systems are tabulated in Table 3.
The low values of the adjustment quality (ΔSrms < 0.2 10−22 cm2) is a clear indication of a good agreement between the experimental and the theoretical oscillator strengths Smes and Scal. These results reflect the reliability of the fit. The Judd-Ofelt parameters of the investigated glasses are similar to the J–O parameters reported for Er3+-doped phosphate [31], fluoro-phosphate [32], and fluoride glasses [33]. Ω2 can be related to the covalency of a RE-ligand, the coordination symmetry of the environment around the Er3+ ion, and the polarizability of the ligand anions [6]. The slight increase in Ω2 when x increases confirms that the addition of Ag2O leads to minor changes in the Er3+ site: slightly less ionic Er3+-ligand bonds, lower symmetry around the Er3+ ions, and more polarized sites of the Er3+ according to [34]. The Ω4 and Ω6 parameters are related to the long-range effect of the glass host such as the rigidity, density, and other dielectric properties of the media [35,36]. The slight decrease of these parameters as x increases is probably associated with a decrease in the glass network rigidity, in agreement with structural analysis.
The spectroscopic quality factor χ was found to slightly decrease from 0.78 to 0.65 with the increase of x indicating that the presence of Ag improves the fluorescence dynamics of the laser transition 4I13/24I13/2. One should point out that the spectroscopic quality factors of the investigated glasses are lower than those reported for phosphate glasses [1,32,33] but are included in the range of 0.126–3.372 reported for Er3+ in various glasses [37].
The values of the radiative transition probability (A), the fluorescence branching ratio β(J → J’), and the radiative lifetime (τr) from the excited states 4I13/2, 4I11/2, and 4I9/2, to the ground state 4I15/2 of Er3+ in the investigated glasses are reported in Table 4.
The obtained values are in agreement with those reported in [38,39,40]. The branching ratio (β) values for the transitions 4I13/24I15/2, 4I11/24I15/2, and 4I9/24I15/2 were larger than 60%, confirming the possibility of achieving efficient IR and red emissions, under suitable excitation conditions [41]. For IR transitions, an increase in the radiative lifetime (τr) accompanied by an increase of the radiative transition probability (A) was observed with an increase in x, confirming the improvement of emission dynamics by adding Ag2O.
Figure 3 shows the emission spectra of the as-prepared glasses.
The spectra of the Ag-containing glasses exhibit a broadband covering almost the visible range. This band can be divided into three sub-bands located at blue, green, and red regions. The band in the blue region can be related to the emission of isolated Ag+ ions [42]. The green and red bands are due to the emission of molecule-like Ag nanoclusters (ML-Ag NCs) with different sizes [10]. The dominance of the blue emission indicates that the networks contain a large density of Ag+ and nanoclusters having a small size. One notices that an increase of x from 0 to 4 increases the intensity of the emission indicating an increase in the number of the Ag species. However, as x increases from 4 to 6, the intensity of the emission decreases. Due to the high Ag amount in the glass, the Ag–Ag distance is suspected to be reduced, thus increasing the interactions between the different Ag species. The spectra also show all the absorption bands relative to Er3+ ions, which appear in superposition of the broad emission band of Ag species; the higher the emission related to Ag species, the more absorption from Er3+ ions. Such overlapping suggests that energy transfer from excited Ag species to Er3+ ions might occur. Such a process was reported by Wei et al. [43] for oxyfluoride glasses containing Ag species and doped with Eu3+ ions.
Note that a very weak luminescence from the Ag0 sample was detected which can be assigned to the intrinsic defects in the glassy host. In addition, the absence of Er3+ emission indicates that the 325 nm excitation is not a resonant excitation for Er3+ ions.
Figure 4a shows the normalized IR emission spectra of the investigated glasses.
The spectra exhibit a broad emission centered at ~1532 nm, due to the 4I13/24I15/2 transition of the Er3+ ion. This broad band is typical of the emission from Er3+ located in an amorphous host. One notices that the shape of the emission remains similar independently of x, confirming that Ag has no major impact on the Er3+ sites. An increase in x from 0 to 2 increases the intensity of the emission as seen in Figure 4b. However, all the Ag2O-containing glasses exhibit similar intensity of emission, independent of the concentration of Ag2O.
The 4I13/2 lifetimes are listed in Table 5.
In agreement with changes in the intensity of the emission seen in Figure 4b, the lifetime increases when x increases from 0 to 2 and remains constant for any further increase in x. As the absorption cross section at 980 nm remains unchanged as x increases, the increase in the intensity of the emission at 1.5 µm can be related to the isolated Ag+ and the small molecule-like Ag (ML-Ag).
Note that the absorption of a photon with a 980 nm wavelength followed by a second absorption in the excited state is equivalent to an absorption at 490 nm that coincides with the spectral position of the second PL band of Figure 3. Thus, even when the excitation wavelength is far from the stated density of the ML-Ag particle, it is possible that the excitation is in a resonant process from the nonlinear phenomenon [44].
Other laser properties of the glasses are listed in Table 6.
An increase of x from 0 to 2 leads to an increase in the effective bandwidth (Δλeff) probably induced by some modifications of ligand fields in the vicinity of Er3+ from one site to another [3,45]. However, as x increases from 2 to 6, Δλeff remains unchanged confirming that the Er3+ ions have a similar site in the Ag-containing glasses. The bandwidth quality factors, estimated from σe* FWHM, are summarized in Table 6. The larger the product, the wider gain bandwidth and higher pumping efficiency. The bandwidth quality factors are similar to those reported for phosphate glass (179.73 10−21 cm2·nm) [46] and bismuth glass (280.60 10−21 cm2·nm) [47]. It is worth pointing out that the sample doped with 2 mol% Ag2O (Ag2) has a large bandwidth quality factor (205.82 10−21 cm2·nm) indicating that this glass may be a good candidate for an Erbium doped fiber amplifier (EDFA) host.

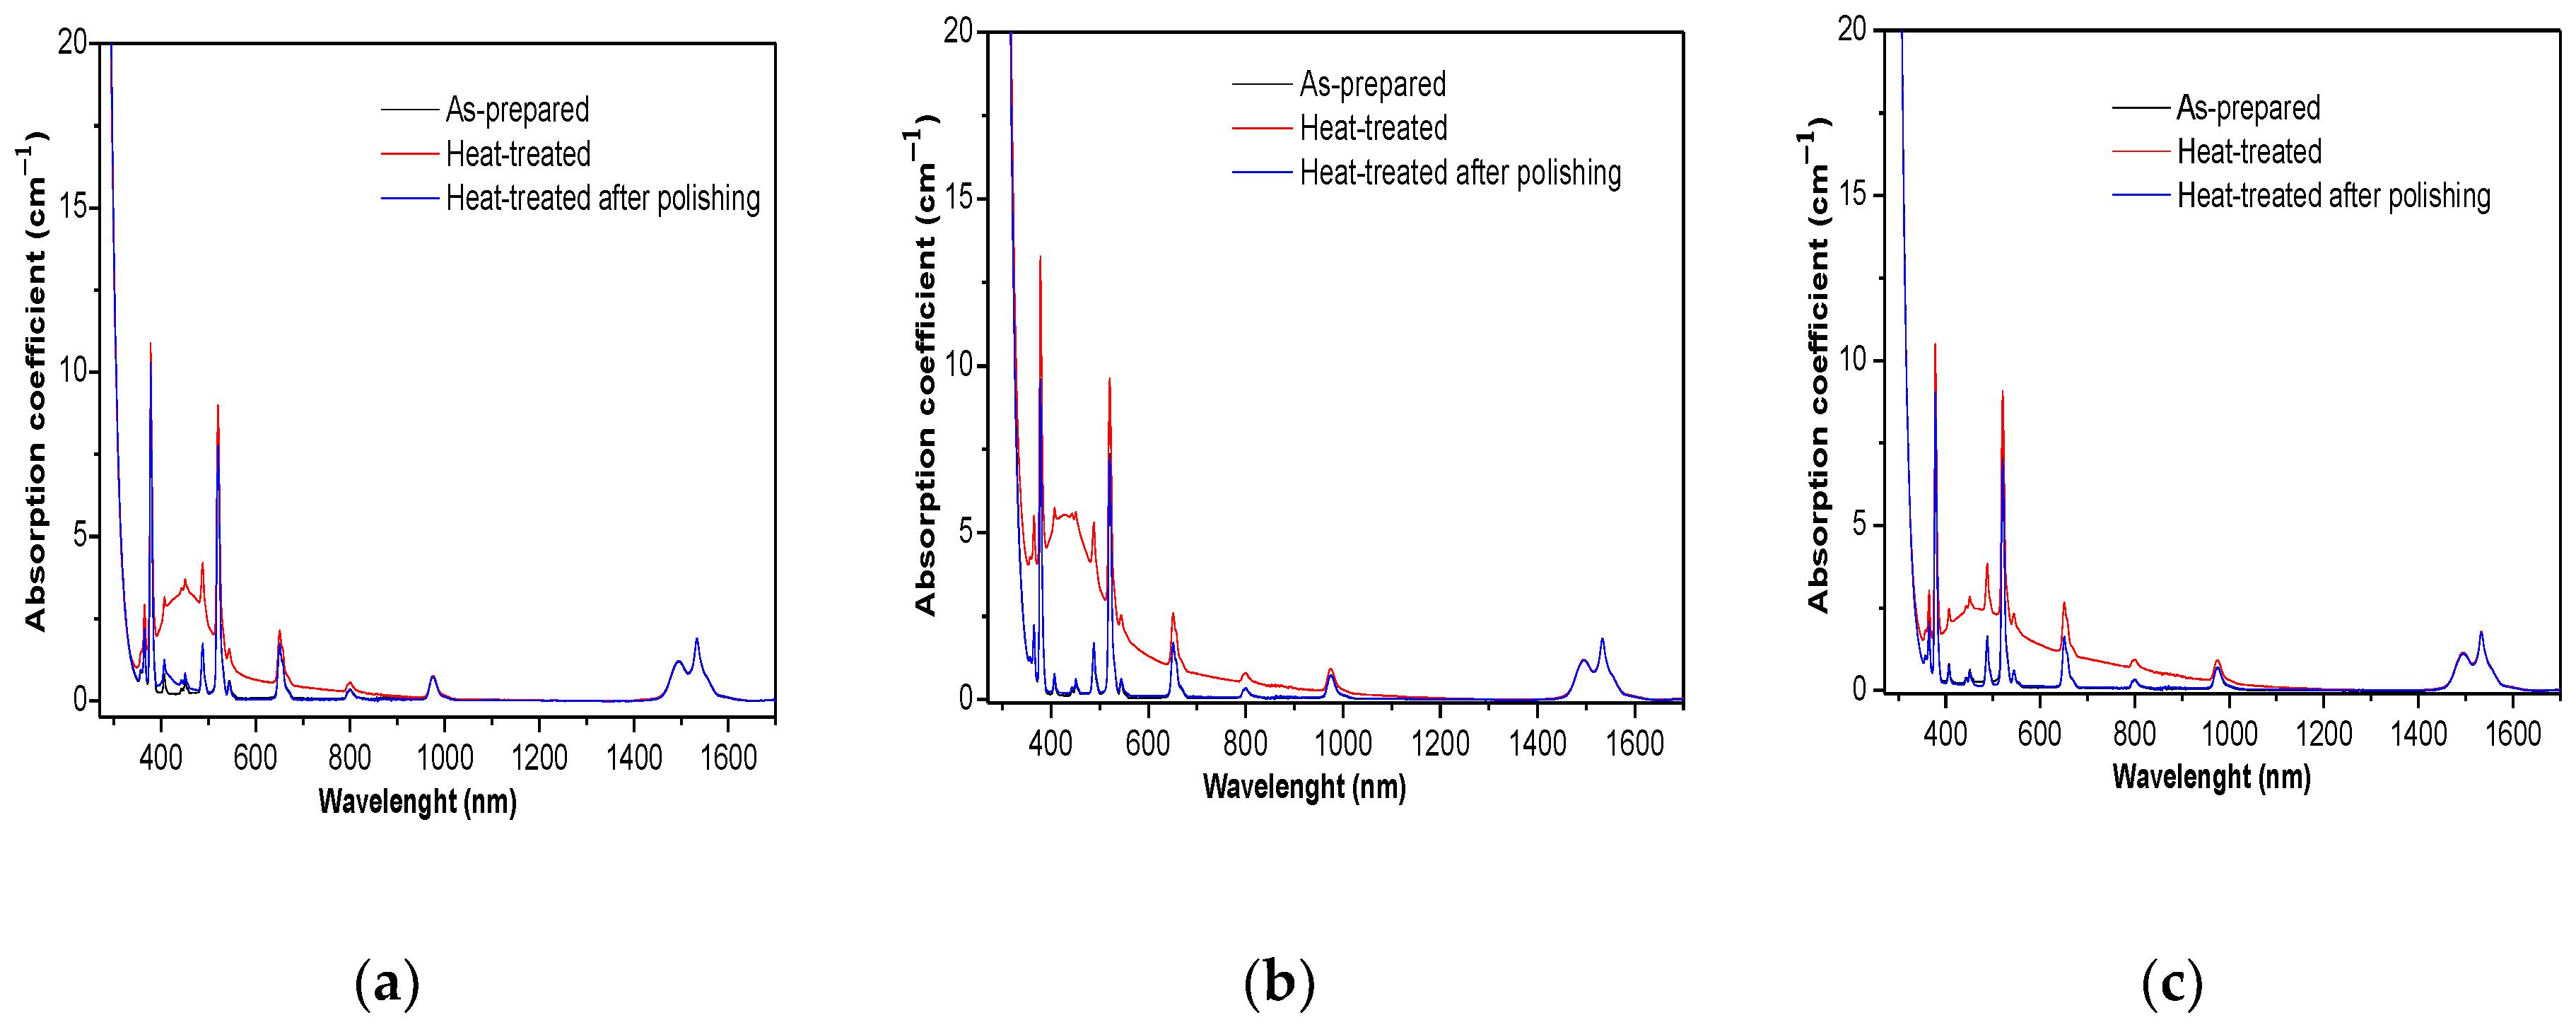
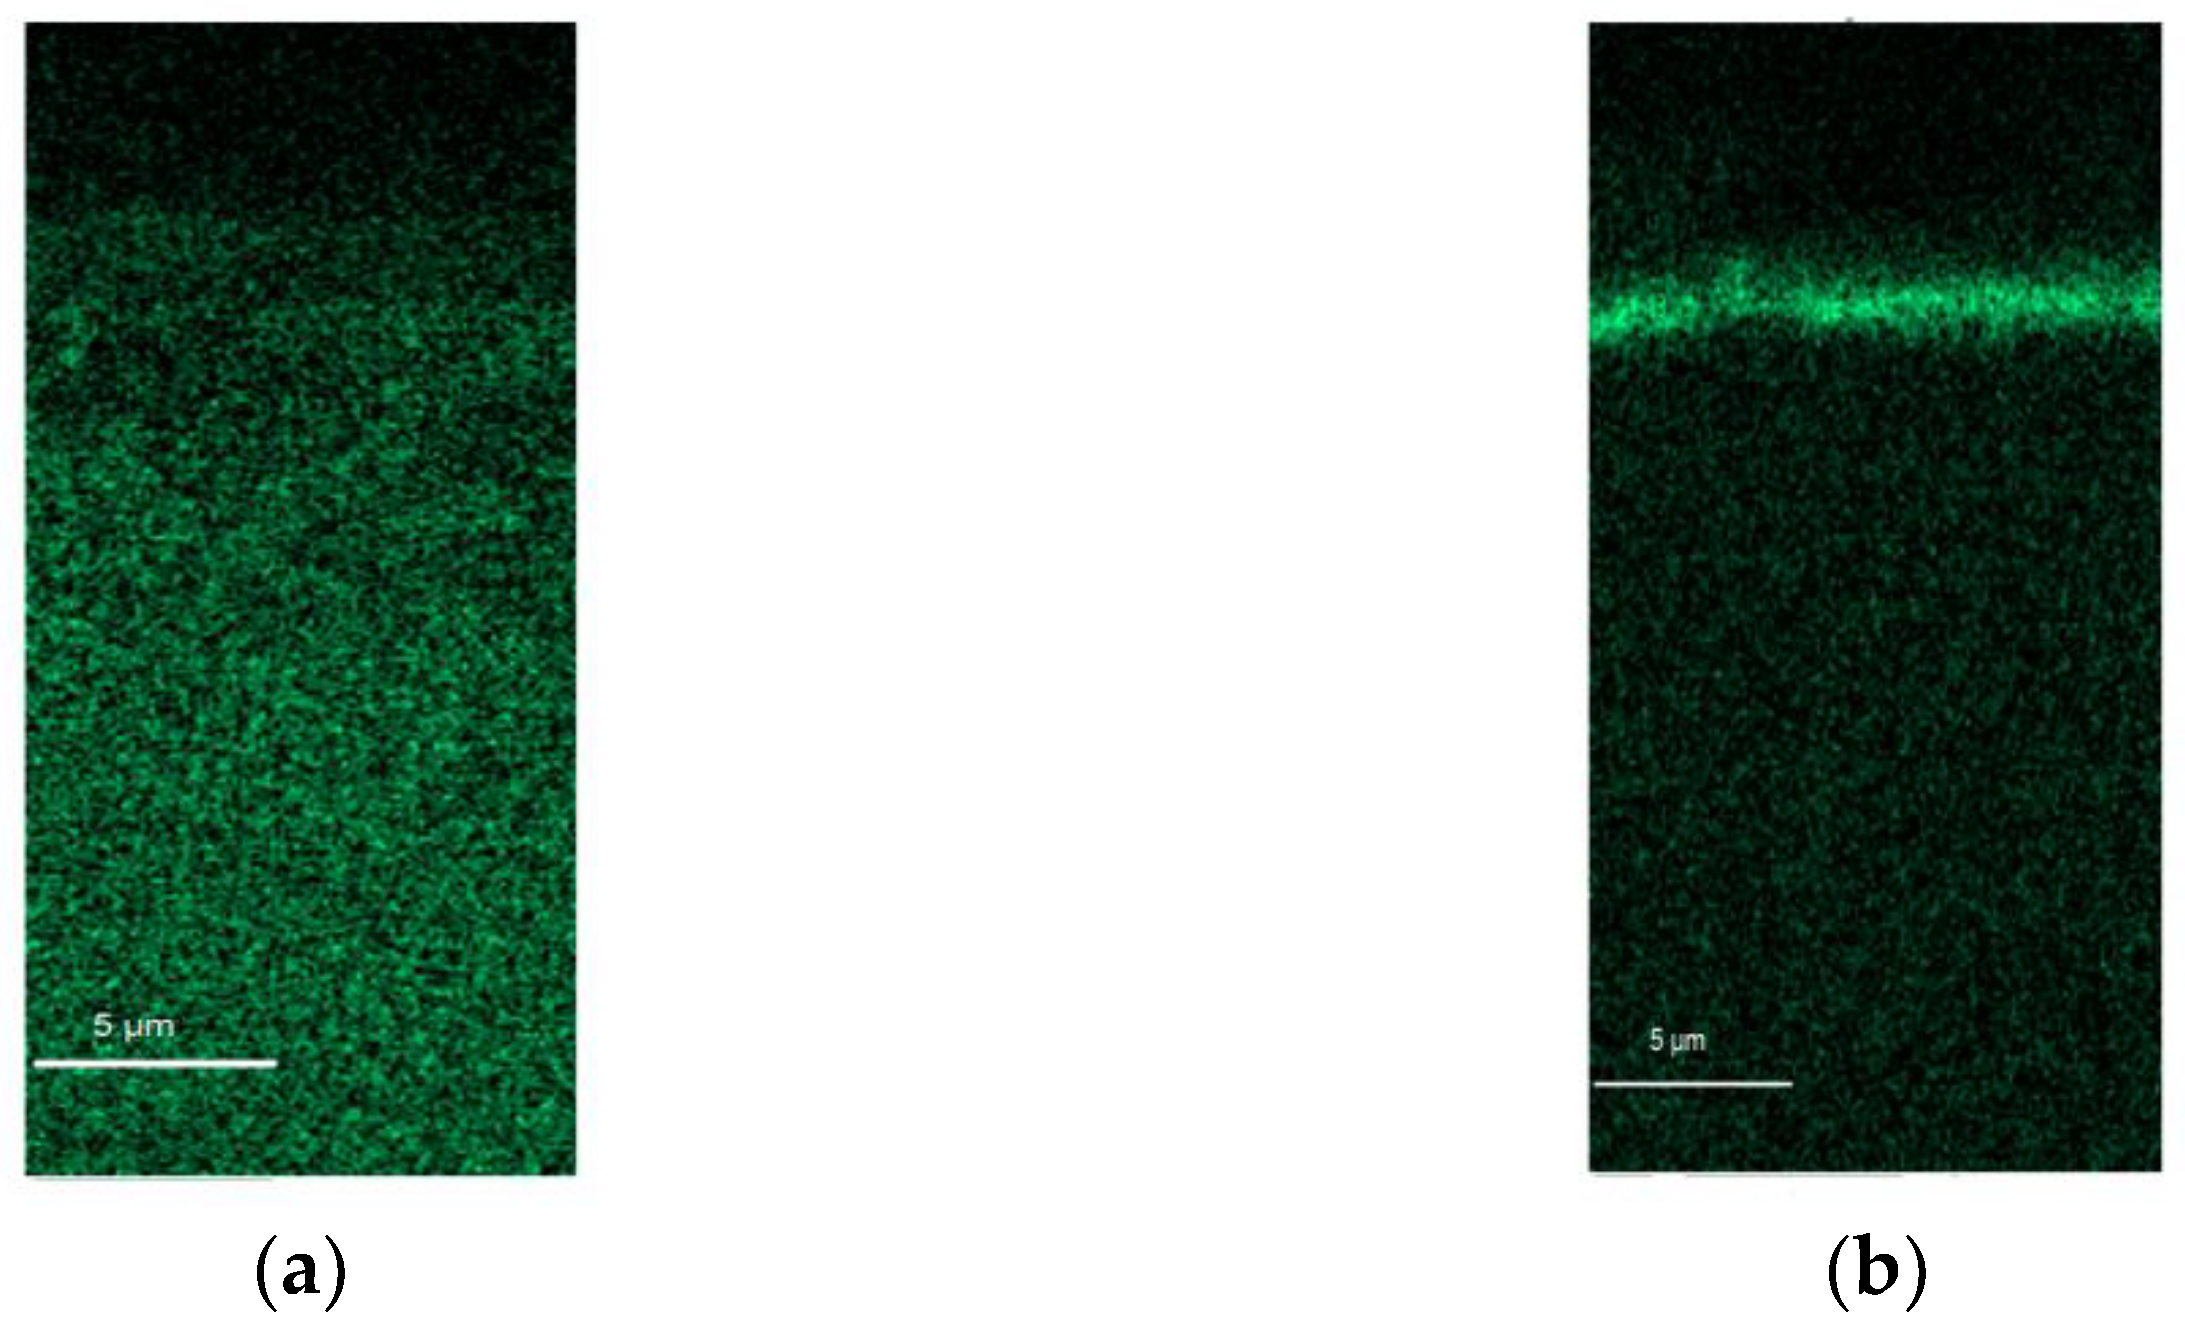
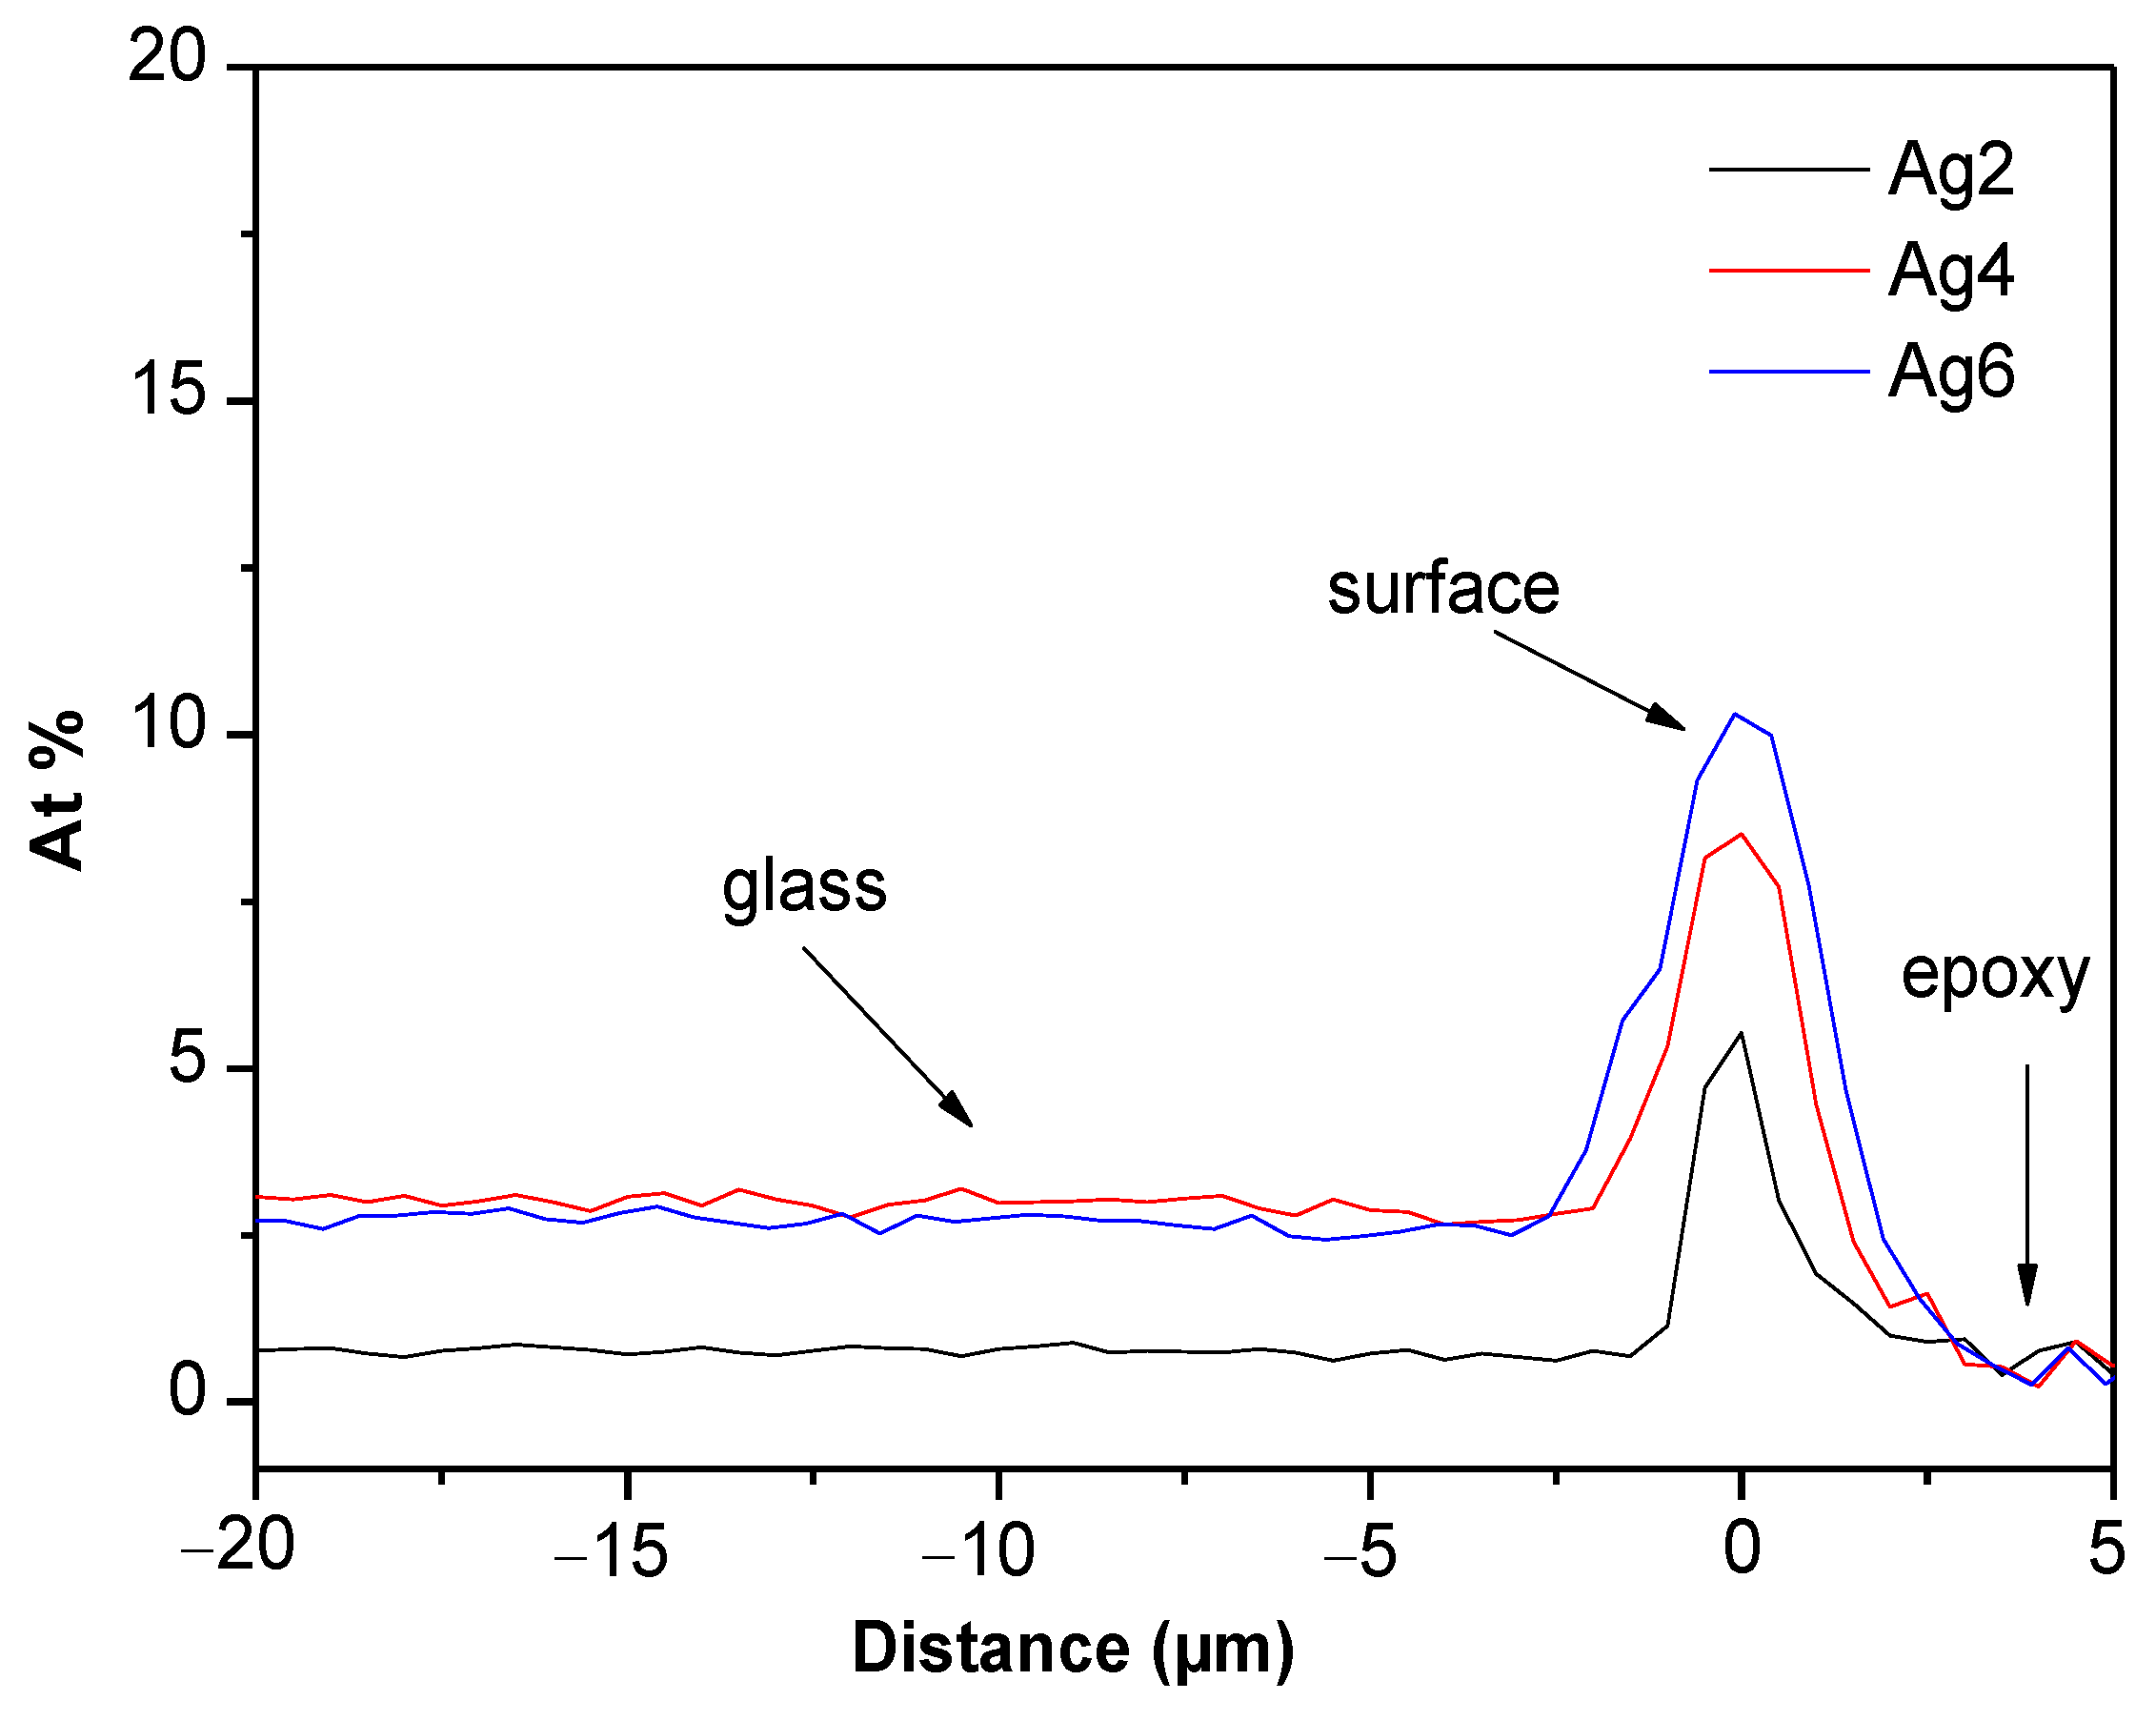
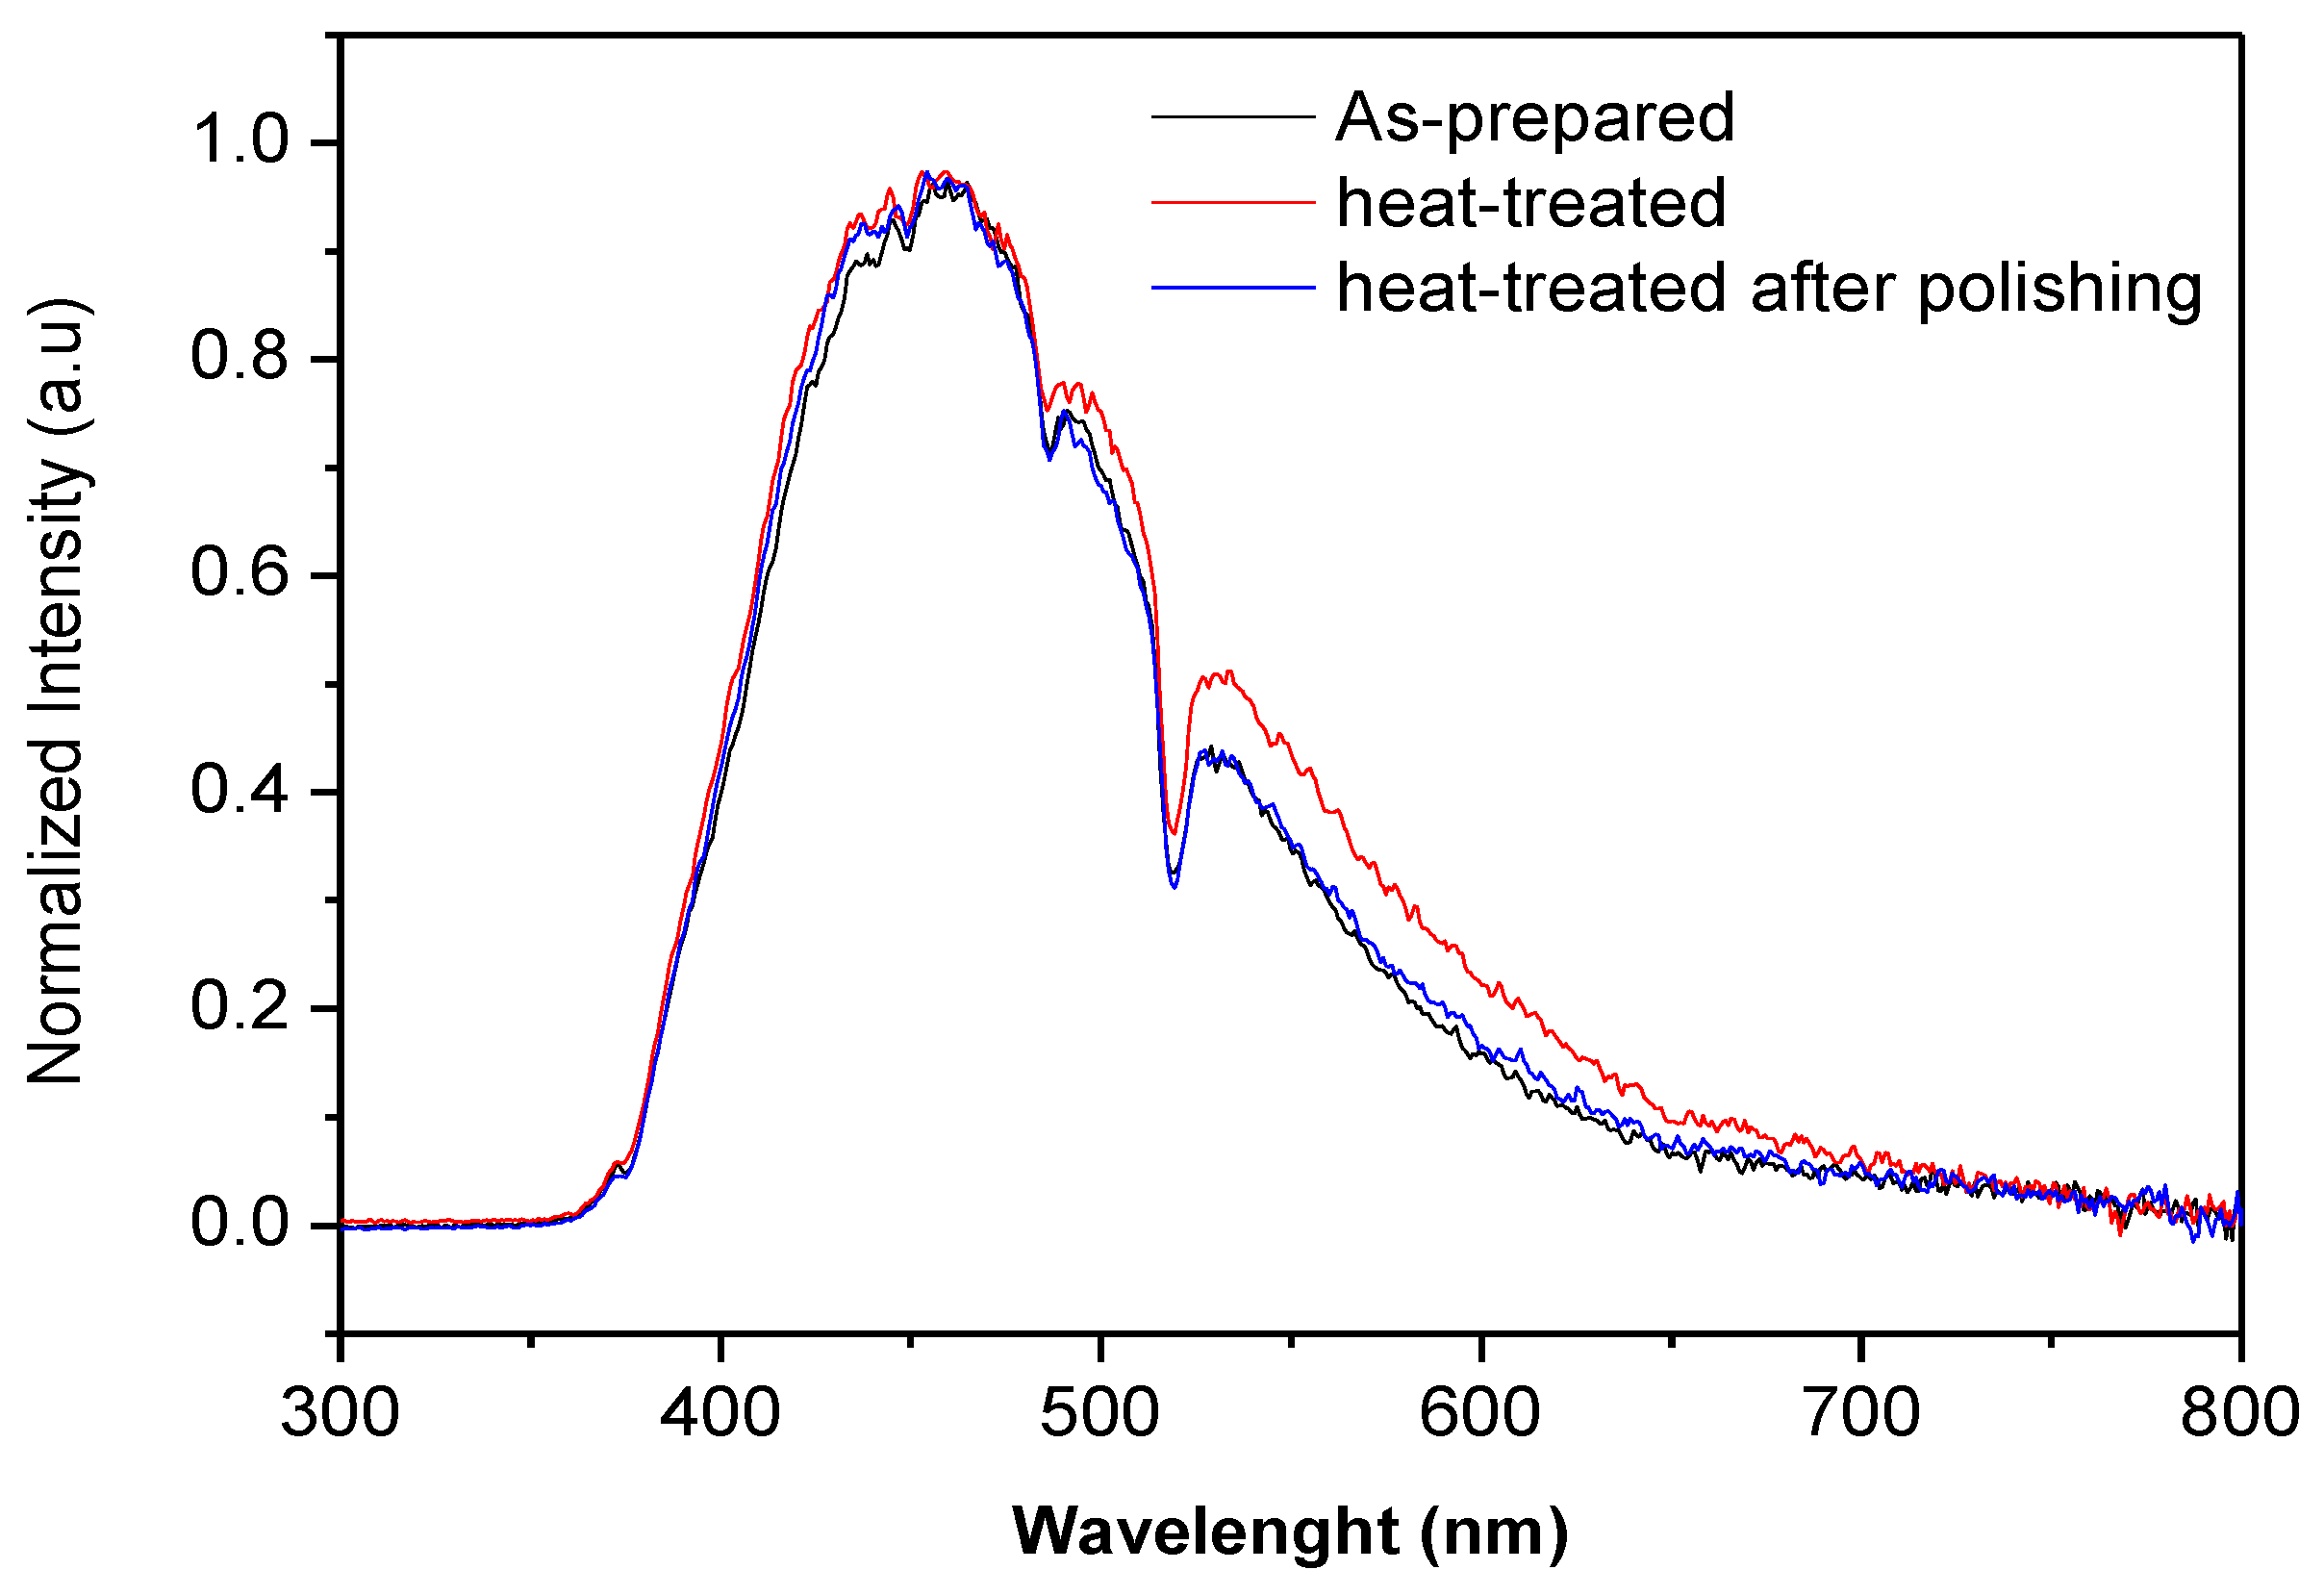
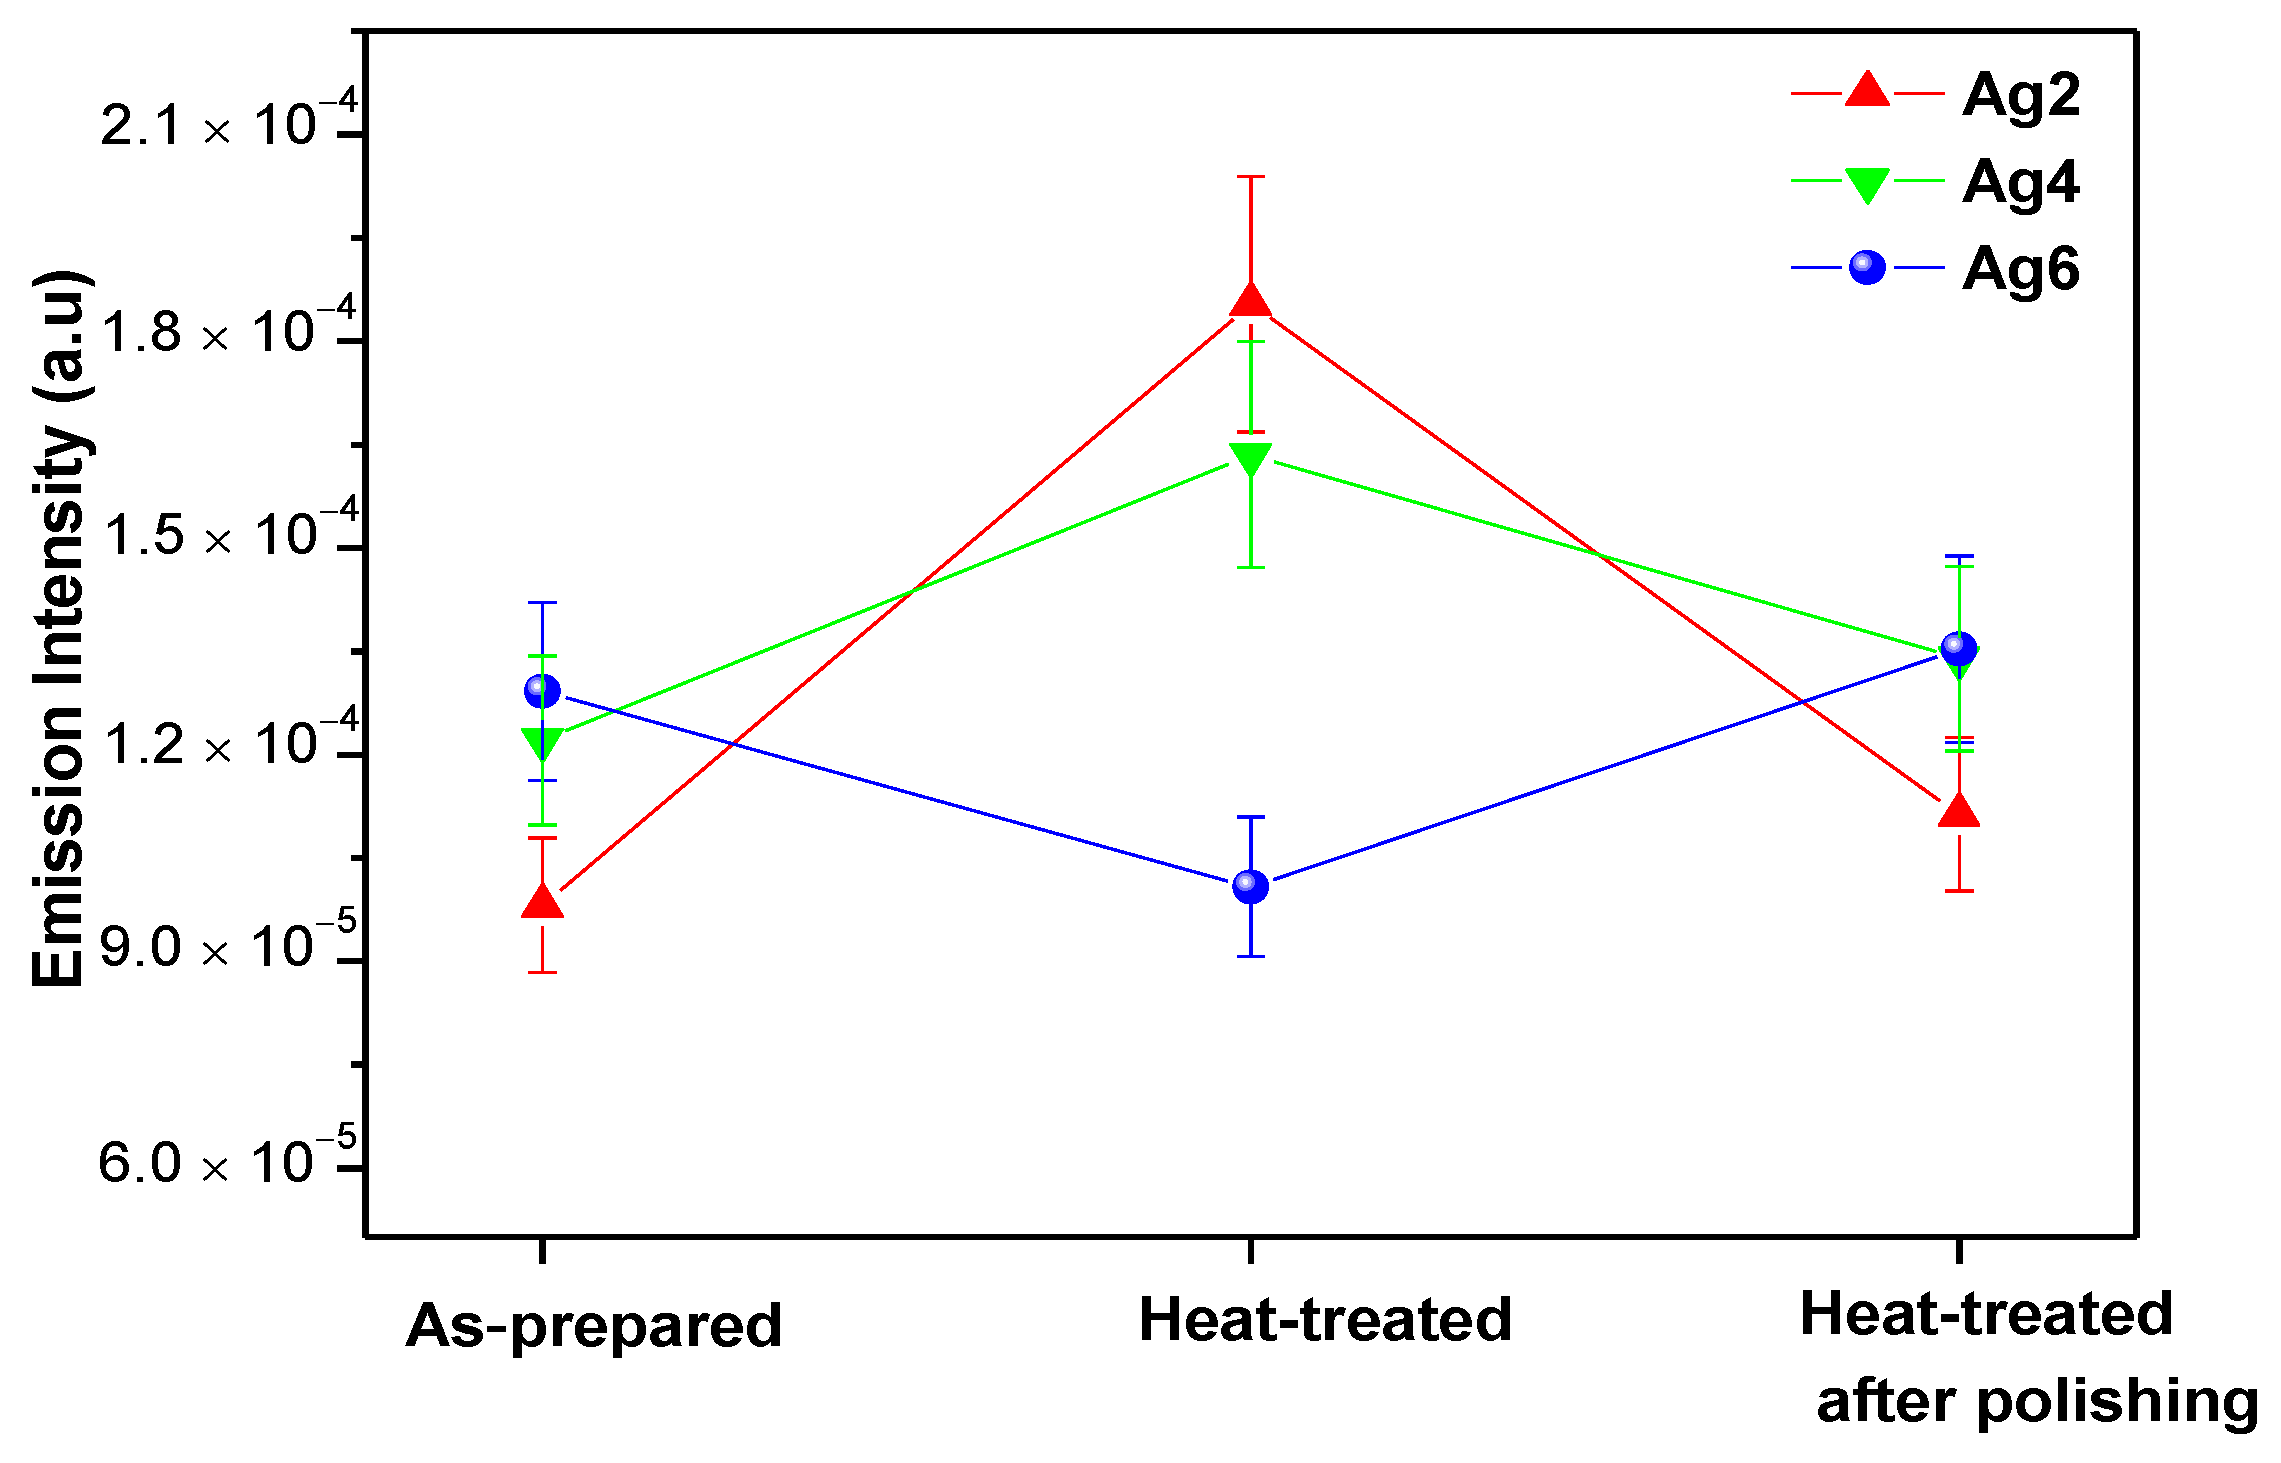
3.3. Impact of Heat Treatment on the Optical and Spectroscopic Properties of the Glasses

The glasses were heat-treated for 17 h at Tg + 10 °C in order to grow silver nanoparticles as performed in [6]. After heat treatment, a change in the color of the glasses from pink to yellow was seen. The absorption spectra of the heat-treated glasses are shown in Figure 5.
After heat treatment, a new broad band centered at ~412 nm appears in the absorption spectra. According to [48], this band can be related to the surface plasmon resonance (SPR) absorption of Ag NPs. During the heat treatment process, the viscosity of the glass decreases and therefore the ML-Ag species are suspected to coalesce to form Ag NPs. The asymmetric character of the SPR band indicates that the average distance between Ag particles may be much larger than their sizes as suggested by Malta et al. [49]. The intensity of this SPR band increases with the increase of x from 2 to 4 but decreases when x increases to 6. We think that the strong dipolar interactions between the isolated ML-Ag and Ag+ block their association, thus limiting the formation of Ag NPs.
After polishing of heat-treated glasses, the color of the glasses changed back to pink in agreement with the disappearance of the SPR absorption band (Figure 5). We suspect the Ag NPs to form only at the surface, as confirmed by the elemental mapping of Ag taken at the cross section of the glasses before and after heat treatment. As seen in Figure 6a, the elemental mapping of Ag clearly shows that Ag species are well dispersed in the glass.
After heat treatment (Figure 6b), the Ag species migrate to the surface and form a layer of Ag species on the surface of the glasses.
As seen in Figure 7, an increase in x increases not only the thickness of the Ag layer precipitating at the surface of the glass but also the Ag content in the layer.
The normalized visible emission spectra of the sample doped with 2 mol% of Ag2O (Ag2) prior to and after heat treatment are shown in Figure 8.
The heat treatment had no noticeable effect on the intensity or on the shape of the emission except for the green band. The increase of the intensity of the shoulder at ~510 nm is a direct consequence of the Ag NCs growing to larger sizes during the heat treatment. It is noticeable that after polishing, the emission spectrum is similar to that of the as-prepared sample confirming that the newly formed Ag species are only at the surface. The same results were obtained for the other glasses.
The emission intensities of the heat-treated glasses prior to and after polishing are depicted in Figure 9.
Considering Er3+:4I13/2 lifetime values of these glasses (Table 6), the changes in the intensity of the emission and lifetime are similar: after heat treatment, they increase for the glasses doped with 2 (Ag2) and 4 mol% (Ag4) but decrease for the glass with 6 mol% (Ag6). The intensity of the emission at 1.53 µm and the lifetime increase after heat treatment probably due to the local field enhancement induced by the Ag NPs formed after heat treatment. A strong local electric field around Er3+ ions increases their transition probability from the 4I13/2 level to 4I15/2 level [50,51]. The decrease in the emission and in the lifetime of the glass with x = 6 (Ag6) after heat treatment is probably due to a reverse energy transfer from Er3+ ions to formed Ag species as suggested by [52]. After polishing, the intensity of the emission and the lifetime are back to the level of the emission from the glasses prior to heat treatment confirming that the newly formed Ag species are only at the surface.

4. Conclusions

In summary, the addition of Ag2O in sodium fluoro-phosphate glasses contributes to the depolymerization of the glass network and creation of a greater number of terminal NBOs, as evidenced by the decrease in Tg and the red-shift of the optical band gap. However, there was no significant impact of Ag2O addition on the Er3+ sites to their absorption and emission cross sections. From the visible emission, the as-prepared glasses contain isolated Ag+ and molecular like (ML)-Ag NCs. The increase in the IR emission intensity and in the Er3+:4I13/2 lifetime were observed by adding 2 mol% of Ag2O probably due to the energy transfer from Ag species to Er3+ ions. However, the intensity of the emission did not increase when the concentration of Ag2O increased to 6 mol%. The glasses were heat-treated to precipitate Ag nanoparticles (NPs) as confirmed by the appearance of a new absorption band at ~400 nm and increase in the intensity of the emission at 1.5 µm and in the Er3+:4I13/2 lifetime. However, after polishing the heat-treated glasses, the glasses exhibited similar optical and luminescence properties to that of the as-prepared glasses indicating that the Ag NPs precipitated mainly at the surface of the glasses as confirmed by the elemental mapping of Ag. The enhancement in the spectroscopic properties of the glasses induced by the Ag species shows that the Er3+-doped and Ag NPs containing fluoro-phosphate glass are promising glass candidates for 1.53 μm band EDFA and for solid-state laser.

Author Contributions

H.E. and L.P. conceived and designed this work. M.E. and L.K. prepared and characterized the glasses. I.J. contributed to the analysis of the Judd-Ofelt results. B.G. carried out some of the spectroscopy measurements, including lifetime measurement. All the authors discussed and analyzed the results, contributed to the writing, and approved the final manuscript.

Funding

This research received no external funding.

Acknowledgments

L.P. would like to acknowledge the financial support of the Academy of Finland (Flagship Programme, Photonics Research and Innovation ((PREIN-320165) and Academy Project (308558)). This work made use of Tampere Microscopy Center facilities at Tampere University. H.E. would like to acknowledge the financial support of the University of Tunis El Manar.

Conflicts of Interest

The authors declare no conflict of interest.

References

  1. Righini, G.C.; Chiappini, A. Glass optical waveguides: A review of fabrication techniques. Opt. Eng. 2014, 53, 071819–071832. [Google Scholar] [CrossRef]
  2. Fares, H.; Santos, S.N.C.; Santos, M.V.; Franco, D.F.; Souza, A.E.; Manzani, D.; Mendonça, C.R.; Nalin, M. Highly luminescent silver nanocluster-doped fluorophosphate glasses for microfabrication of 3D waveguides. RSC. Adv. 2017, 7, 55935–55944. [Google Scholar] [CrossRef] [Green Version]
  3. Jlassi, J.; Elhouichet, H.; Ferid, M.; Barthou, C. Judd-Ofelt analysis and improvement of thermal and optical properties of tellurite glasses by adding P2O5. J. Lumin. 2010, 130, 2394–2401. [Google Scholar] [CrossRef]
  4. Jlassi, I.; Elhouichet, H.; Hraiech, S.; Ferid, M. Effect of heat treatment on the structural and optical properties of tellurite glasses doped erbium. J. Lumin. 2012, 132, 832–840. [Google Scholar] [CrossRef]
  5. Thomas, S.; George, R.; Rasool, S.N.; Rathaiah, M.; Venkatramu, V.; Joseph, C.; Unnikrishnan, N.V. Optical properties of Sm3+ ions in zinc potassium fluorophosphate glasses. Opt Mat. 2013, 36, 242–250. [Google Scholar] [CrossRef]
  6. Saad, M.; Stambouli, W.; Mohamed, S.A.; Elhouichet, H. Ag nanoparticles induced luminescence enhancement of Eu3+ doped phosphate glasses. J. Alloys Compd. 2017, 705, 550–558. [Google Scholar] [CrossRef]
  7. Mechergui, I.; Fares, H.; Mohamed, S.A.; Nalin, M.; Elhouichet, H. Coupling between surface plasmon resonance and Sm3+ ions induced enhancement of luminescence properties in fluoro-tellurite glasses. J. Lumin. 2017, 190, 518–524. [Google Scholar] [CrossRef]
  8. Amendola, V.; Bakr, O.M.; Stellacci, F. A Study of the Surface Plasmon Resonance of Silver Nanoparticles by the Discrete Dipole Approximation Method: Effect of Shape, Size, Structure, and Assembly. Plasmonics 2010, 5, 85–97. [Google Scholar] [CrossRef]
  9. Fares, H.; Elhouichet, H.; Gelloz, B.; Ferid, M. Silver nanoparticles enhanced luminescence properties of Er3+ doped tellurite glasses: Effect of heat treatment. J. Appl. Phys. 2014, 116, 123504–123513. [Google Scholar] [CrossRef]
  10. Tikhomirov, V.K.; Rodríguez, V.D.; Kuznetsov, A.; Kirilenko, D.; Van Tendeloo, G.; Moshchalkov, V.V. Preparation and luminescence of bulk oxyfluoride glasses doped with Ag nanoclusters. Opt. Express. 2010, 18, 22032–22040. [Google Scholar] [CrossRef] [Green Version]
  11. Lin, H.; Chen, D.; Yu, Y.; Zhang, R.; Wang, Y. Molecular-like Ag clusters sensitized near-infrared down-conversion luminescence in oxyfluoride glasses for broadband spectral modification. Appl. Phys. Lett. 2013, 103, 091902. [Google Scholar] [CrossRef]
  12. Poudel, A.; Dmitrieva, I.; Gumenyuk, R.; Mihai, L.; Sporea, D.; Muresan, O.; Rusen, I.; Hakkarainen, T.; Boetti, N.G.; Niemi, T.; et al. Effect of ZnO Addition and of Alpha Particle Irradiation on Various Properties of Er3+, Yb3+ Doped Phosphate Glasses. J. Appl. Sci. 2017, 7, 1094. [Google Scholar] [CrossRef]
  13. Judd, B.R. Optical Absorption Intensities of Rare-Earth Ions. J. Phys. Rev. 1962, 127, 750–761. [Google Scholar] [CrossRef]
  14. Ofelt, G.S. Intensities of Crystal Spectra of Rare-Earth Ions. J. Chem. Phys. 1962, 37, 511–520. [Google Scholar] [CrossRef]
  15. Shanmugavelu, B.; Ravi Kanth Kumar, V.V.; Kuladeep, R.; Rao, D.N. Third order nonlinear optical properties of bismuth zinc borate glasses. J. Appl. Phys. 2013, 114, 243. [Google Scholar] [CrossRef]
  16. Carnall, W.T.; Fields, P.R.; Rajnak, R. Electronic Energy Levels in the Trivalent Lanthanide Aquo Ions. I. Pr3+, Nd3+, Pm3+, Sm3+, Dy3+, Ho3+, Er3+, and Tm3+. J. Chem. Phys. 1968, 49, 4424. [Google Scholar] [CrossRef]
  17. Stambouli, W.; Elhouichet, H.; Barthou, C.; Férid, M. Energy transfer induced photoluminescence improvement in Er3+/Ce3+/Yb3+ tri-doped tellurite glass. J. Alloys Compd. 2013, 580, 310–315. [Google Scholar] [CrossRef]
  18. Jorgensen, C.K.; Reisfeld, R. Judd-Ofelt parameters and chemical bonding. J. Less Common Met. 1983, 93, 107. [Google Scholar] [CrossRef]
  19. Weber, M.J. Probabilities for Radiative and Nonradiative Decay of Er3+ in LaF3. Phys. Rev. 1967, 157, 262. [Google Scholar] [CrossRef]
  20. Weber, M.J.; Myers, J.D.; Blackburn, D.H. Optical properties of Nd3+ in tellurite and phosphotellurite glasses. J. Appl. Phys. 1981, 52, 2944. [Google Scholar] [CrossRef]
  21. Jiang, C.; Deng, P.; Zhang, J.; Huang, G.; Gan, F. Yb: Tellurogermanate laser glass with high emission cross section. J. Lumin. 1999, 82, 321–326. [Google Scholar] [CrossRef]
  22. Soltani, I.; Hraiech, S.; Horchani-Naifer, K.; Elhouichet, H.; Gelloz, B.; Ferid, M. Thermal, structural and optical properties of Er3+ doped phosphate glasses containing silver nanoparticles. J. Alloys Compd. 2016, 686, 556–563. [Google Scholar] [CrossRef]
  23. Hu, Y.; Qiu, J.; Song, Z.; Yang, Z.; Yang, Y.; Zhou, D.; Jiao, Q.; Chenshuo, M. Spectroscopic properties of Tm3+/Er3+/Yb3+ co-doped oxyfluorogermanate glasses containing silver nanoparticles. J. Lumin. 2014, 145, 512–517. [Google Scholar] [CrossRef]
  24. Konidakis, I.; Varsamis, C.-P.E.; Kamitsos, E.I.; Möncke, D.; Ehrt, D. Structure and properties of mixed strontium-manganese metaphosphate glasses. J. Phys. Chem. 2010, 114, 9125–9138. [Google Scholar] [CrossRef]
  25. Gao, H.; Tan, T.; Wang, D. Effect of composition on the release kinetics of phosphate controlled release glasses in aqueous medium. J. Controlled Release 2004, 96, 21–28. [Google Scholar] [CrossRef] [PubMed]
  26. Abou, E.N.; Chrzanowski, W.; Pickup, D.M.; O’Dell, L.A.; Mordan, N.J.; Newport, R.J.; Smith, M.E.; Knowles, J.C. Structure and properties of strontium-doped phosphate-based glasses. J. R. Soc. Interface 2009, 6, 435–446. [Google Scholar] [CrossRef] [PubMed]
  27. Cui, S.; Massera, J.; Lastusaari, M.; Hupa, L.; Petit, L. Novel oxyfluorophosphate glasses and glass-ceramics. J. Non-Cryst. Solids 2016, 445–446, 40–44. [Google Scholar] [CrossRef]
  28. Murthy, M.K. Phosphate-Halide Systems: II, Infrared Spectra of Glasses in the System NaPO3-Na. J. Am. Ceram. Soc. 1963, 46, 558–559. [Google Scholar] [CrossRef]
  29. Wilder, J.A.; Shelby, J.E. Property Variation in Alkali Alkaline-Earth Metaphosphate Glasses. J. Am. Ceram. Soc. 1984, 67, 438–444. [Google Scholar] [CrossRef]
  30. Mishra, A.; Rocherullé, J.; Massera, J. Ag-doped phosphate bioactive glasses: Thermal, structural and in-vitro dissolution properties. Biomed. Glasses 2016, 2, 38–48. [Google Scholar] [CrossRef]
  31. Righini, G.C.; Pelli, S.; Fossi, M.; Brenci, M.; Lipovskii, A.A.; Kolobkova, E.V.; Bettinelli, M. Characterization of Er-doped sodium-niobium phosphate glasses. Int. Soc. Opt. Photonics 2001, 4282, 210–215. [Google Scholar]
  32. Babu, S.; Seshadri, M.; Reddy Prasad, V.; Ratnakaram, Y.C. Spectroscopic and laser properties of Er3+ doped fluoro-phosphate glasses as promising candidates for broadband optical fiber lasers and amplifiers. Mater. Res. Bull. 2015, 70, 935–944. [Google Scholar] [CrossRef]
  33. Langar, A.; Bouzidi, C.; Elhouichet, H.; Ferid, M. Er–Yb codoped phosphate glasses with improved gain characteristics for an efficient 1.55 µm broadband optical amplifiers. J. Lumin. 2014, 148, 249–255. [Google Scholar] [CrossRef]
  34. Tian, Y.; Tian, B.; Chen, B.; Cui, C.; Huang, P.; Wang, L.; Hua, R. Morphological tuning and enhanced luminescence of NaEuF4 nano-/submicro-crystals. J. Appl. Surf. Sci. 2014, 313, 504–511. [Google Scholar] [CrossRef]
  35. Vijayakumar, M.; Marimuthu, K.; Sudarsan, V. Concentration dependent spectroscopic behavior of Sm3+ doped leadfluoro-borophosphate glasses for laser and LED applications. J. Alloys Compd. 2015, 647, 209–220. [Google Scholar] [CrossRef]
  36. Jlassi, I.; Elhouichet, H.; Ferid, M.; Chtourou, R.; Oueslati, M. Study of photoluminescence quenching in Er3+-doped tellurite glasses. Opt. Mater. 2010, 32, 743–747. [Google Scholar] [CrossRef]
  37. Kaminskii, A. Crystalline Lasers: Physical Processes and Operating Schemes; CRC: Boca Raton, FL, USA, 1996. [Google Scholar]
  38. Reddy, B.S.; Buddhudu, S.; Rao, K.S.R.K.; Babu, P.N.; Annapurna, K. Optical Analysis of Er3+: Boro-Fluoro-Phosphate Glasses. Spectrosc. Lett. 2008, 41, 376–384. [Google Scholar] [CrossRef]
  39. Sreedhara, V.B.; Vijayac, N.; Ramacharia, D.; Jayasankar, C.K. Luminescence studies on Er3+-doped zincfluorophosphate glasses for 1.53 μm laser applications. J. Mol. Struct. 2017, 1130, 1001–1008. [Google Scholar] [CrossRef]
  40. Moustafa, S.Y.; Sahar, M.R.; Ghoshal, S.K. Spectroscopic attributes of Er3+ ions in antimony phosphate glass incorporated with Ag nanoparticles: Judd-Ofelt analysis. J. Alloys Compd. 2017, 712, 781–794. [Google Scholar] [CrossRef]
  41. Hasim, N.; Rohani, M.S. The Effect of Nd3+ Composition on Judd-Ofelt Analysis of Lithium Niobate Tellurite Glasses Codoped with Er3+. Solid State Phenom. 2017, 268, 191–197. [Google Scholar] [CrossRef]
  42. Belharouak, I.; Weill, F.; Parent, C.; Le Flem, G.; Moine, B. Silver particles in glasses of the ‘Ag2O–ZnO–P2O5’ system. J. Non-Cryst. Solids 2001, 293, 649–656. [Google Scholar] [CrossRef]
  43. Wei, R.F.; Li, J.J.; Gao, J.Y.; Guo, H. Enhancement of Eu3+ Luminescence by Ag Species (Ag NPs, ML-Ag, Ag+) in Oxyfluoride Glasses. J. Am. Ceram. Soc. 2012, 95, 3380–3382. [Google Scholar] [CrossRef]
  44. Miniscalco, W.J.; Quimby, R.S. General procedure for the analysis of Er3+ cross sections. Opt. Lett. 1991, 16, 258. [Google Scholar] [CrossRef] [PubMed]
  45. Fares, H.; Elhouichet, H.; Gelloz, B.; Férid, M. Surface plasmon resonance induced Er3+ photoluminescence enhancement in tellurite glass. J. Appl. Phys. 2015, 117, 193102. [Google Scholar] [CrossRef]
  46. Soltani, I.; Hraiech, S.; Horchani-Naifer, K.; Elhouichet, H.; Férid, M. Effect of silver nanoparticles on spectroscopic properties of Er3+ doped phosphate glass. Opt. Mater. 2015, 46, 454–460. [Google Scholar] [CrossRef]
  47. Qi, J.; Xu, T.; Wu, Y.; Shen, X.; Dai, S.; Xu, Y. Ag nanoparticles enhanced near-IR emission from Er3+ ions doped glasses. Opt. Mater. 2013, 35, 2502–2506. [Google Scholar] [CrossRef]
  48. Jimenez, J.A.; Sendova, M.; Liu, H.; Fernandez, F.E. Supersaturation-driven optical tuning of Ag nanocomposite glasses for photonics: An in situ optical microspectroscopy study. Plasmonics 2011, 6, 399–405. [Google Scholar] [CrossRef]
  49. Malta, O.L.; Santa-Cruz, P.A.; De Sa, G.F.; Auzel, F. Fluorescence enhancement induced by the presence of small silver particles in Eu3+ doped materials. J. Lumin. 1985, 33, 261–272. [Google Scholar] [CrossRef]
  50. Silva, G.; Holgado, D.; Anjos, V. Effect of Ag nanoparticles on the radiative properties of tellurite glasses doped with Er3+, Yb3+ and Tm3+ ions. J. Opt. Mat. 2014, 37, 281–286. [Google Scholar] [CrossRef]
  51. Sazali, E.S.; Sahar, M.R.; Ghoshal, S.K.; Arifin, R.; Rohani, M.S.; Amjad, R.J. Efficient optical enhancement of Er3+ doped lead–tellurite glass embedded with gold nanoparticles: Role of heat-treatment. J. Non-Cryst. Solids 2015, 410, 174–179. [Google Scholar] [CrossRef]
  52. Mahraz, Z.A.S.; Sahar, M.R.; Ghoshal, S.K.; Dousti, M.R.; Amjad, R.J. Silver nanoparticles enhanced luminescence of Er3+ ions in boro-tellurite glasses. Mater. Lett. 2013, 112, 136–138. [Google Scholar] [CrossRef]
Figure 1. The IR absorption spectra of the investigated glasses.
Materials 12 03516 g001
Figure 2. Absorption coefficient of the investigated glasses (a) in the UV–Vis and (b) IR range.
Materials 12 03516 g002
Figure 3. Emission spectra of the investigated glasses upon 325 nm excitation.
Materials 12 03516 g003
Figure 4. (a) Normalized emission band; (b) intensity of the emission at 1.53 µm as a function of x.
Materials 12 03516 g004
Figure 5. Absorption spectra of the heat-treated glasses: (a) Ag2, (b) Ag4, and (c) Ag6.
Materials 12 03516 g005
Figure 6. Elemental mapping of Ag in Ag2 (a) prior to and (b) and after heat treatment at the surface of samples.
Materials 12 03516 g006
Figure 7. Ag concentration profile measured from the surface of the heat-treated glasses.
Materials 12 03516 g007
Figure 8. Normalized visible photoluminescence (PL) spectra of Ag2 glasses taken as an example.
Materials 12 03516 g008
Figure 9. Variation of 1.53 μm band peak emission intensity.
Materials 12 03516 g009
Table 1. Thermal properties and density of the glasses.
SampleTg ± 3 °CTx ± 3 °CTp ± 3 °CΔT = Tx − Tg ± 6 °Cρ (±0.02 g/cm3)Vm (mol·cm3)
Ag0297390457952.6736.75
Ag2290343375532.7536.67
Ag4285345384602.8436.46
Ag6280340392602.9336.27
Table 2. FTIR bands attribution.
Wavenumber (cm−1)AttributionReference
770νs(P-O-P) of Q2 units[24]
875νas(P-O-P) of Q2 units in chain[24]
960νas(P-O-P) of Q2 units in small rings[25,26]
980νs(PO32−) in Q1 units[27]
1015νs(PO3F) bonds[28]
1020νas(P-O-P) of Q2 units in large rings[25,26]
1085νas(P-O-P) of Q1 units
vs(P-O-P) of Q2 units
[29]
1183νas(P-O-P) in Q2 units[27]
1255νas(O-P-O) of Q2 units[25]
ν(P-O-P) are the phosphorus-oxygen-phosphorus fundamental vibrations.
Table 3. Judd-Ofelt parameters Ωi (i = 2, 4, and 6), spectroscopic quality factor (χ), and root-mean-square deviation (ΔSrms) of Ag/Er3+-doped glasses.
SampleΩ2 (10−20 cm2)Ω4 (10−20 cm2)Ω6 (10−20 cm2)χΔSrms (10−22)
Ag03.410.811.080.750.09
Ag23.500.721.020.700.08
Ag43.620.660.970.680.08
Ag63.650.600.910.650.19
Phosphate [31]3.891.010.551.83-
Fluoro-phosphate [32]4.901.371.271.08-
Fluoride [33]2.911.271.111.14-
Table 4. Calculated radiative parameters of Ag/Er3+ co-doped glasses.
Sample CodeAg0Ag2Ag4Ag6ZnO-AlF3 [38]PKAZFEr10 [39]SAMEA0.9 [40]
4I13/24I15/2A (s−1)209.04220.25220.11219.73148177.18485
βJJ’ (%)1.001.001.001.001.001.001.00
τ (ms)2.092.202.202.196.795.642.61
4I11/24I15/2A (s−1)210.87226.79220.89219.21174.25206.09137
βJJ’ (%)0.830.840.830.830.890.860.84
τ (ms)2.512.692.632.615.084.166.14
4I9/24I15/2A (s−1)154.01142.55145.86143.06-83.46183
βJJ’ (%)0.660.630.640.64-0.530.89
τ (ms)2.302.242.232.25-6.404.83
Table 5. Er3+:I13/2 measured lifetime (τm) values of the investigated glasses (±0.1 ms).
Measured Lifetimes
Sample As-PreparedHeat-TreatedHeat-Treated After Polishing
Ag01.3--
Ag21.71.91.7
Ag41.71.81.6
Ag61.51.21.5
Table 6. Optical properties of as-prepared glasses.
Glass SampleEr3+
(1020 ions cm−3)
±5%
α at 1.5 μm (cm−1)Δλeff (nm)σa at 1.5 μm
(10−21 cm2)
±10%
σe at 1.5 μm
(10−21 cm2)
±10%
FWHM
(nm)
σe*FWHM
(10−21·nm)
G
(P = 1)
(cm−1)
Ag03.2771.759375.574.6136165.971.51
Ag23.2841.902575.975.0241205.821.66
Ag43.3031.829575.744.8637179.821.61
Ag63.3201.750565.464.6937173.531.56
FWHM: full-width at half-maximum.

