Temperature Monitoring and Material Flow Characteristics of Friction Stir Welded 2A14-t6 Aerospace Aluminum Alloy


Abstract
1. Introduction
2. Finite Element Model
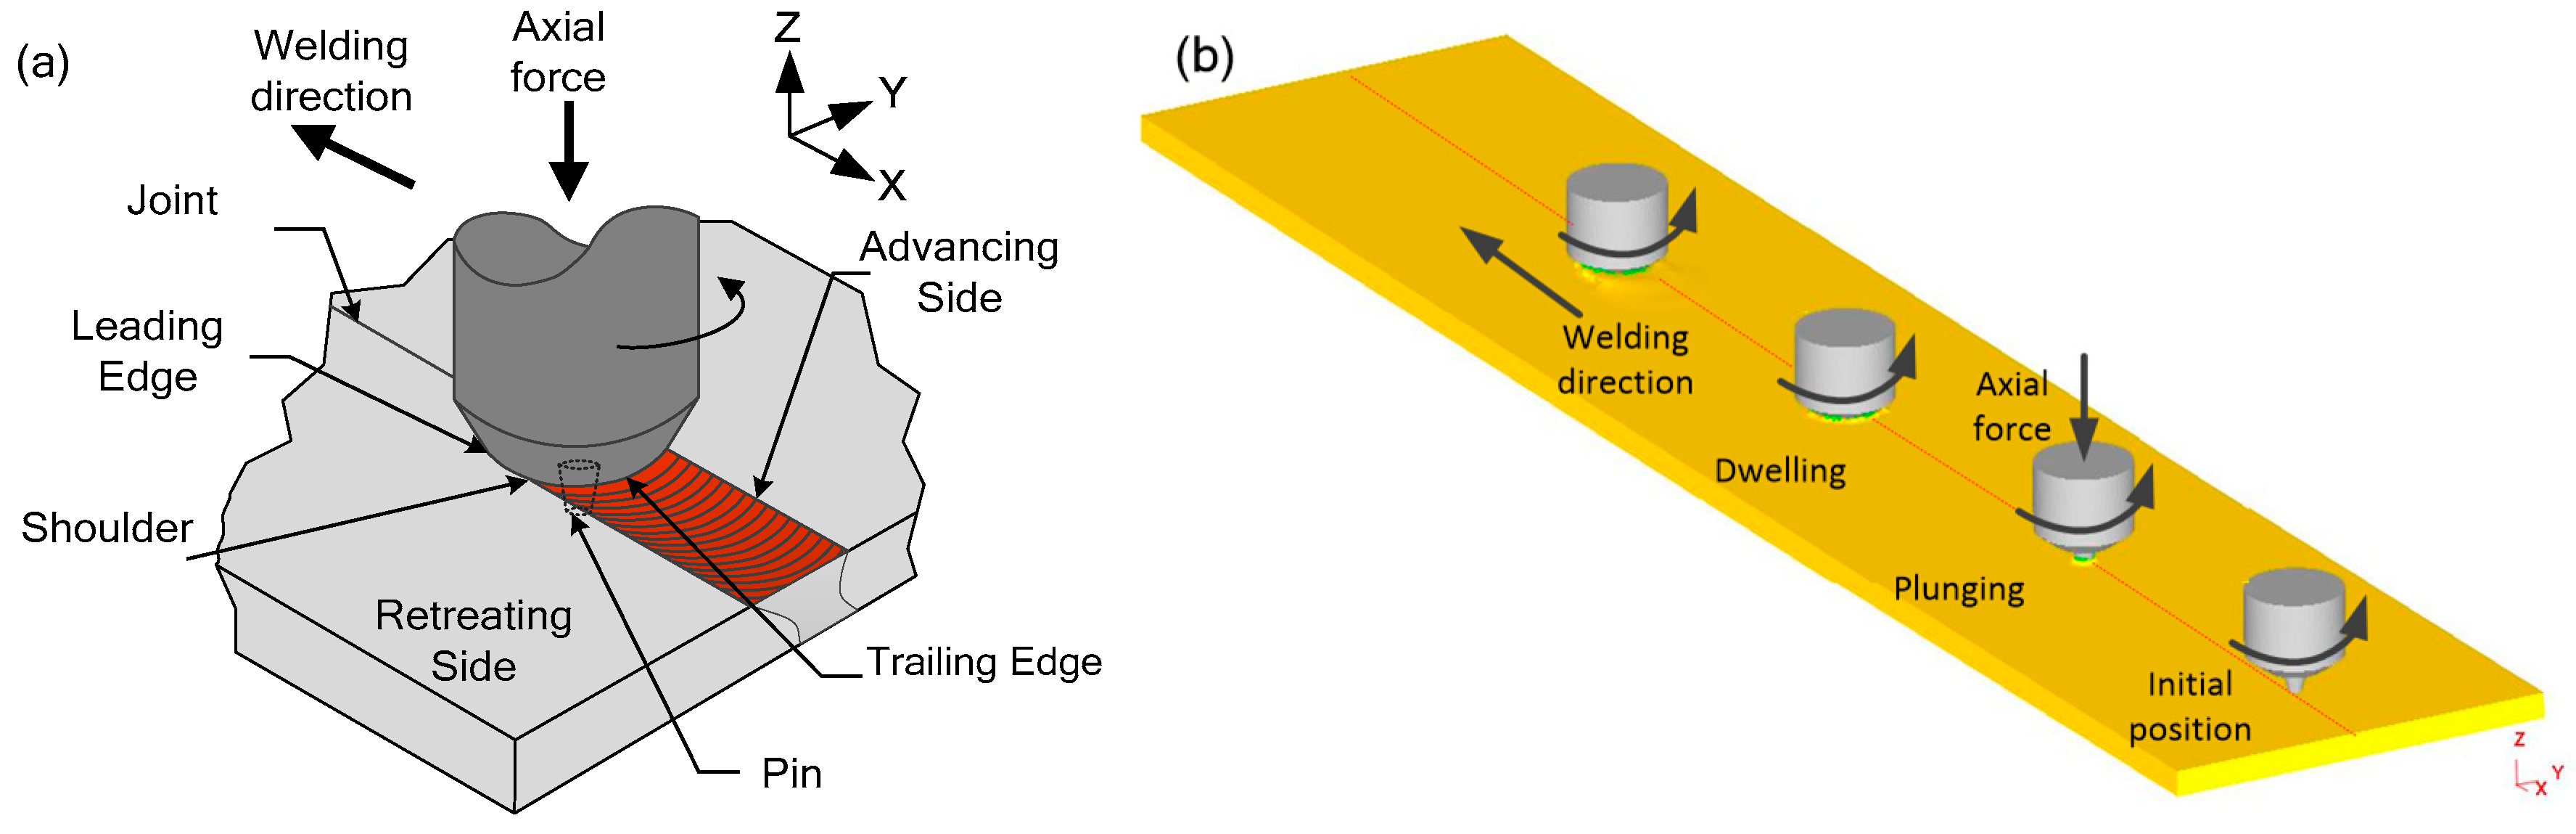
2.1. Geometric Model and Boundary Conditions
2.2. Material Model
2.3. Thermal Model
2.4. Friction Model
2.5. Governing equations
2.6. Dislocation Density Model
3. Test and Monitoring Methods
3.1. Test Process
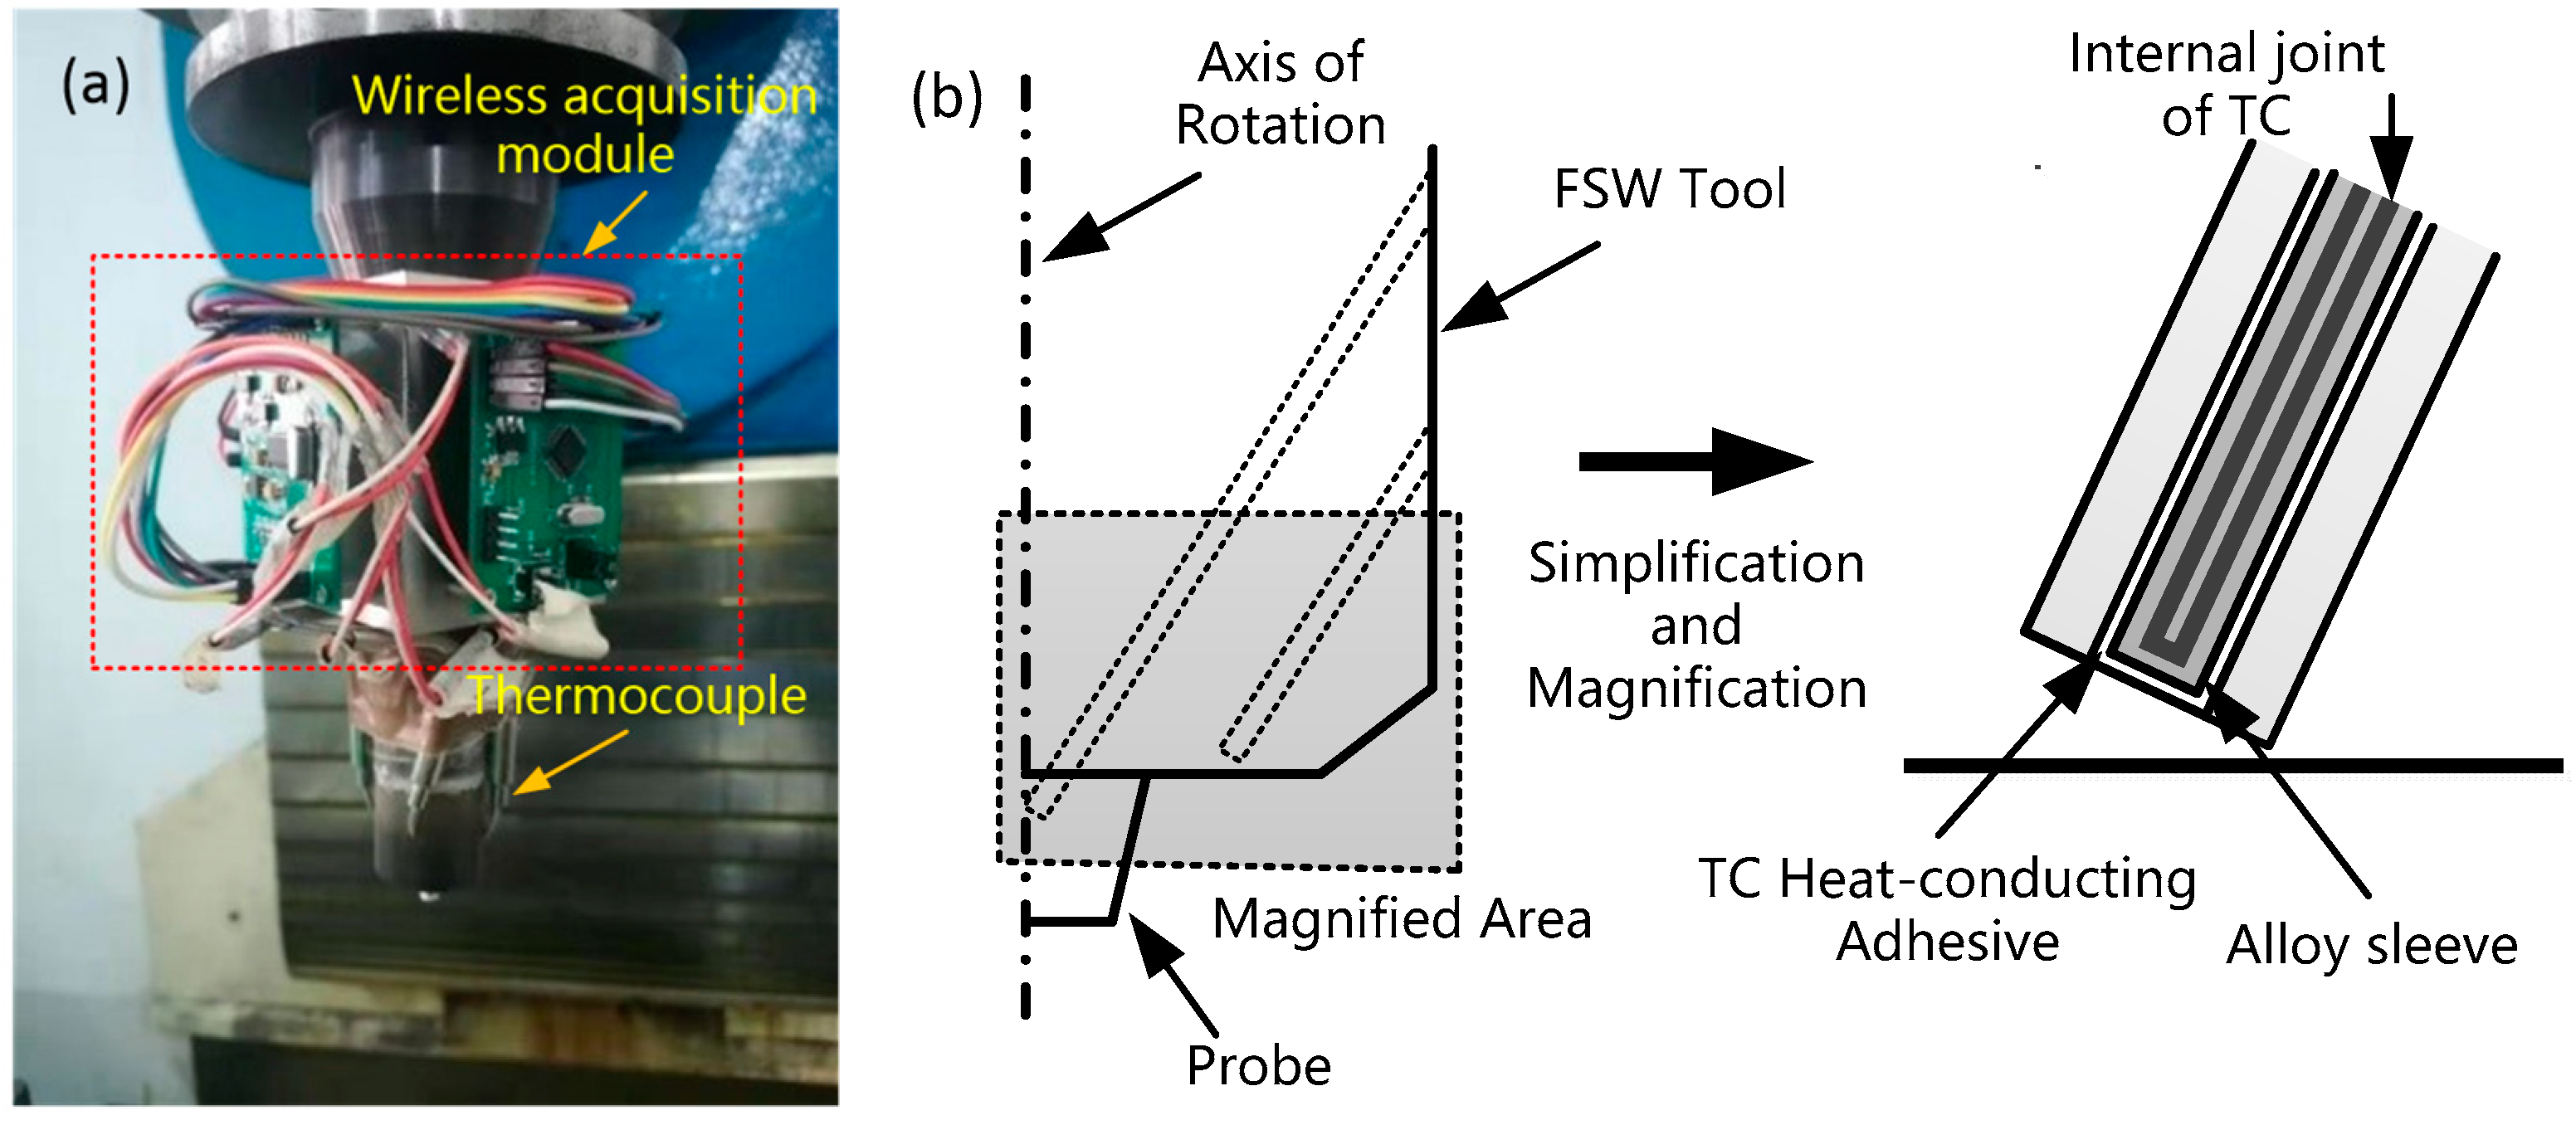
3.2. Temperature Monitoring Method in the Welding Zone
3.3. Workpiece Temperature Test Method
4. Results and discussion
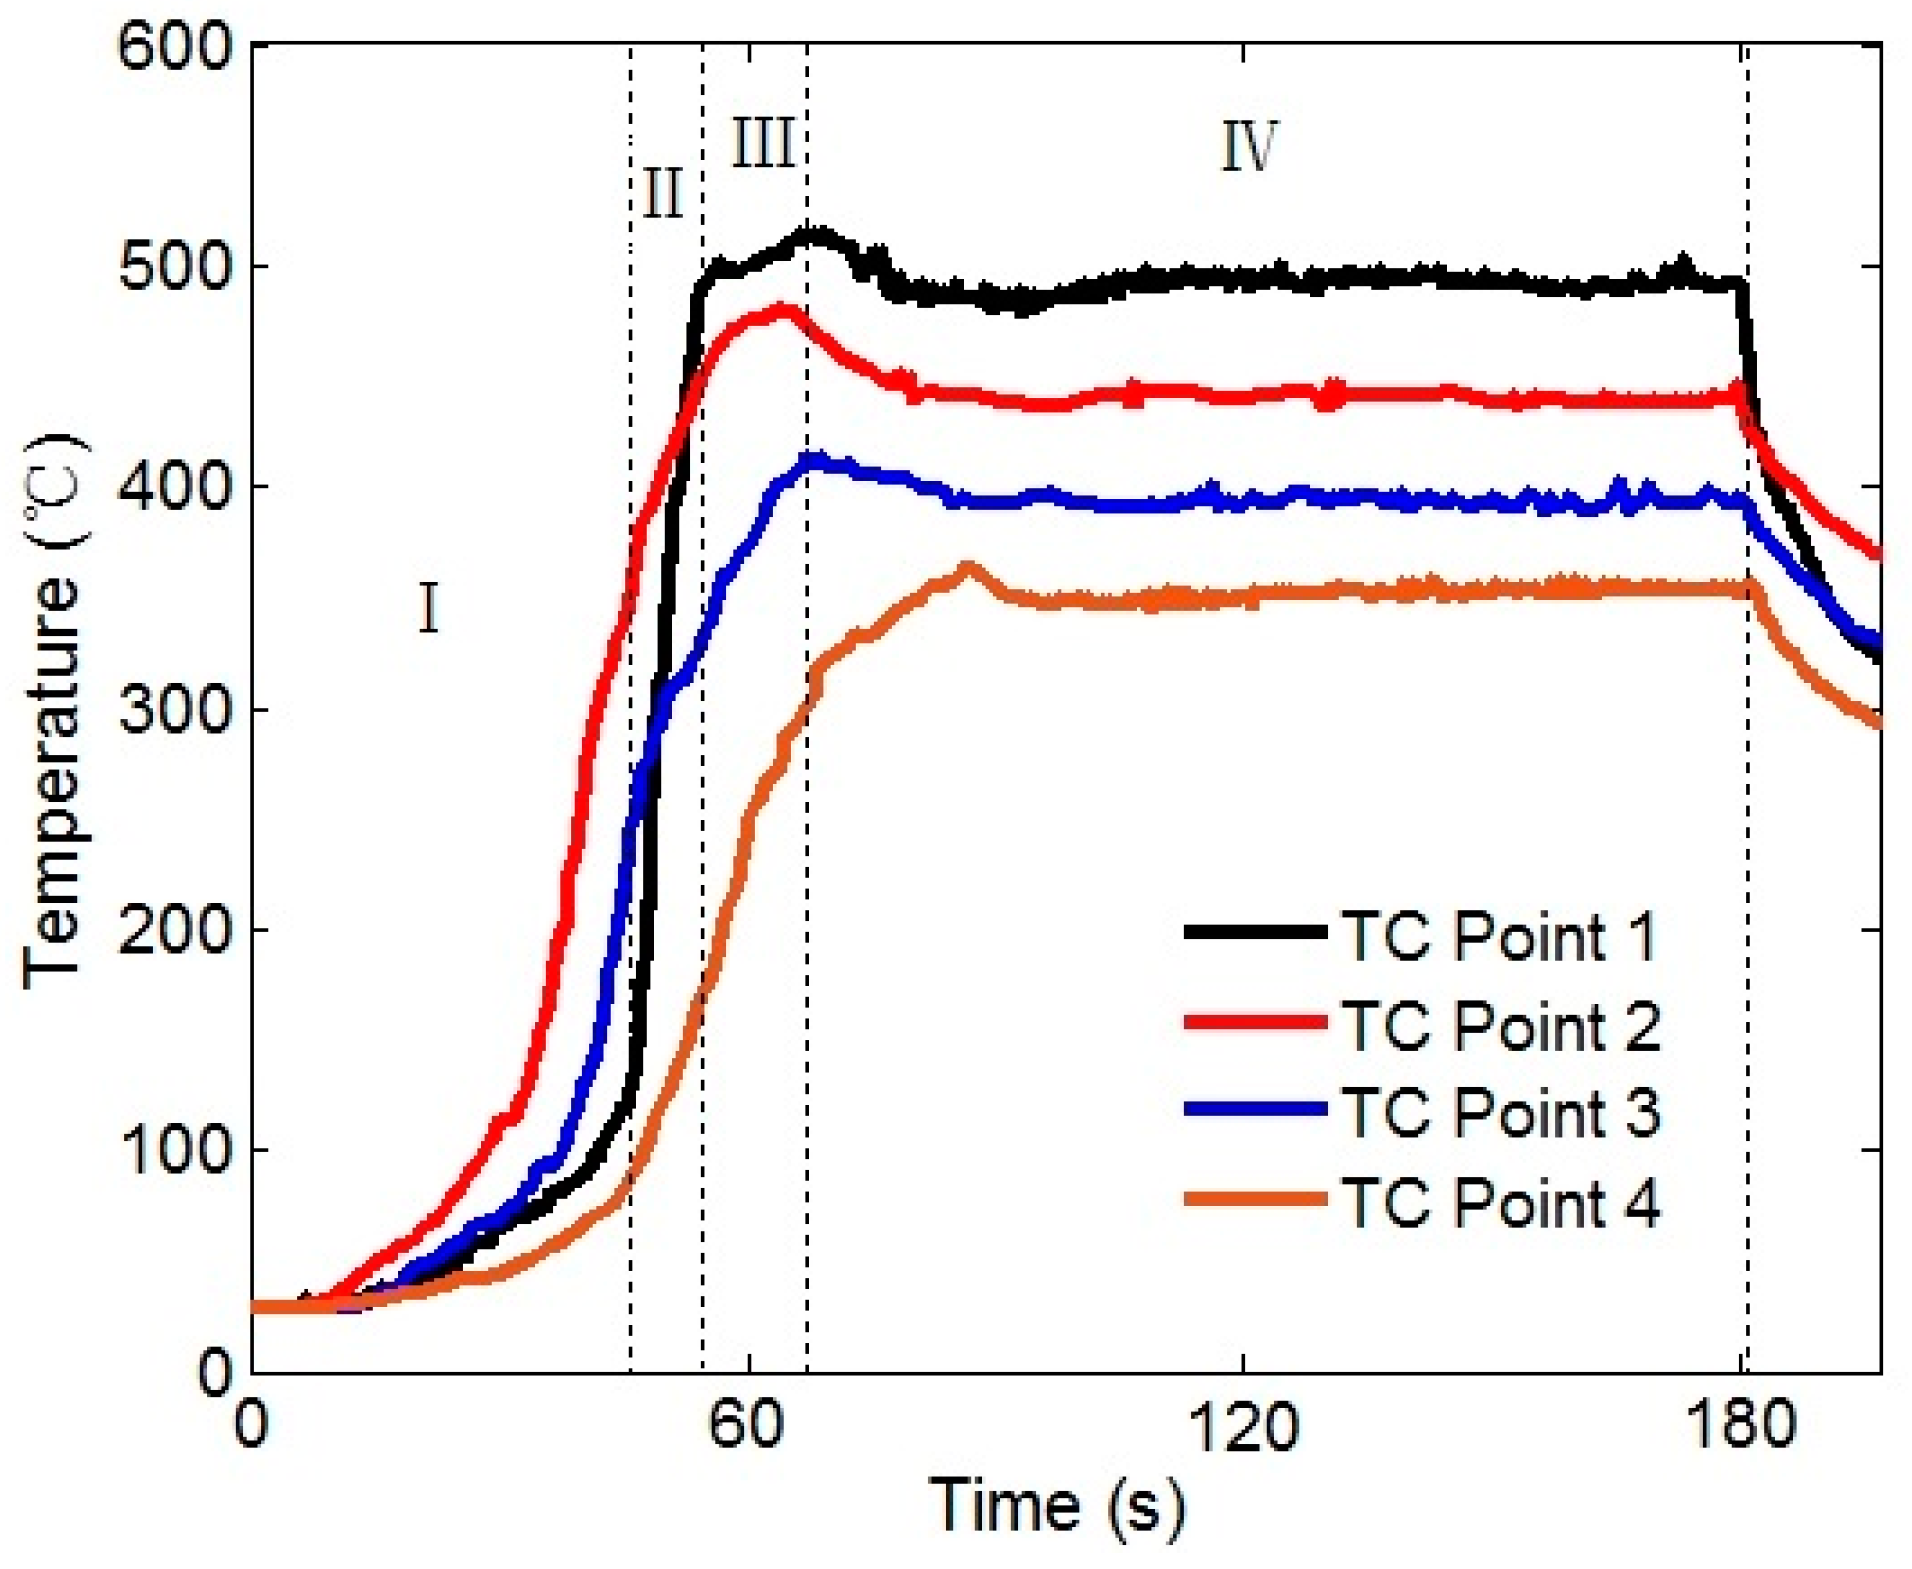
4.1. Temperature Monitoring Results in the Welding Zone
4.2. Temperature Test Results of the Workpiece
4.3. Axial Force and Torque
4.4. Numerical Simulation of Material Flow
4.5. Effective Strain in the Welding Zone
4.6. Material Flow Model
5. Conclusions
- (1)
- The wireless temperature measurement system can effectively capture the dynamic change of temperature in friction stir welding process. The temperature of the shoulder is always higher than that of the tool pin in the steady welding stage, and the temperature rise rate of the tool pin is higher than that of the shoulder in the initial plunging stage. However, when the shoulder contacts the material, the shoulder temperature eventually exceeds the tool pin temperature. The average temperature on the advancing side is 19 °C higher than that on the retreating side in the welding process;
- (2)
- When the spindle speed rises from 500 rpm to 1300 rpm, the axial force decreases by 4163 N and the torque decreases by 15.2 N-m. As the temperature rises, the deformation resistance decreases, while the axial force and torque decrease. However, when the spindle speed increases from 900 rpm to 1300 rpm, the decreasing speed of the axial force and torque decreases. The validity of the finite element model is verified by comparing the experimental data with the numerical simulation data.
- (3)
- Through the verified finite element model, the flow law of material was studied. The numerical simulation shows that the particles in the lower part of the tool pin tend to spiral upward along the tool pin. Some of the TMAZ zone particles are dragged to the PSZ zone. The shoulder has a certain plunging effect on the material, which is also the key to the formation of the weld.
- (4)
- The effective strain on the advancing side is significantly higher than that on the retreating side. However, the effective strain reflects the action strength between the stirring tool and the material, thus indicates that the flow strength of material on the advancing side is greater than that on the retreating side.
- (5)
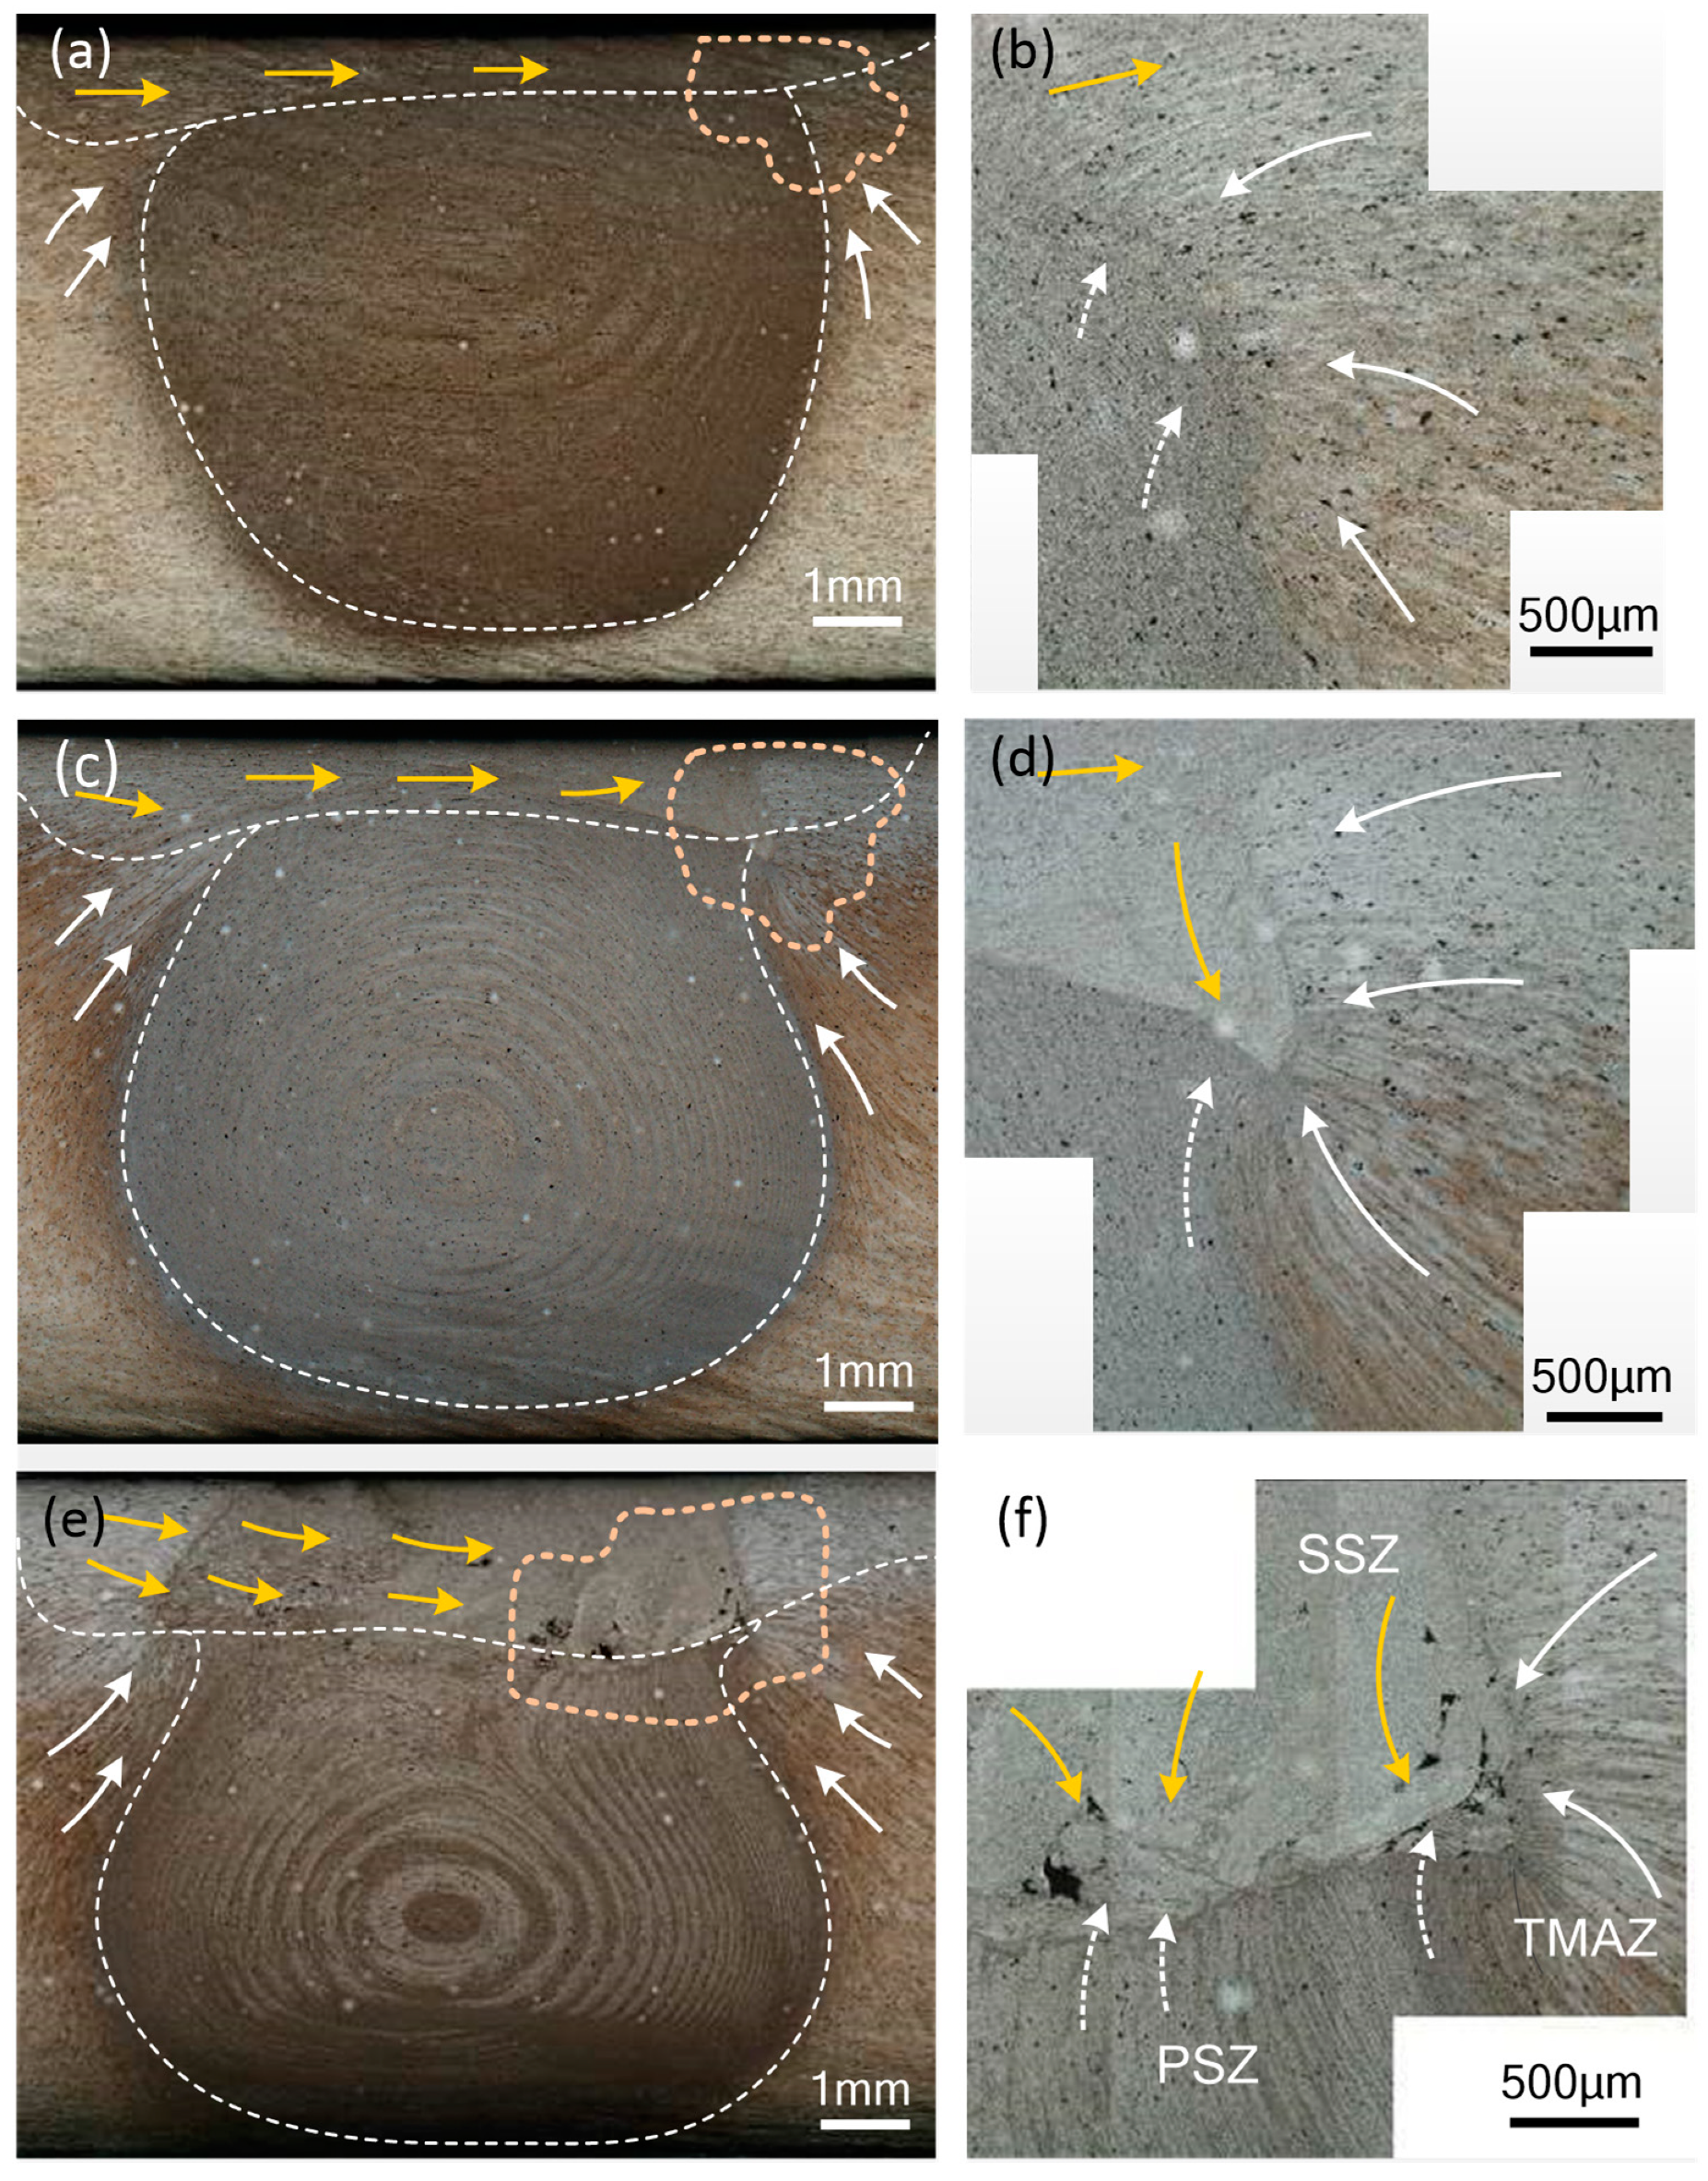
- When high-rotation speeds (HRS) are chosen, the material beneath the tool shoulder tends to be extruded into the pin stirred zone (PSZ) after flowing back to the advancing side. This will cause turbulence phenomenon in the advancing side of the joint, which will easily lead to the formation of welding defects. In the future, temperature monitoring methods and material flow model can be used to optimize the welding parameters.
Author Contributions
Funding
Conflicts of Interest
References
- Thomas, W.M.; Nicholas, E.D.; Needham, J.C.; Murch, M.G.; Temple-Smith, P.; Dawes, C.J. Friction Stir Butt Welding. International Patent Application No. PCT/GB9202203, 6 December 1991. [Google Scholar]
- Lambiase, F.; Paoletti, A.; Grossi, V. Analysis of loads, temperatures and welds morphology in FSW of polycarbonate. J. Mater. Process. Technol. 2019, 266, 639–650. [Google Scholar] [CrossRef]
- Simoes, F.; Rodrigues, D.M. Material flow and thermo-mechanical conditions during Friction Stir Welding of polymers: Literature review, experimental results and empirical analysis. Mater. Des. 2014, 59, 344–351. [Google Scholar] [CrossRef]
- Cetkin, E.; Celik, Y.H.; Temiz, S. Microstructure and mechanical properties of AA7075/AA5182 jointed by FSW. J. Mater. Process. Technol. 2019, 268, 107–116. [Google Scholar] [CrossRef]
- Dialami, N.; Chiumenti, M.; Cervera, M.; Segatori, A. Enhanced friction model for Friction Stir Welding (FSW) analysis: Simulation and experimental validation. Int. J. Mech. Sci. 2017, 133, 555–567. [Google Scholar] [CrossRef]
- Schmale, J.; Fehrenbacher, A.; Shrivastava, A. Calibration of Dynamic Tool-Workpiece Interface Temperature Measurement during Friction Stir Welding. Measurement 2016, 88, 331–342. [Google Scholar] [CrossRef]
- Shibayanagi, T.; Maeda, M. Microstructure and its stability at elevated temperature in friction stir seam welded dissimilar joints of 5083 and 6061 aluminium alloy plates. Weld. Int. 2008, 22, 686–692. [Google Scholar] [CrossRef]
- Long, T.; Reynolds, A.P. Parametric studies of friction stir welding by commercial fluid dynamics simulation. Sci. Technol. Weld. Join. 2013, 11, 200–208. [Google Scholar] [CrossRef]
- Chao, Y.J.; Qi, X. Thermal and thermo-mechanical modeling of friction stir welding of aluminum alloy 6061-T6. J. Mater. Process. Manuf. Sci. 1998, 7, 215–233. [Google Scholar] [CrossRef]
- Miyake, Y.; Miyasaka, F.; Matsuzawa, S.; Murao, S.; Mitsufuji, K. Development of FSW Simulation Model-Effect of Tool Shape on Plastic Flow. In Friction Stir Welding and Processing VIII; Springer: Cham, Switzerland, 2015; Volume 5, pp. 281–288. [Google Scholar]
- Liu, F.C.; Nelson, T.W. In-situ material flow pattern around probe during friction stir welding of austenitic stainless steel. Mater. Des. 2016, 110, 354–364. [Google Scholar] [CrossRef]
- Hasan, A.F.; Bennett, C.J.; Shipway, P.H. A numerical comparison of the flow behaviour in Friction Stir Welding (FSW) using unworn and worn tool geometries. Mater. Des. 2015, 87, 1037–1046. [Google Scholar] [CrossRef]
- Sharghi, E.; Farzadi, A. Simulation of strain rate, material flow, and nugget shape during dissimilar friction stir welding of AA6061 aluminum alloy and Al-Mg2Si composite. J. Alloys Compd. 2018, 748, 953–960. [Google Scholar] [CrossRef]
- Shi, L.; Wu, C.S. Transient model of heat transfer and material flow at different stages of friction stir welding process. J. Manuf. Process. 2017, 25, 323–339. [Google Scholar] [CrossRef]
- Reynolds, A.P. Flow visualization and simulation in FSW. Scr. Mater. 2008, 58, 338–342. [Google Scholar] [CrossRef]
- Mishra, R.S.; Ma, Z.Y. Friction stir welding and processing. Mater. Sci. Eng. R Rep. 2005, 50, 1–78. [Google Scholar] [CrossRef]
- Colligan, K. Material flow behavior during friction stir welding of aluminum. Weld. J. 1999, 78, 229–237. [Google Scholar]
- Arbegast, W.J. A flow-partitioned deformation zone model for defect formation during friction stir welding. Scr. Mater. 2008, 58, 372–376. [Google Scholar] [CrossRef]
- Ouyang, J.H.; Kovacevic, R. Material flow and microstructure in the friction stir butt welds of the same and dissimilar aluminum alloys. J. Mater. Eng. Perform. 2002, 11, 51–63. [Google Scholar] [CrossRef]
- Lee, W.B.; Yeon, Y.M.; Jung, S.B. The joint properties of dissimilar formed Al alloys by friction stir welding according to the fixed location of materials. Scr. Mater. 2003, 49, 423–428. [Google Scholar] [CrossRef]
- Krishnan, K.N. On the formation of onion rings in friction stir welds. Mater. Sci. Eng. A 2002, 327, 246–251. [Google Scholar] [CrossRef]
- Sutton, M.A.; Yang, B.; Reynolds, A.P.; Taylor, R. Microstructural studies of friction stir welds in 2024-T3 aluminum. Mater. Sci. Eng. A 2002, 323, 160–166. [Google Scholar] [CrossRef]
- Schneider, J.A.; Nunes, A.C. Thermo-mechanical processing in friction stir welds. In Proceedings of the FSW 2003, 132nd Annual Meeting and Exhibition, San Diego, CA, USA, 2–6 March 2003; pp. 43–51. [Google Scholar]
- Colegrove, P.A.; Shercliff, H.R. 3-Dimensional CFD modelling of flow round a threaded friction stir welding tool profile. J. Mater. Process. Technol. 2005, 169, 320–327. [Google Scholar] [CrossRef]
- Guerdoux, S.; Fourment, L. A 3D numerical simulation of different phases of friction stir welding. Model. Simul. Mater. Sci. Eng. 2009, 17, 1–33. [Google Scholar] [CrossRef]
- Zhu, Z.; Wang, M.; Zhang, H.; Zhang, X.; Yu, T.; Wu, Z. A finite element model to simulate defect formation during friction stir welding. Metals 2017, 7, 256. [Google Scholar] [CrossRef]
- Hossfeld, M. A fully coupled thermomechanical 3D model for all phases of friction stir welding. In Proceedings of the International Symposium on Friction Stir Welding, Cambridge, UK, 19–21 May 2016. [Google Scholar]
- Fraser, K.A.; Laszlo, I.K.; St-Georges, L.; Drolet, D. Optimization of Friction Stir Weld Joint Quality Using a Meshfree Fully-Coupled Thermo-Mechanics Approach. Metals 2018, 8, 101. [Google Scholar] [CrossRef]
- Schmidt, H.; Hattel, J. A local model for the thermomechanical conditions in friction stir welding. Model. Simul. Mater. Sci. Eng. 2005, 13, 77–93. [Google Scholar] [CrossRef]
- Fraser, K.A.; St-Georges, L.; Kiss, L. Optimization of Friction Stir Welding Tool Advance Speed via Monte-Carlo Simulation of the Friction Stir Welding Process. Materials 2014, 7, 3435–3452. [Google Scholar] [CrossRef] [PubMed]
- Hossfeld, M.; Roos, E. A new approach to modelling friction stir welding using the cel method. Adv. Manuf. Eng. Technol. 2013, 2, 179–190. [Google Scholar]
- Liu, F.C.; Hovanski, Y.; Miles, M.P.; Sorensen, C.D.; Nelson, T.W. A review of friction stir welding of steels: Tool, material flow, microstructure, and properties. J. Mater. Sci. Technol. 2018, 34, 9–57. [Google Scholar] [CrossRef]
- Kadian, A.K.; Pankaj Biswas, P. Effect of tool pin profile on the material flow characteristics of AA6061. J. Manuf. Process. 2017, 26, 382–392. [Google Scholar] [CrossRef]
- Simar, A.; Brechet, Y.; Meester, B.; Denquin, A.; Pardoen, T. Microstructure, local and global mechanical properties of friction stir welds in aluminium alloy 6005A-T6. Mater. Sci. Eng. A 2008, 486, 85–95. [Google Scholar] [CrossRef]
- Huang, Y.X.; Huang, T.F.; Wan, L.; Meng, X.C.; Zhou, L. Material flow and mechanical properties of aluminum-to-steel self-riveting friction stir lap joints. J. Manuf. Process. 2019, 263, 129–137. [Google Scholar] [CrossRef]
- Tutunchilar, S.; Haghpanahi, M.; Besharati, G.; Asadi, P.; Bahemmat, P. Simulation of material flow in friction stir processing of a cast Al–Si alloy. Mater. Des. 2012, 40, 15–26. [Google Scholar] [CrossRef]
- Heinemann, H.H. Flow Stress of Different Aluminum and Copper Alloys for High Strain Rates and Temperature. Ph.D. Thesis, TH Aachen, Aachen, Germany, 1961. [Google Scholar]
- Jain, R.; Pal, S.K.; Singh, S.B. A study on the variation of forces and temperature in a friction stir welding process: A finite element approach. J. Manuf. Process. 2016, 23, 278–286. [Google Scholar] [CrossRef]
- Buffa, G.; Hua, J.; Shivpuri, R.; Fratini, L. A continuum based FEM model for friction stir welding-model development. Mater. Sci. Eng. A 2006, 419, 389–396. [Google Scholar] [CrossRef]
- Assidi, M.; Fourment, L.; Guerdoux, S.; Nelson, T. Friction model for fric-tion stir welding process simulation: Calibrations from welding experi-ments. Int. J. Mach. Tools Manuf. 2010, 50, 143–155. [Google Scholar] [CrossRef]
- Nandan, R.; Roy, G.G.; Lienert, T.J.; Debroy, T. Three-dimensional heat and materialflow during friction stir welding of mild steel. Acta Mater. 2007, 55, 83–95. [Google Scholar] [CrossRef]
- Asadi, P.; Mahdavinejad, R.A.; Tutunchilar, S. Simulation and experimental inves-tigation of FSP of AZ91 magnesium alloy. Mater. Sci. Eng. A 2011, 528, 69–77. [Google Scholar] [CrossRef]
- Kobayashi, S.; Altan, T. Metal Forming and the Finite Element Method; Oxford Series; Oxford University Press: Oxford, UK, 1989. [Google Scholar]
- DEFORM v11.2 documentation; v11.2; Scientific Forming Technologies Corporation: Columbus, OH, USA, 2017.
- GB/T 3880-1997. Aluminium and Aluminium Alloy Rolled Sheet; Standardization Administration of the People’s Republic of China: Beijing, China, 1998. [Google Scholar]
- Luo, H.T.; Wu, T.K.; Fu, J.; Wang, H.N.; Chen, N.; Wang, H. Welding Characteristics Analysis and Application on Spacecraft of Friction Stir Welded 2A14-T6 Aluminum Alloy. Materials 2019, 12, 480. [Google Scholar] [CrossRef]
- Ghetiya, N.D.; Patel, K.M. Numerical simulation on an effect of backing plates on joint temperature and weld quality in air and immersed FSW of AA2014-T6. Int. J. Adv. Manuf. Technol. 2018, 99, 1937–1951. [Google Scholar] [CrossRef]
- Jain, R.; Pal, S.K.; Singh, S.B. Finite element simulation of pin shape influence on material flow, forces in friction stir welding. Int. J. Adv. Manuf. Technol. 2018, 94, 1781–1797. [Google Scholar] [CrossRef]
- Luo, H.T.; Wu, T.K.; Wang, P.; Zhao, F.Q.; Wang, H.N. Numerical Simulation of Material Flow and Analysis of Welding Characteristics in Friction Stir Welding Process. Metals 2019, 9, 621. [Google Scholar] [CrossRef]


| Properties | AA 2A14-T6 | Tool Steel W6 |
|---|---|---|
| Specific heat capacity () | 2.46 | 3.18 |
| Young’s modulus () | 69,300 | 230,000 |
| Heat expansion coefficient () | 21 | 11.9 |
| Thermal conductivity () | 176 | 30.8 |
| Poisson’s ratio (/) | 0.33 | 0.3 |
| Cu | Si | Mn | Mg | Fe | Zn | Ti | Ni | Al |
|---|---|---|---|---|---|---|---|---|
| 3.9 ~ 4.8 | 0.6 ~ 1.2 | 0.4 ~ 1.0 | 0.4 ~ 0.8 | ≤0.7 | ≤0.3 | ≤0.15 | ≤0.1 | Margin |
© 2019 by the authors. Licensee MDPI, Basel, Switzerland. This article is an open access article distributed under the terms and conditions of the Creative Commons Attribution (CC BY) license (http://creativecommons.org/licenses/by/4.0/).
Share and Cite
Wu, T.; Zhao, F.; Luo, H.; Wang, H.; Li, Y. Temperature Monitoring and Material Flow Characteristics of Friction Stir Welded 2A14-t6 Aerospace Aluminum Alloy. Materials 2019, 12, 3387. https://doi.org/10.3390/ma12203387
Wu T, Zhao F, Luo H, Wang H, Li Y. Temperature Monitoring and Material Flow Characteristics of Friction Stir Welded 2A14-t6 Aerospace Aluminum Alloy. Materials. 2019; 12(20):3387. https://doi.org/10.3390/ma12203387
Chicago/Turabian StyleWu, Tingke, Fengqun Zhao, Haitao Luo, Haonan Wang, and Yuxin Li. 2019. "Temperature Monitoring and Material Flow Characteristics of Friction Stir Welded 2A14-t6 Aerospace Aluminum Alloy" Materials 12, no. 20: 3387. https://doi.org/10.3390/ma12203387
APA StyleWu, T., Zhao, F., Luo, H., Wang, H., & Li, Y. (2019). Temperature Monitoring and Material Flow Characteristics of Friction Stir Welded 2A14-t6 Aerospace Aluminum Alloy. Materials, 12(20), 3387. https://doi.org/10.3390/ma12203387