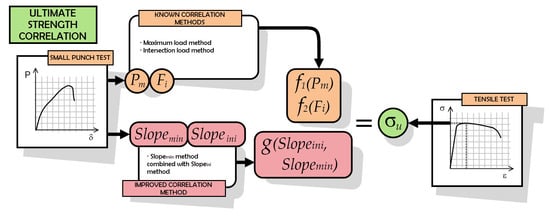
1. Introduction
The Small Punch Test (SPT) was initially developed in the 1980s as a cost-effective method to test post-irradiated materials [
1,
2]. The applicability of this test has been extended to other applications where miniaturization has made it possible to estimate the mechanical properties of small amounts of materials. Widespread and uninterrupted research using the SPT has led to a complete family of methods to characterize mechanical properties such as Young’s modulus, the yield strength and ultimate tensile strength [
3,
4,
5], a ductile–brittle transition [
6], fracture properties [
7,
8,
9,
10], etc. The development of a CEN Code of Practice [
11] and the effort invested to publish an European standard in 2019 [
12] for the application and use of the Small Punch Test method for metallic materials shows the aim to standardize the SPTs performed by each lab, and will lead to the comparability of research in different places and sectors.
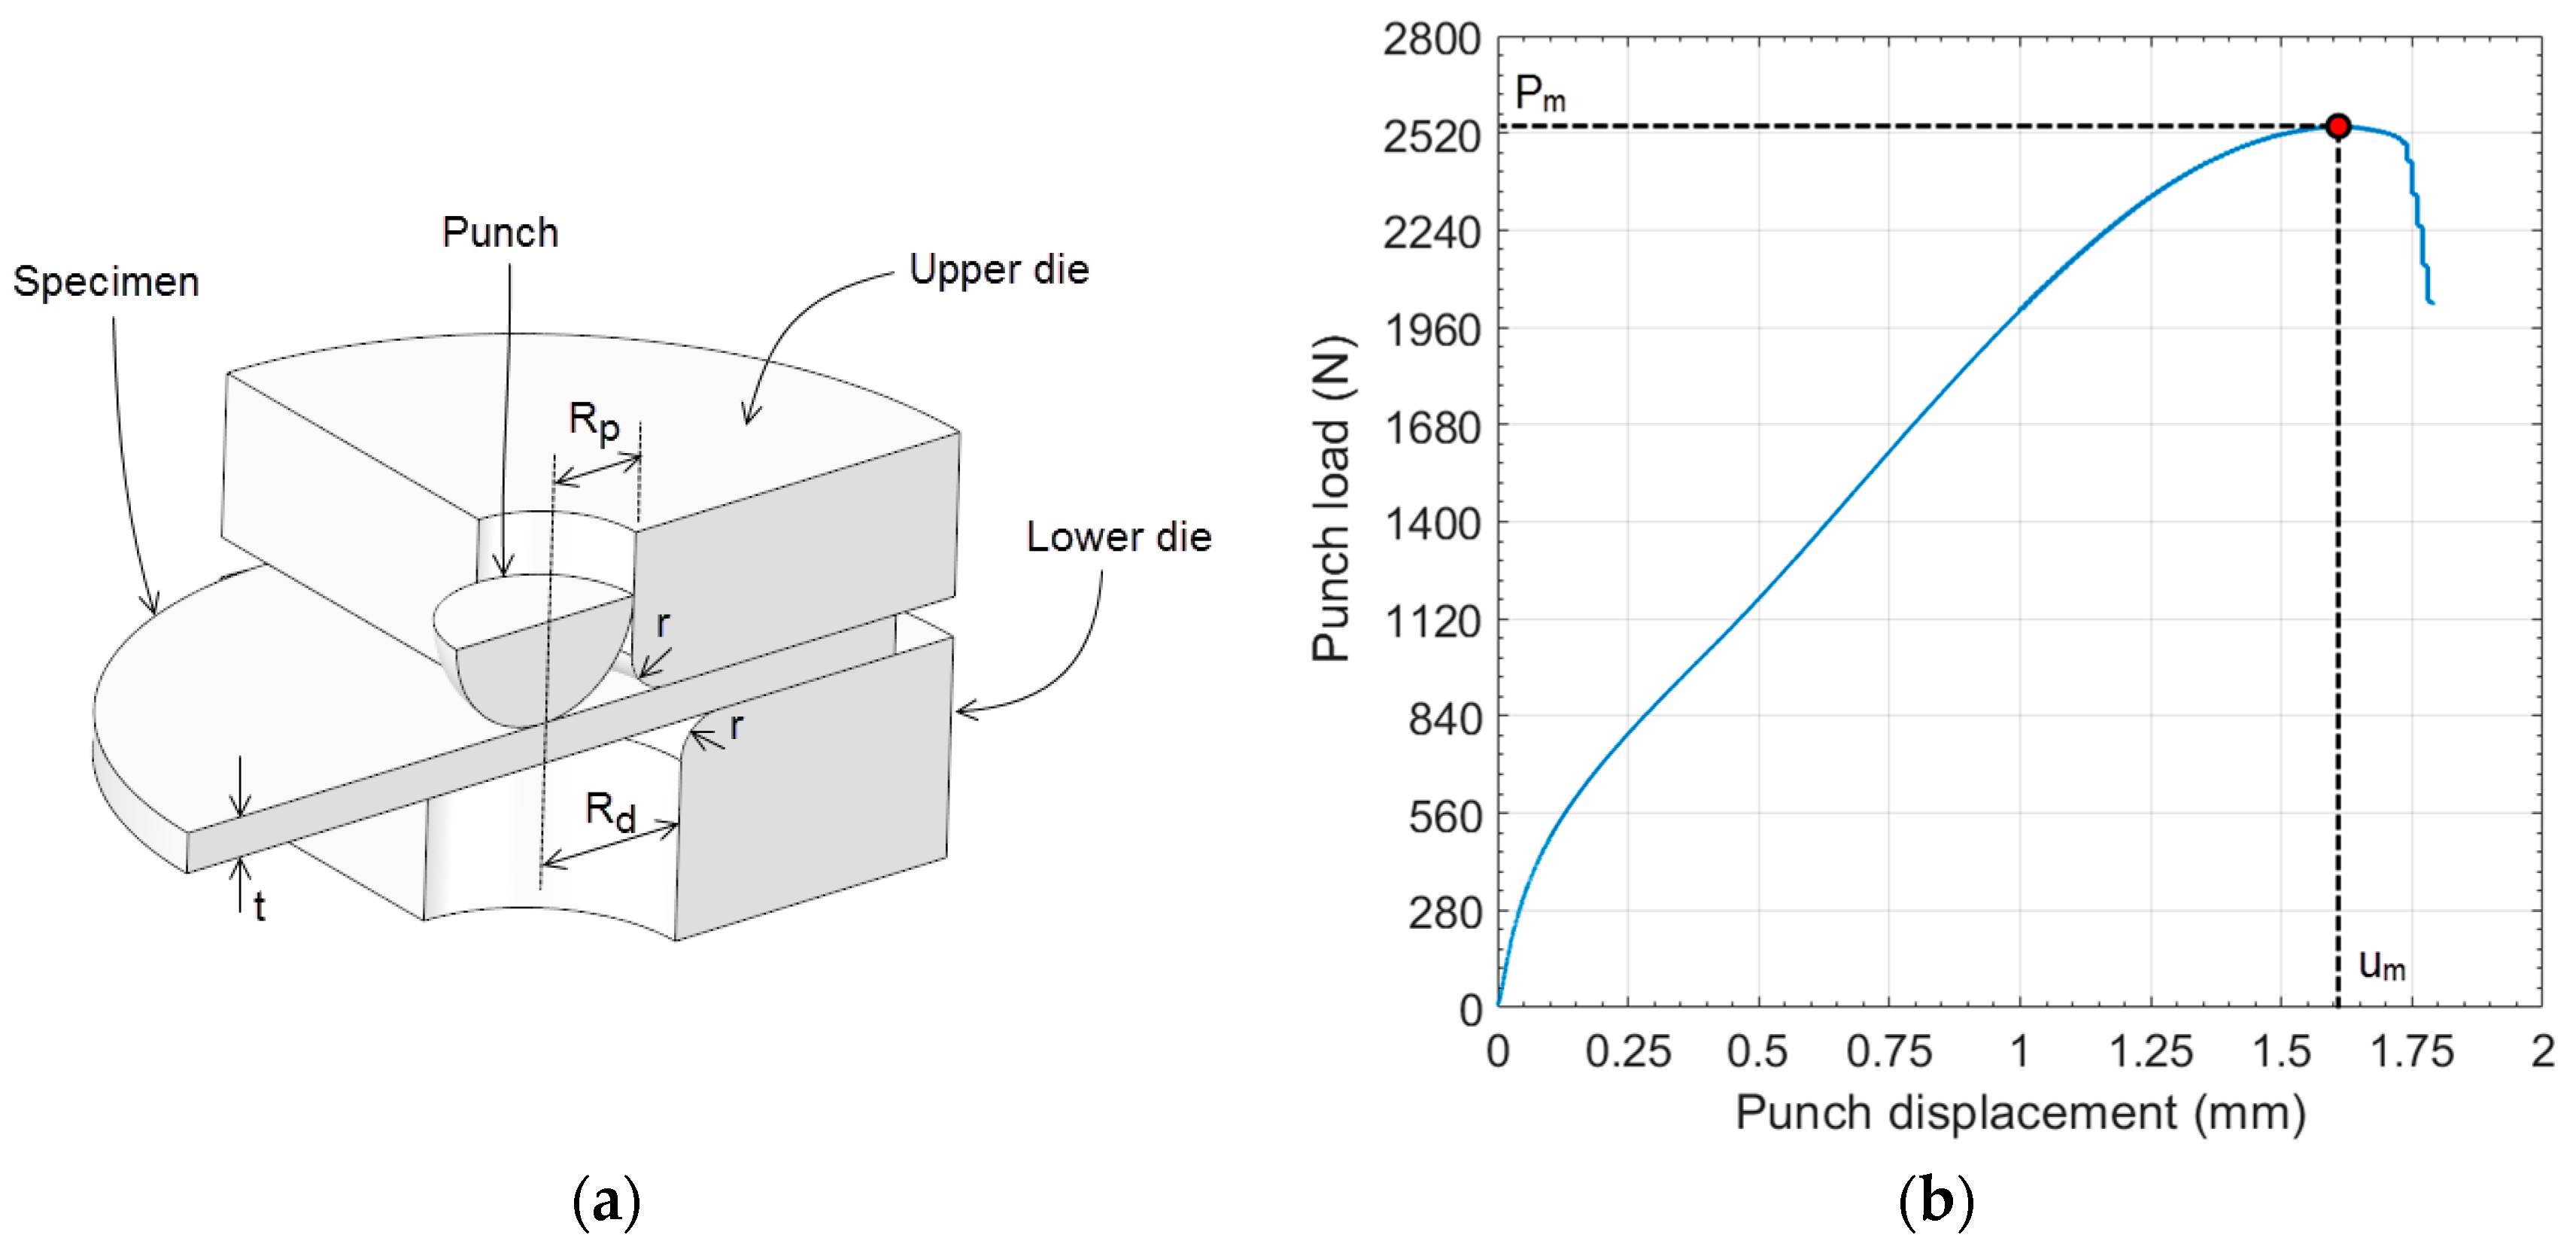
Figure 1 shows a schematic representation of the SPT. A specimen with a thickness of 0.5 mm and a diameter ≥8.0 mm is clamped between two dies and punched until failure with a spherical punch. The main geometry data of the SPT are:
Rp = 1.25 mm,
Rd = 2.0 mm, and
r = 0.5 mm.
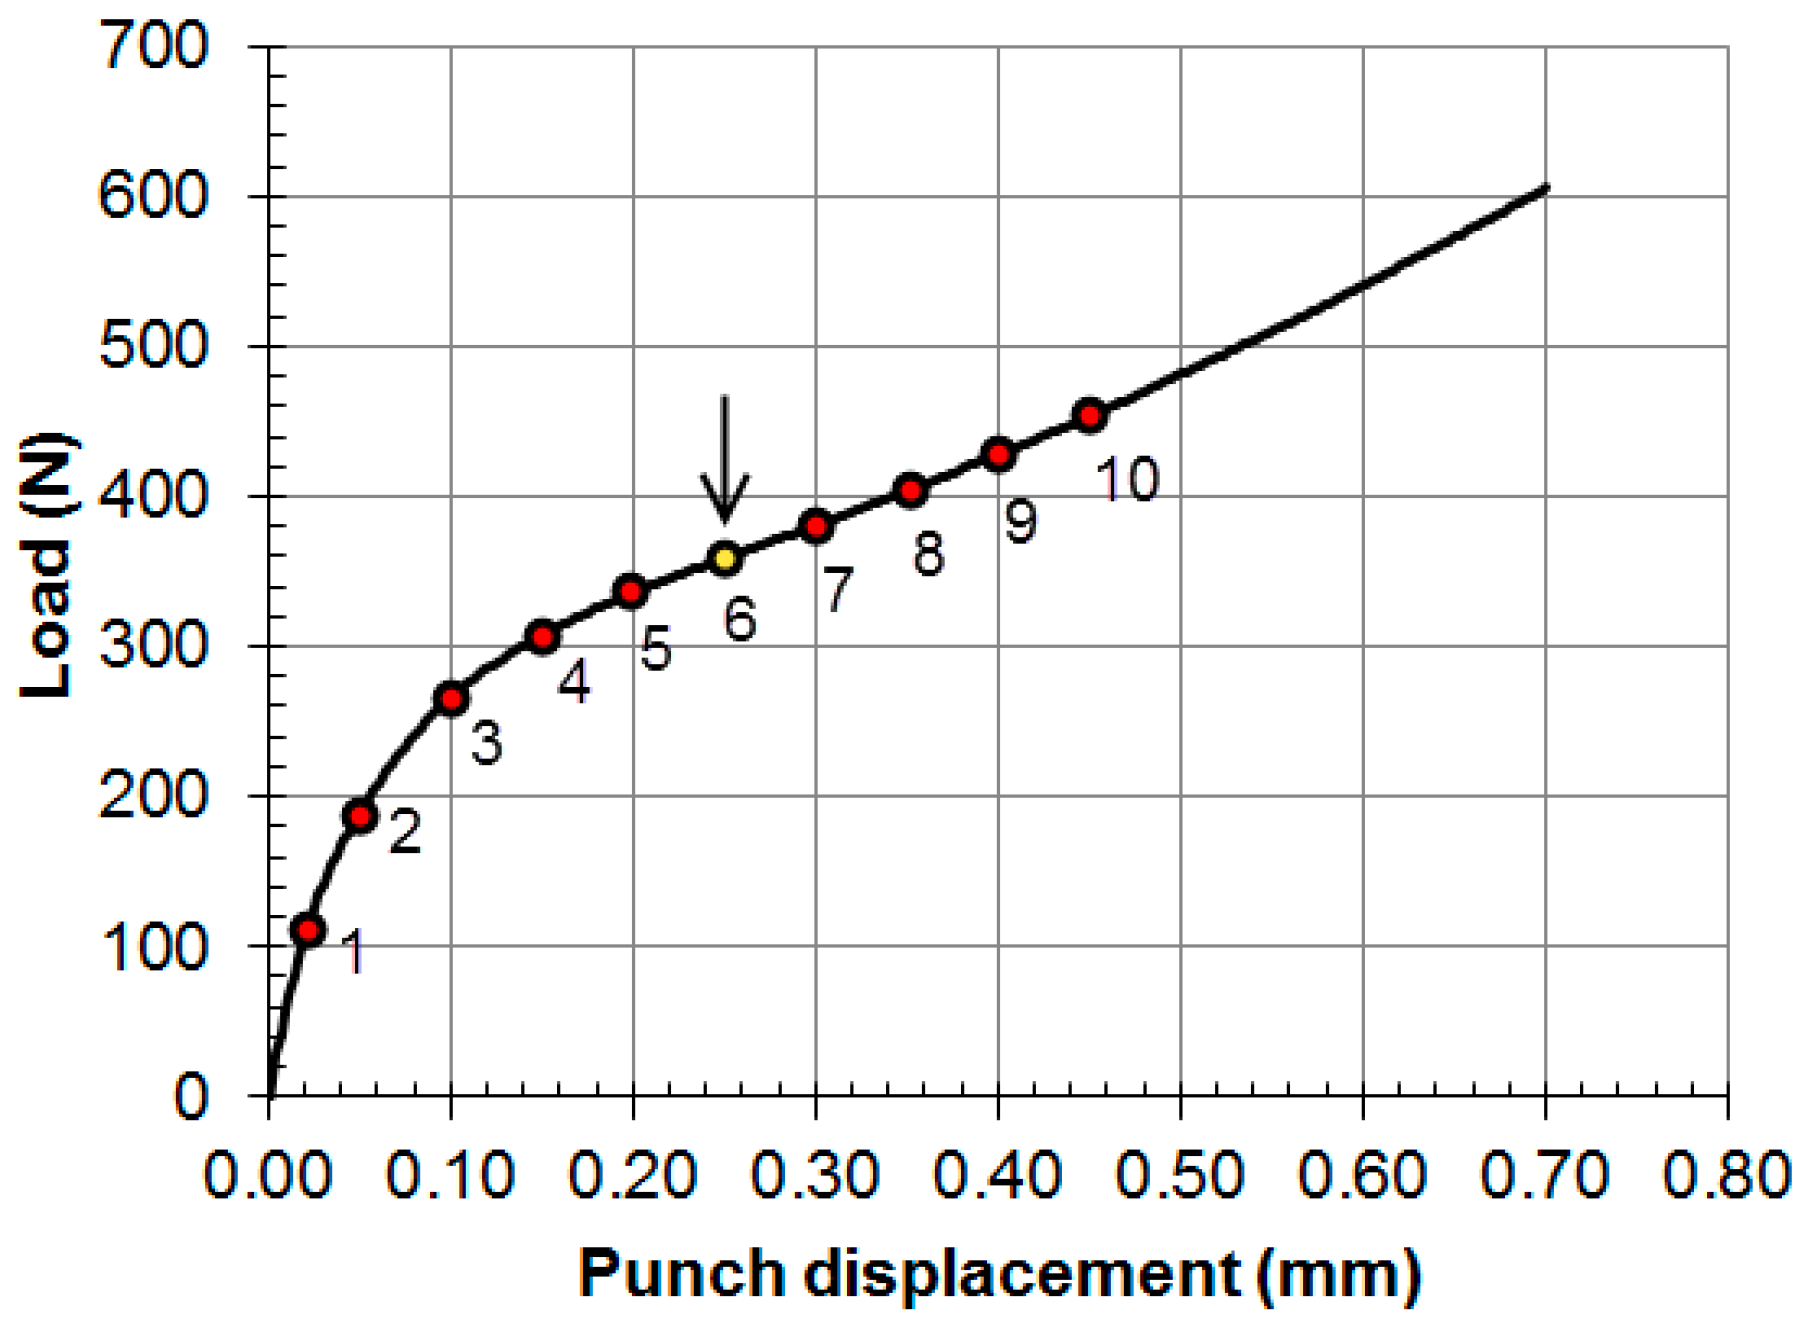
The resulting data recorded during the SPT are the load/displacement curves (see
Figure 1), from which different data are extracted. For the ultimate tensile stress
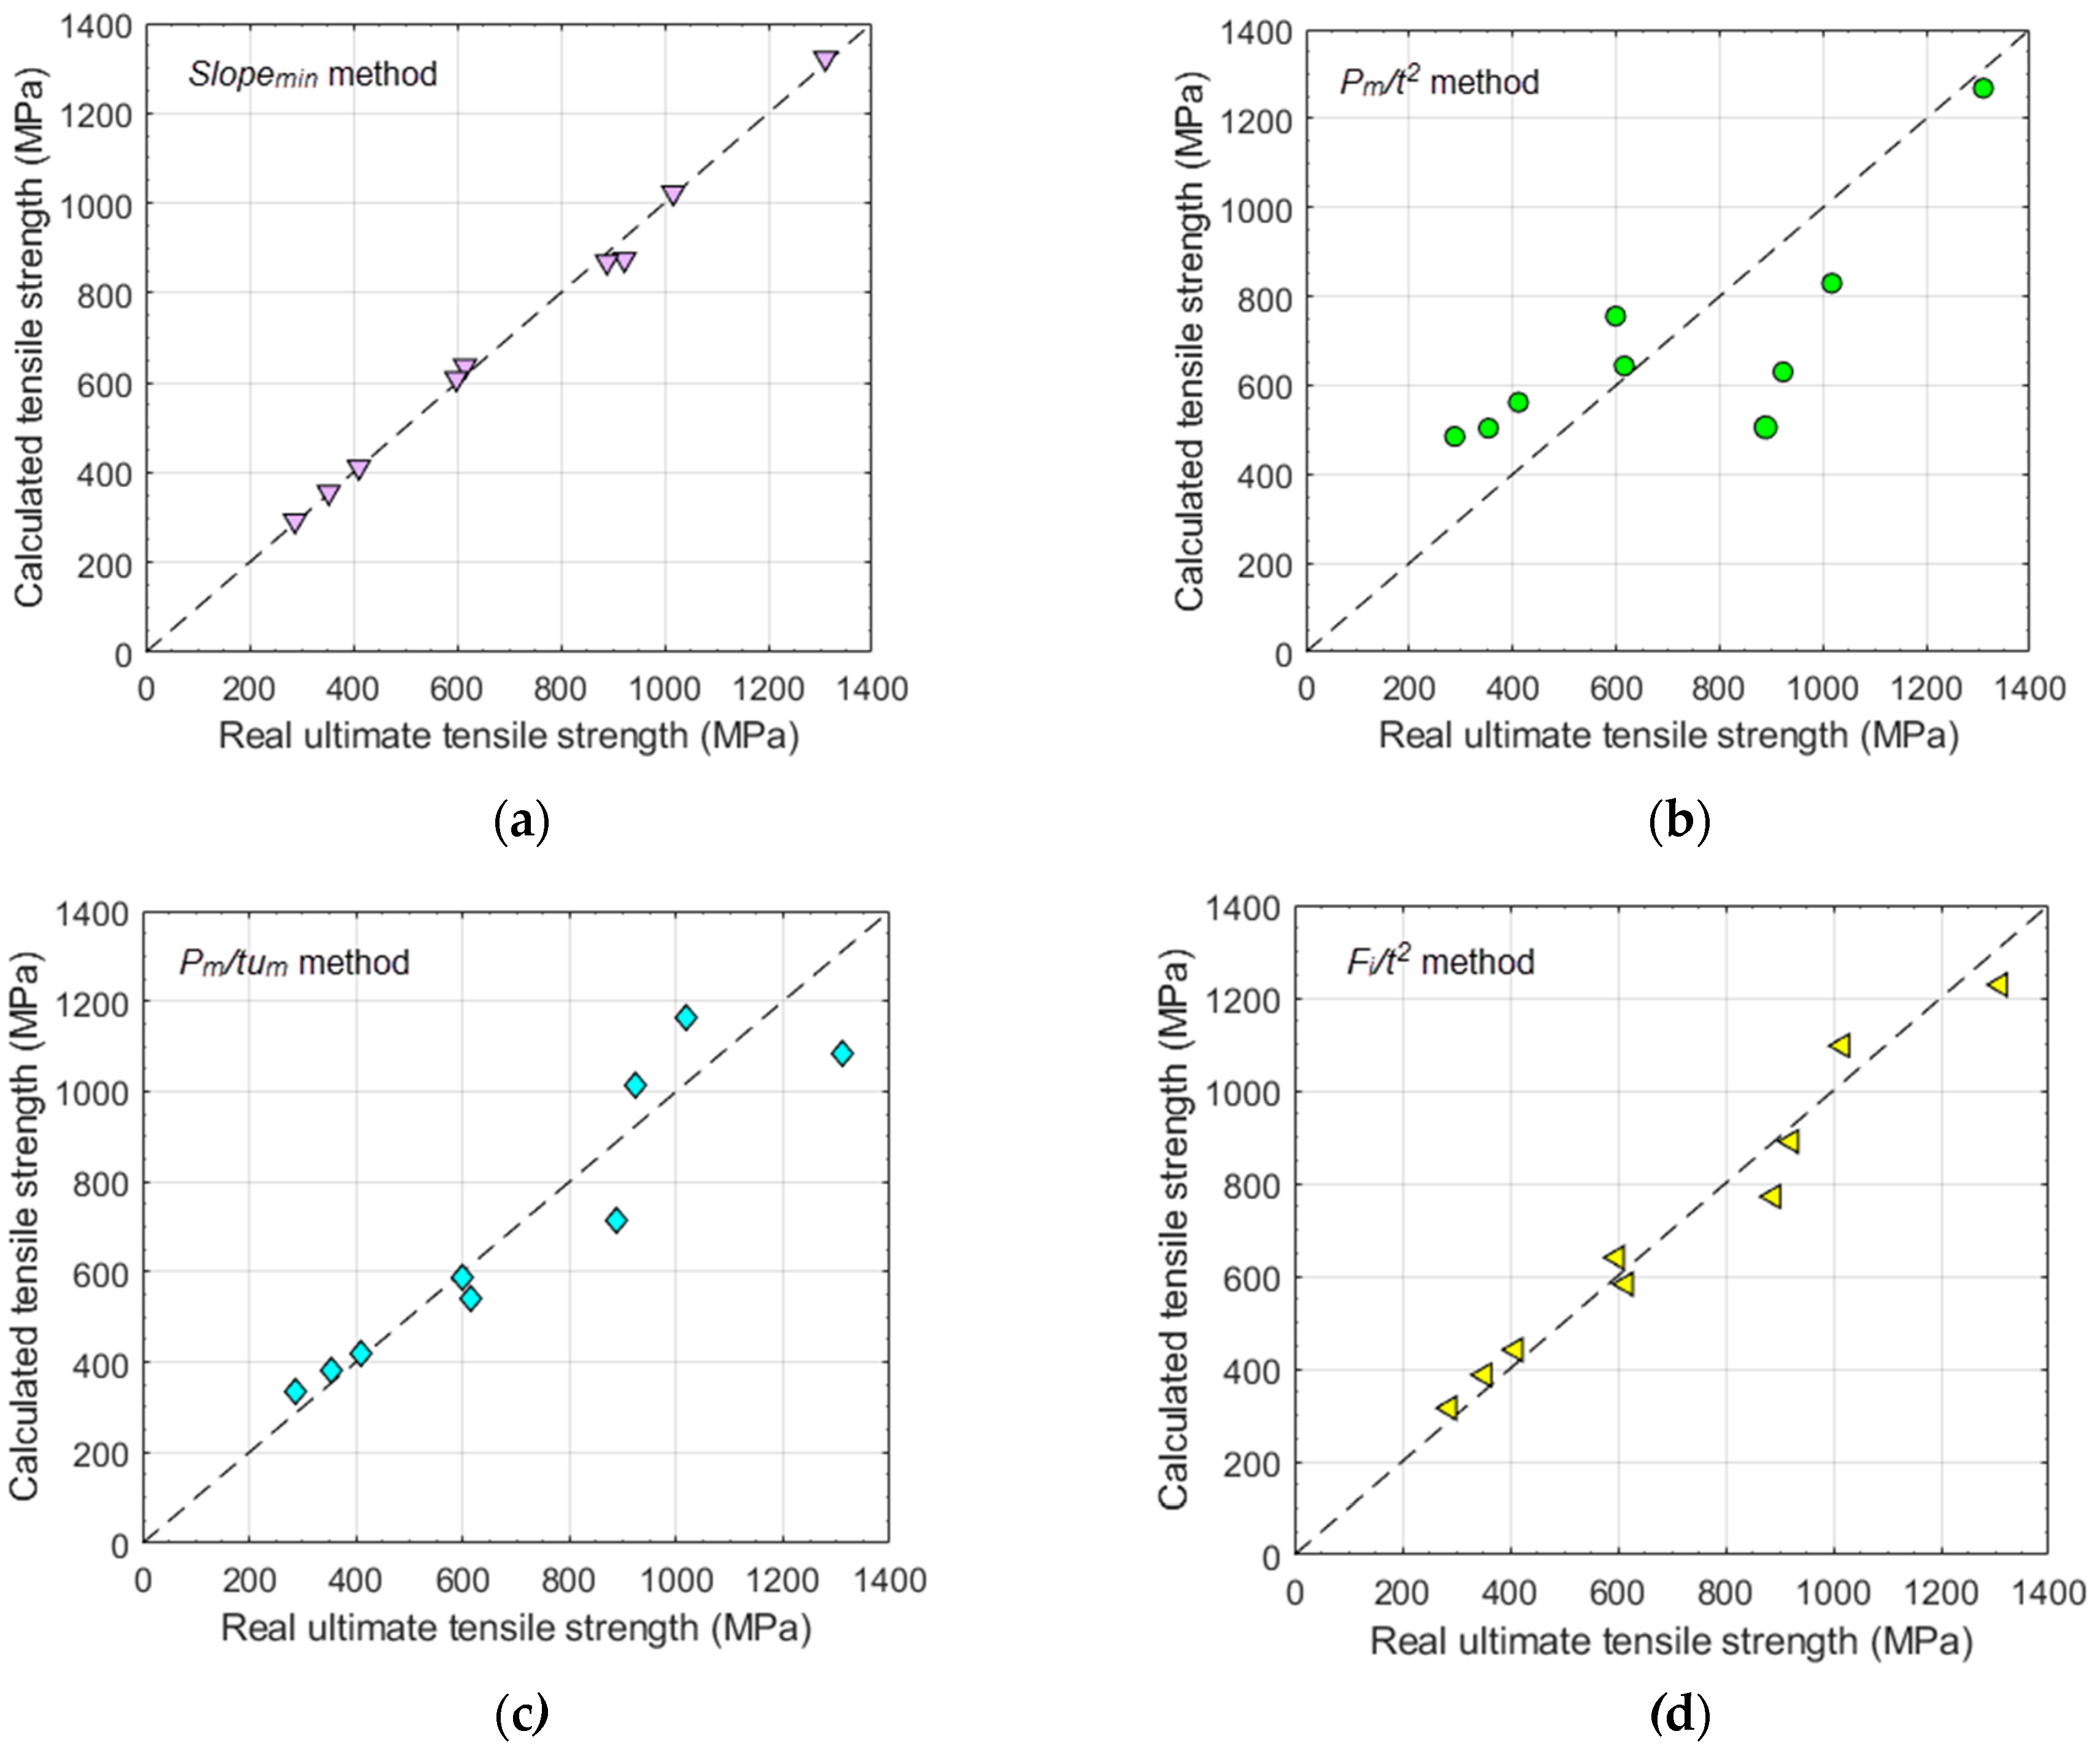
σu, the most widely used method for the estimation of this mechanical property is the maximum load
Pm of the SPT curve (see
Figure 1). Mao and Takahashi [
7] developed the method for estimating
σu with Equation (1):
where
β1 and
β2 are the correlation coefficients,
Pm is the maximum load of the SPT curve, and
t is the specimen thickness.
Garcia et al. [
13] recommended the use of
Pm/(t·um) instead of
Pm/t2 (see
Figure 1 for
um calculation), and other researchers developed alternatives that have the use of the maximum load
Pm of the SPT curve [
14] in common. Kumar et al. [
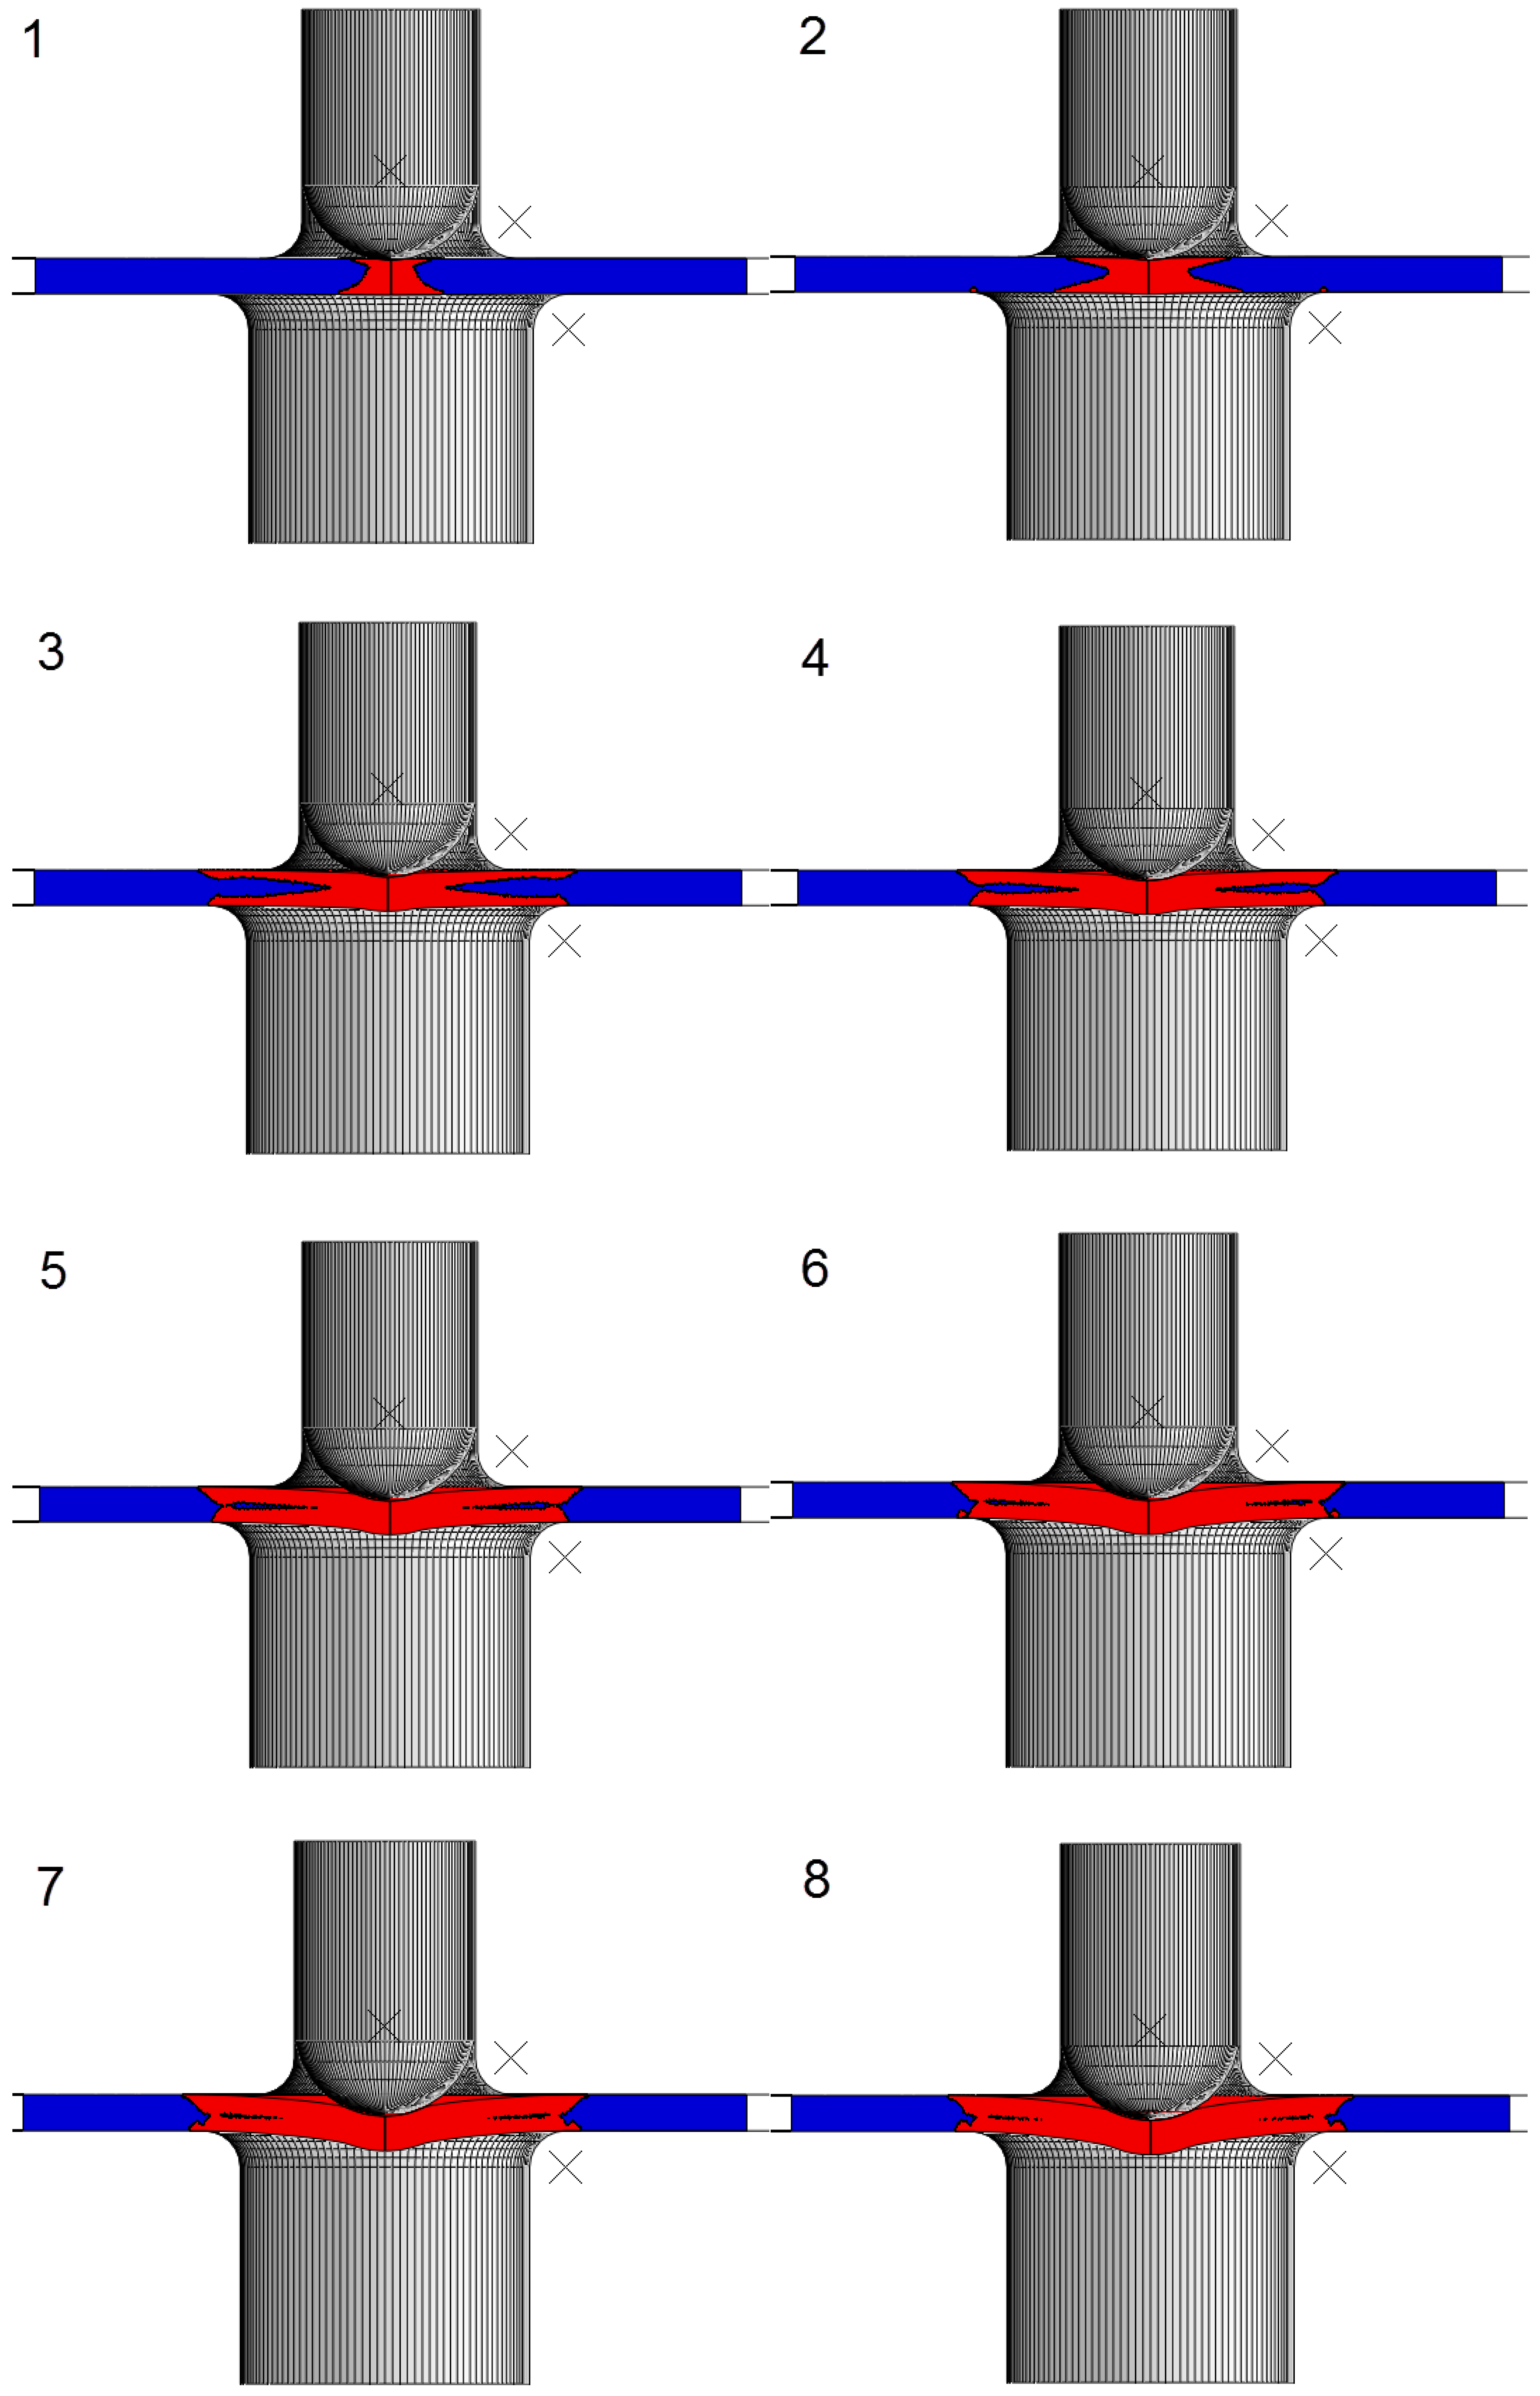
15] showed in their research that the SPT specimen, in the proximity of the maximum load
Pm, had initial cracks. Thus, material damage is initiated before reaching the maximum load of the SPT curve. The ultimate tensile strength is obtained from the uniaxial tensile test when damage or cracks have yet to be initiated. Thus, the maximum load
Pm does not seem to be a good parameter to be correlated with
σu, because it is influenced by the damage properties of the material. This was pointed out by Campitelli [
16] using a finite element analysis, and concluded that the stress–strain state of the SPT specimen at maximum load
Pm is completely different from that at necking in a standard tensile test.
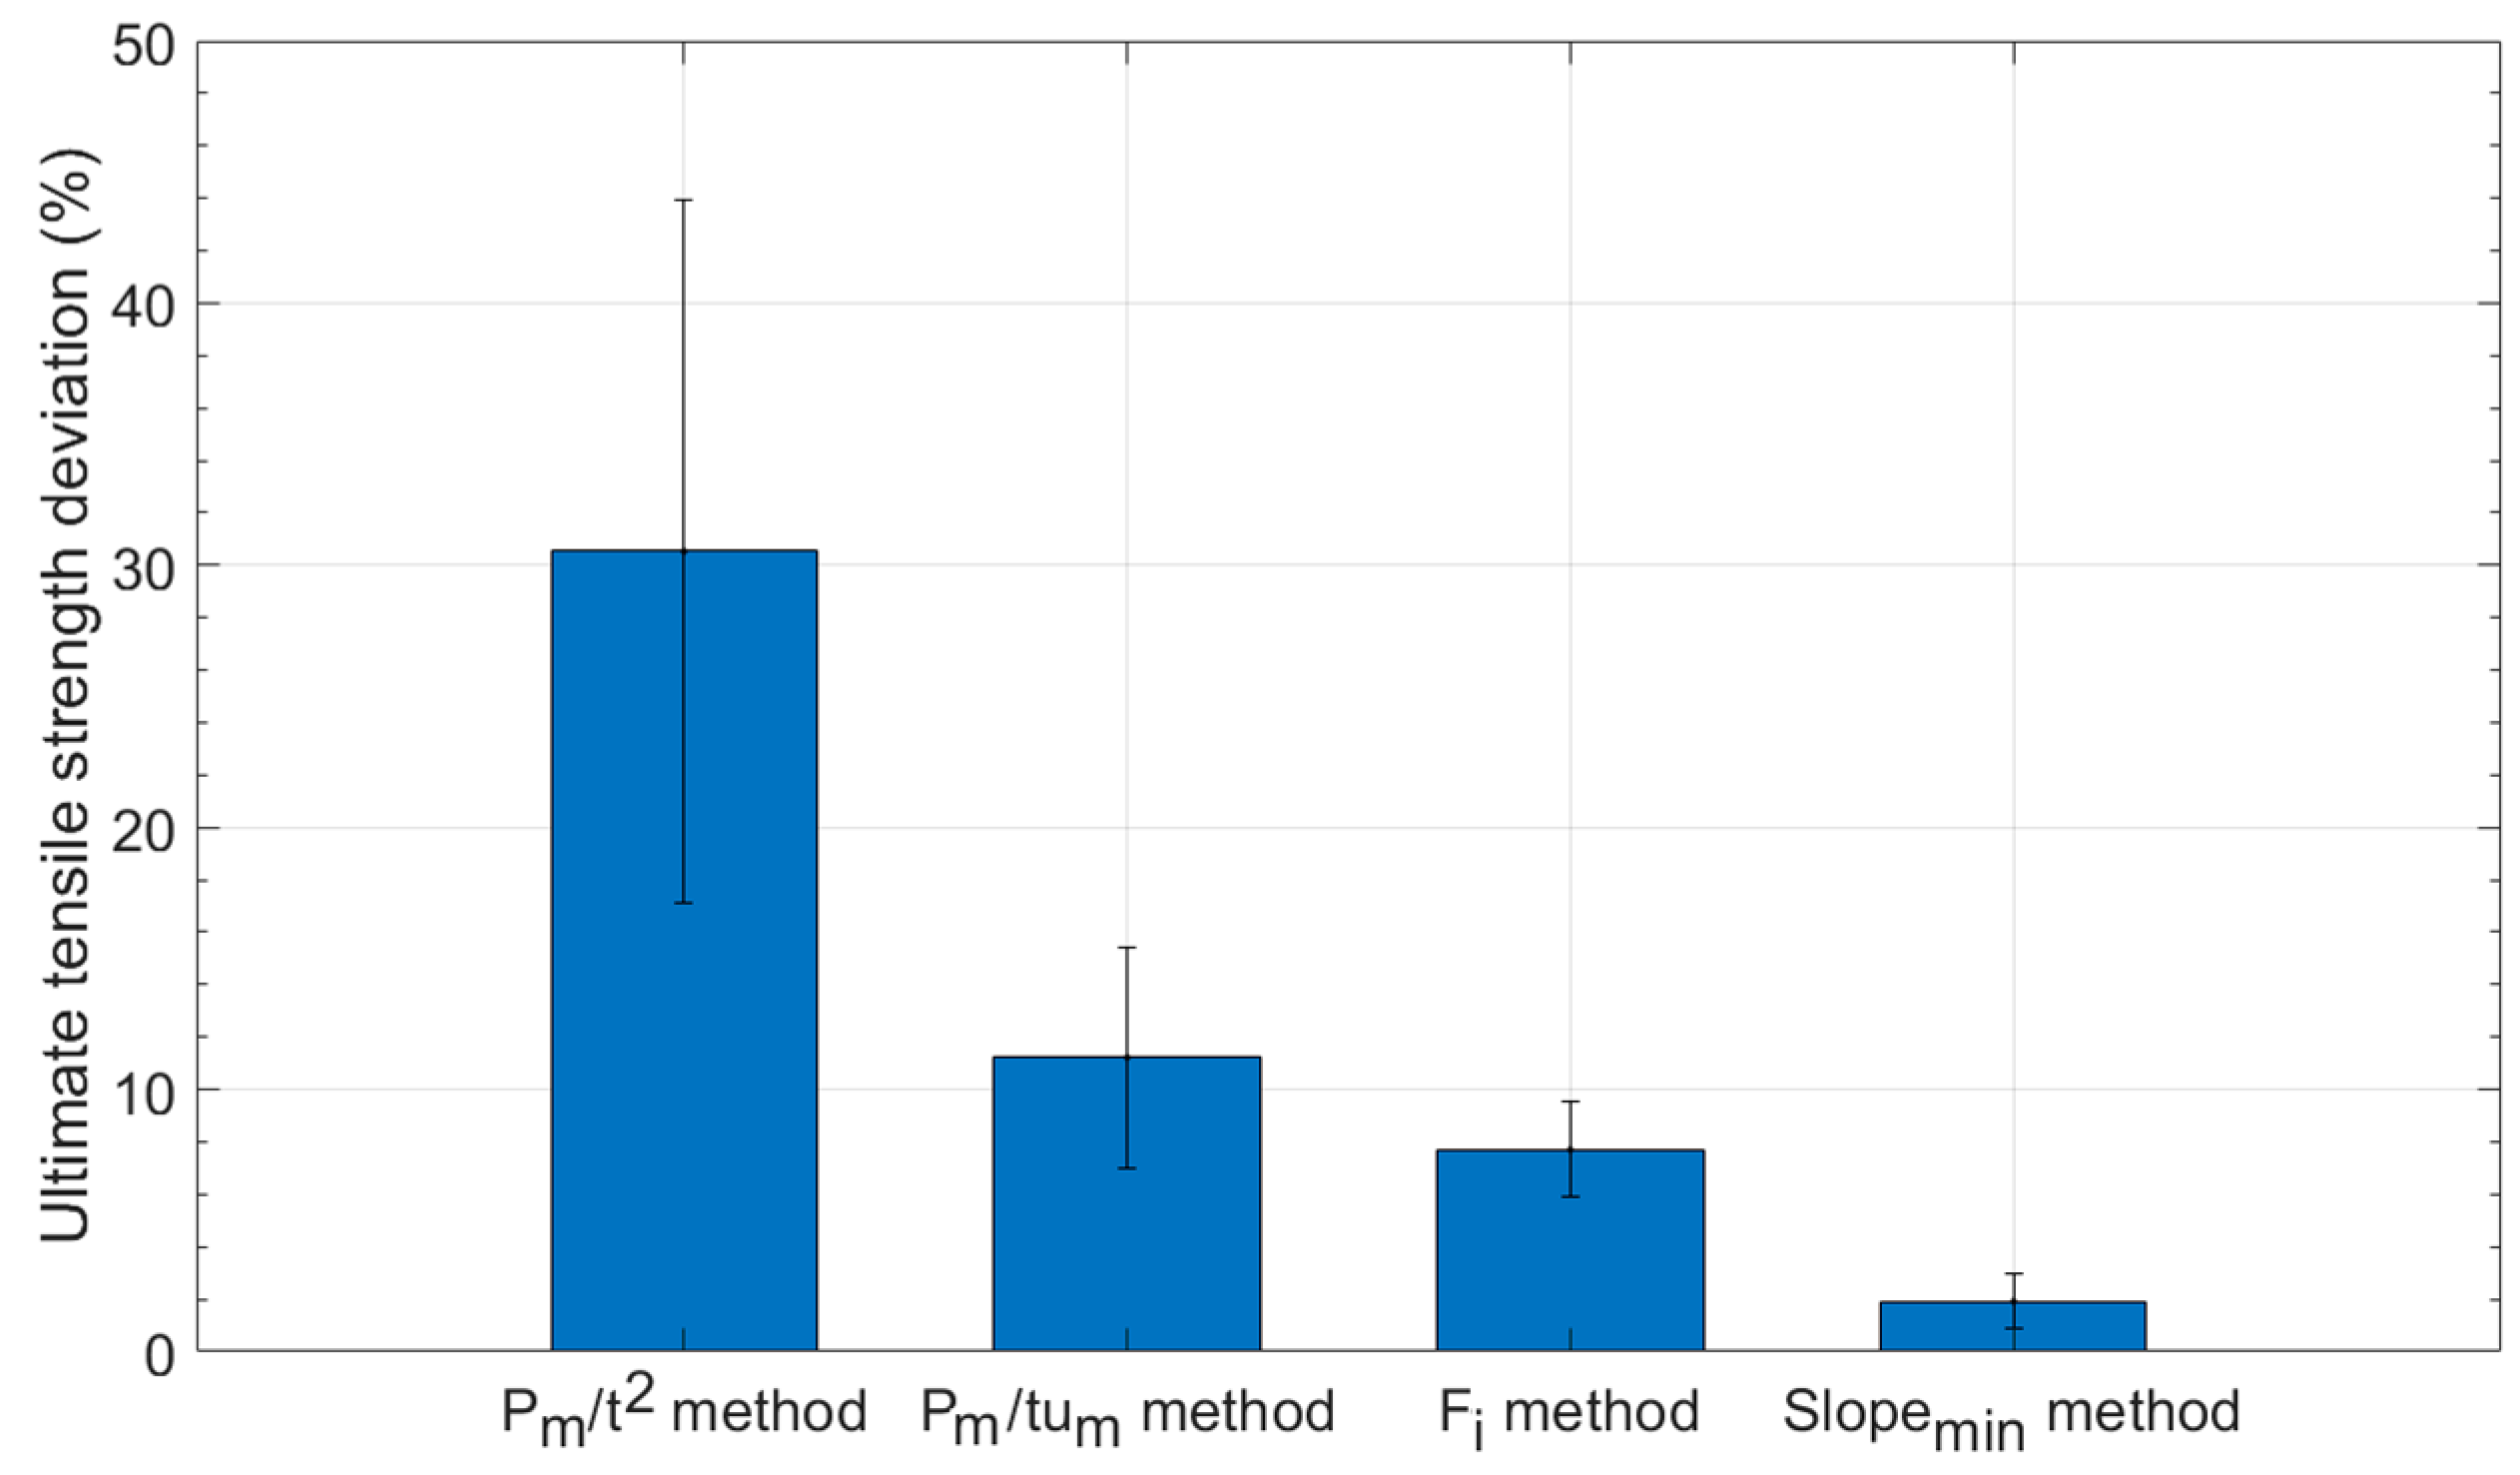
Based on these previous considerations, Altstadt et al. [
17] proposed an alternative parameter obtained from the SPT curve: the
Fi load. This data was the force at a fixed punch displacement of 0.645 mm. This method was based on the shape of the SPT curves obtained by the finite element analyses of hypothetical materials. When the elastic mechanical properties, yield strength, and ultimate tensile strength were fixed, and the strain for this ultimate tensile strength was modified, SPT curves showed pseudo-intersections at a punch displacement of around 0.645 mm. For other fixed ultimate tensile strengths, the pseudo-intersections were found in a punch displacement close to the same displacement of 0.645 mm. This was investigated for hypothetical materials with an elastic modulus of
E = 212,000 MPa and an initial flow stress of
σy0 = 570 MPa. Different elastic modulus or initial flow stresses would give different punch displacements for the pseudo-intersections. An experimental comparison between the widely used method of
Pm correlation (
Fm in their paper) with the ultimate tensile strength and their new
Fi method was performed with the coefficient of determination
R2 of both correlations:
where the
Fi method showed lower deviations than the
Pm method.
The present research was initiated taking into consideration the same fact exposed previously by Kumar et al. [
15] and followed by Altstadt et al.: points prior to the
Pm are more suitable for the estimation of ultimate tensile strength
σu.
This article is focused on steel alloys and the obtaining of a new and more reliable correlation method for the ultimate tensile strength. The following steps were taken:
- (a)
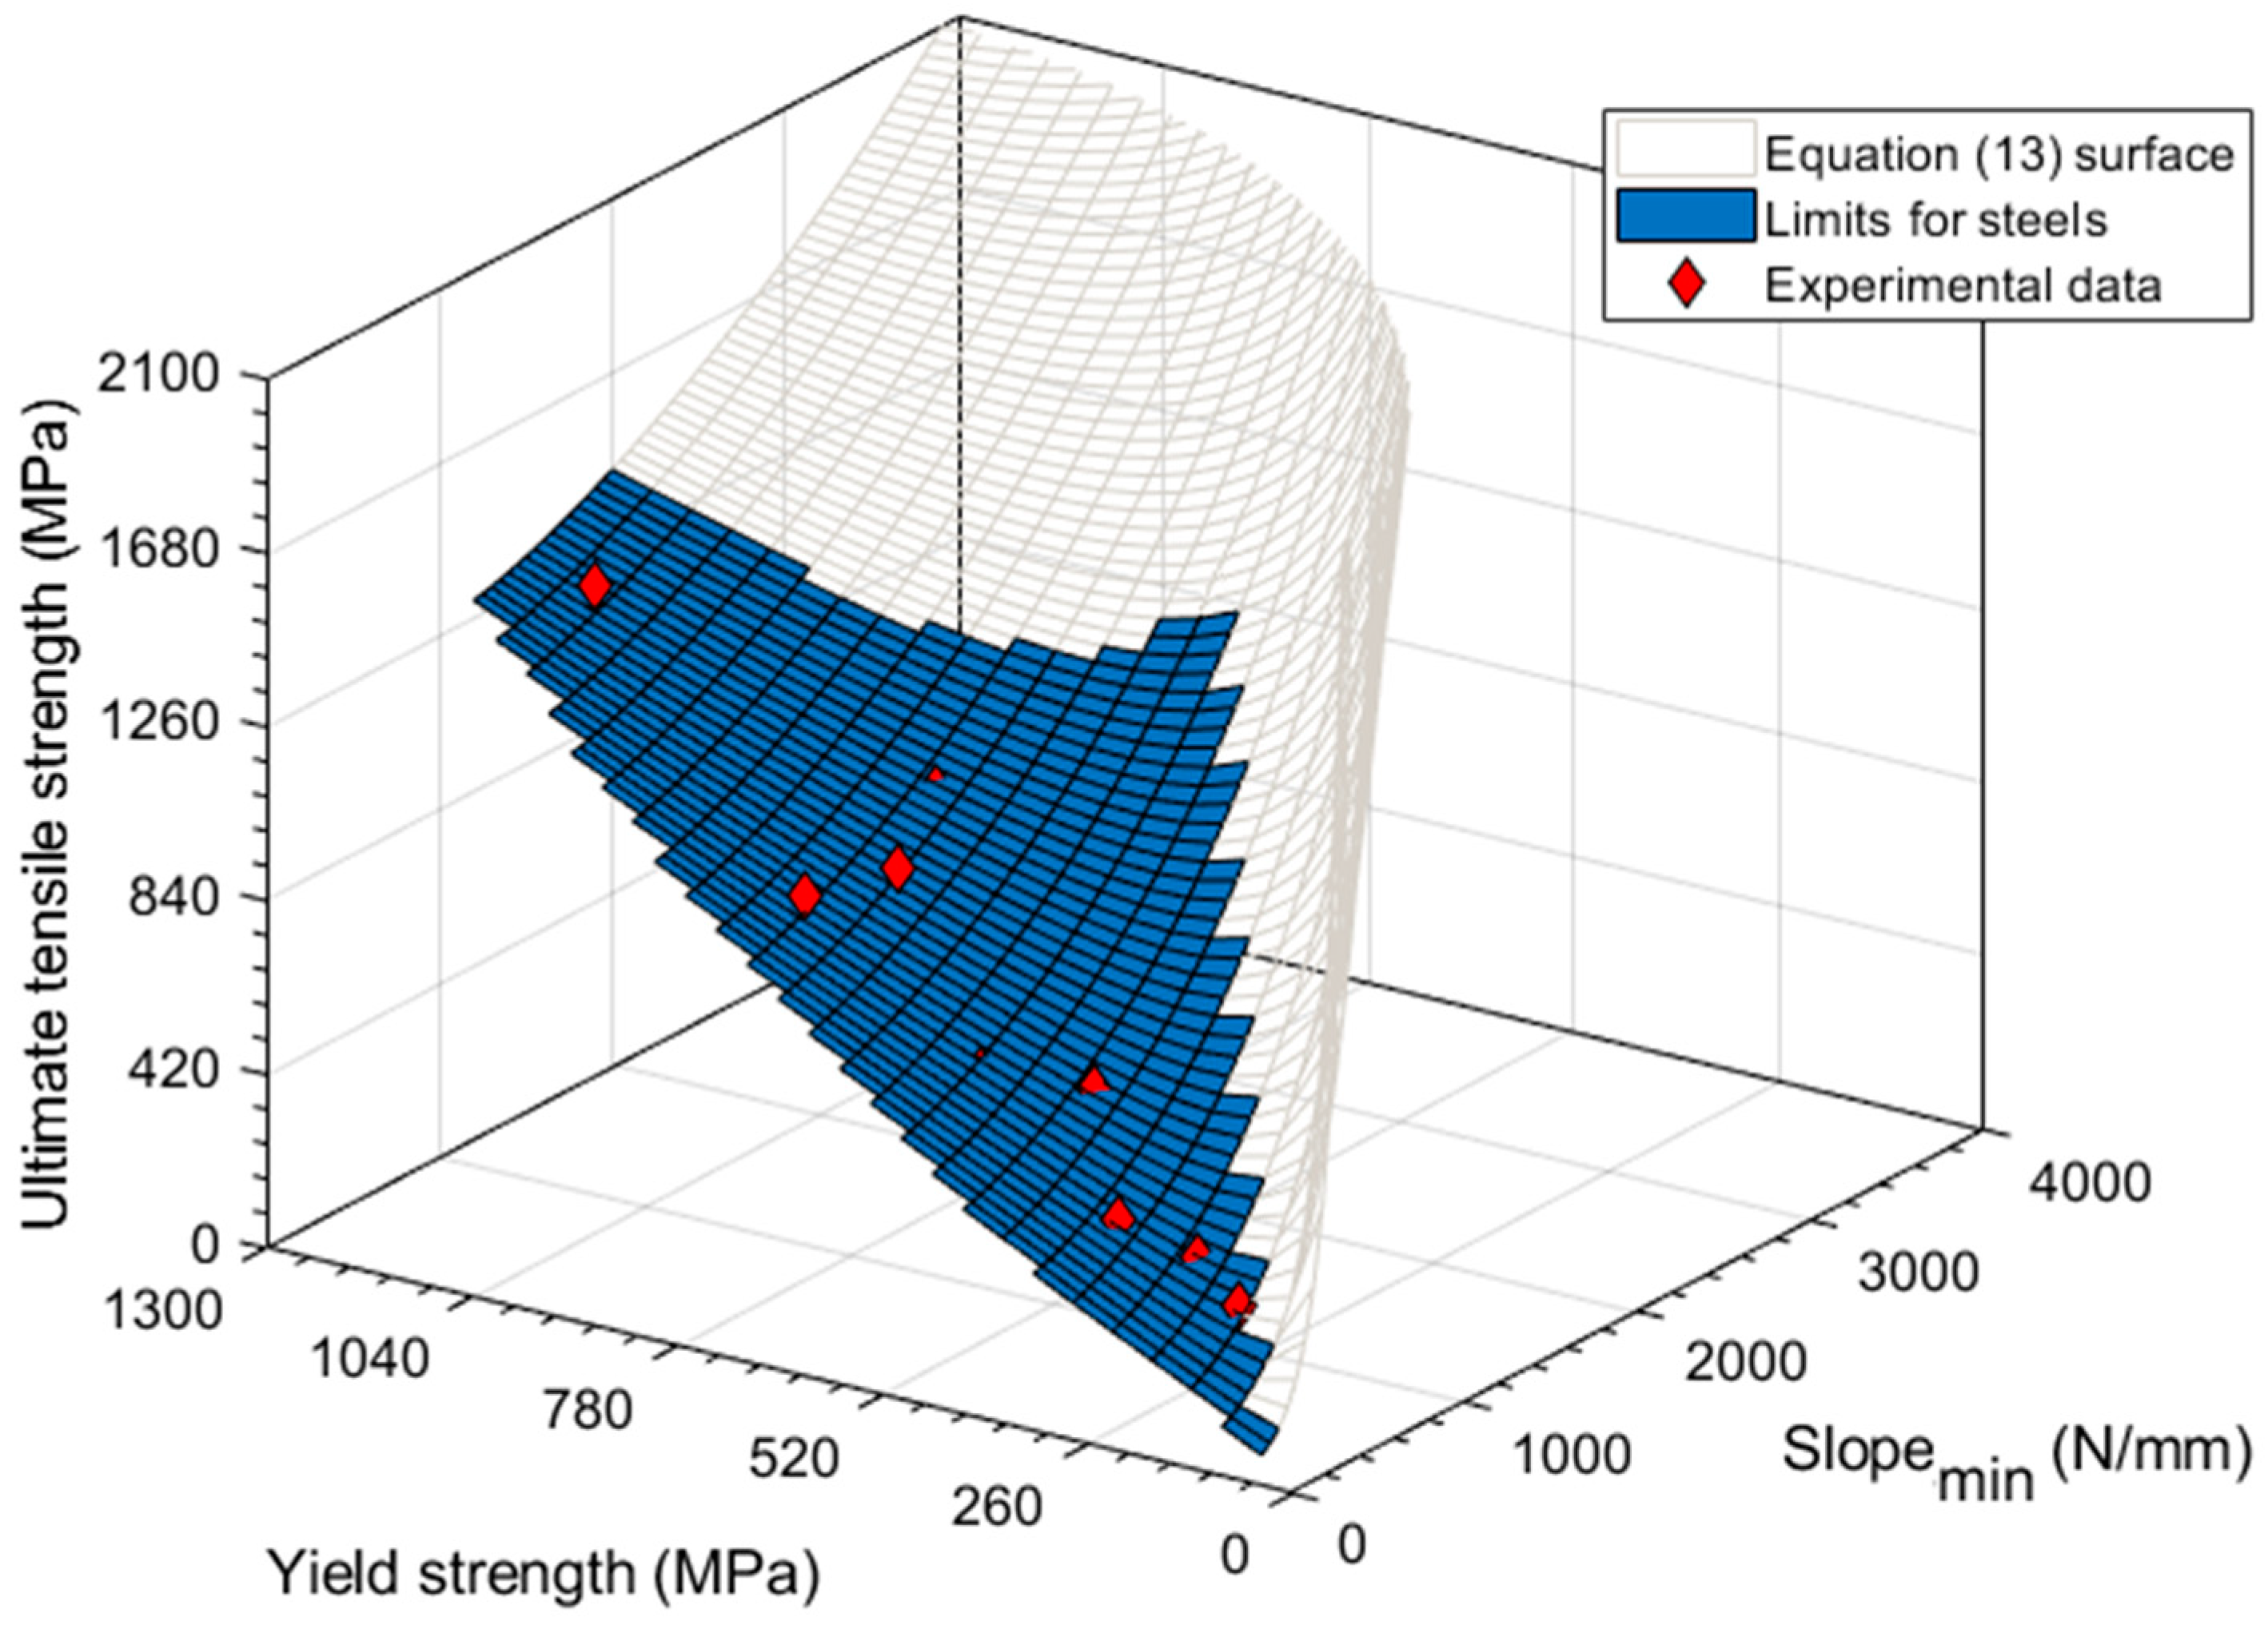
Summary of steel mechanical properties. The aim of this review was to obtain a delimited surface of hardening coefficient versus yield strength for steel alloys. A specific selection of steels was considered to cover this entire surface for the experimental tests, with a maximum limit of 1300 MPa in the yield strength.
- (b)
SPT behavior analysis. A preliminary FEM analysis was performed to understand the behavior of the SPT specimen during the test. Based on this, a new correlation method for the ultimate tensile strength of the material was proposed.
- (c)
Hypothetical material analysis. A second FEM analysis was performed to obtain the correlation equations for the proposed method in the analysis indicated in the previous point (b).
- (d)
Finally, an experimental analysis was performed to verify the numerical study previously seen and the proposed correlation method. This experimental analysis covered a wide range of steel alloy properties with yield strengths lower than 1300 MPa.
2. Materials and Methods
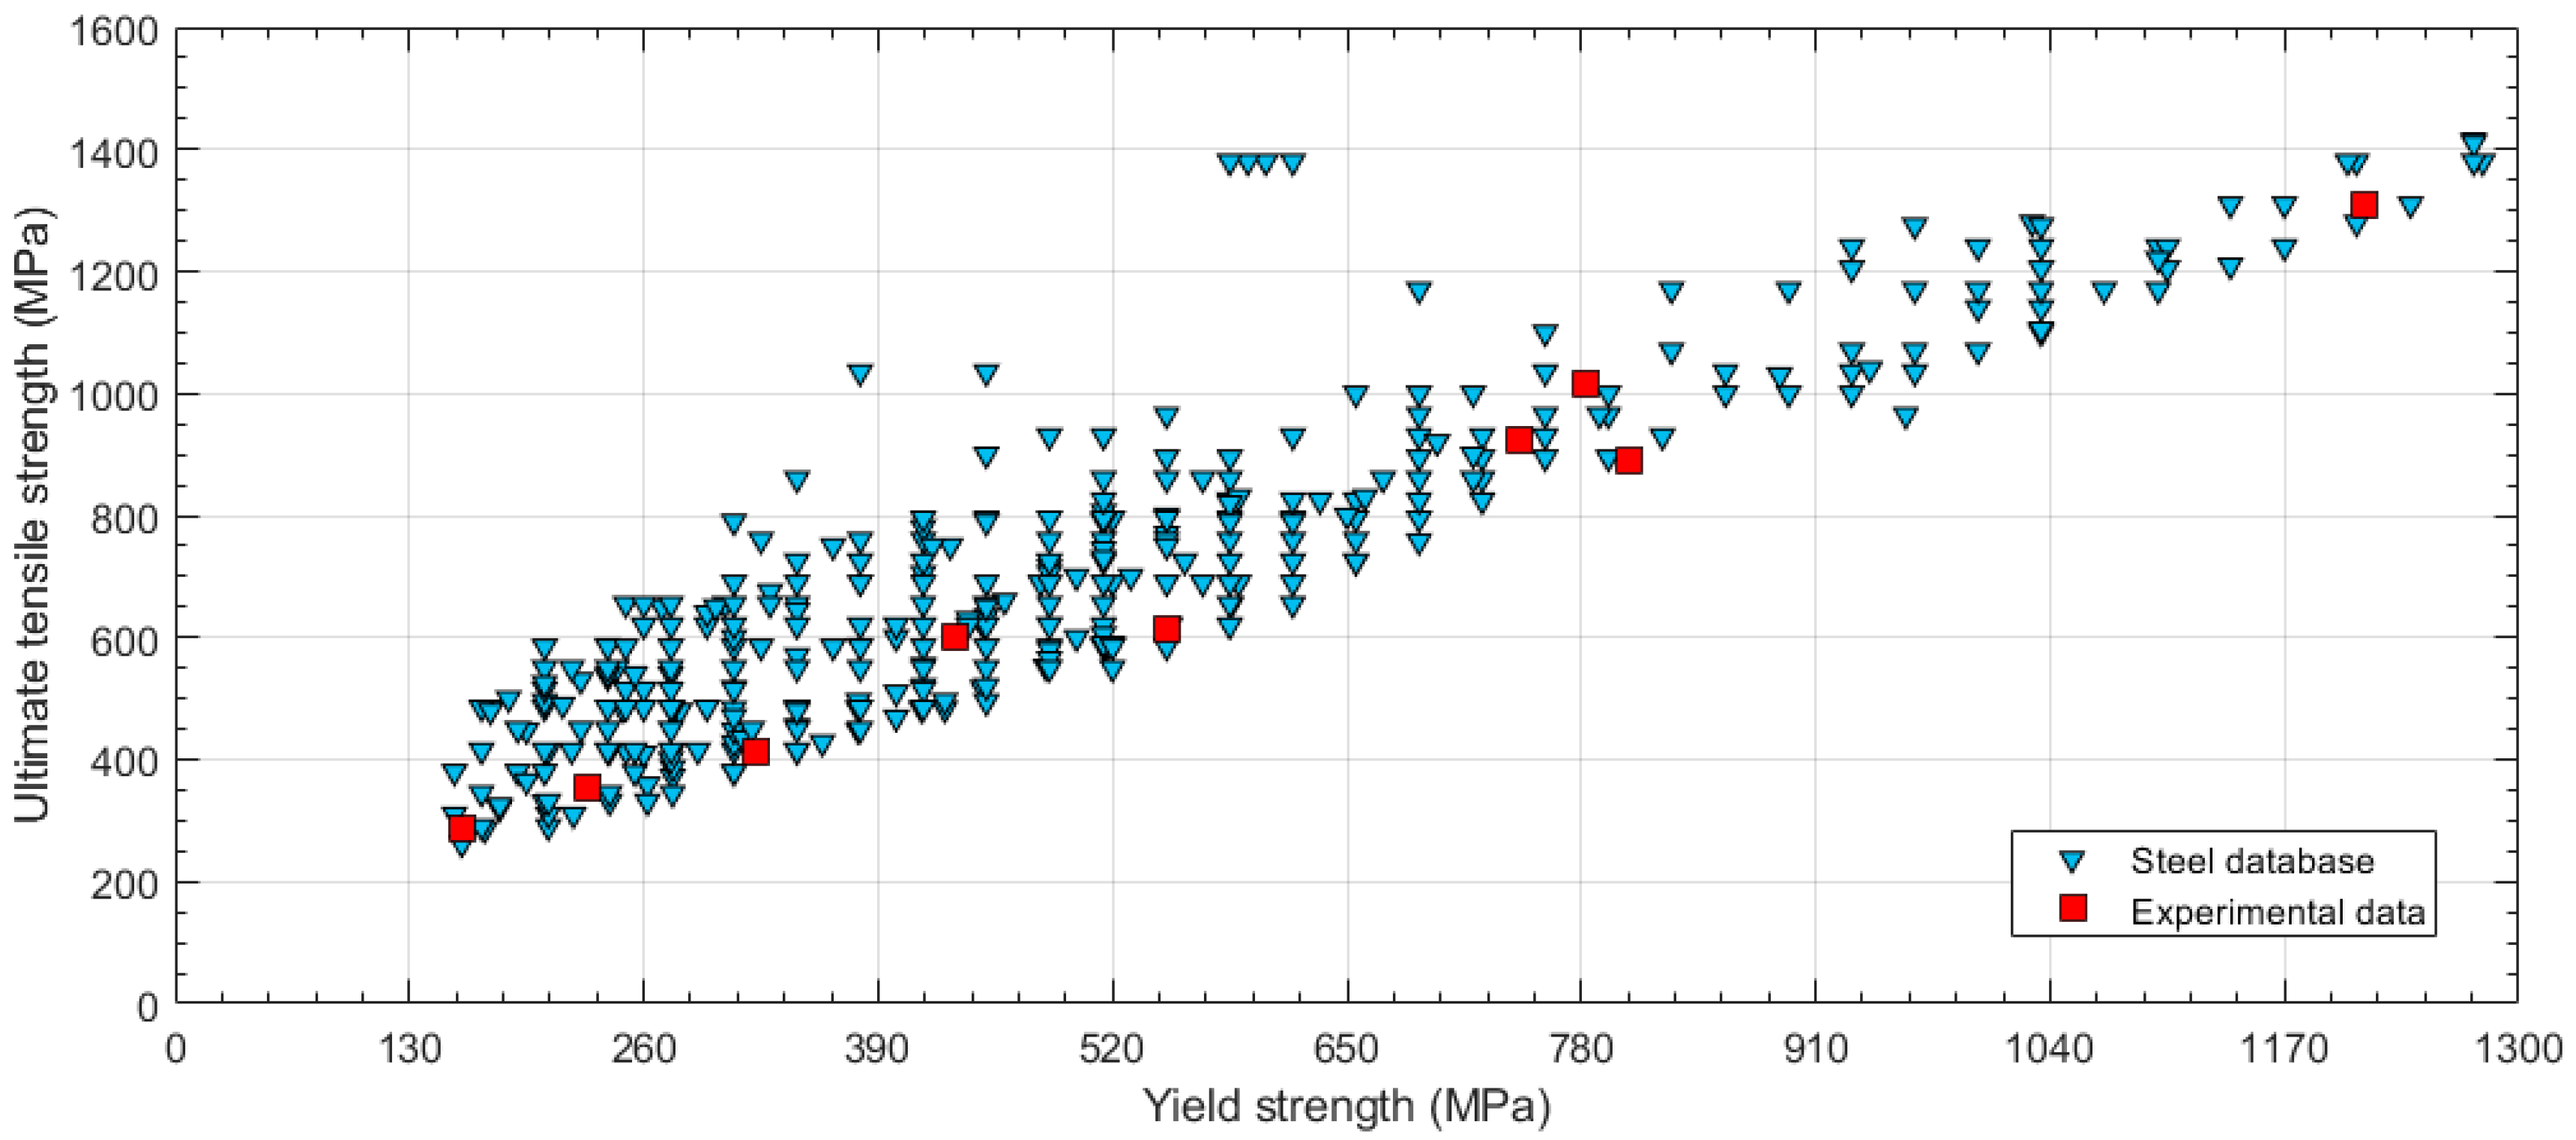
The aim of this research was to obtain a correlation method for finding the ultimate tensile strength with the SPT in steel alloys. This investigation was experimentally limited to yield strengths lower than 1300 MPa.
In order to define the range of applicability of the correlation equation, the ample steel data collection published by ASME in its Boiler and Pressure Vessel Code (BPVC) [
18] was used.
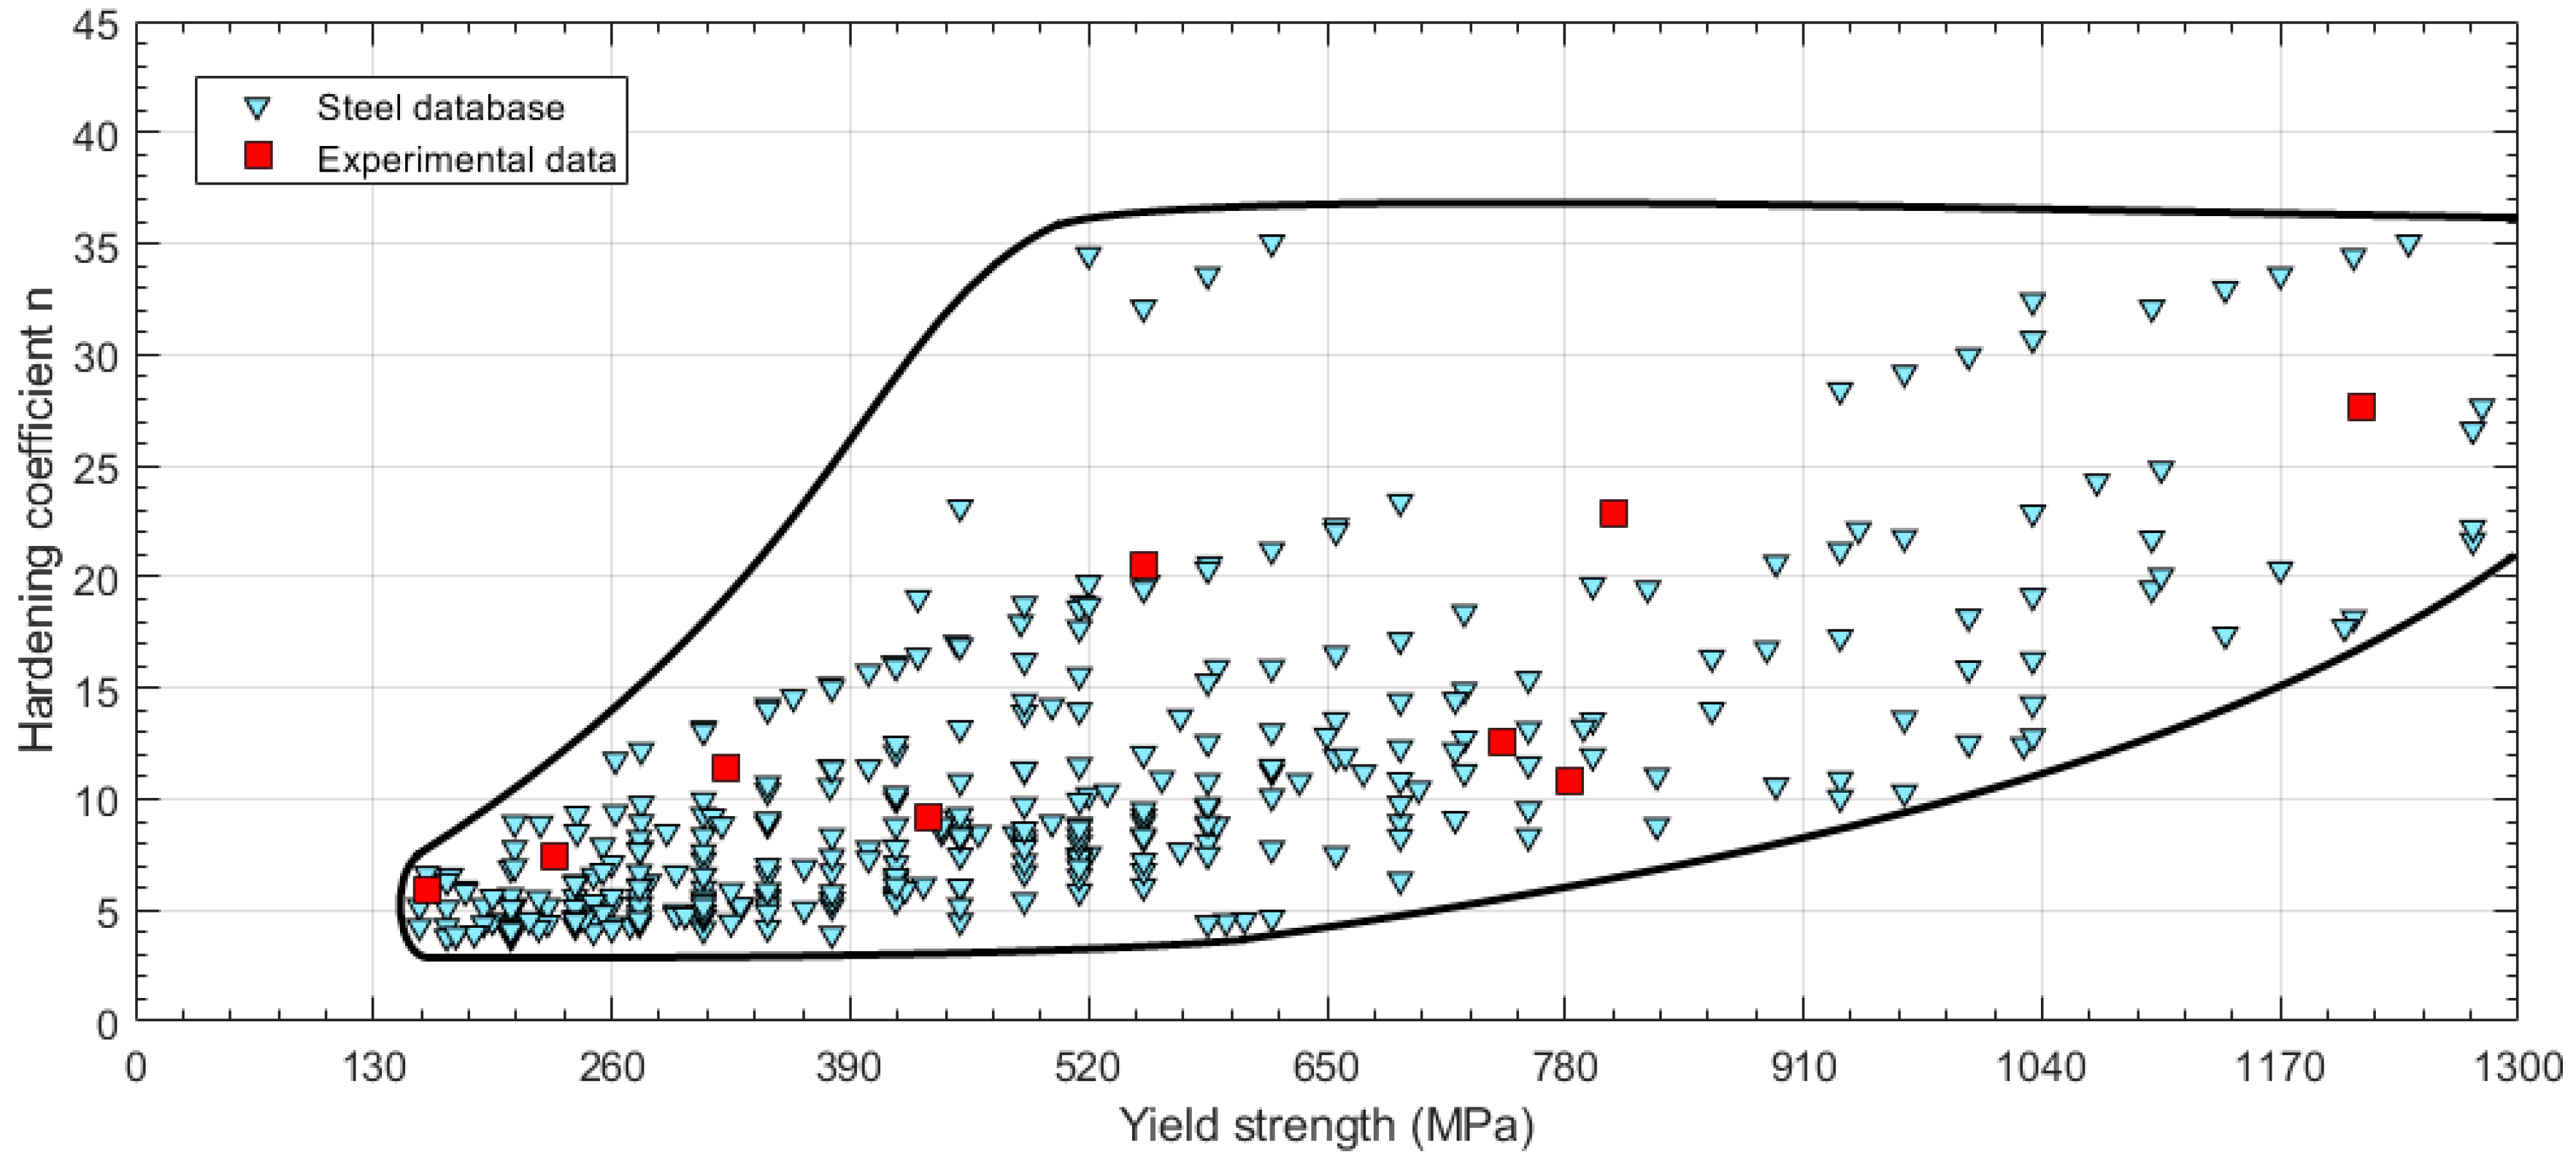
Figure 2 shows the ultimate tensile strength versus the yield strength for steels contained in the BPVC-IIA-2017. The experimental steels used in this research are marked as red squares in the same graph. The objective was to include the experimental tests throughout the range of the surface covered by the steel database.
In addition, an estimation of the hardening coefficients of the same database was done. A Ramberg–Osgood law [
19] was used in this analysis following Equations (4) and (5).
where
εoffset = 0.002.
Kamaya developed a method to estimate the Ramberg–Osgood law coefficients using yield and ultimate tensile strengths of the material [
20]. For
εoffset = 0.002, the relation obtained by Kamaya was:
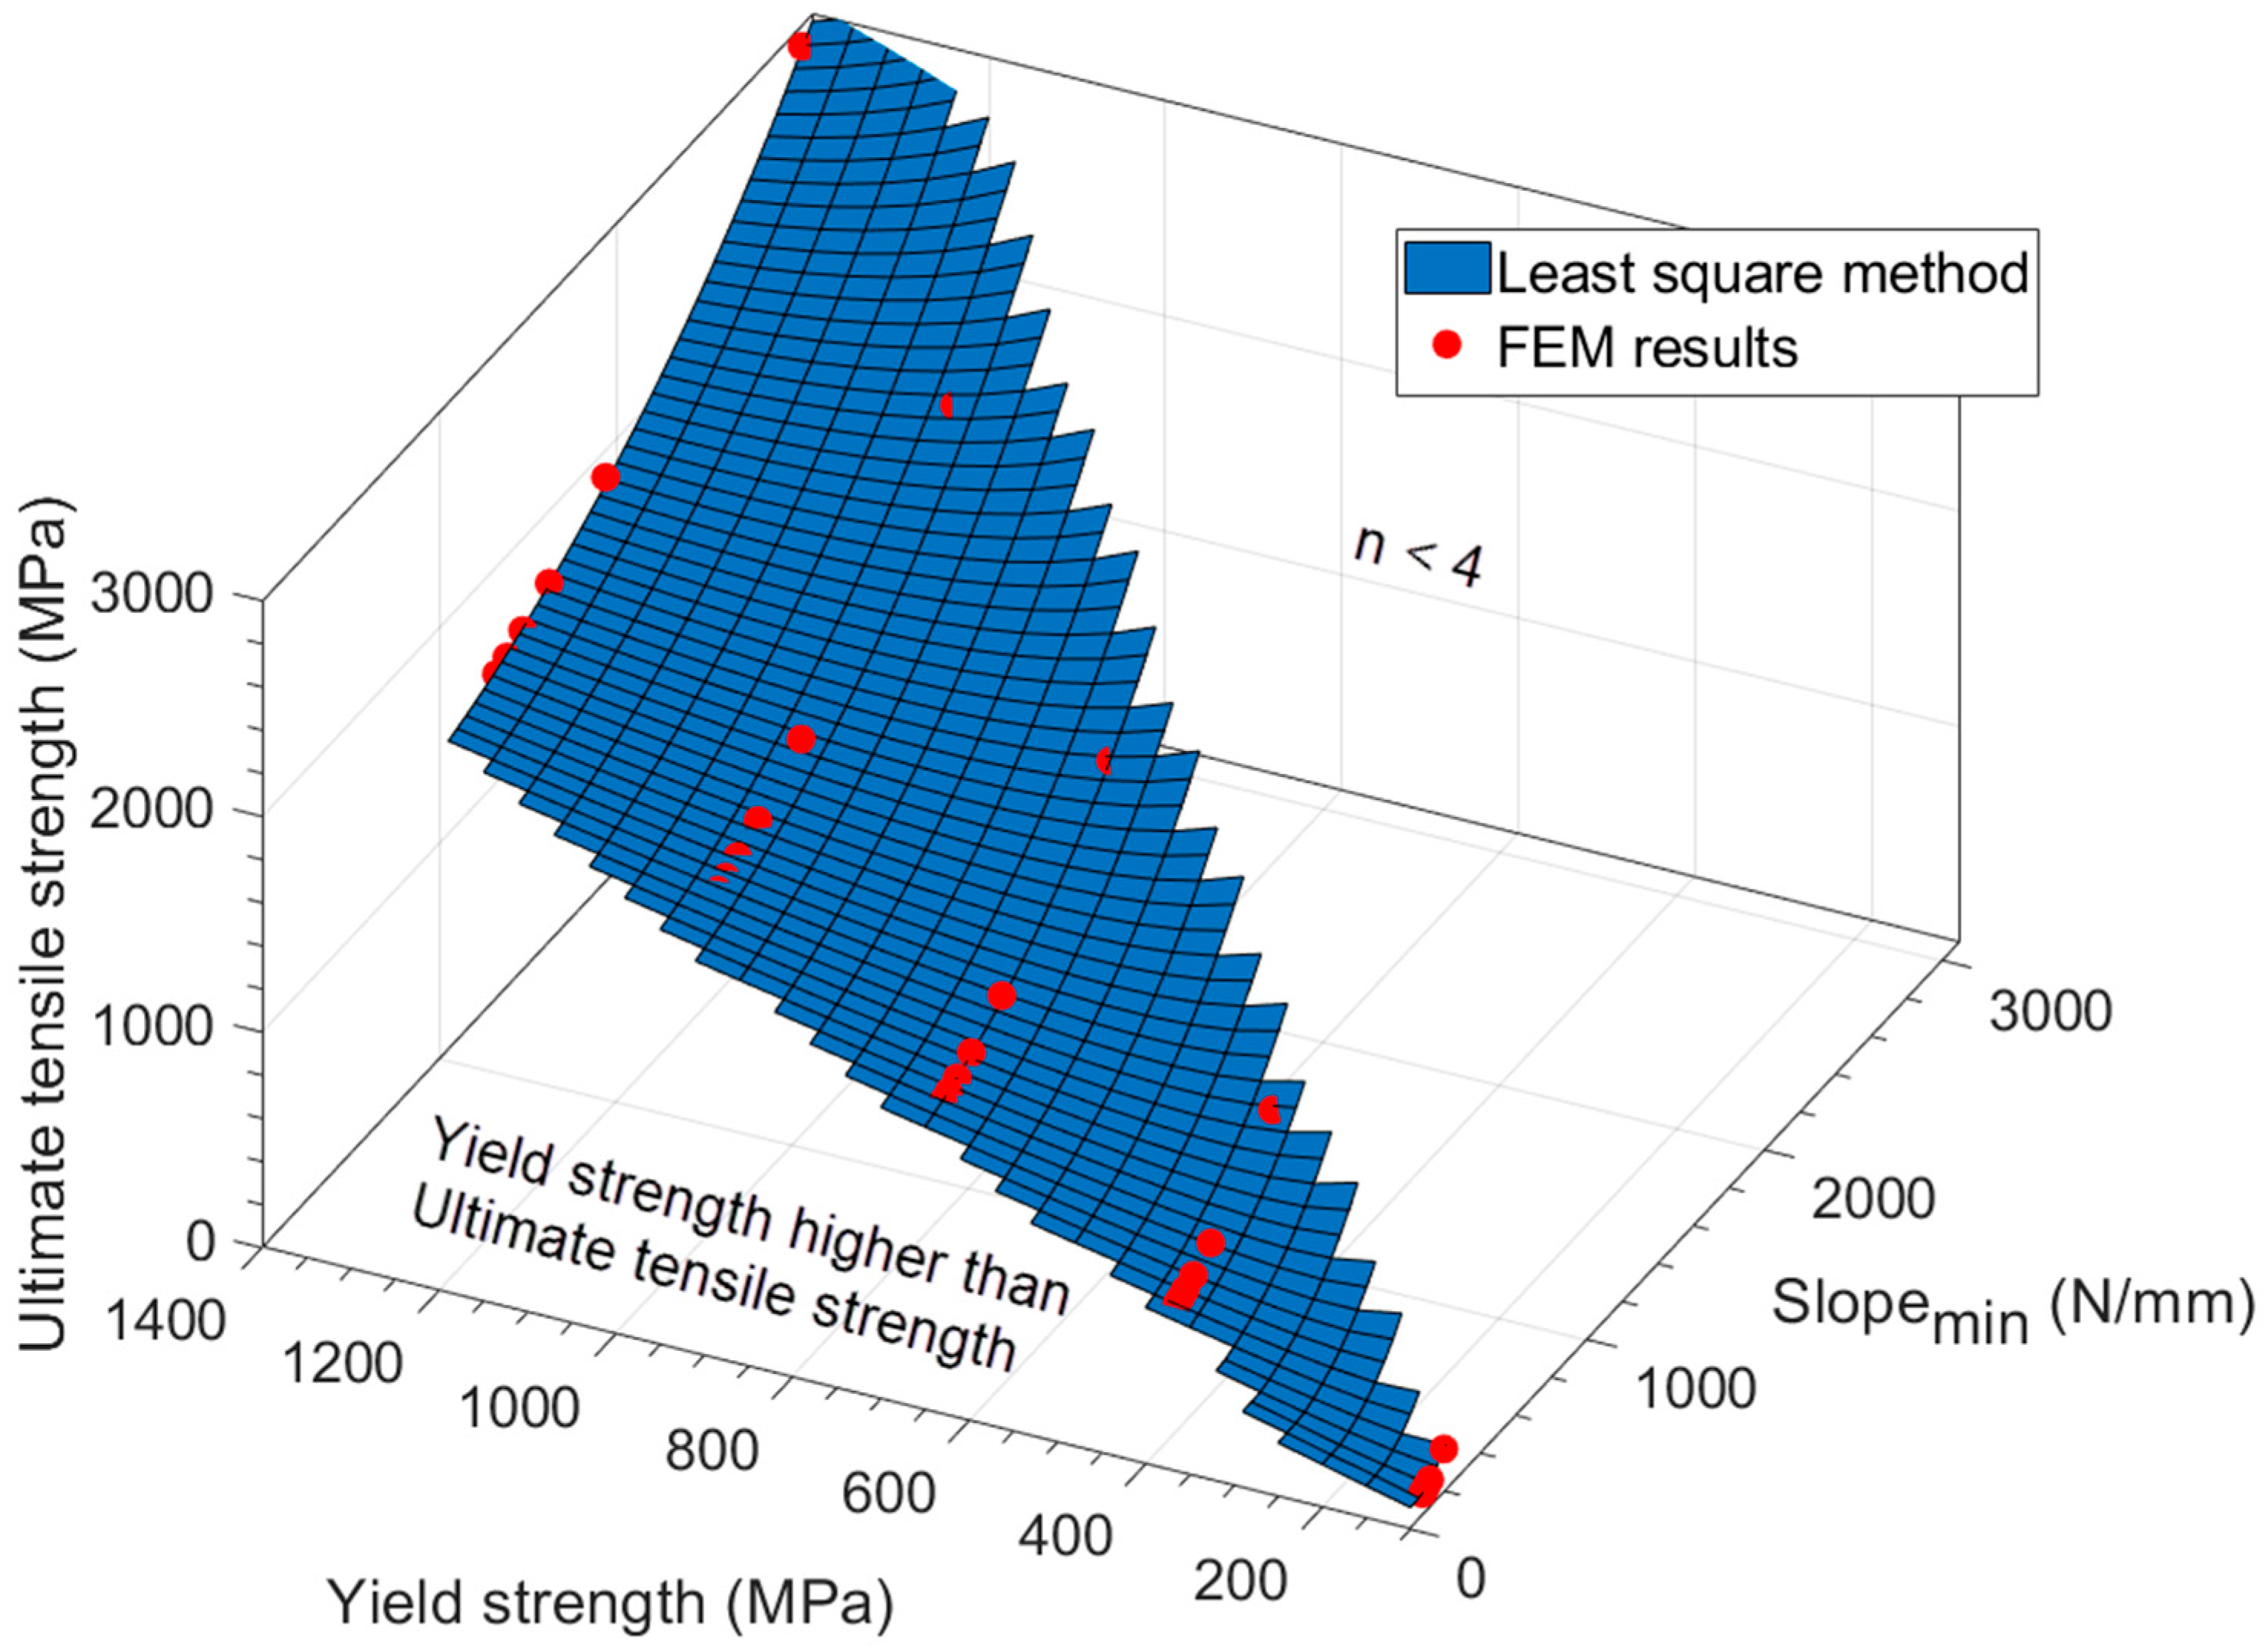
Once the strain hardening coefficient
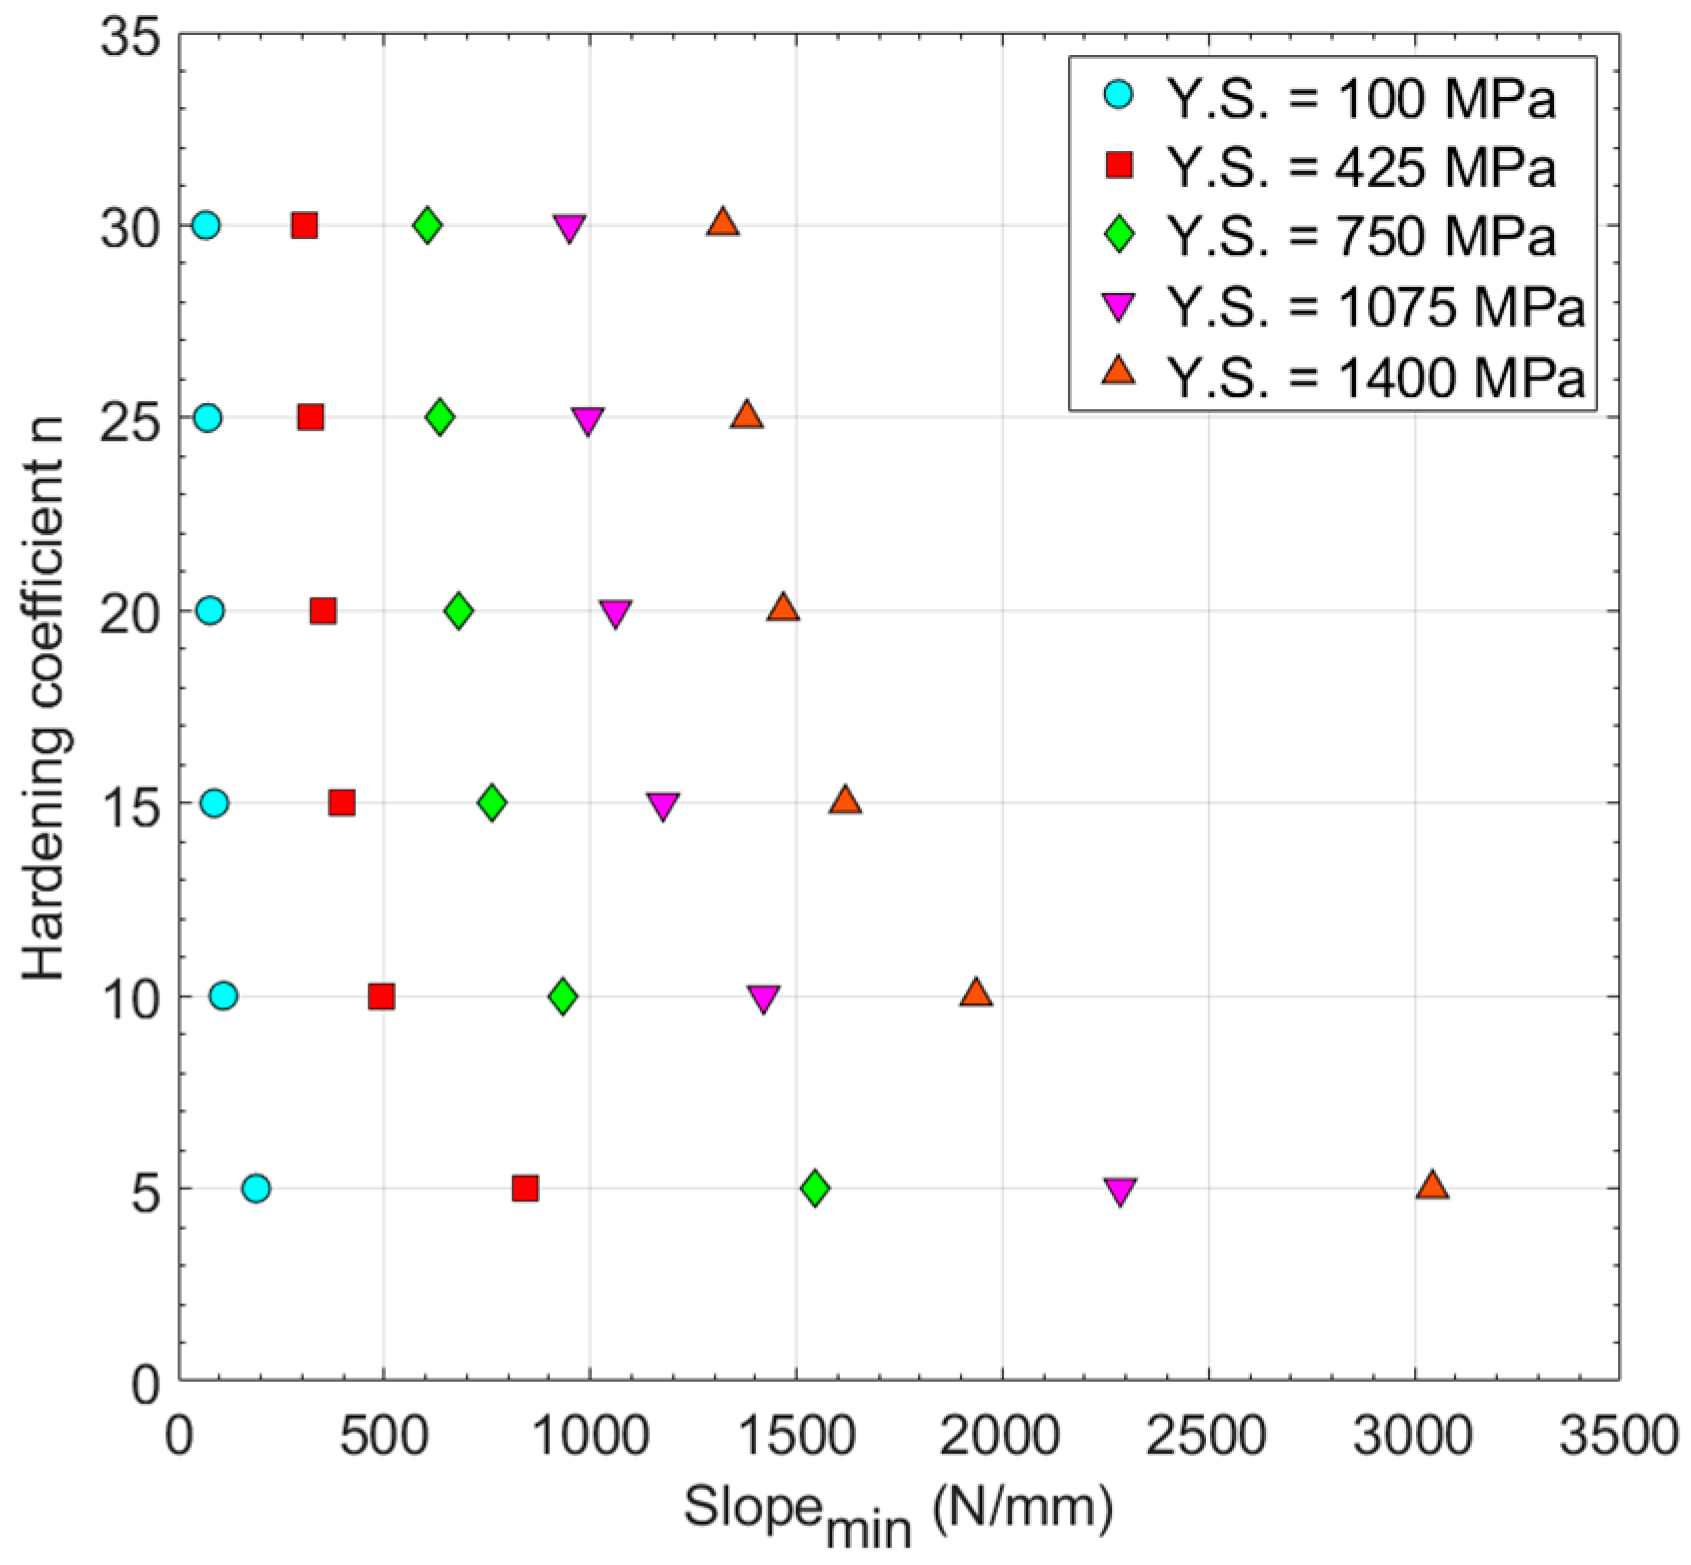
n of the material was obtained from Equation (6), the previous steel database presented in
Figure 2 was changed to show the relationship between the hardening coefficient
n and the yield strength (see
Figure 3). A boundary limit for the steel database is represented in
Figure 3. The hardening coefficient
n was limited to a minimum value between
n = 3 and
n = 4, and the upper limit was set to levels of
n = 37. The lower limit of
n increases with the yield strength, and the same behavior is shown for the upper limit.
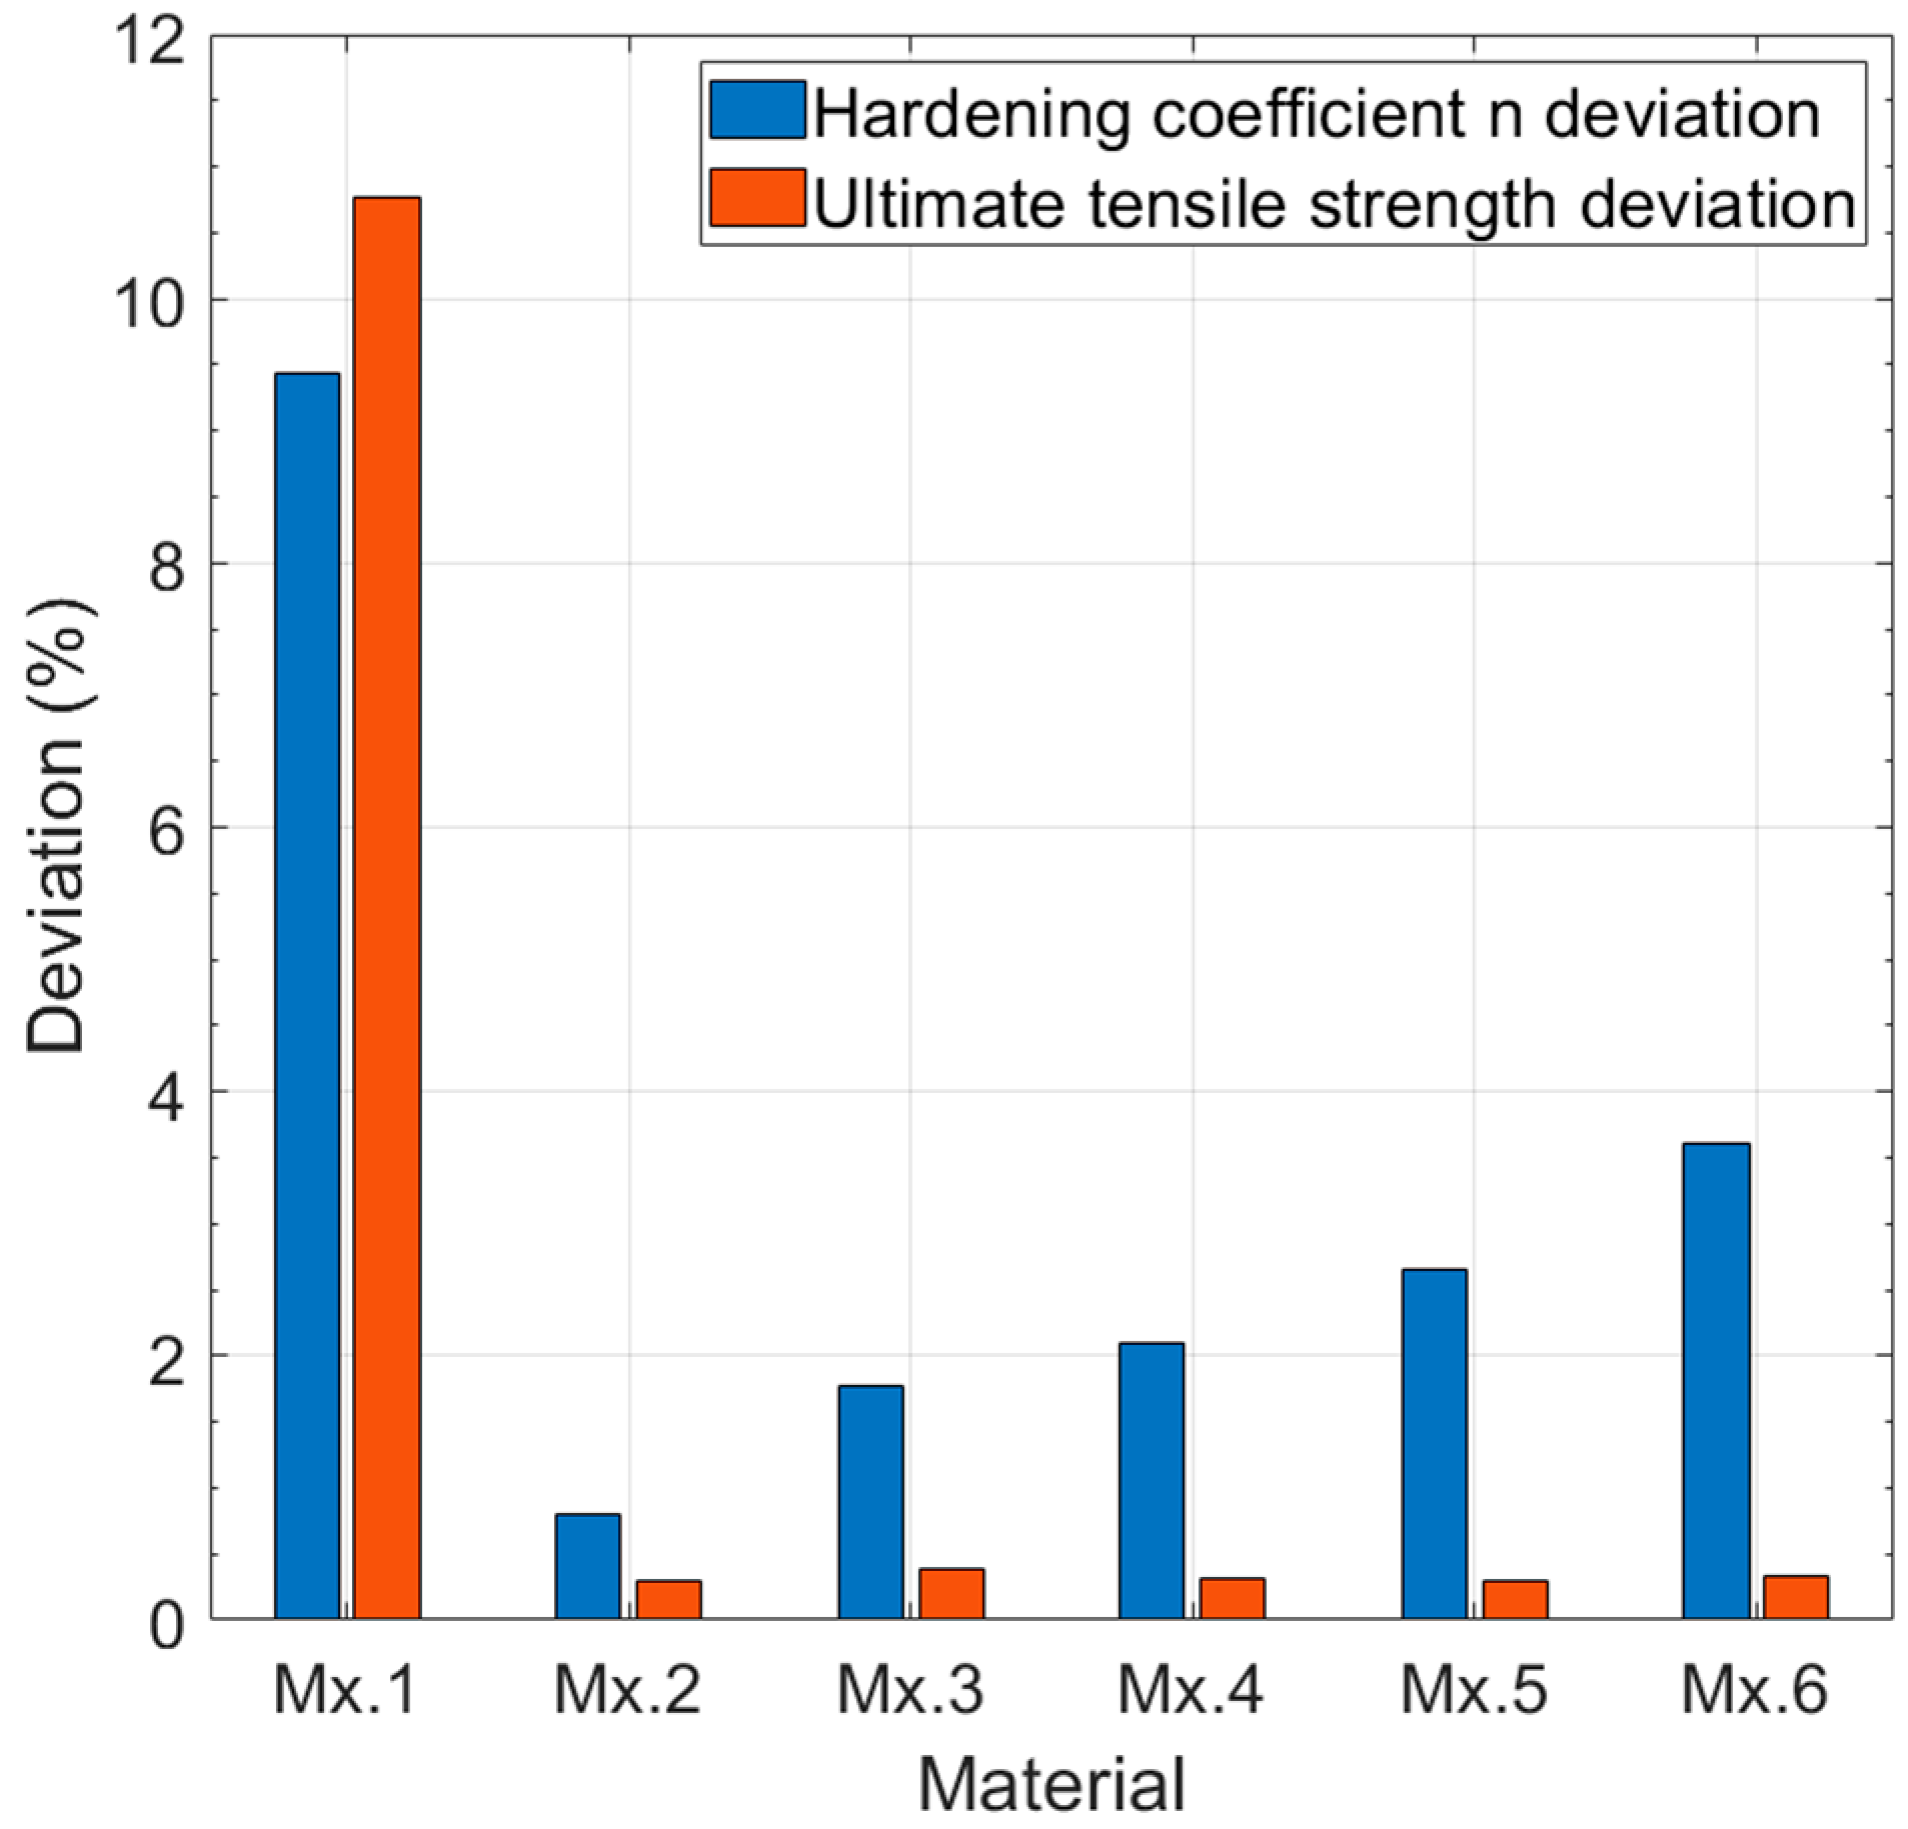
The selected experimental steels did not cover the higher values of n. High values of the n coefficient corresponded to materials with low strain hardening, so deviations in these high n values generate no significant changes in the strain-hardening curve.
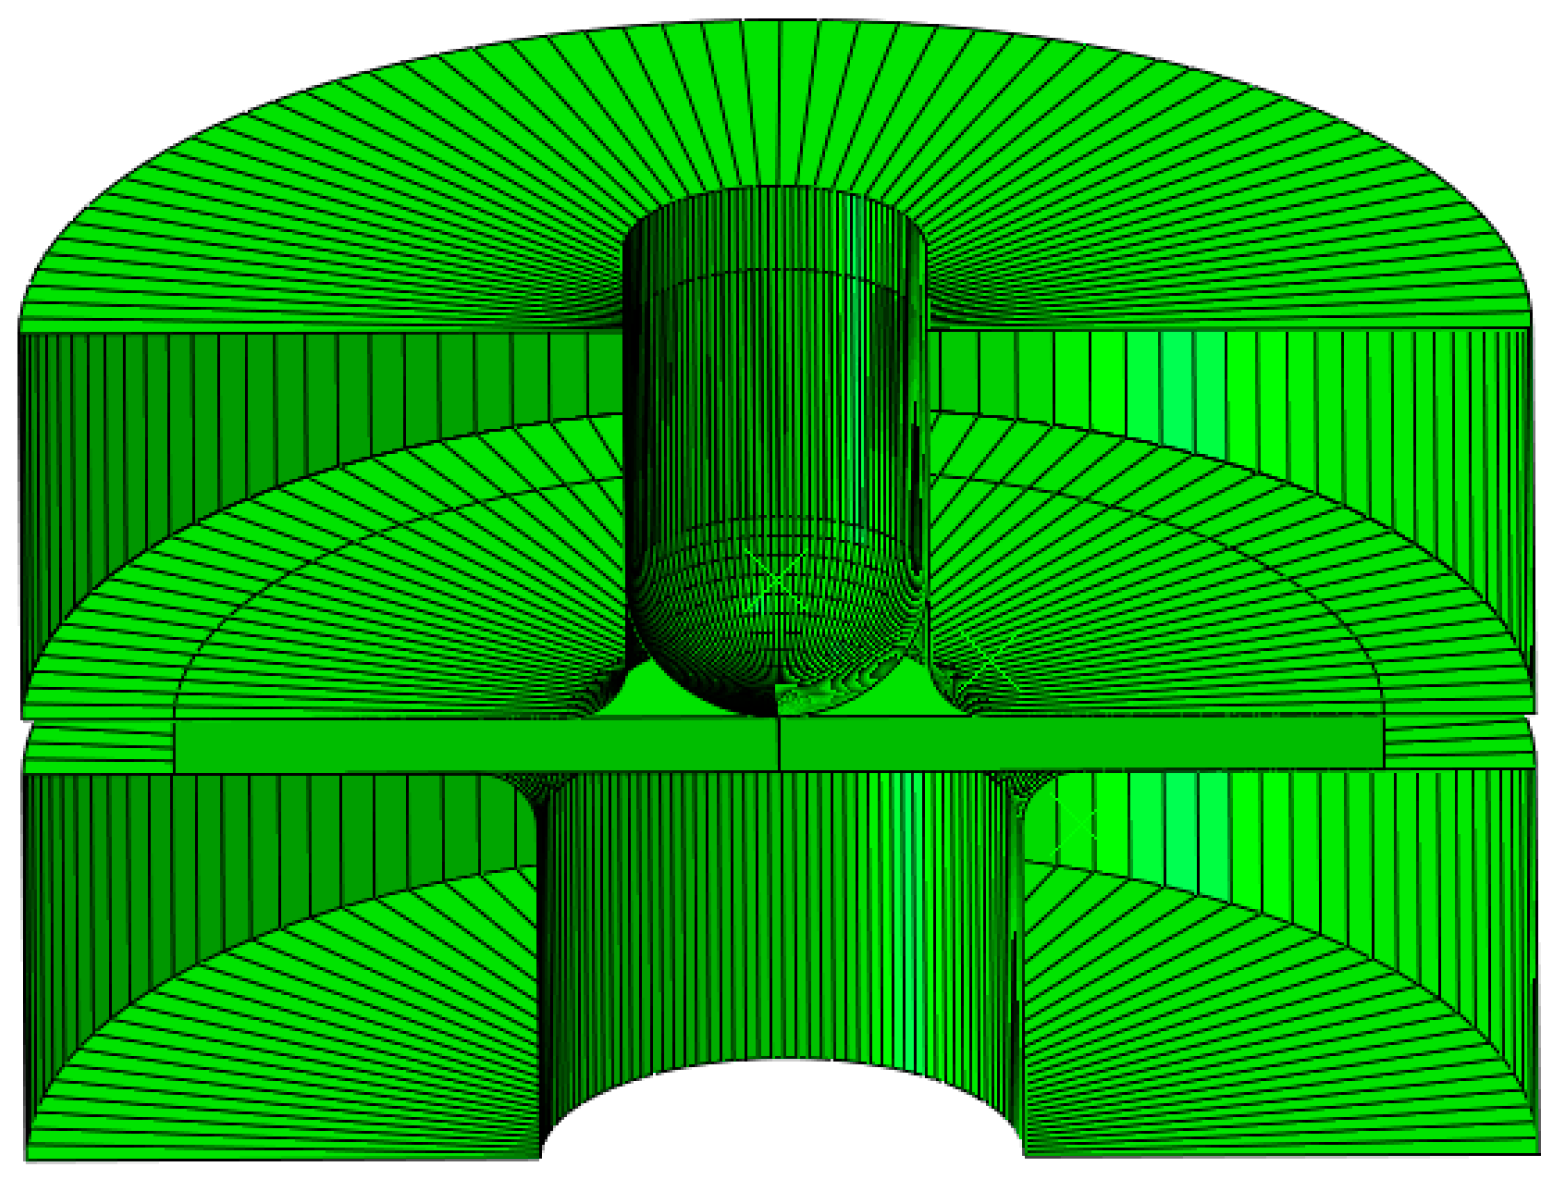
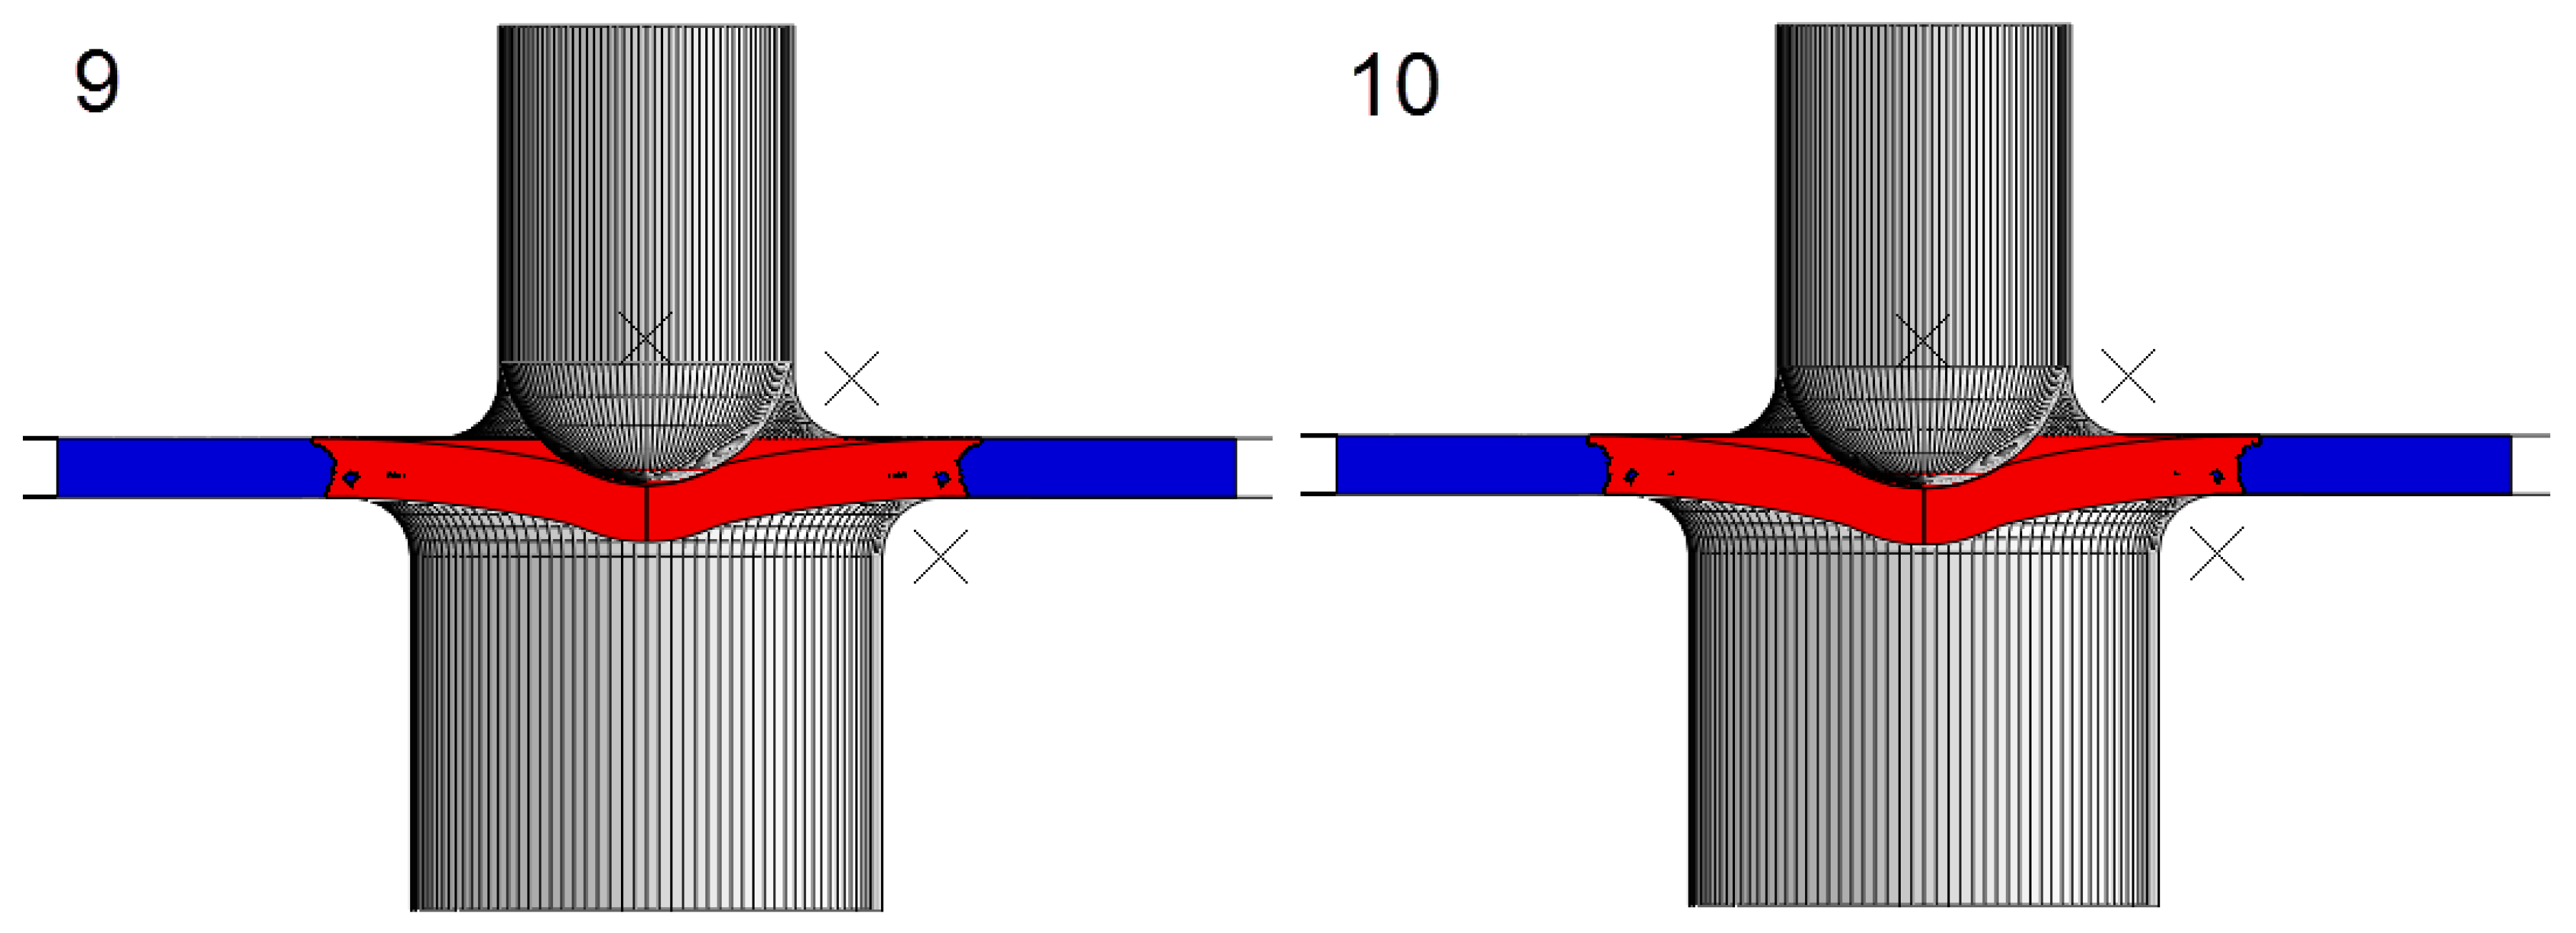
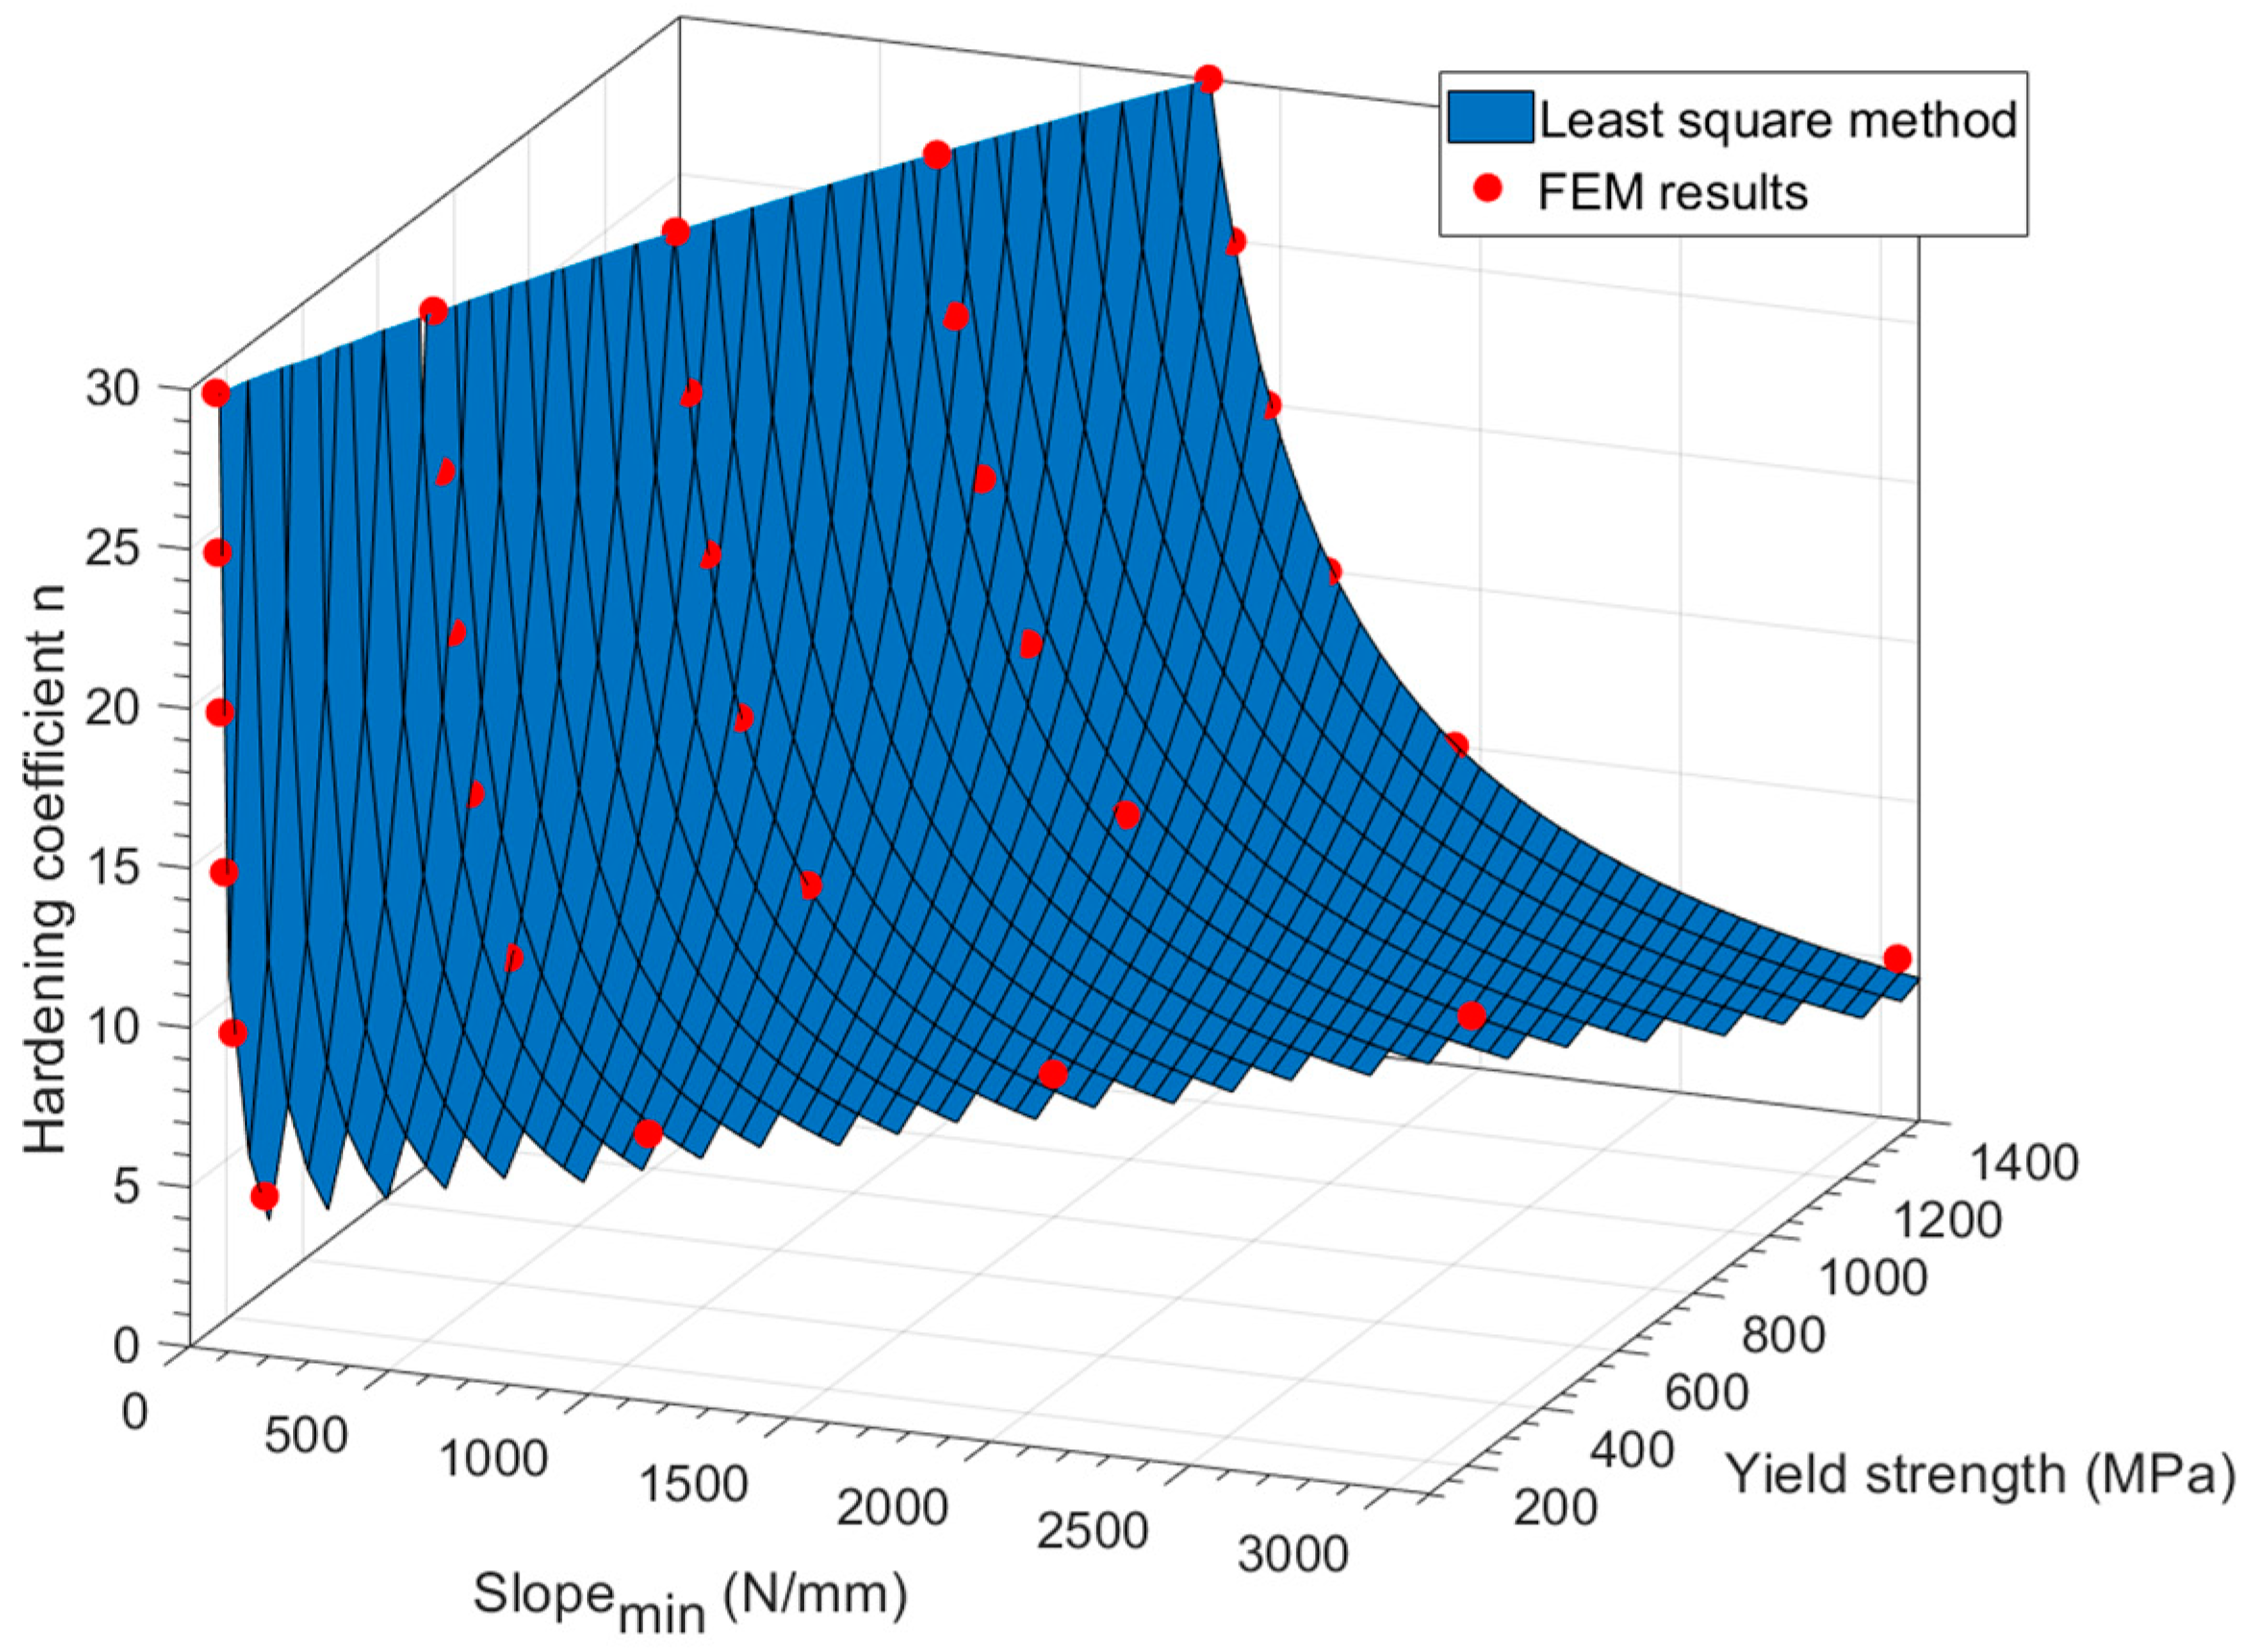
For the “SPT behavior analysis”, a FEM simulation of the SPT was performed with a simplified linear hardening model to make the search for correlation easier. The specific material properties of this hypothetical material were: E = 200,000 MPa, ν = 0.3, σy = 400 MPa, Ep = 413 MPa, where Ep is the plastic tangent modulus.
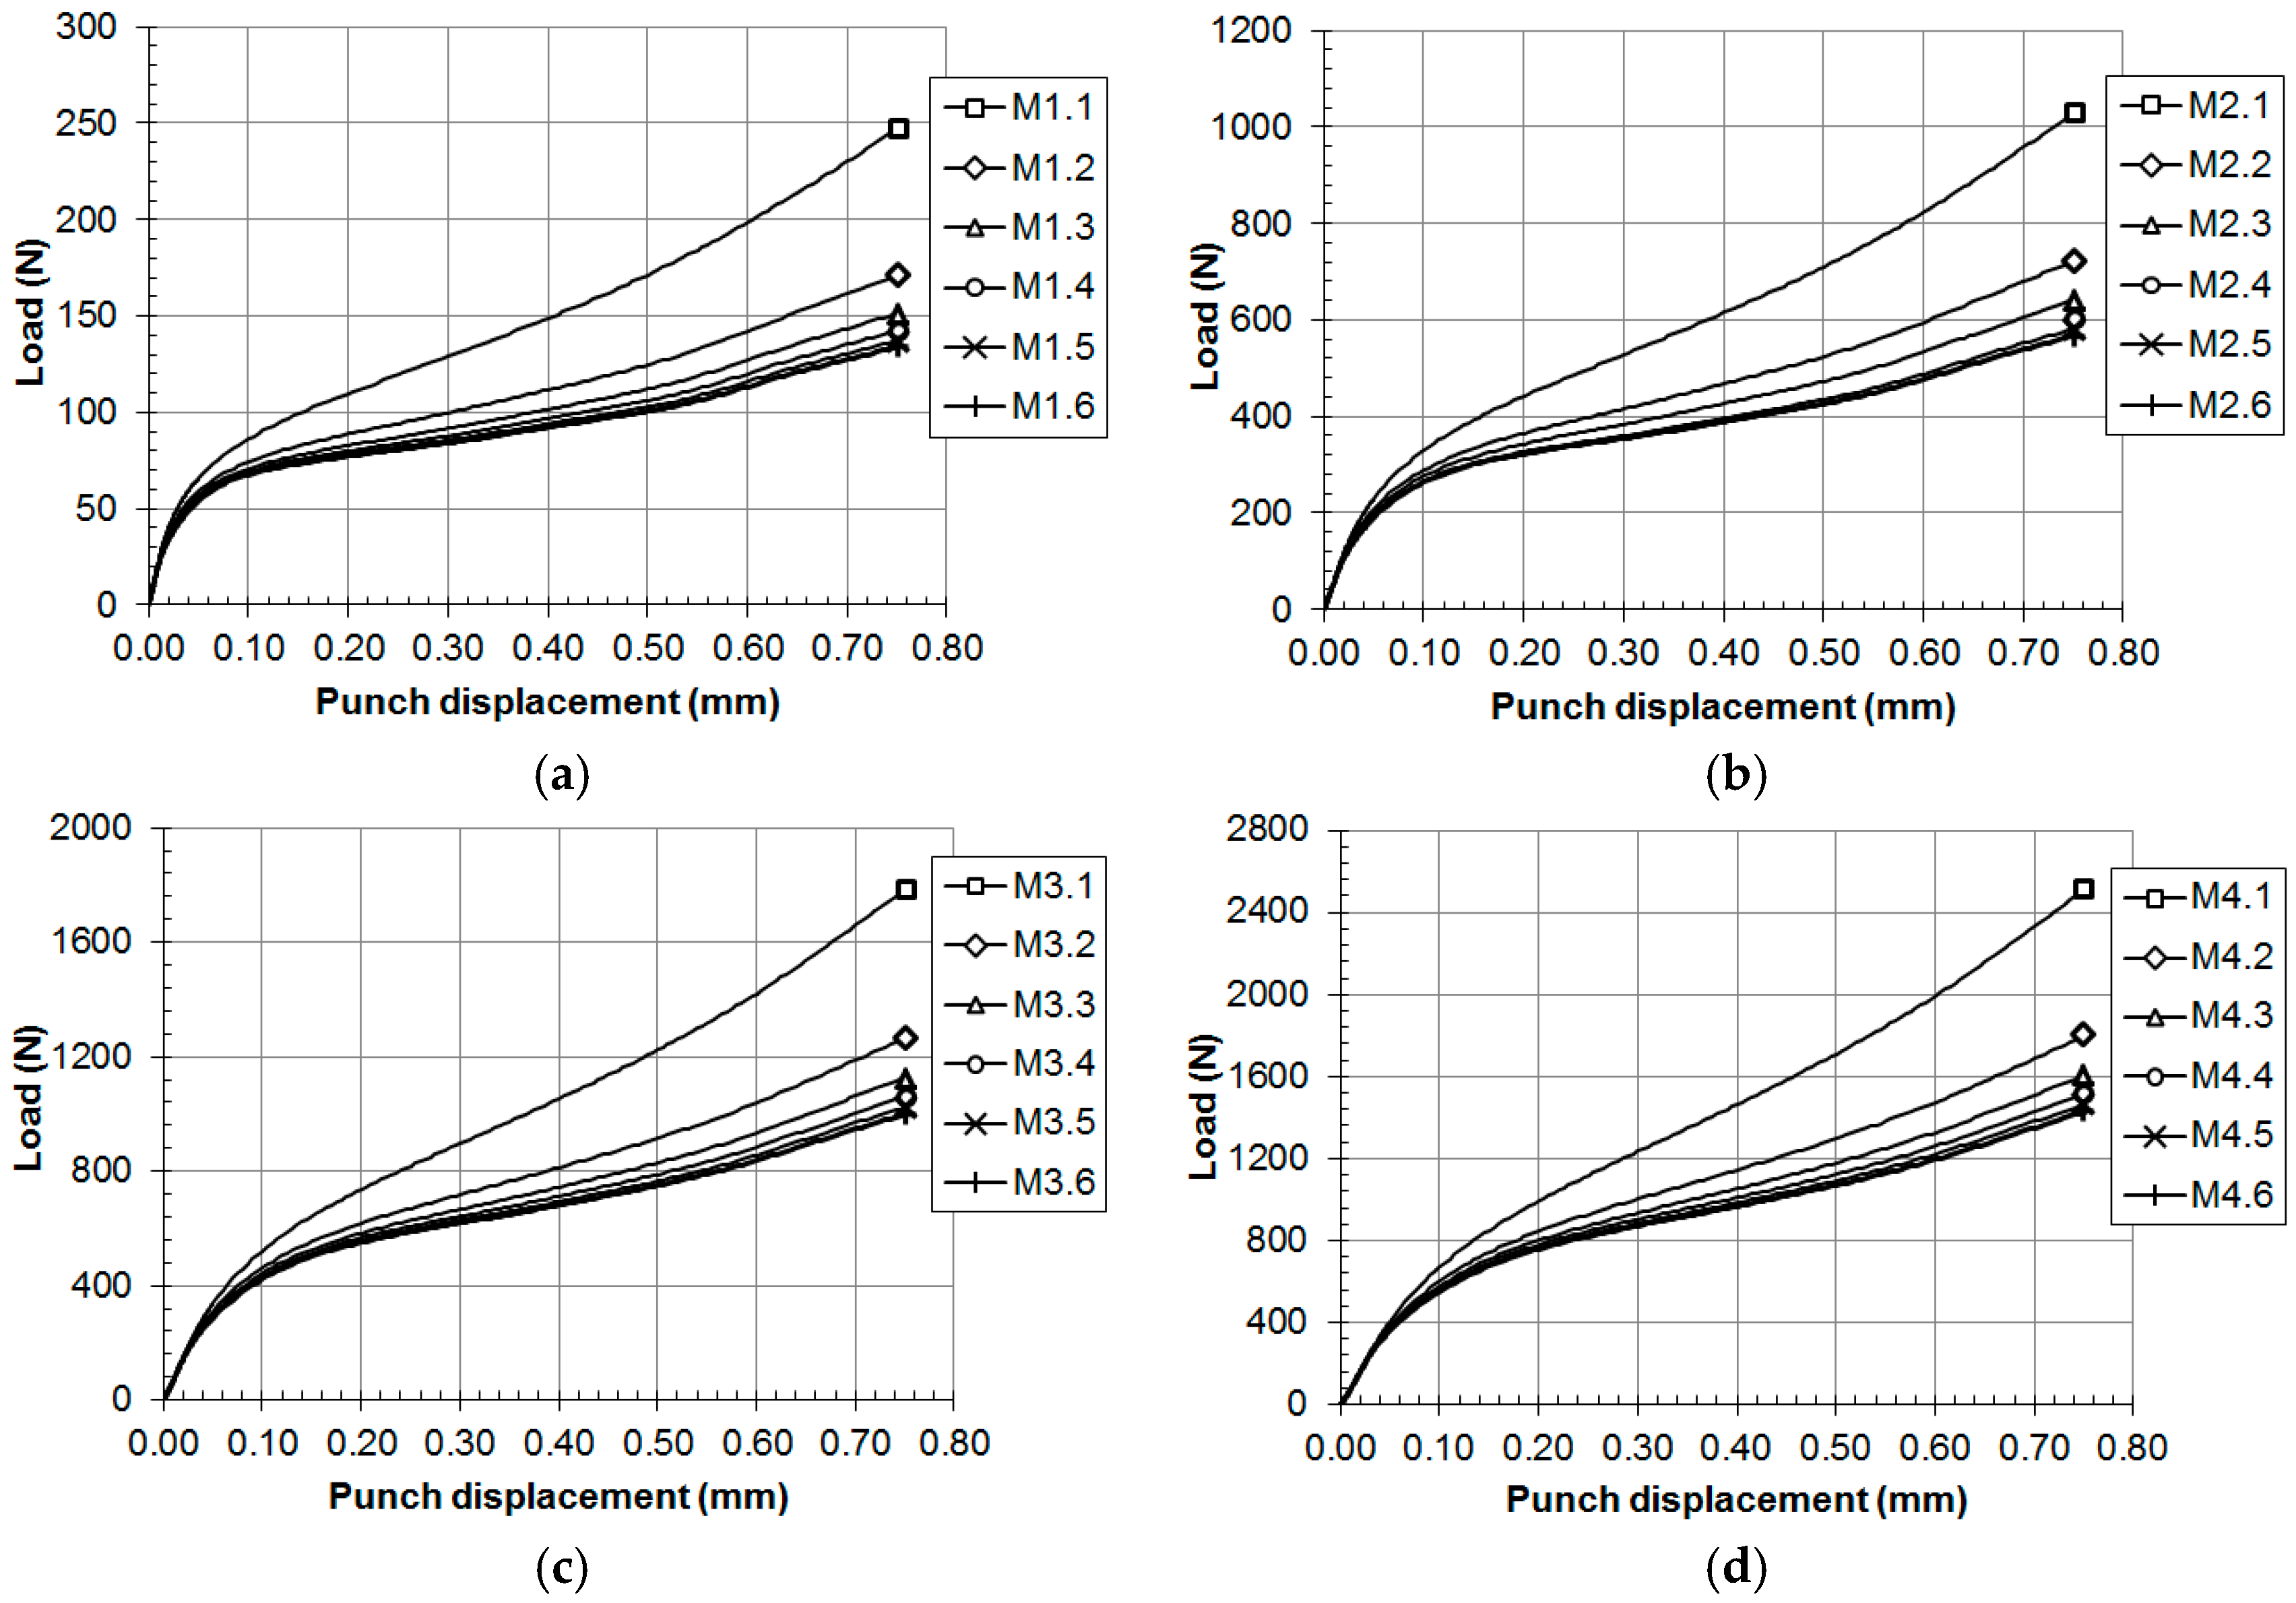
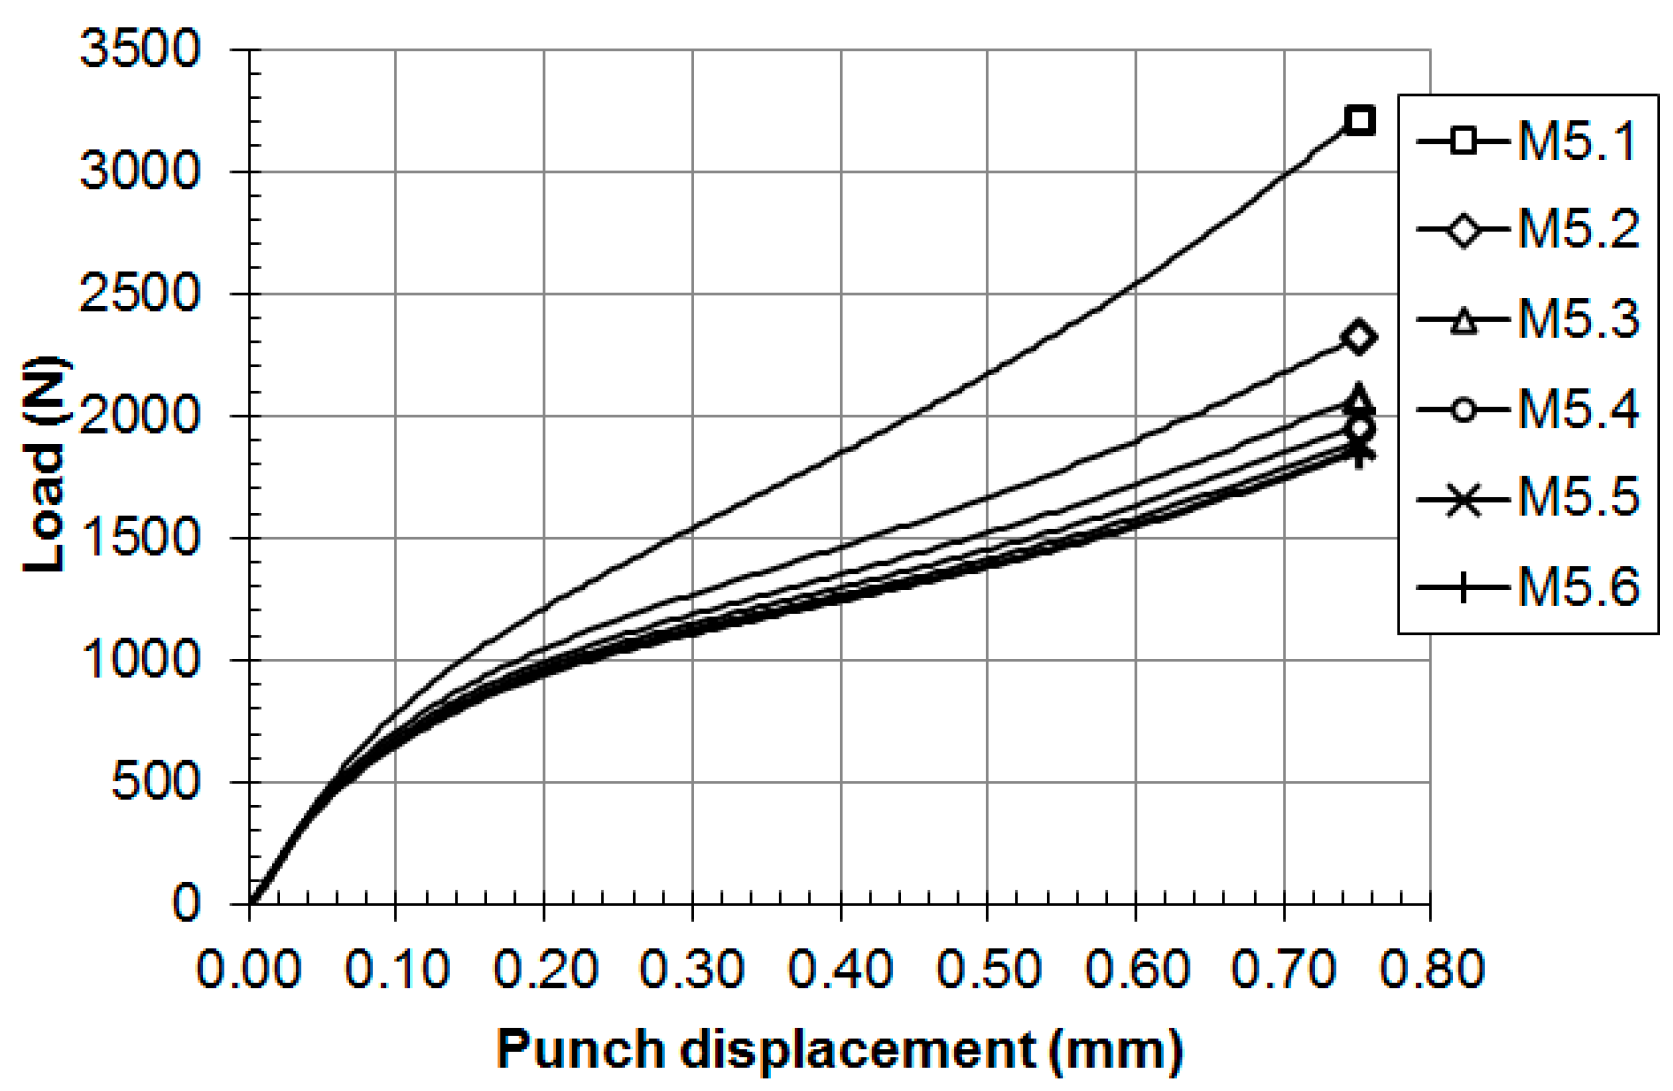
For the “Hypothetical material analysis”, 30 hypothetical materials were analyzed with an FEM simulation of the SPT. The hardening behavior applied in this analysis followed the Ramberg–Osgood Equations (4) and (5) with an isotropic hardening model.
The mechanical properties assigned for these hypothetical materials were fixed for their elastic behavior (
E = 200,000 MPa and
ν = 0.3), and were established as shown in
Table 1 for their plastic behavior.
The SPT dimensions used in this numerical analysis were:
Rd = 2.0 mm,
Rp = 1.25 mm,
r = 0.5 mm, and
t = 0.5 mm (see
Figure 1).
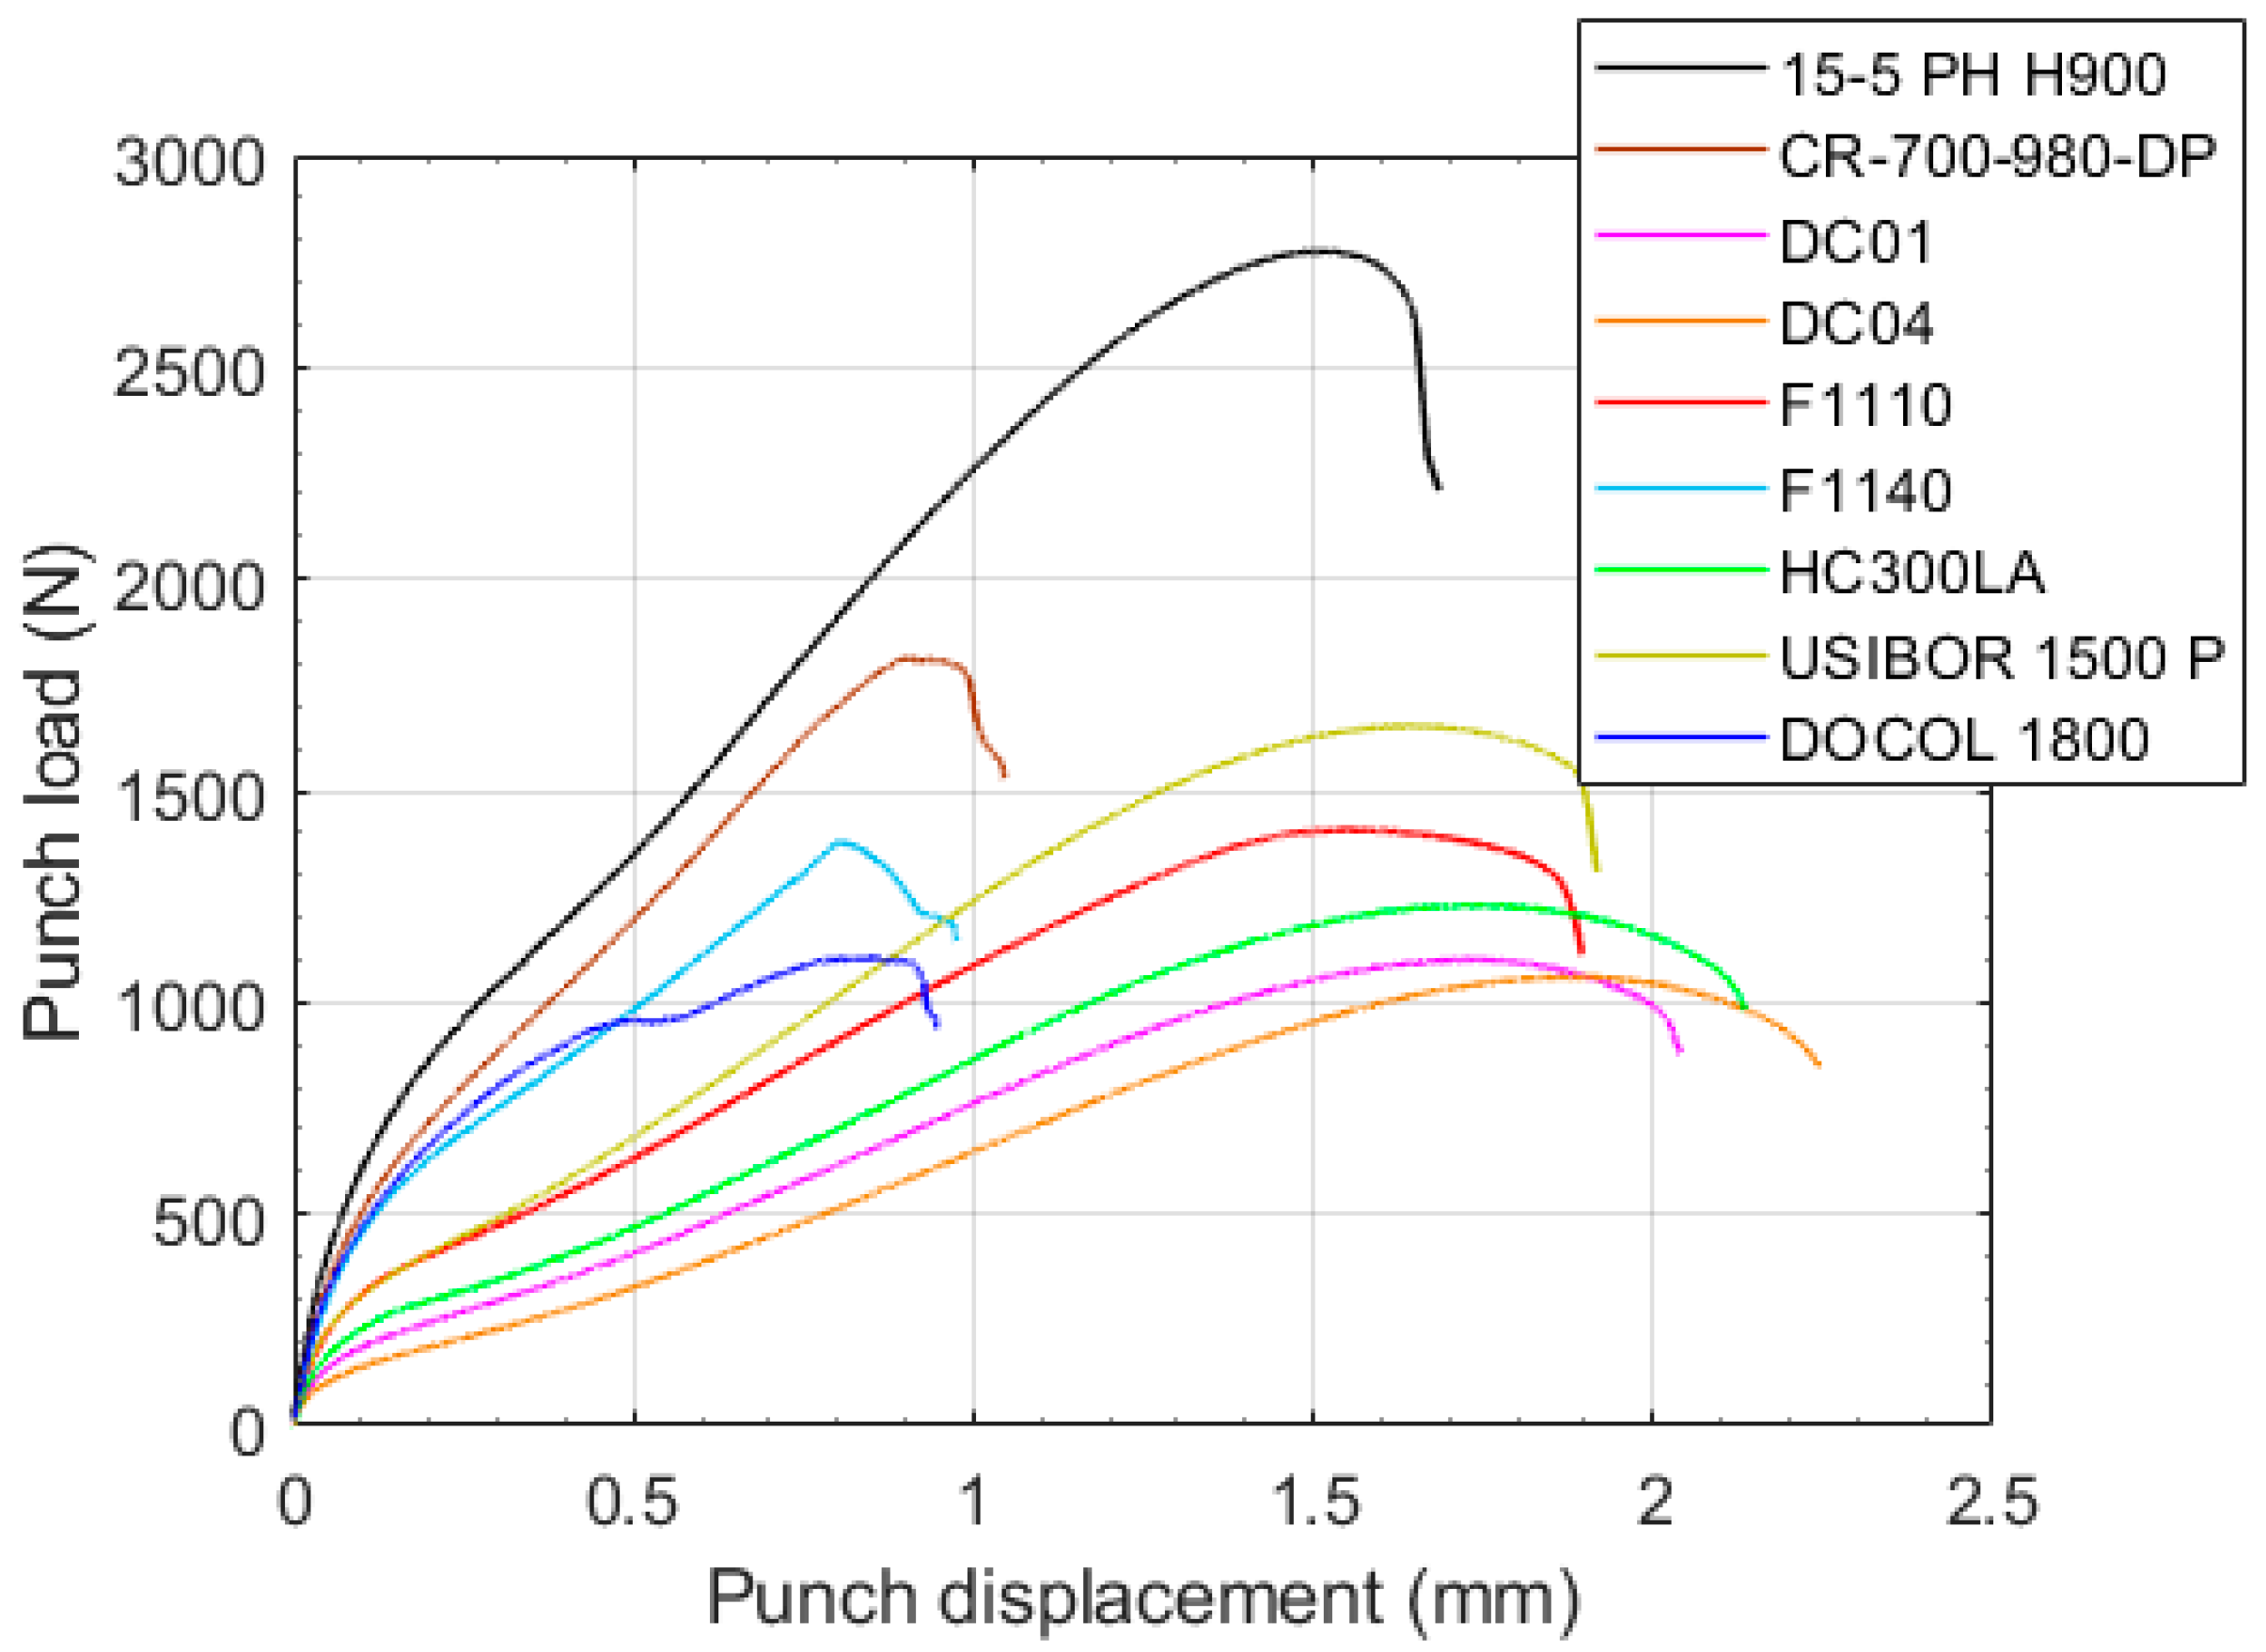
Nine steel alloys were used in the experimental procedure, and their mechanical properties were obtained with tensile tests following ASTM E8M [
21] (see
Table 2). Some of these experimental data were obtained in previous research [
22].


