Experimental and FEM Studies on Secondary Co-Curing Reinforcement of Laminates


Abstract
1. Introduction
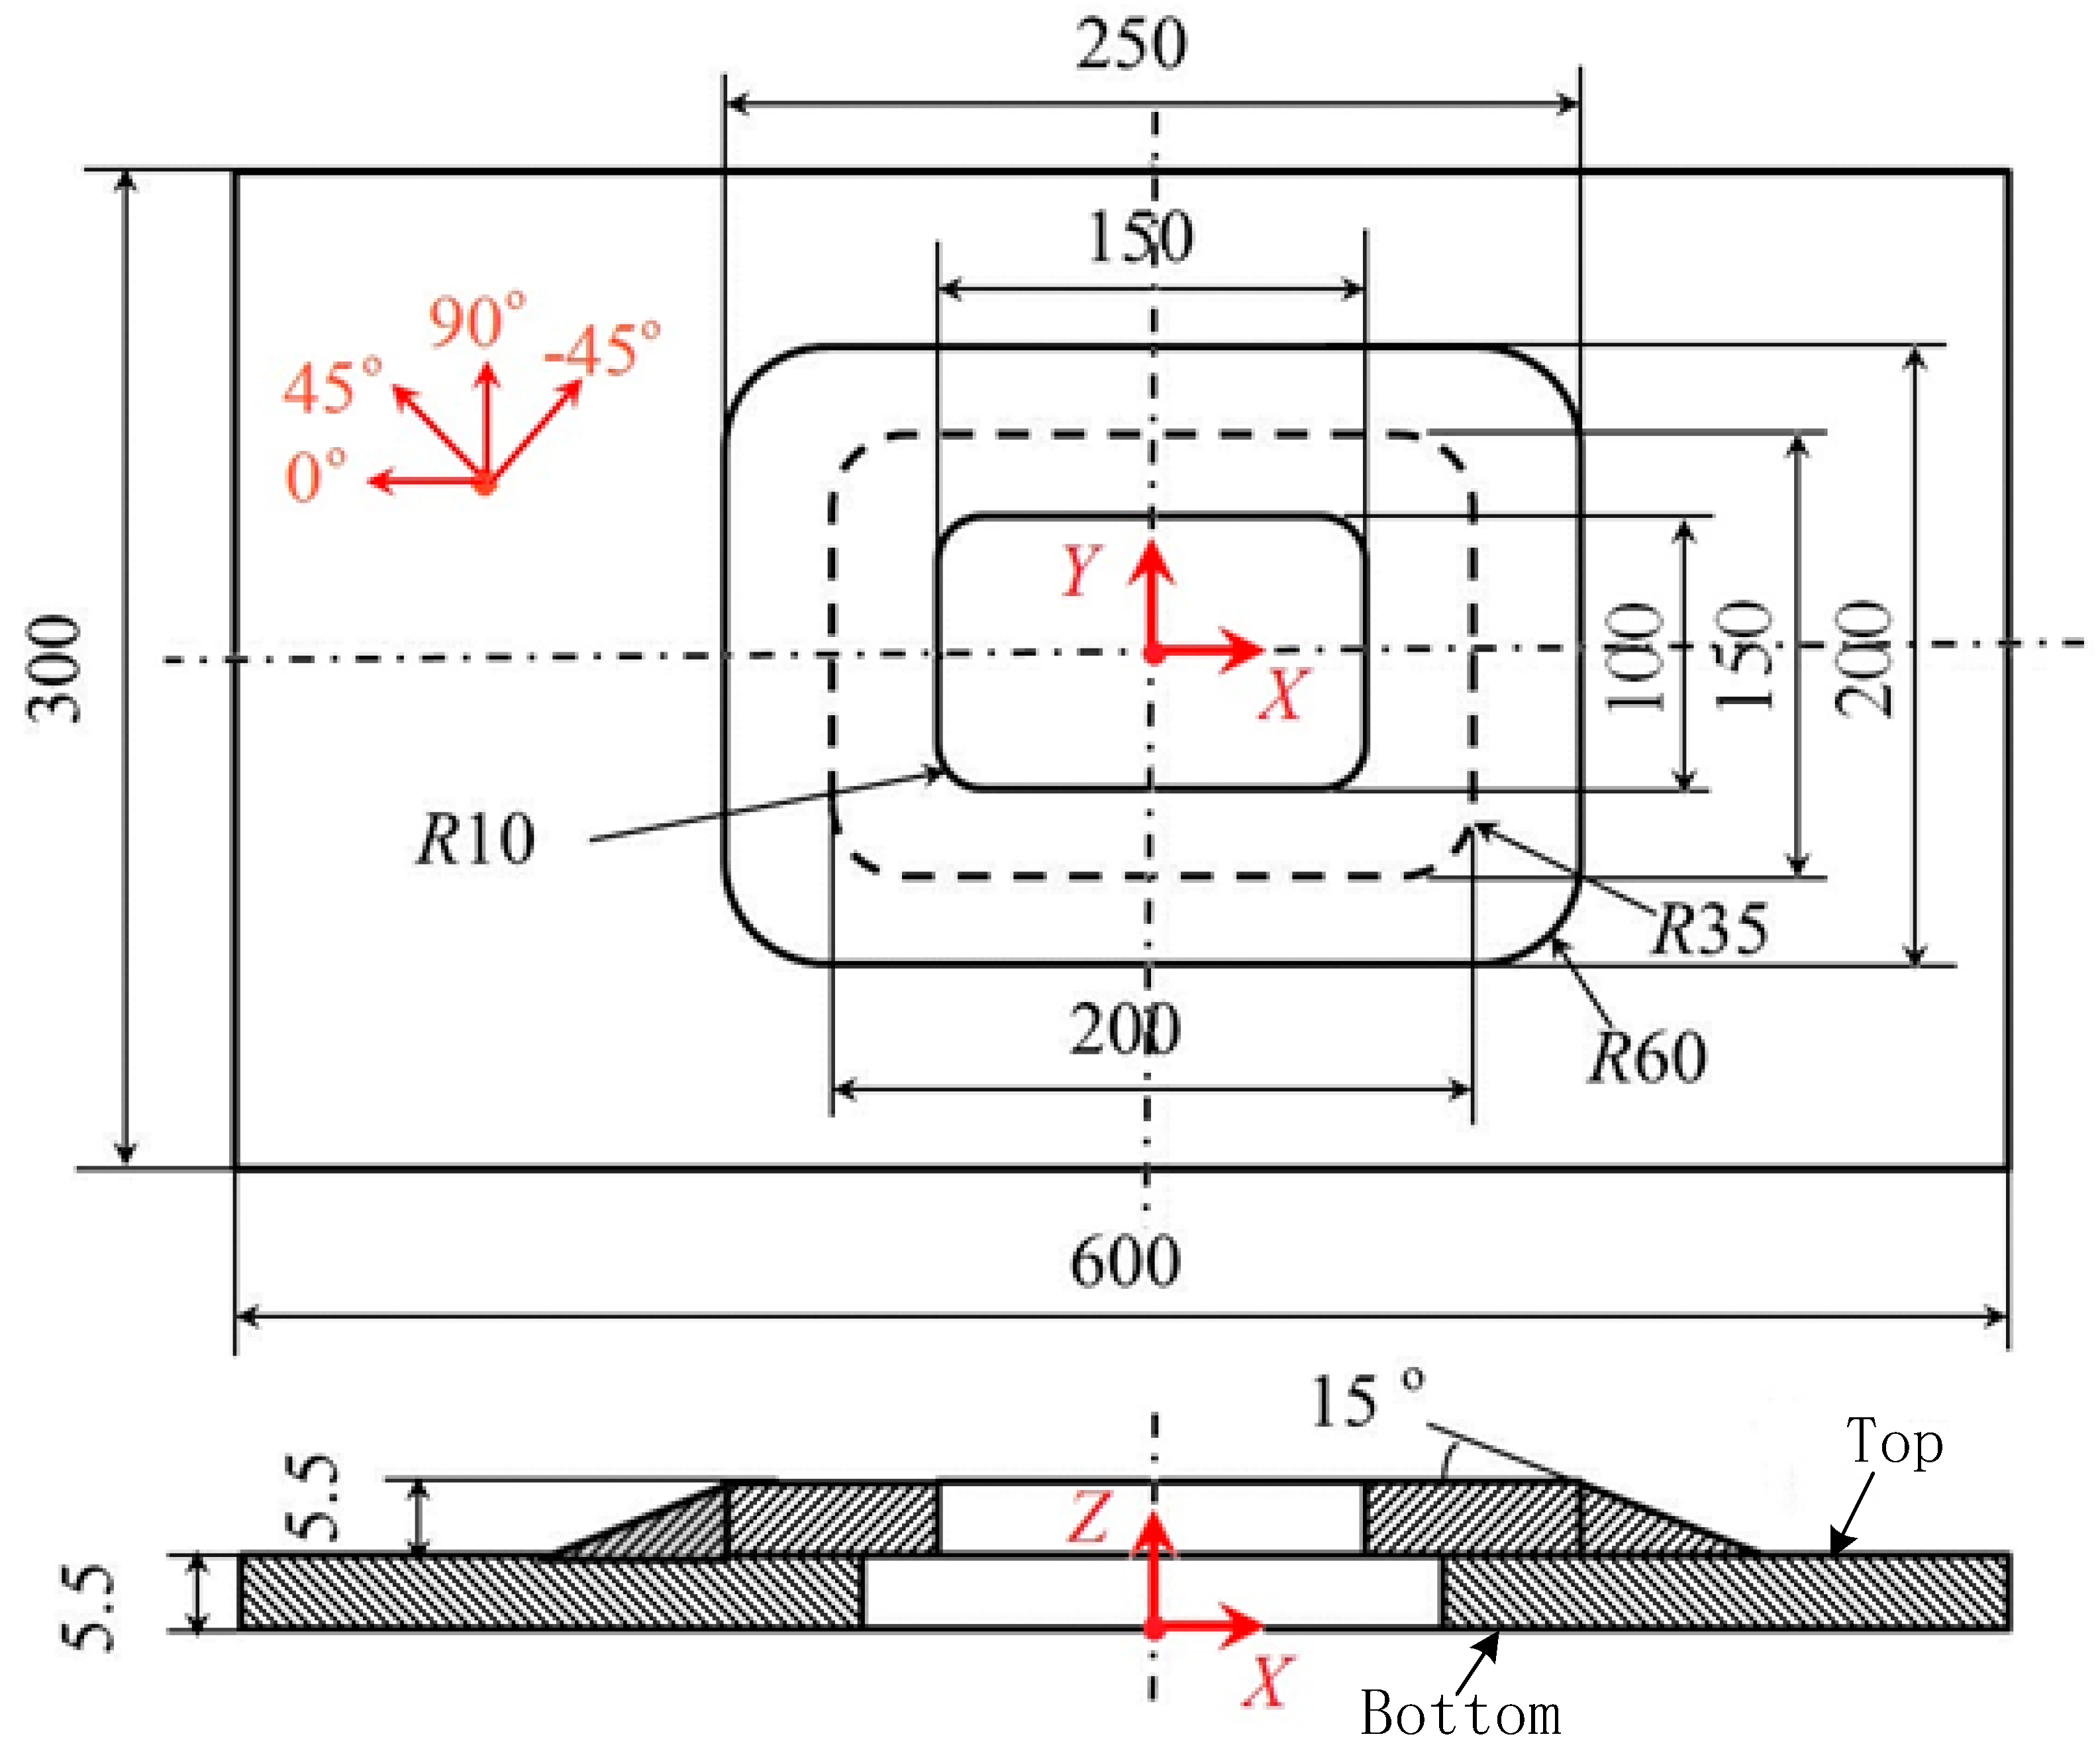
2. Specimen
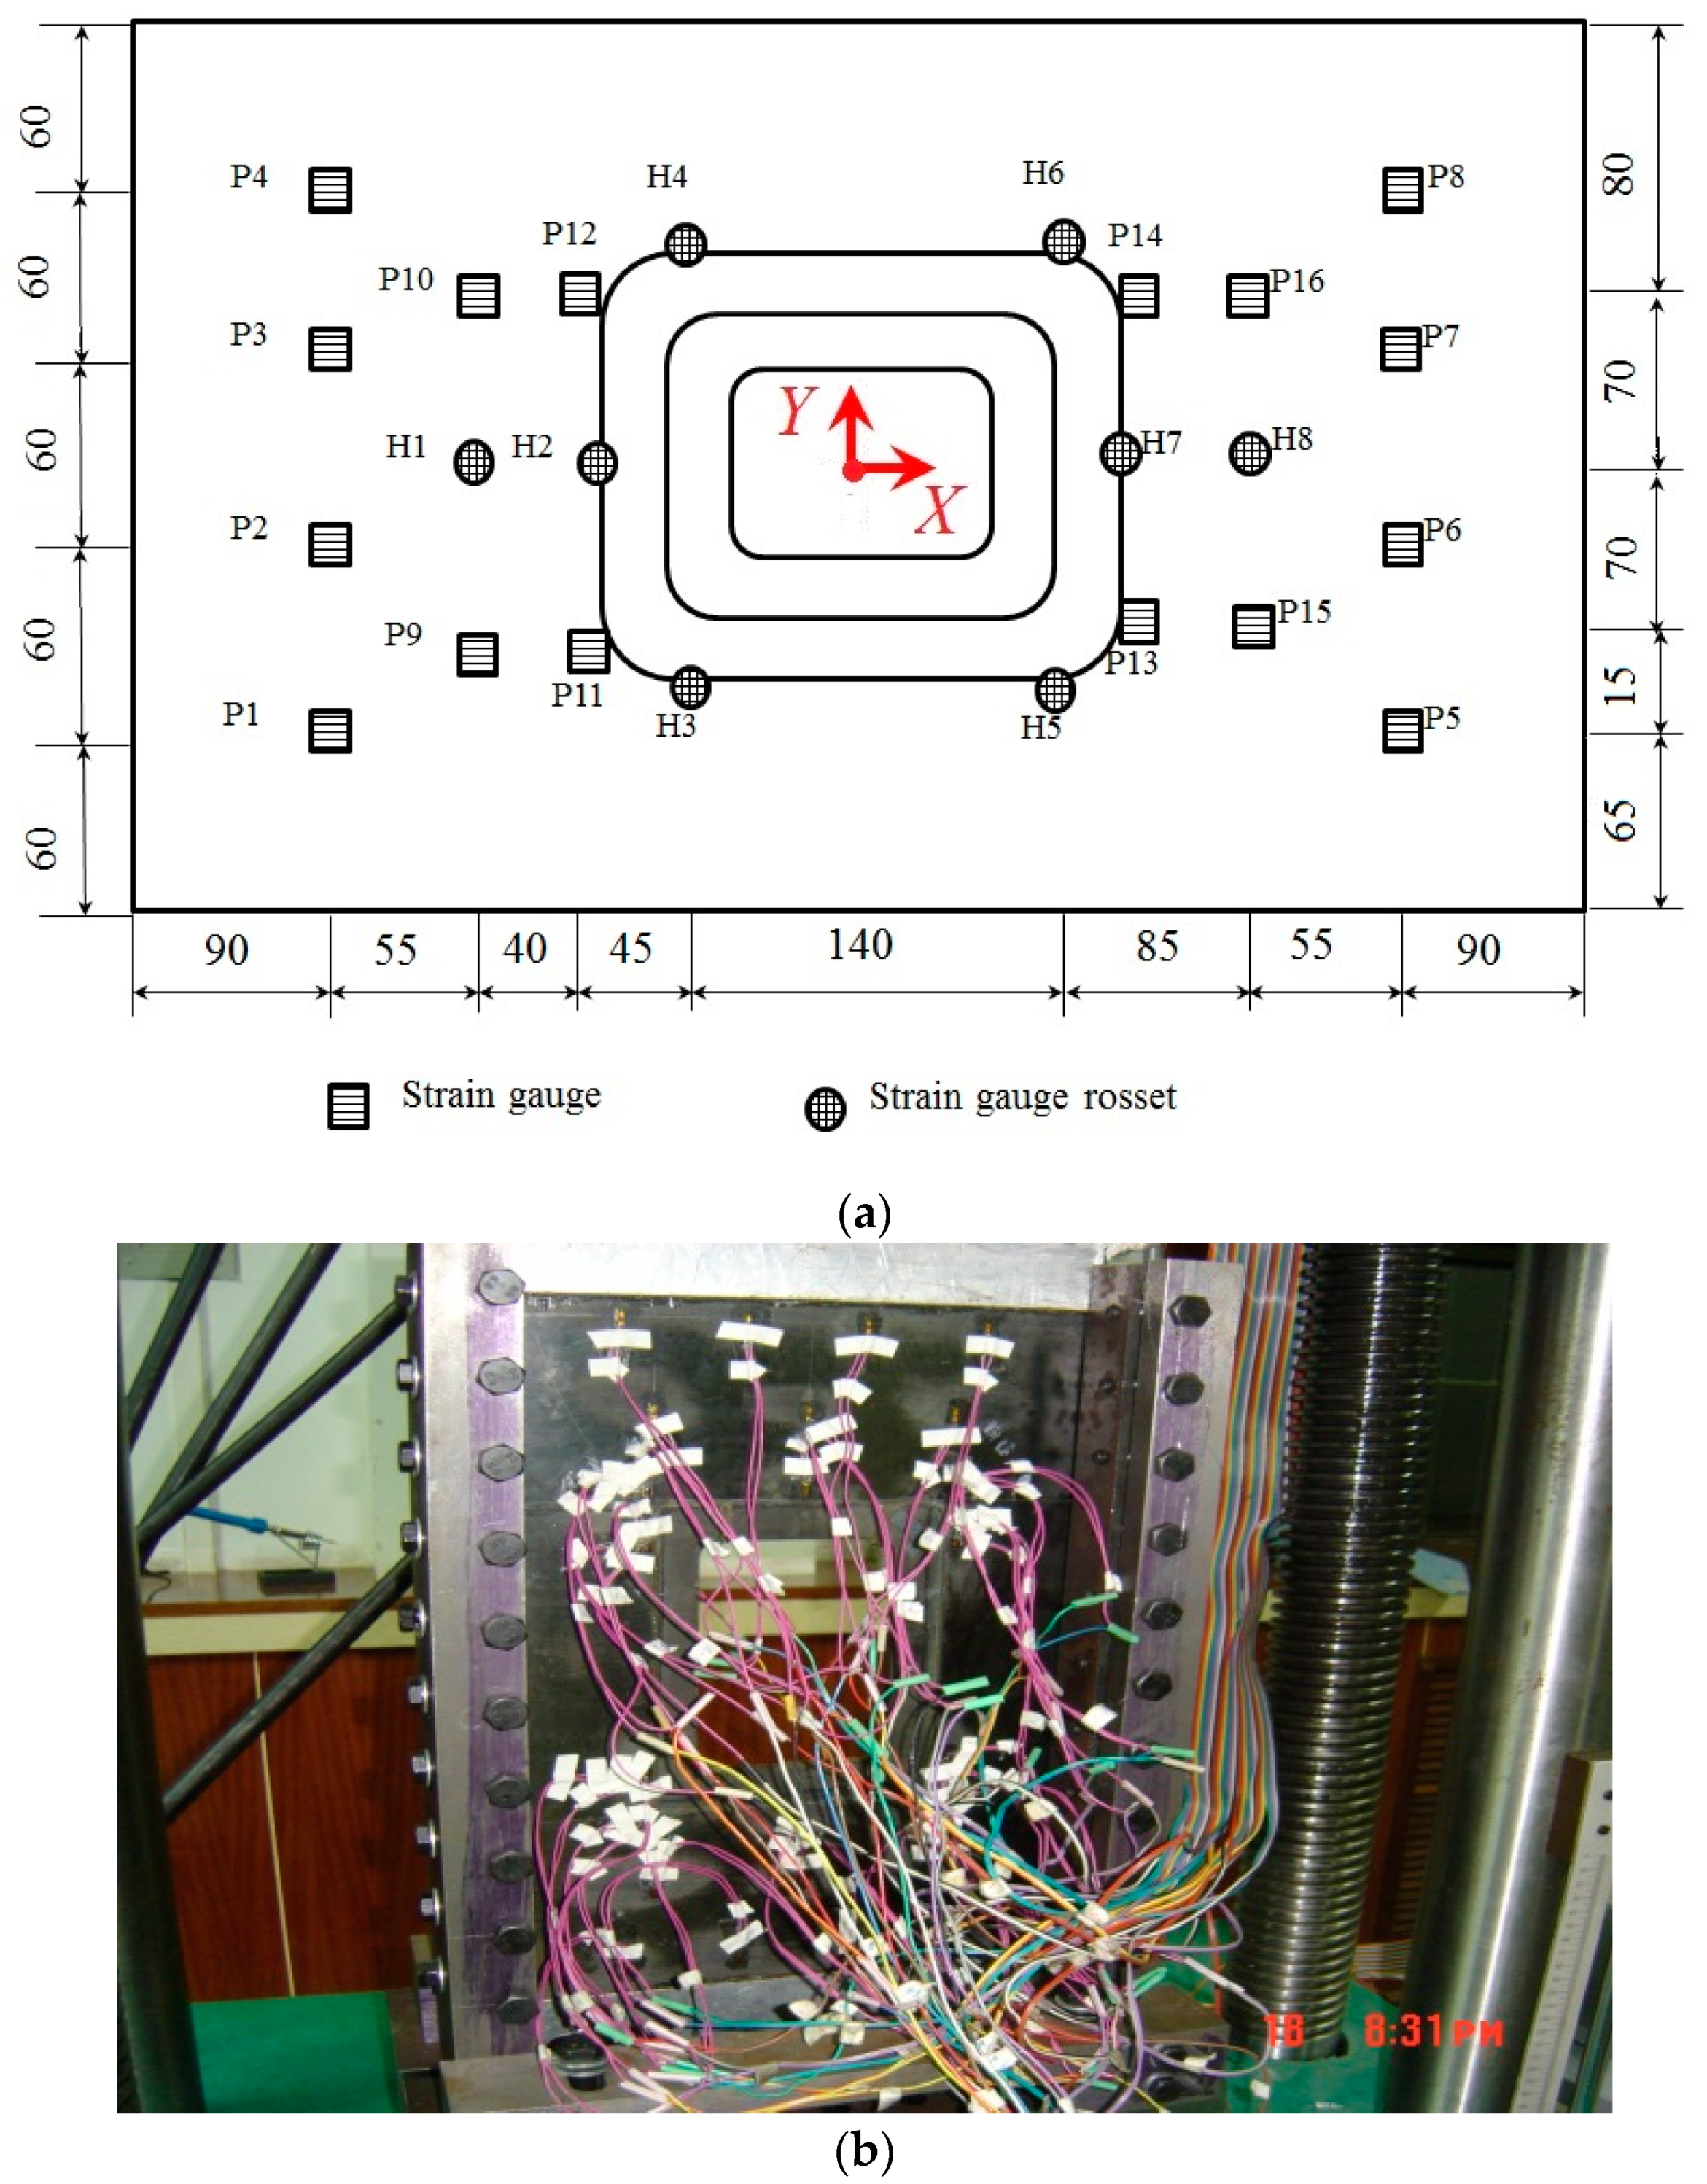
3. Experiments and Finite Element Modeling
4. Results and Discussions
4.1. Comparison between Unreinforced and Repaired Panels
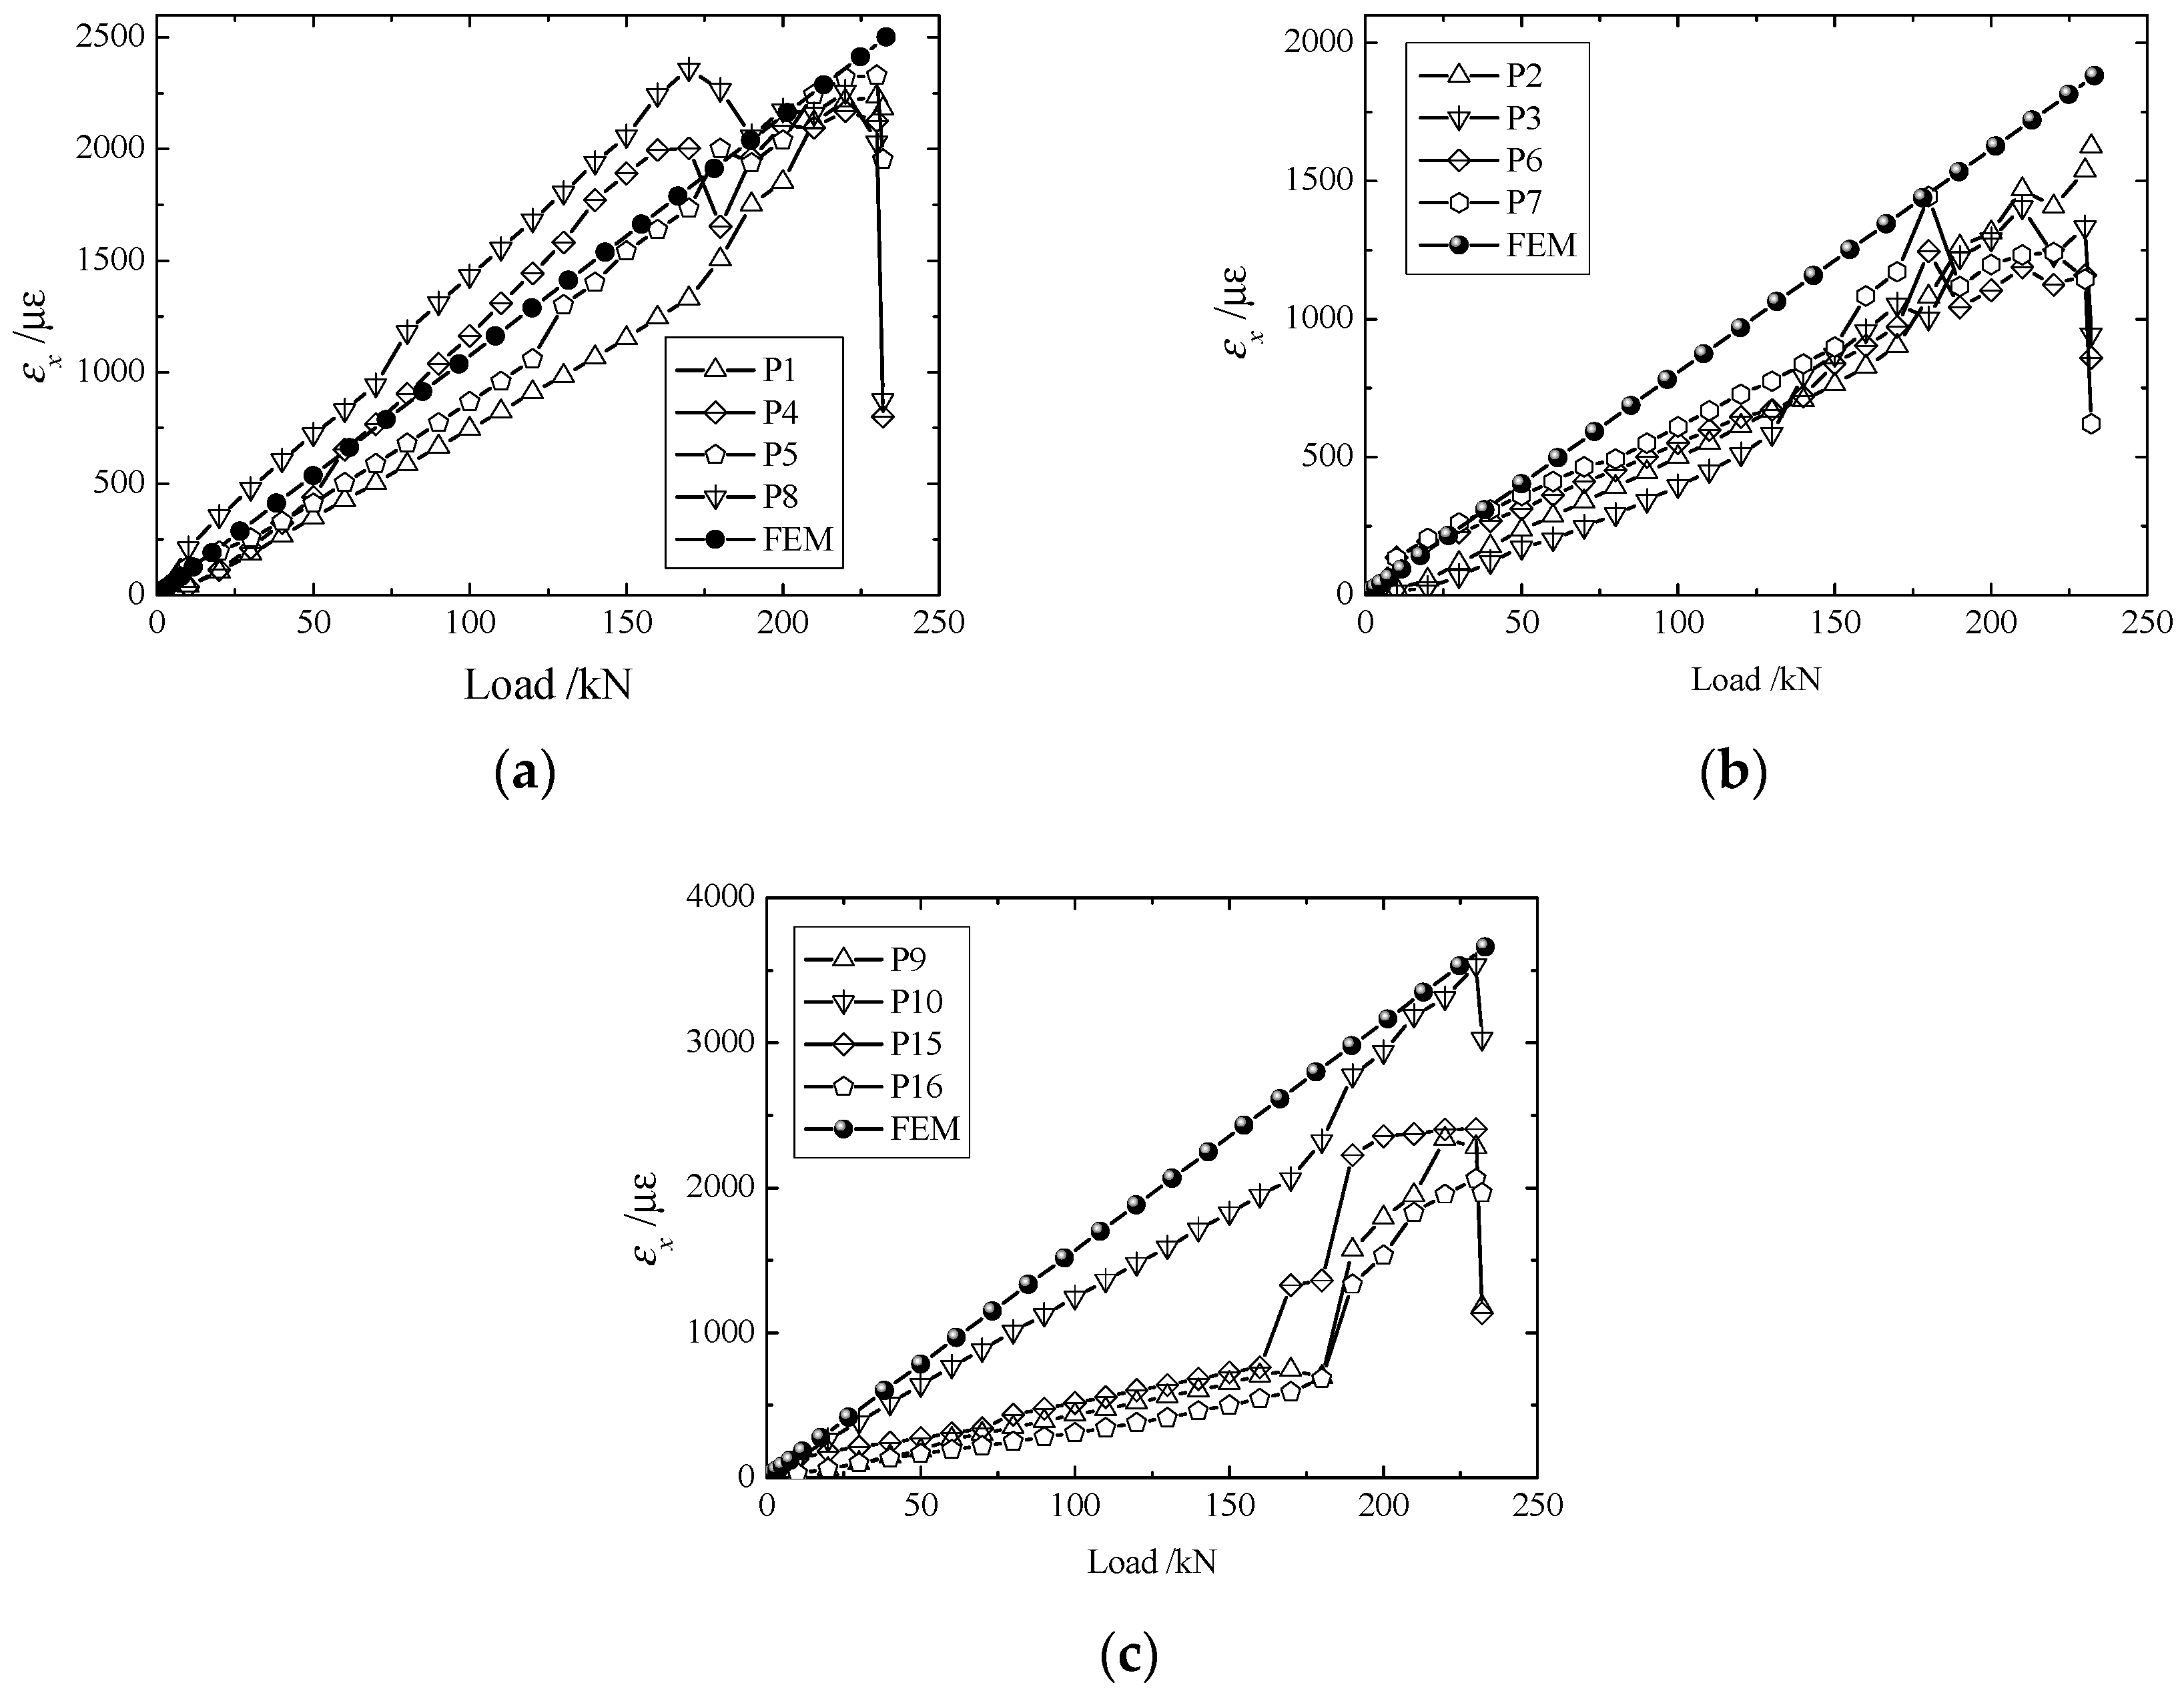
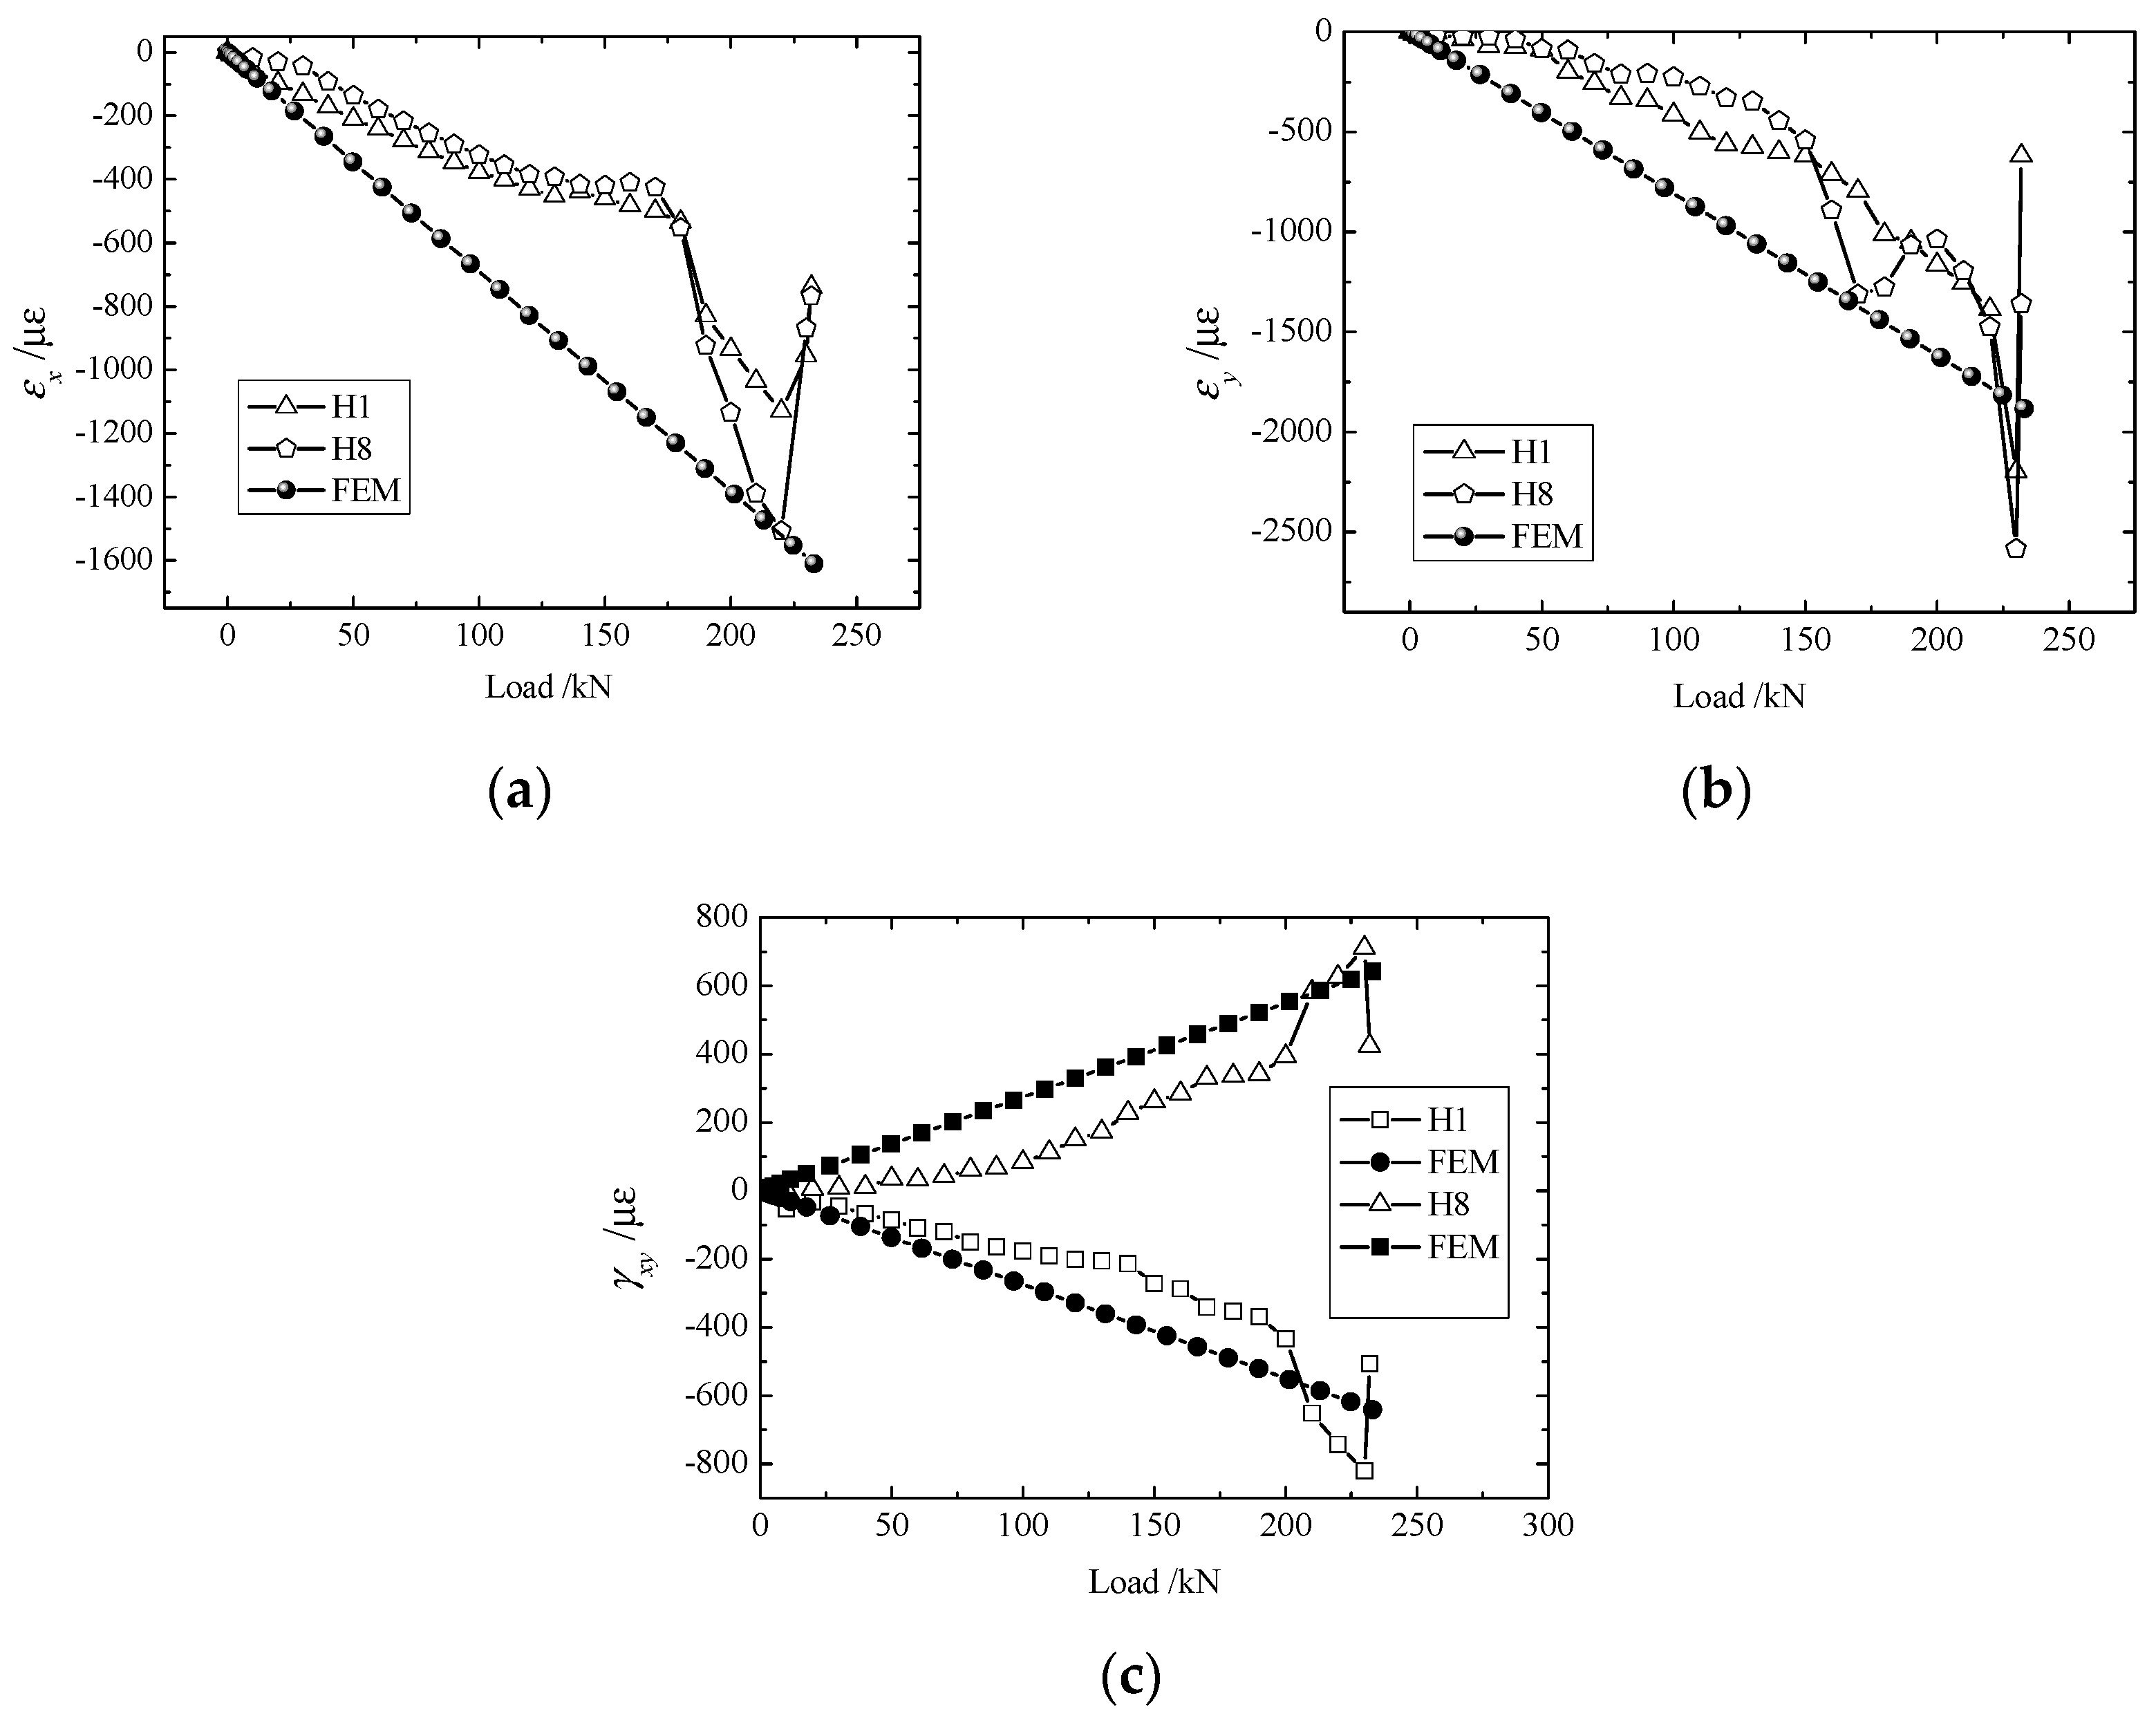
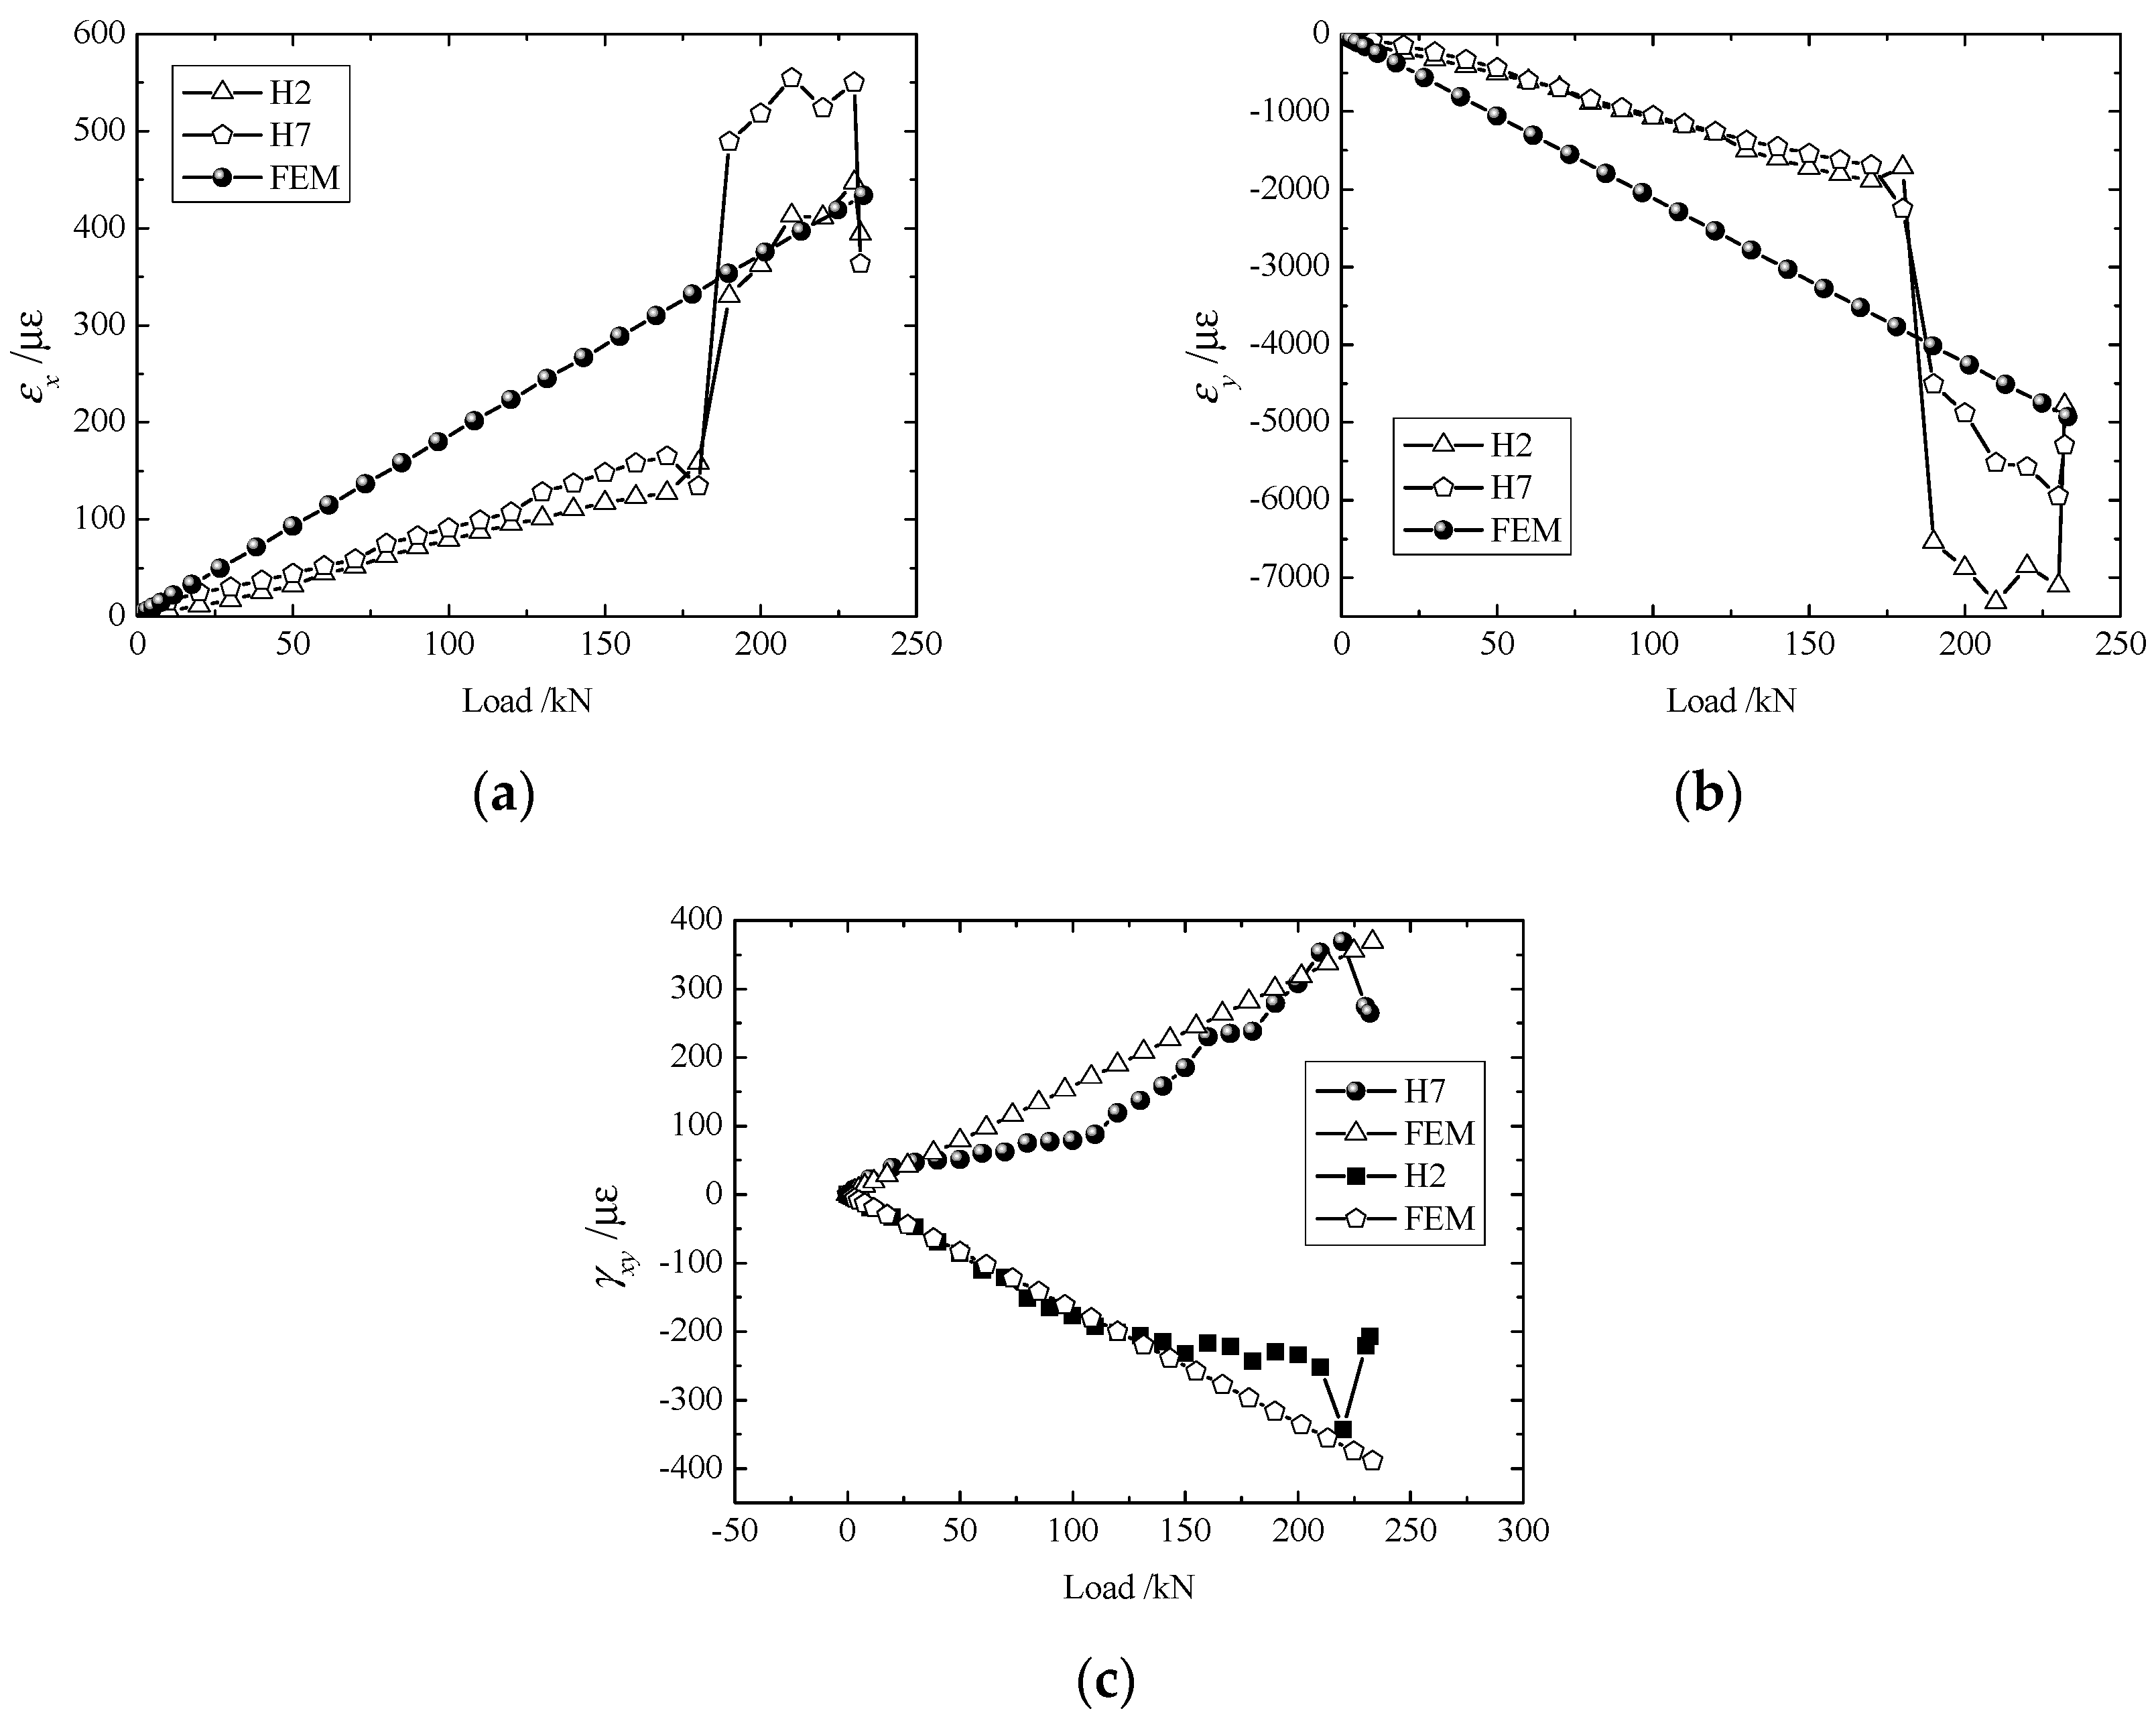
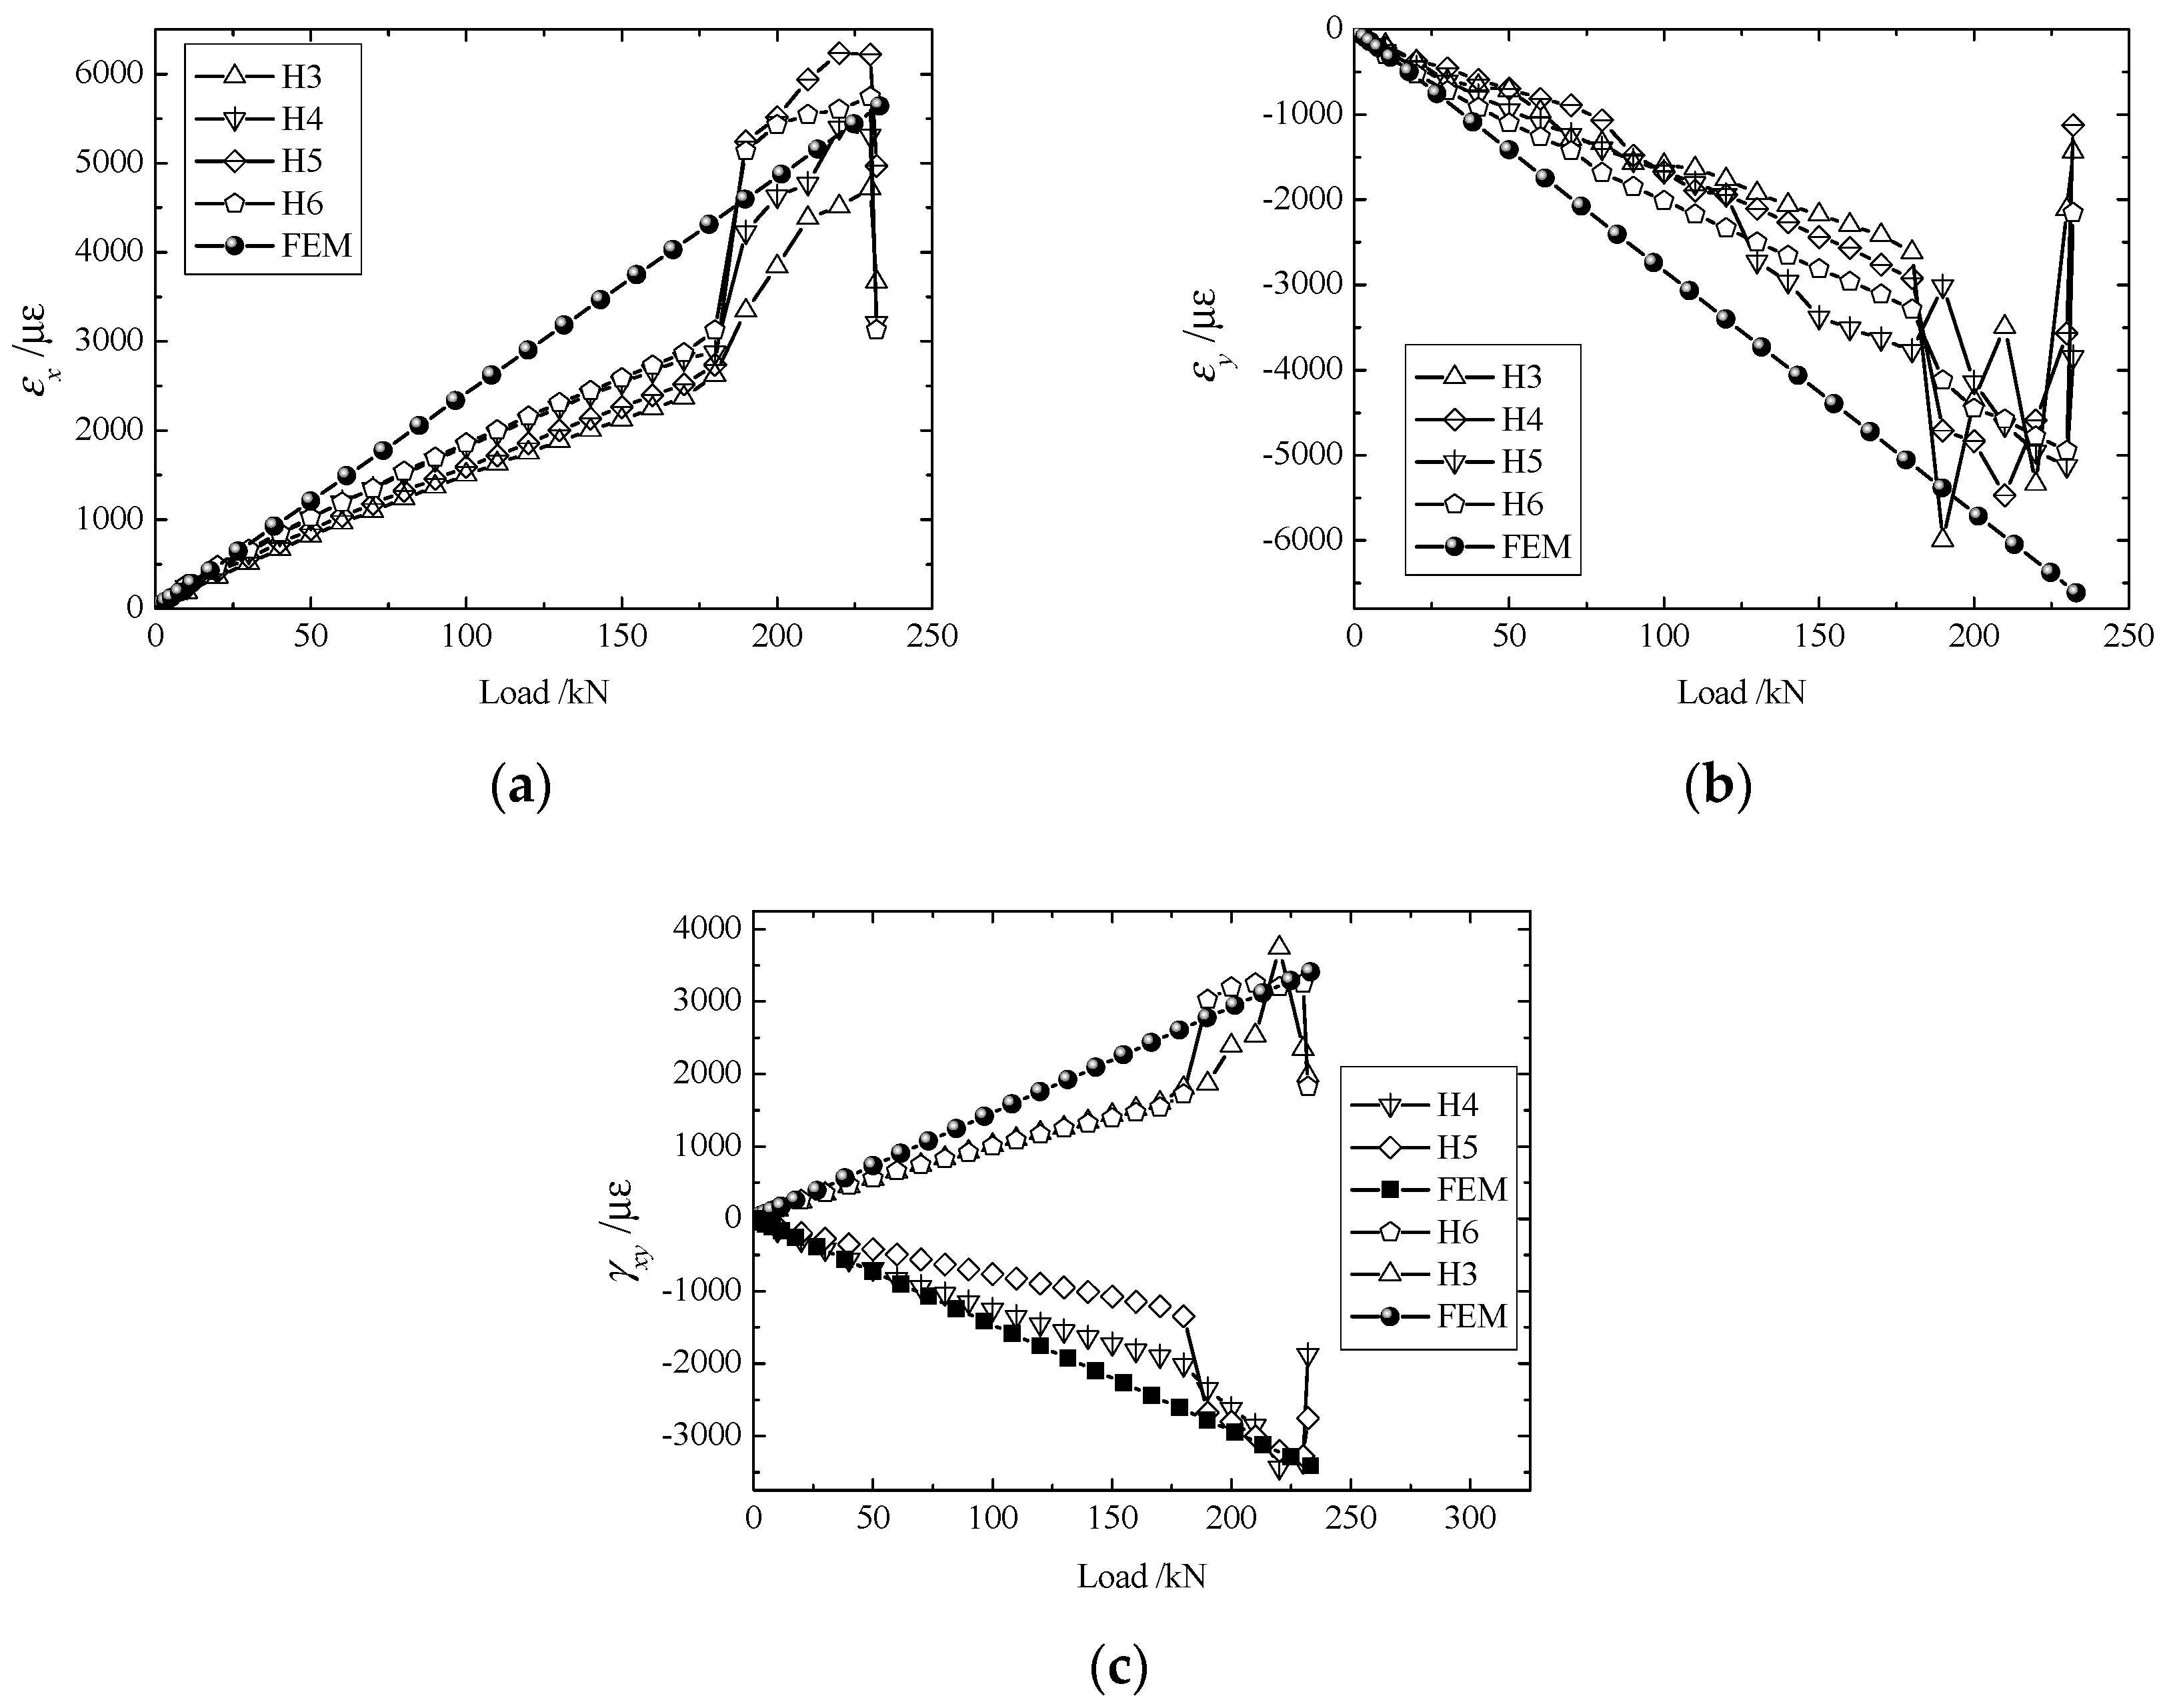
4.2. Load-Strain Curves
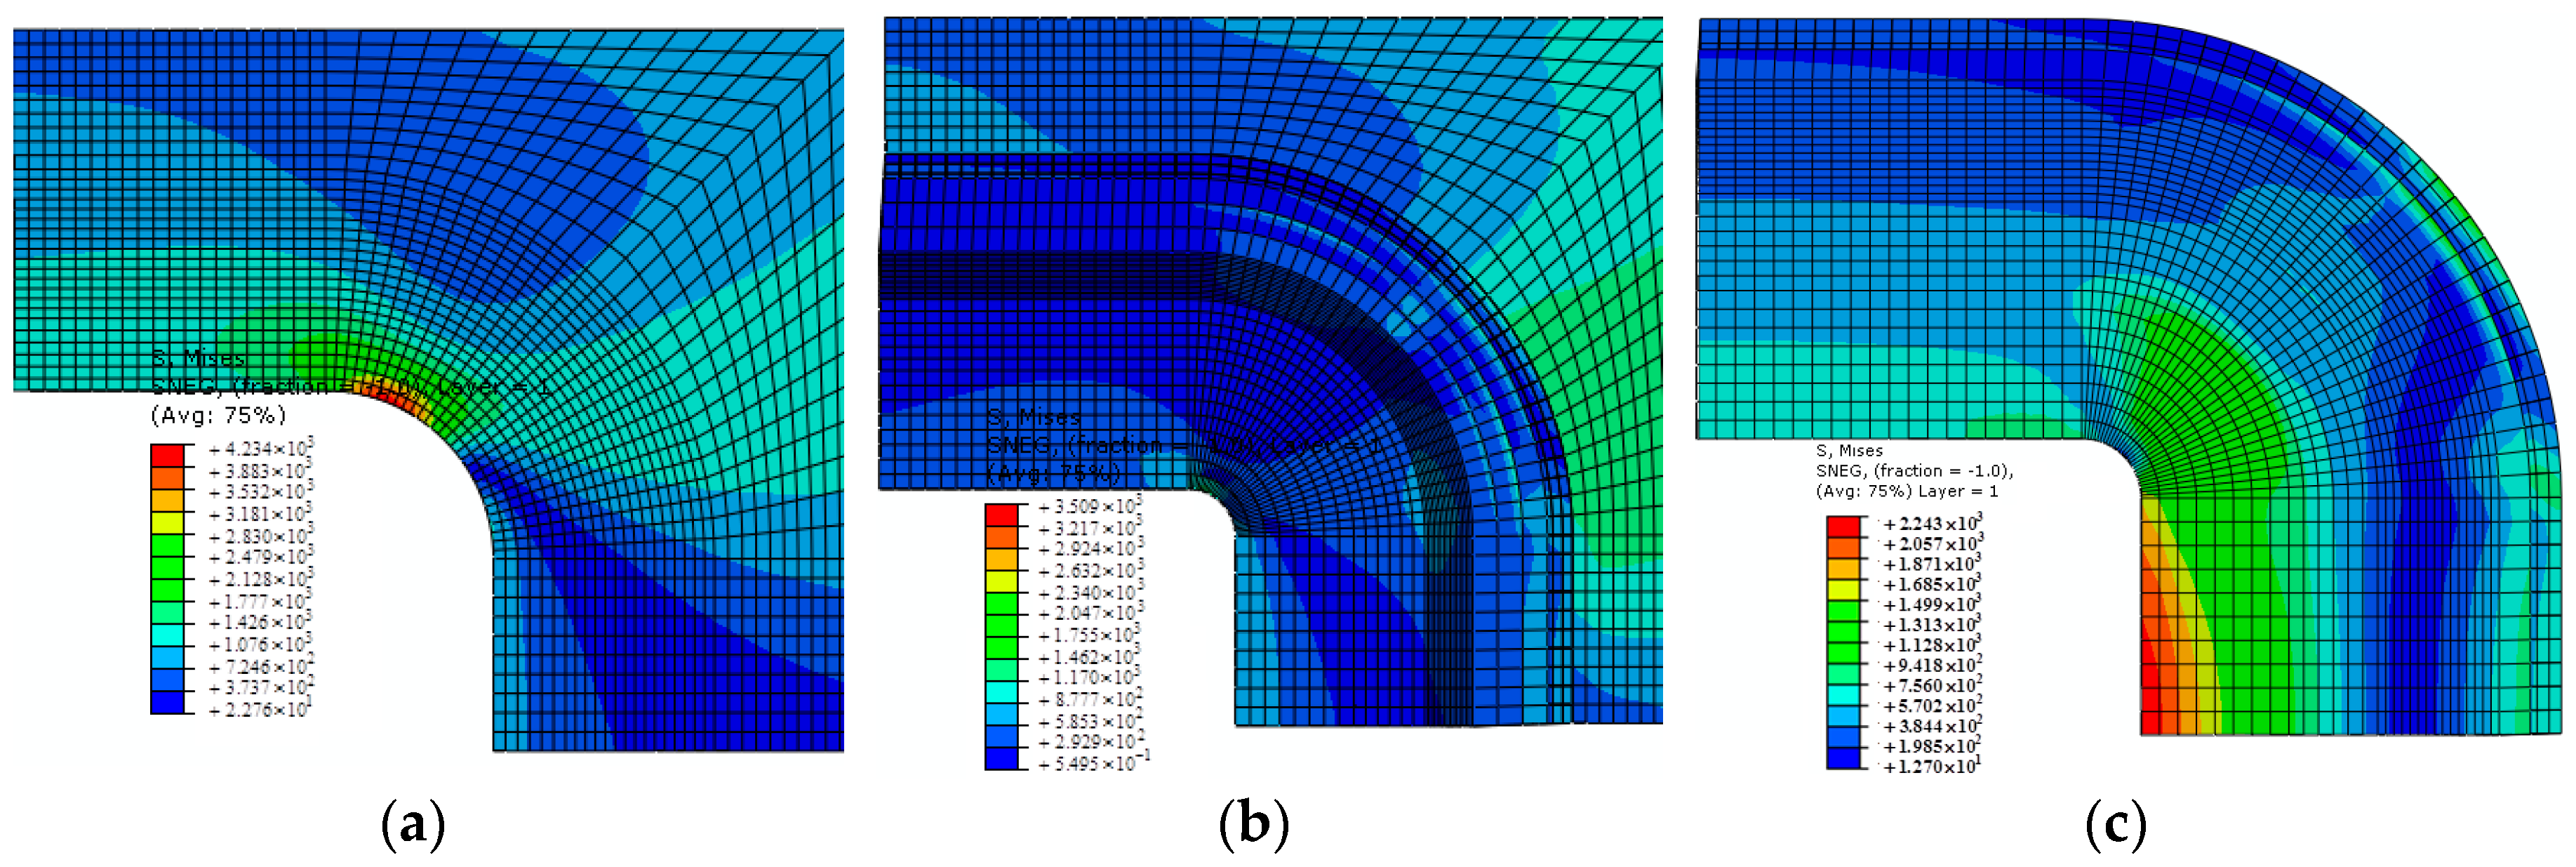
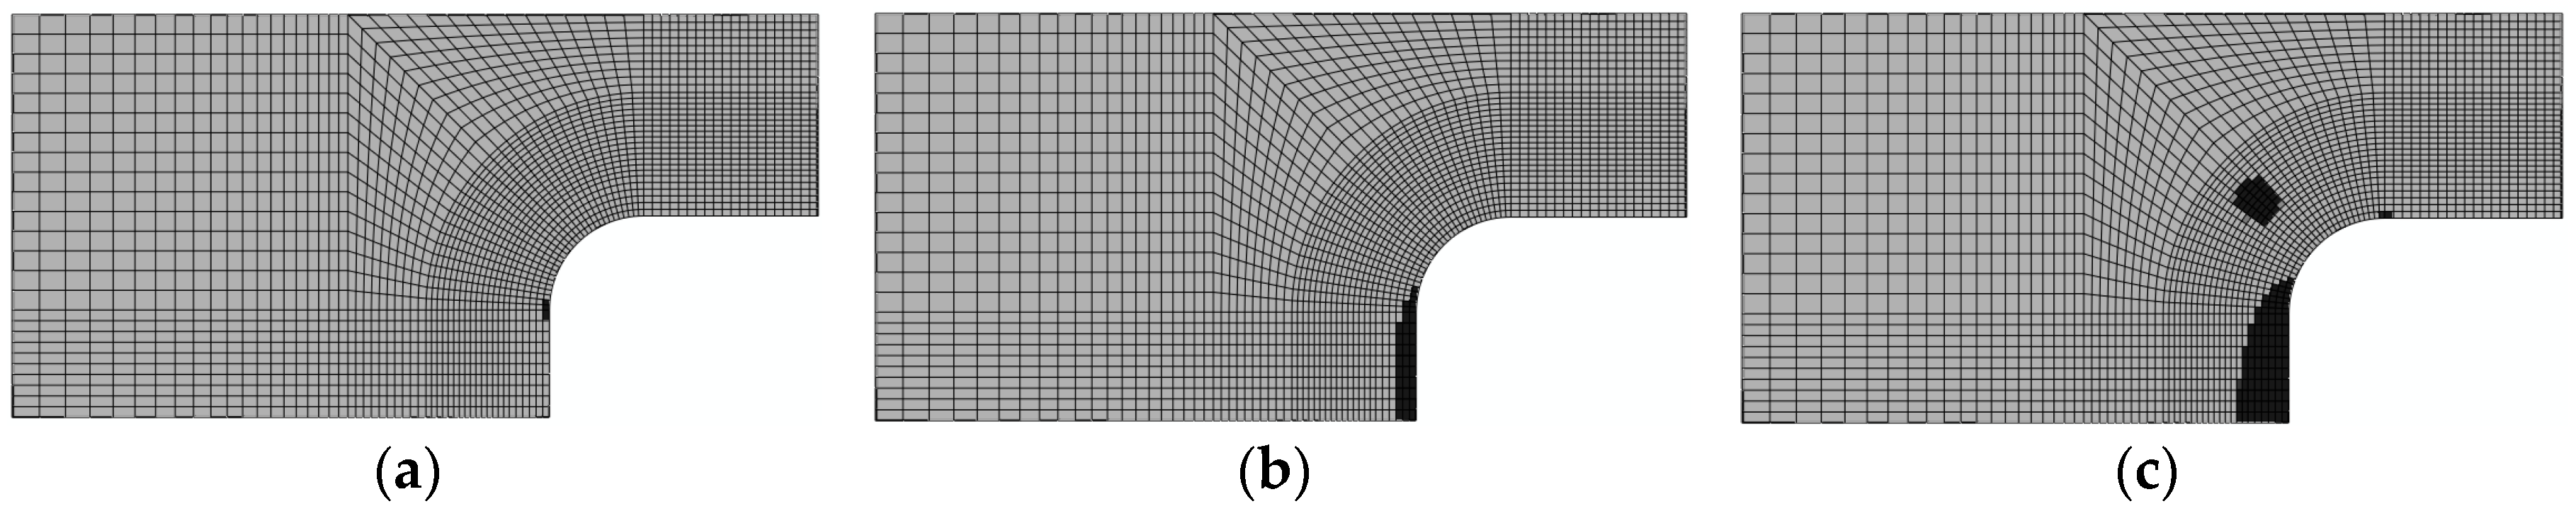
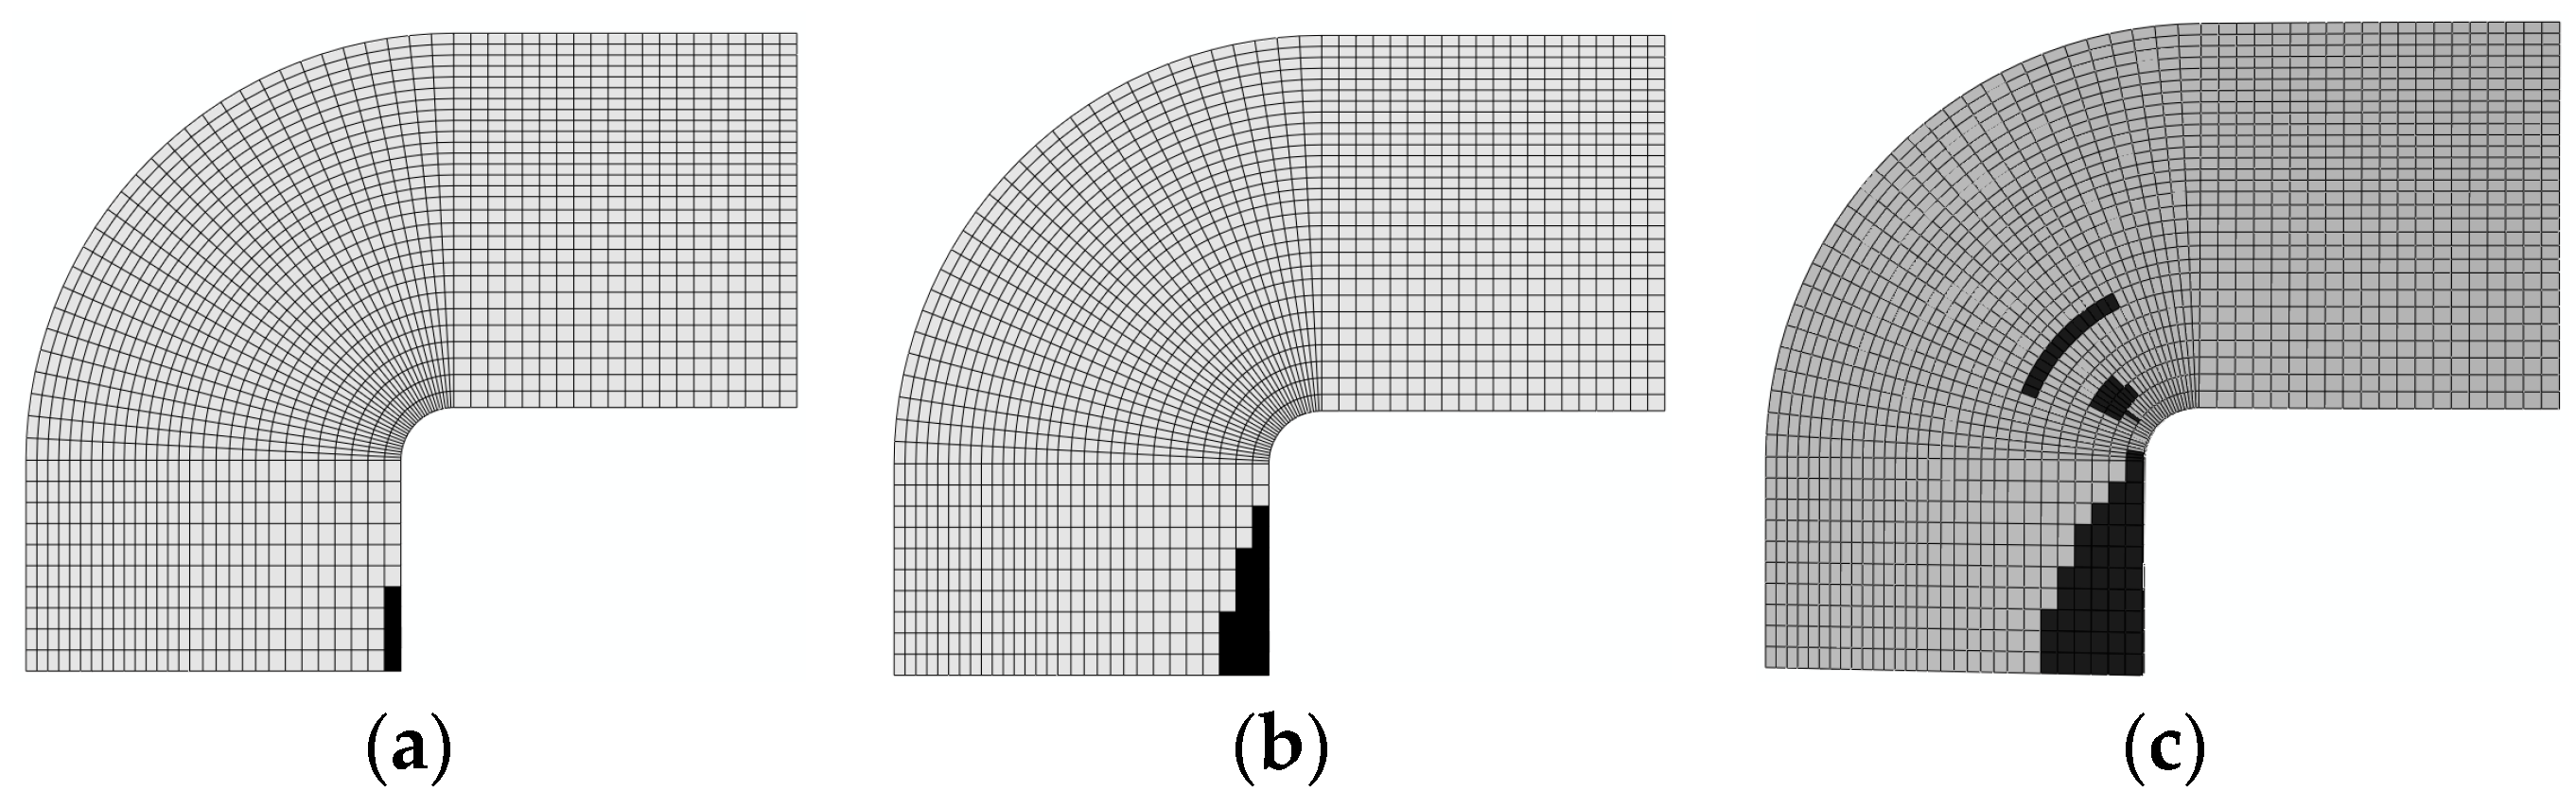
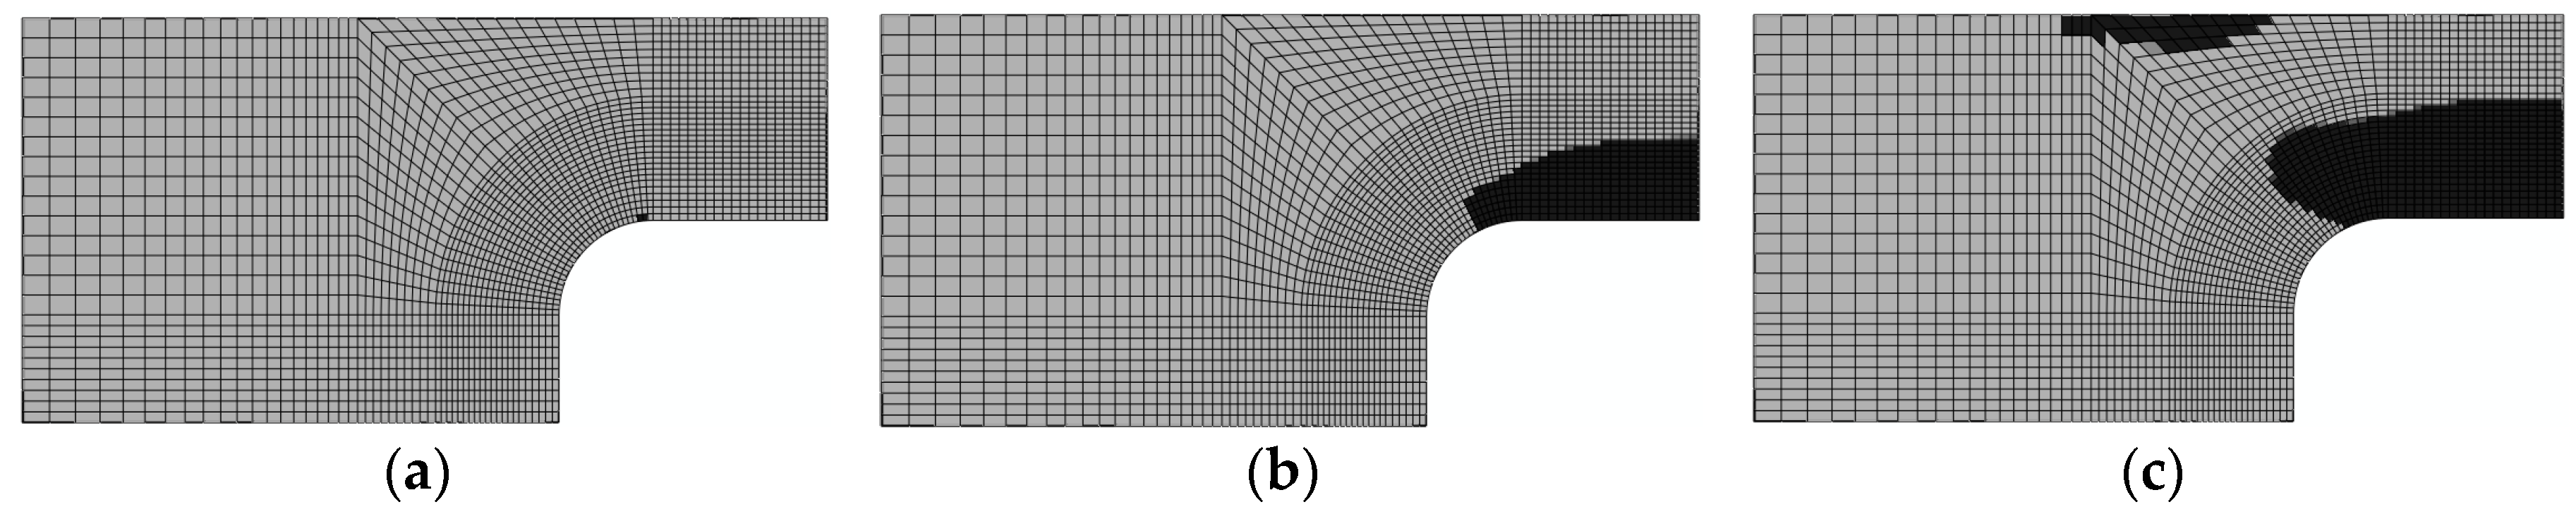
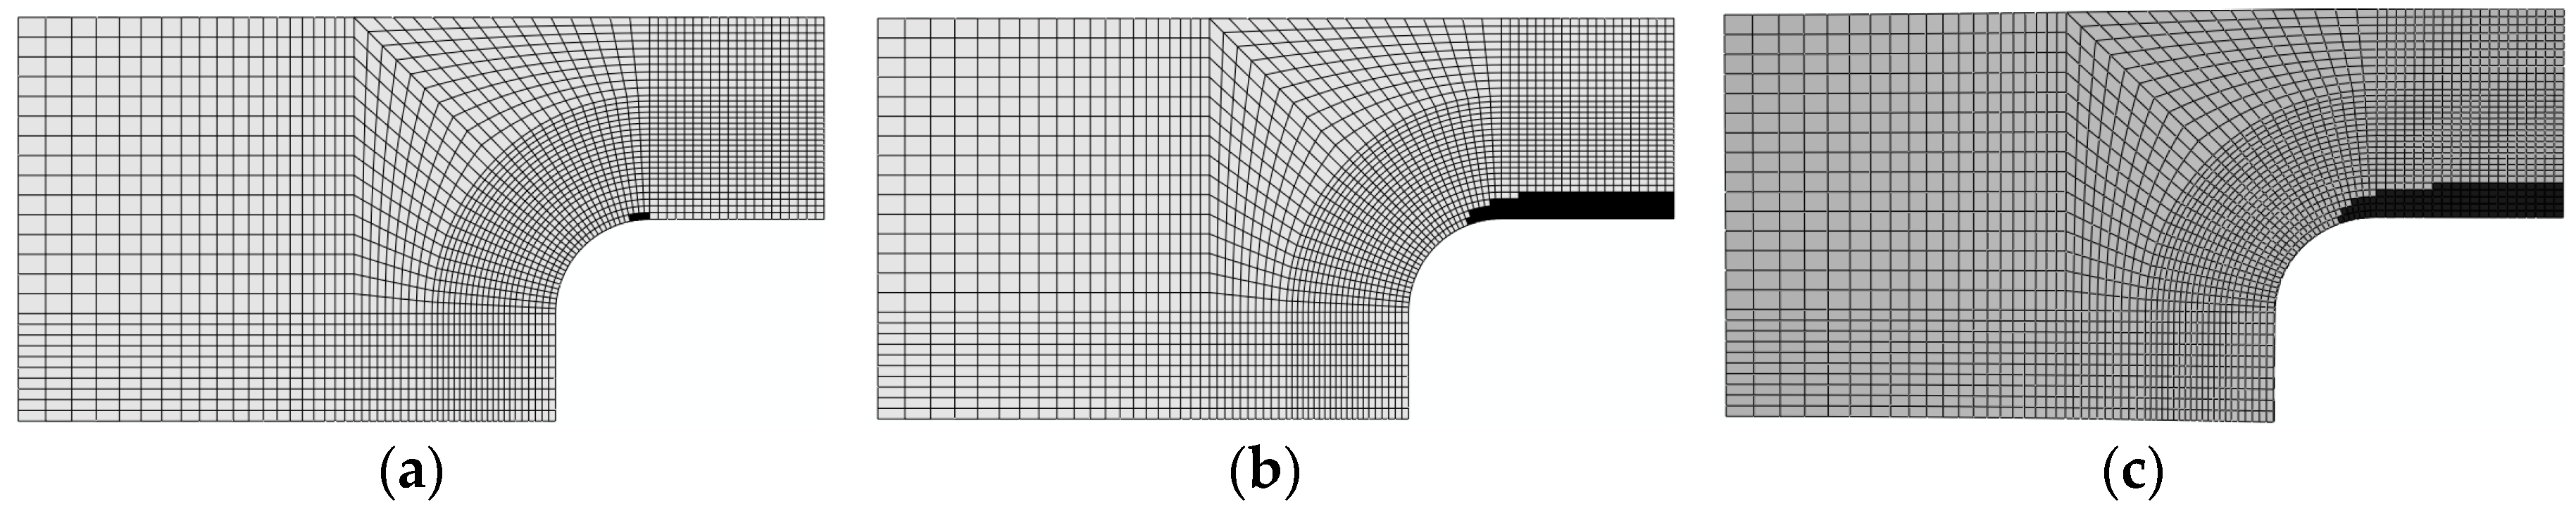
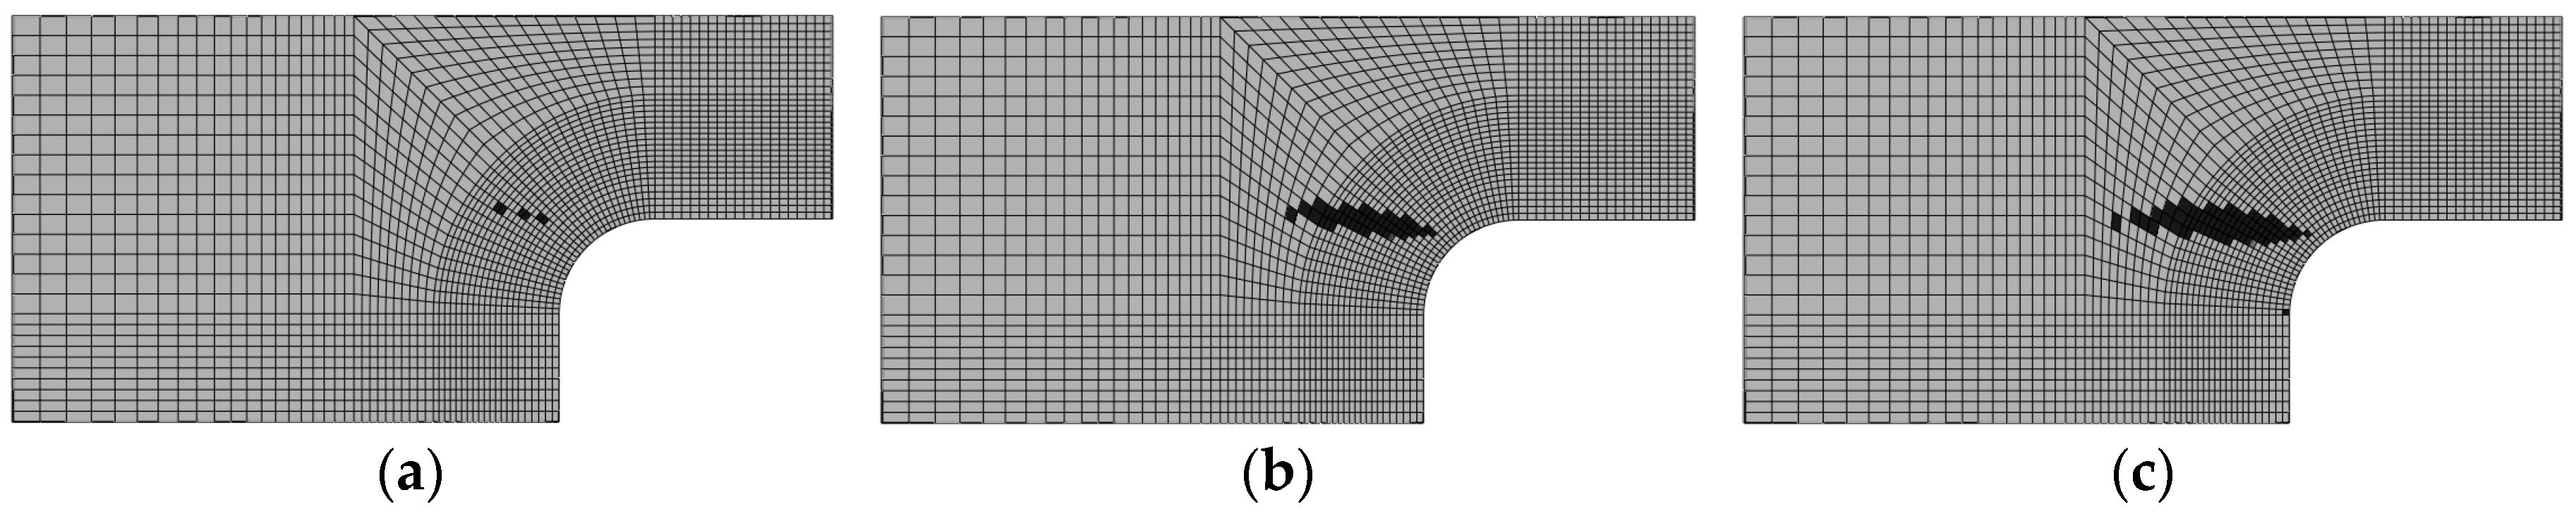
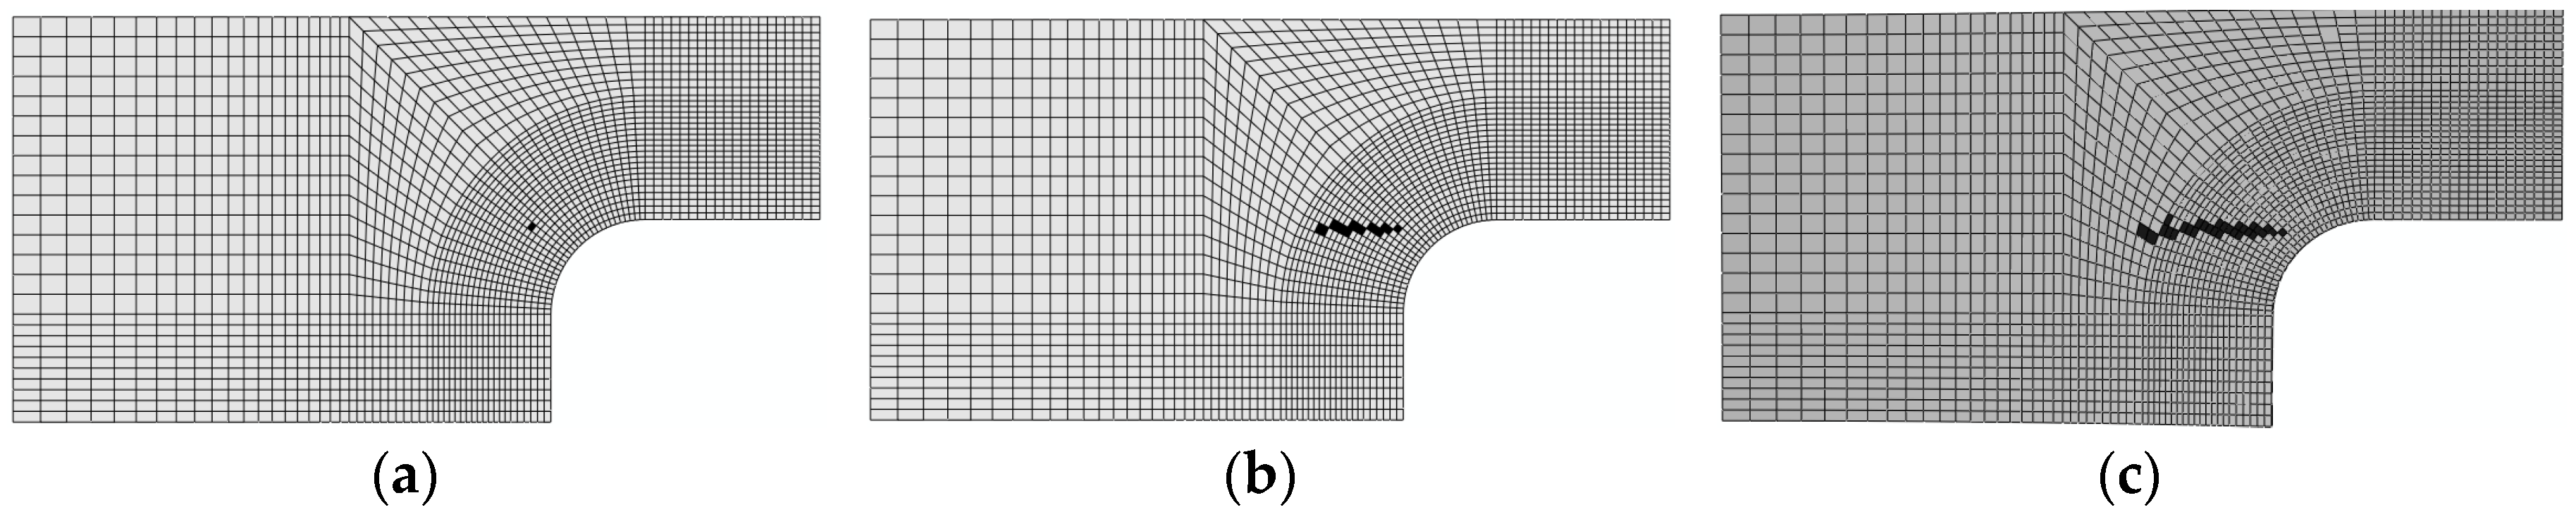
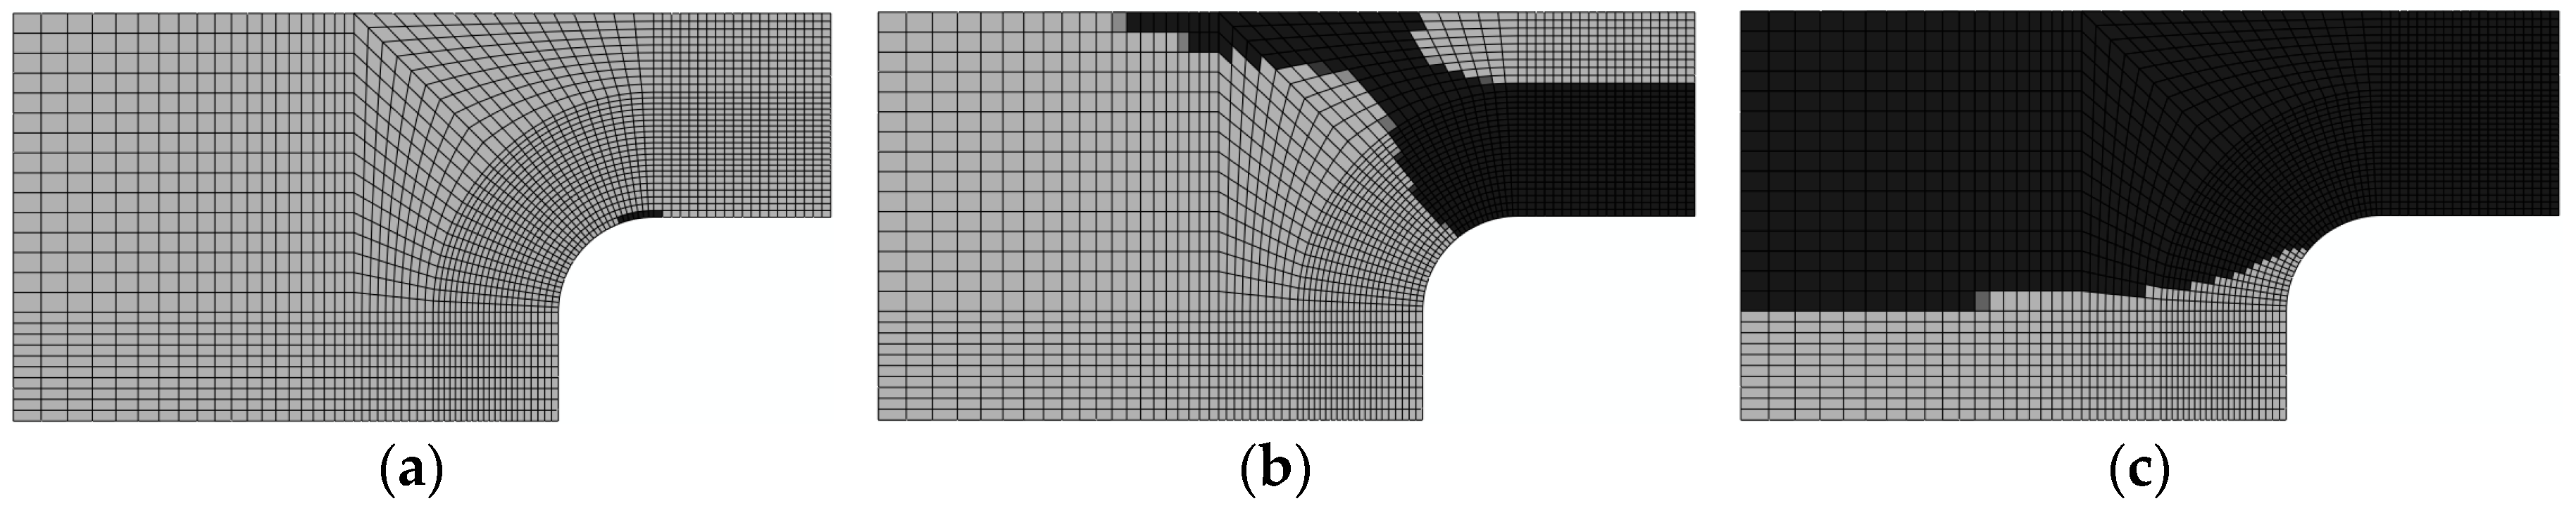
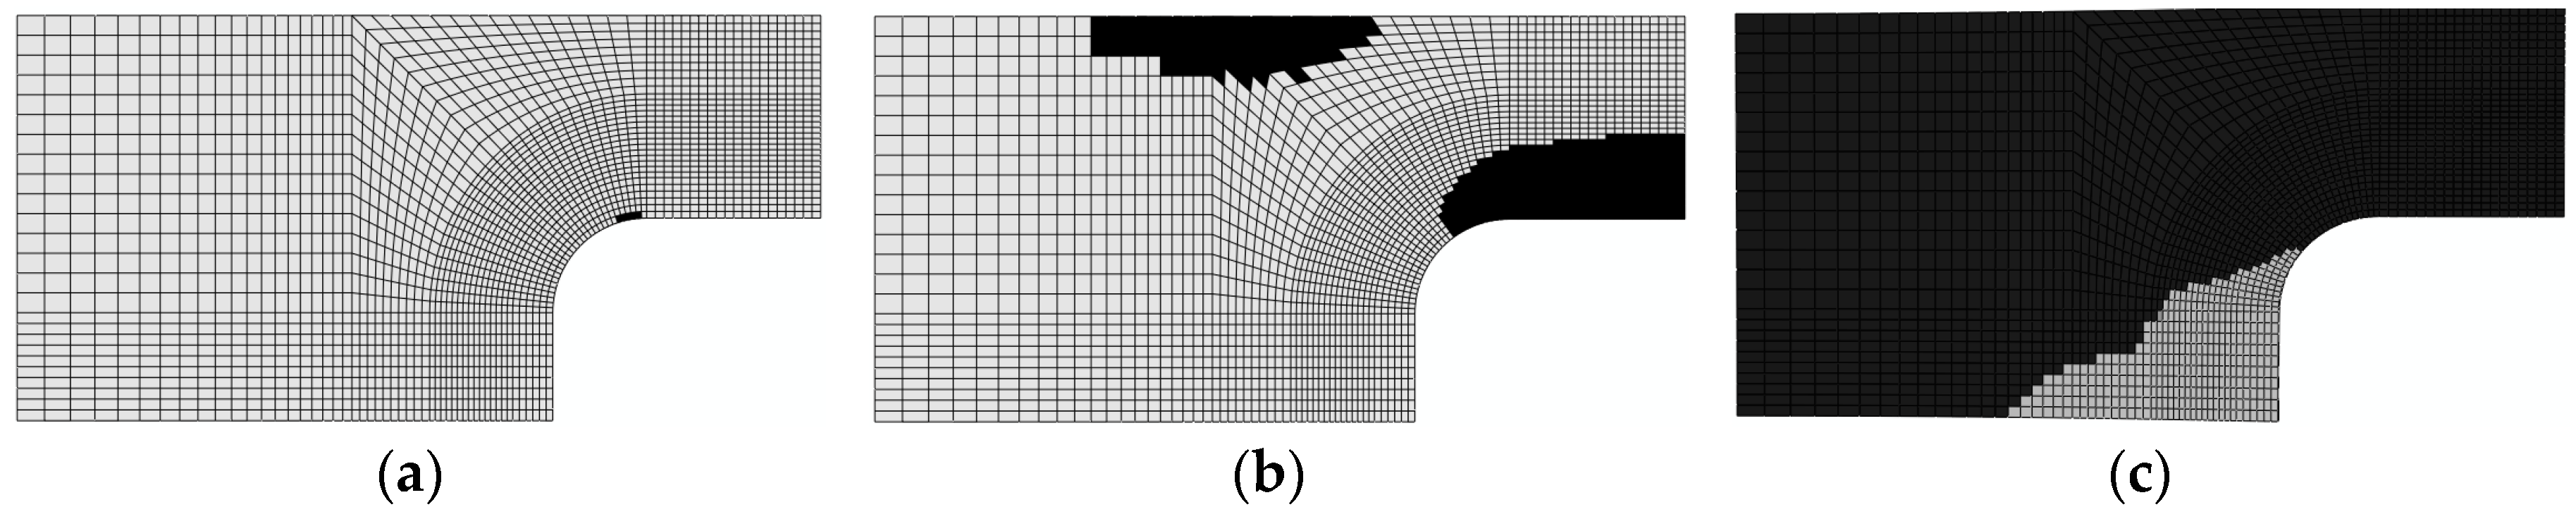
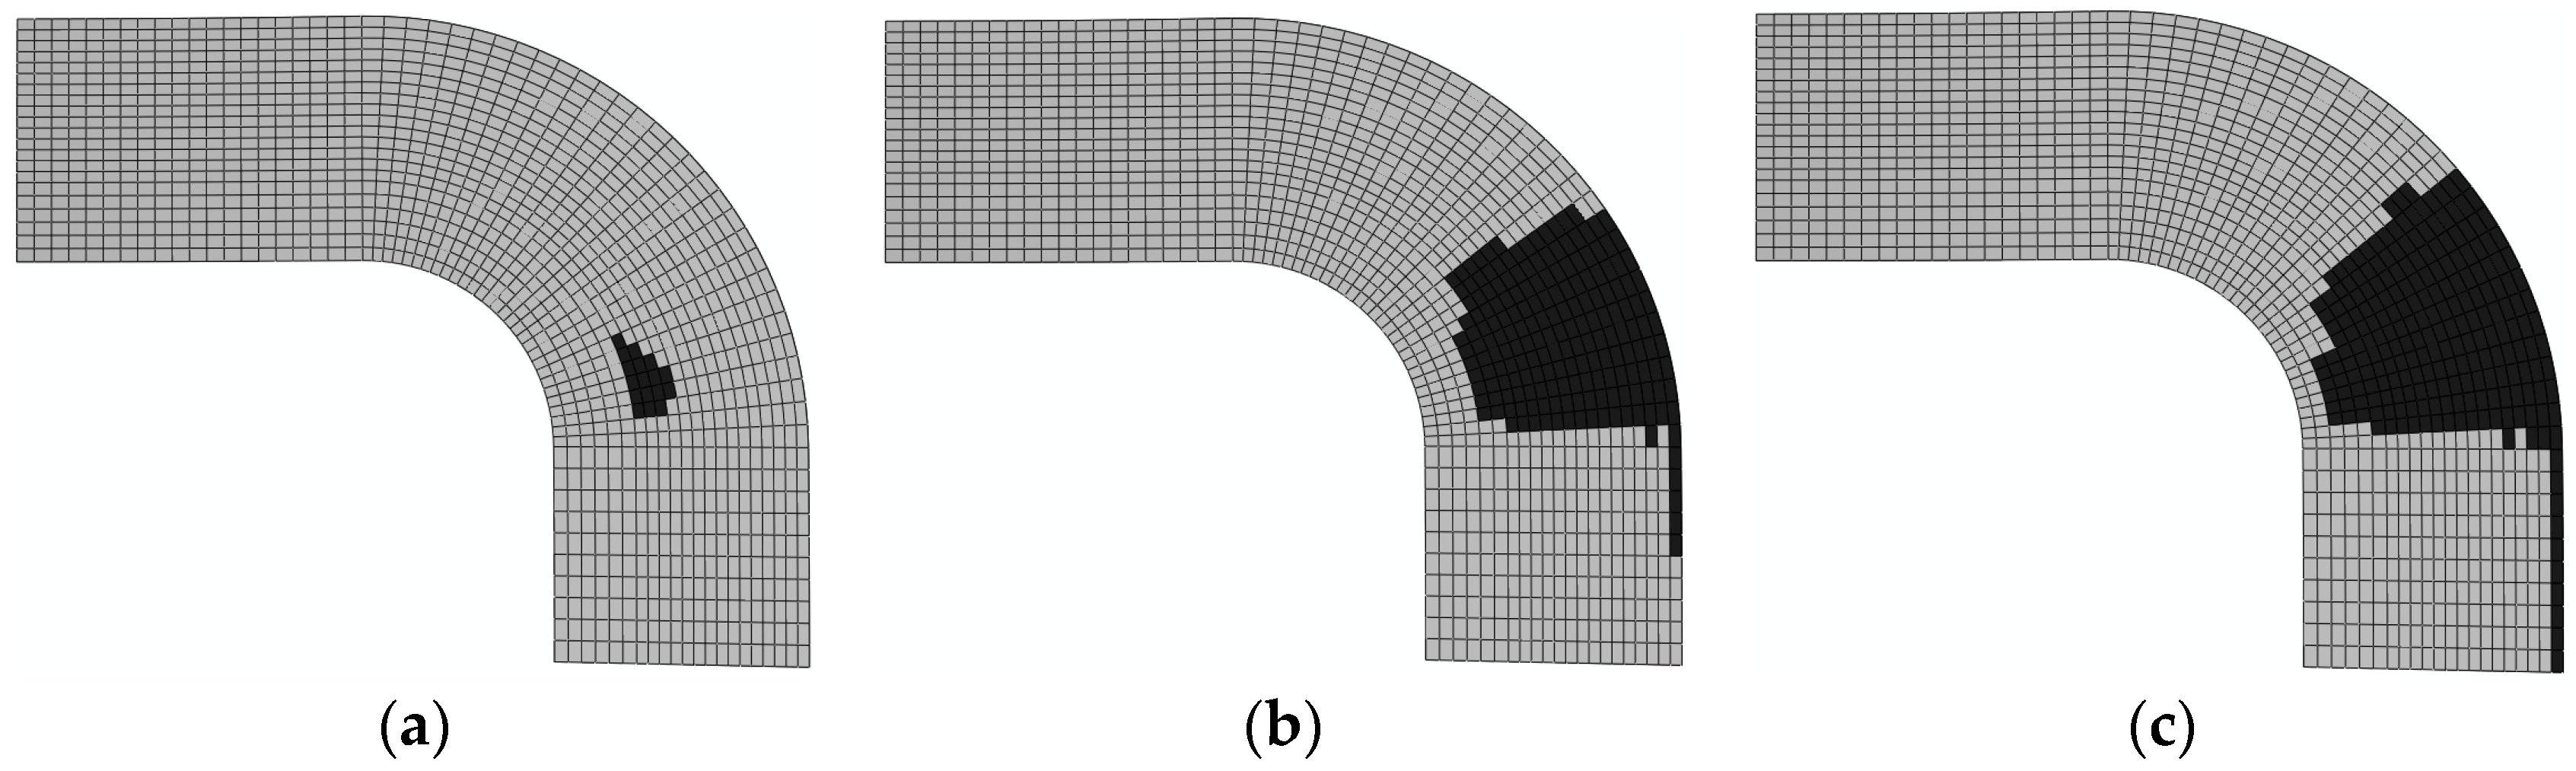
4.3. Damage Evolution
5. Conclusions
Author Contributions
Funding
Acknowledgments
Conflicts of Interest
References
- Mohan, J.; Ivanković, A.; Murphy, N. Mixed-mode fracture toughness of co-cured and secondary bonded composite joints. Eng. Fract. Mech. 2015, 134, 148–167. [Google Scholar] [CrossRef]
- Moure, M.M.; García-Castillo, S.K.; Sánchez-Sáez, S.; Barbero, E.; Barbero, E.J. Influence of ply cluster thickness and location on matrix cracking evolution in open-hole composite laminates. Compos. Part B 2016, 95, 40–47. [Google Scholar] [CrossRef]
- ASTM International Standards organization. Standard Test Method for Thick-Adherend Metal Lap-Shear Joints for Determination of the Stress-Strain Behavior of Adhesives in Shear by Tension Loading; ASTM D5656−10; ASTM International Standards organization: West Conshohocken, PA, USA, 2010. [Google Scholar]
- Kocher, L.H.; Cross, S.L. Reinforced cutouts in graphite composite structures. In Proceedings of the Composite materials: Testing and design (second conference), Anaheim, CA, USA, 20–22 April 1971; American Society for Testing and Materials: West Conshohocken, PA, USA, 1972; pp. 382–395. [Google Scholar]
- Arumugam, V.; Saravanakumar, K.; Santulli, C. Damage characterization of stiffened glass-epoxy laminates under tensile loading with acoustic emission monitoring. Compos. Part B 2018, 147, 22–32. [Google Scholar] [CrossRef]
- Muc, A.; Romanowicz, P. Effect of notch on static and fatigue performance of multilayered composite structures under tensile loads. Compos. Struct. 2017, 178, 27–36. [Google Scholar] [CrossRef]
- Riccio, A.; Sellitto, A.; Saputo, S.; Russo, A.; Zarrelli, M.; Lopresto, V. Modelling the damage evolution in notched omega stiffened composite panels under compression. Compos. Part B 2017, 126, 60–71. [Google Scholar] [CrossRef]
- Muc, A. Peculiarities in the material design of buckling resistance for tensioned laminated composite panels with elliptical cut-outs. Materials 2018, 11, 1019. [Google Scholar] [CrossRef] [PubMed]
- O'Neill, G.S. Asymmetric Reinforcements of a Quasi-Isotropic Graphite Epoxy Plate Containing a Circular Hole. Ph.D. Thesis, Naval Postgraduate School, Monterey, CA, USA, June 1982. [Google Scholar]
- Pickett, D.H.; Sullivan, P. Analysis of Symmetric Reinforcement of Quasi-Isotropic Graphite-Epoxy Plates with a Circular Cutout under Uniaxial Tensile Loading. Ph.D. Thesis, Naval Postgraduate School, Monterey, CA, USA, November 1983. [Google Scholar]
- Lee, J.H.; Mall, S. Strength of composite laminate with reinforced hole. J. Compos. Mater. 1989, 23, 337–347. [Google Scholar] [CrossRef]
- Lee, J.H. Strength and Failure Analysis of Composite Laminate Containing a Circular Hole with Reinforcement; AD-A-189629/9/XAB; AFIT/GAE/AA-87D-9; the Air Force Institute of Technology: Wright-Patterson AFB, OH, USA, 1987. [Google Scholar]
- Vinayak, B.G.; Jayaprakash, K.; Naik, N.K. Fatigue behavior of laminated composites with a circular hole under in-plane multiaxial loading. Mater. Des. 2013, 51, 347–356. [Google Scholar]
- Romanowicz, P.; Muc, A. Estimation of Notched Composite Plates Fatigue Life Using Residual Strength Model Calibrated by Step-Wise Tests. Materials 2018, 11, 2180. [Google Scholar] [CrossRef] [PubMed]
- Eiblmeier, J.; Loughlan, J. The buckling response of carbon fibre composite panels with reinforced cut-outs. Compos. Struct. 1995, 32, 97–113. [Google Scholar] [CrossRef]
- Eiblmeier, J.; Loughlan, J. The influence of reinforcement ring width on the buckling response of carbon fibre composite panels with circular cut-outs. Compos. Struct. 1997, 38, 609–622. [Google Scholar] [CrossRef]
- Warrior, N.A.; Rudd, C.D.; Gardner, S.P. Experimental studies of embroidery for the local reinforcement of composites structures: 1. Stress concentrations. Compos. Sci. Technol. 1999, 59, 2125–2137. [Google Scholar] [CrossRef]
- Wang, C.H.; Rose, L.R.F.; Callinan, R.; Baker, A.A. Thermal stresses in a plate with a circular reinforcement. Int. J. Solids Struct. 2000, 37, 4577–4599. [Google Scholar] [CrossRef]
- Hochard, C.; Aubourg, P.A.; Charles, J.P. Modelling of the mechanical behaviour of woven-fabric cfrp laminates up to failure. Compos. Sci. Technol. 2001, 61, 221–230. [Google Scholar] [CrossRef]
- Okoli, O.I. The effects of strain rate and failure modes on the failure energy of fibre reinforced composites. Compos. Struct. 2001, 54, 299–303. [Google Scholar] [CrossRef]
- Hancock, S.G.; Potter, K.D. The use of kinematic drape modelling to inform the hand lay-up of complex composite components using woven reinforcements. Compos. Part A 2006, 37, 413–422. [Google Scholar] [CrossRef]
- Aoki, Y.; Suemasu, H.; Ishikawa, T. Damage propagation in cfrp laminates subjected to low velocity impact and static indentation. Adv. Compos. Mater. 2007, 16, 45–61. [Google Scholar] [CrossRef]
- Andersons, J.; Spārniņš, E.; Nyström, B.; Joffe, R. Scale effect of the tensile strength of flax-fabric-reinforced polymer composites. J. Reinf. Plast. Compos. 2011, 30, 1969–1974. [Google Scholar] [CrossRef]
- Kumar, D.; Singh, S.B. Stability and failure of composite laminates with various shaped cutouts under combined in-plane loads. Compos. Part B 2012, 43, 142–149. [Google Scholar] [CrossRef]
- Sivakumar, V.; Arjun, R.K.; Ishwarya, V.; Nithya, S.; Sunder, S.; Thilak, B.N. Optimization of cut-out shape on composite plate under in-plane shear loading. J. Fail. Anal. Prev. 2012, 12, 204–213. [Google Scholar] [CrossRef]
- Khechai, A.; Tati, A.; Guerira, B.; Guettala, A.; Mohite, P.M. Strength degradation and stress analysis of composite plates with circular, square and rectangular notches using digital image correlation. Compos. Struct. 2018, 185, 699–715. [Google Scholar] [CrossRef]
- Kalariya, Y.; Kashfuddoja, M.; Khedkar, S.; Ramji, M. Applications of Digital Image Correlation Technique in Composite Research. In Proceedings of the 9th International Symposium on Advanced Science and Technology in Experimental Mechanics, New Delhi, India, 1–6 November 2014. [Google Scholar] [CrossRef]
- Stawiarski, A. The nondestructive evaluation of the GFRP composite plate with an elliptical hole under fatigue loading conditions. Mech. Syst. Signal Process. 2018, 112, 31–43. [Google Scholar] [CrossRef]
- Benzeggagh, M.L.; Kenane, M. Measurement of Mixed-Mode Delamination Fracture Toughness of Unidirectional Glass/Epoxy Composites with Mixed-Mode Bending Apparatus. Compos. Sci. Technol. 1996, 56, 439–449. [Google Scholar] [CrossRef]
- Camanho, P.P.; Davila, C.G. Mixed-Mode Decohesion Finite Elements for the Simulation of Delamination in Composite Materials; NASA/TM-2002–211737; NASA Langley Research Center: Hampton, VA, USA, 2002.
- Hashin, Z. Failure criteria for unidirectional fiber composites. J. Appl. Mech. 1980, 47, 329–334. [Google Scholar] [CrossRef]
- Hashin, Z.; Rotem, A. A fatigue failure criterion for fiber reinforced materials. J. Compos. Mater. 1973, 7, 448–464. [Google Scholar] [CrossRef]
- Dassault Systemes Simulia Corporation. ABAQUS; Version 2016 Documentation; SIMULIA: Providence, RI, USA, 2015. [Google Scholar]


| E11 | E22 | ν12 | G12 | G13 | G23 | XT | XC | YT | YC | SC12 | SC13 | SC23 |
|---|---|---|---|---|---|---|---|---|---|---|---|---|
| (MPa) | (MPa) | - | (MPa) | (MPa) | (MPa) | (MPa) | (MPa) | (MPa) | (MPa) | (MPa) | (MPa) | (MPa) |
| 133,000 | 9100 | 0.31 | 5670 | 5670 | 3500 | 2507 | 1201 | 61.8 | 186 | 84.8 | 84.8 | 41.6 |
| E (GPa) | G (GPa) | ||||||
|---|---|---|---|---|---|---|---|
| (MPa) | (MPa) | (MPa) | |||||
| 2000 | 751.9 | 5 × 10⁻⁵ | 1.33 × 10⁻⁴ | 1.33 × 10⁻⁴ | 350 | 280 | 280 |
| Item | Unit | Typical Value |
|---|---|---|
| , compressive Strength of | MPa | 1201 |
| , bending Strength of | MPa | 1648 |
| , short beam interlaminar shear strength of | MPa | 95.6 |
© 2018 by the authors. Licensee MDPI, Basel, Switzerland. This article is an open access article distributed under the terms and conditions of the Creative Commons Attribution (CC BY) license (http://creativecommons.org/licenses/by/4.0/).
Share and Cite
Wang, Y.; Liu, T.; Jiang, P. Experimental and FEM Studies on Secondary Co-Curing Reinforcement of Laminates. Materials 2018, 11, 2581. https://doi.org/10.3390/ma11122581
Wang Y, Liu T, Jiang P. Experimental and FEM Studies on Secondary Co-Curing Reinforcement of Laminates. Materials. 2018; 11(12):2581. https://doi.org/10.3390/ma11122581
Chicago/Turabian StyleWang, Yi, Tiejun Liu, and Peiyi Jiang. 2018. "Experimental and FEM Studies on Secondary Co-Curing Reinforcement of Laminates" Materials 11, no. 12: 2581. https://doi.org/10.3390/ma11122581
APA StyleWang, Y., Liu, T., & Jiang, P. (2018). Experimental and FEM Studies on Secondary Co-Curing Reinforcement of Laminates. Materials, 11(12), 2581. https://doi.org/10.3390/ma11122581