Article

Preparation and Characterization of Zeolite/TiO2 Cement-Based Composites with Excellent Photocatalytic Performance

1
Department of Transportation and Municipal Engineering, Sichuan College of Architectural Technology, Chengdu 610399, China
2
Key Laboratory of Advanced Civil Engineering Materials (Tongji University), Ministry of Education, Shanghai 201804, China
3
Shanghai Construction Group Co., Ltd., Shanghai 200080, China
*
Author to whom correspondence should be addressed.
Materials 2018, 11(12), 2485; https://doi.org/10.3390/ma11122485
Submission received: 22 October 2018 / Revised: 22 November 2018 / Accepted: 4 December 2018 / Published: 7 December 2018
(This article belongs to the Section Advanced Composites)

Abstract

:
A zeolite/TiO2 composite (ZTC) was applied to prepare a high-quality photocatalytic cement-based material (PCM). The acetone degradation experiment and micro measurements including XRD(X-Ray Diffractometer), SEM-EDS(Scanning Electron Microscope-Energy Dispersive Spectrometer), BET(BET Specific Surface Area Tester), FTIR(Fourier Transform Infrared Spectrometer) were conducted to characterize the photocatalytic efficiency and physicochemical properties of PCM, respectively. Results show that TiO2 particles disperse on the surface of a PCM homogeneously and provide abundant active sites for photocatalytic reactions. Compared to a normal photocatalytic cement-based material (NPCM), the TiO2 content of a PCM is lower and its photocatalytic efficiency is higher. The ZTC frees TiO2 particles from the impacts of cement hydration products and increases the adsorption volume of acetone. The photocatalytic performance of the PCM was stable after repeated tests. Using the ZTC as a photocatalyst has a prominent effect on the photocatalytic performance of the PCM.

1. Introduction

Urban areas are facing serious air pollution because of substantive industrial emissions, massive automobile exhaust, and more urban construction. Air pollution is a great threat to human health. In general, volatile organic compounds (VOCs) and nitric oxides (NOx) are considered to be the major pollutants [1,2,3]. Photocatalytic oxidation is an efficient and cost-effective technology to eliminate pollution. In addition, TiO2 is a typical photocatalytic material known for its excellent photodegradation [4,5,6,7,8,9]. This cement-based material is widely used as the fundamental construction material around the world. In recent years, the use of TiO2 (and other building materials) for air pollution control has attracted worldwide attention. Many investigations have been conducted and some progress has been made [10,11,12,13,14].
However, photocatalysis is a complex surface phenomenon, and its reaction rate depends on many factors. The availability of active sites and the adsorption properties of photocatalysts govern the reaction process of gaseous photocatalytic oxidation [15]. It is easy to combine TiO2 with a cement matrix by coating, spraying, and mixing, but some intrinsic properties of cement-based material, e.g., low porosity, small specific surface area, complex chemical environment, restrict the photocatalytic activity of TiO2 and weaken its long-term performance. Recently, more studies have been dedicated to the performances of cementitious materials when mixed with photocatalytic titanium dioxide. Folli et al. [16] reported that when nano-TiO2 was added to cement, it was inclined to a strong agglomeration of nano-TiO2, thereby decreasing the specific surface area and photocatalytic activity. Lackhoff et al. [17] pointed out that the carbonation of the TiO2-modified cements led to a noticeable loss in catalytic efficiency because of the changes in the cement surface structure. The research of Chen et al. [18] showed that when nano-TiO2 was embedded in cement-based materials, the latter became potential nucleation sites for cement hydration products. When these hydration reactions took place, the hydration products gradually bonded the individual nano-TiO2 particles together, forming a dense coating on the TiO2 surface, thus significantly diminishing its photocatalytic activity. Neppolian et al. [19] investigated the influence of pH on its photocatalytic effect, and the results indicated that high pH values (pH > 10) could decrease the removal rate of reactive yellow 17 dye. Moreover, Vallée et al. [20] found that the transition metal in the cement pastes incurred the electron-hole recombination, thus deactivating the photocatalysts. Lee et al. [21] demonstrated that the specific surface area of cement-based materials can be tailored to enhance the adsorption capacity, but the effect was not significant. In summary, the problems can be grouped into the 4 categories: (1) the influence of the ions (including Na+, Ca2+, OH, etc.); (2) the agglomeration of nano-TiO2 and the coverage of TiO2 by a cement hydration product; (3) low diffusion and adsorption of the pollutant; (4) subsequent peeling of TiO2. Although some innovative approaches have been performed [11,12,22], the problems described above have unfortunately not been resolved properly. In the field of catalysts, natural zeolite (NZ) was an optimal carrier for photocatalysts due to its high specific surface area, high adsorption capacity, and high stability [23,24]. The Zeolite/TiO2 composite was extensively investigated in the field of photocatalytic pollution mitigation. Jansson I. et al. [25] reported that the incipient wet impregnation method was used to prepare Zeolite/TiO2 composite, which led to a significant photodegradation of HCHO with a maximum conversion value of around 80%. The Nano-TiO2 particles homogeneously distributed on zeolitic structures. Sun Q et al. [26] found that the crystalline phase, crystallite size, specific surface area, pore structures, adsorption, and photocatalysis ability of the Zeolite/TiO2 highly depended on the calcination temperature. If a Zeolite/TiO2 composite is applied to the photocatalytic cement-based material (PCM), there are several advantages: (1) excellent adsorption properties lead to higher concentration of contaminant around TiO2, which will facilitate the reaction; (2) high porosity and large specific surface area make it facile for dispersion and immobilization of TiO2 on the surface of carrier; (3) the middle-carrier will prevent TiO2 particles from the impacts of cement hydration production. It is a promising way to enhance the photocatalytic efficiency of PCMs by introducing a Zeolite/TiO2 composite.
In this work, the aim is to enhance the photocatalytic efficiency of PCMs by making TiO2 particles disperse homogeneously, thereby improving the adsorbent properties of the matrix and protecting the TiO2 from the influence of the cementitious system. The main procedures of the experiment are described below. Firstly, the natural zeolite was modified via alkali activation and calcination to obtain the modified zeolite (MZ). The TiO2 sol was made through the hydrolysis of tetrabutyl titanate (TBOT). Subsequently, the MZ was mixed with TiO2 sol to prepare the Zeolite/TiO2 composite (ZTC). Following this, the ZTC was sprayed on the surface of cement substrate to prepare the PCM. Lastly, XRD, BET, SEM-EDS, FTIR and GC-FID(Gas Chromatography-Flame Ionization Detector) were used to characterize the properties and the photocatalytic performance of the PCM.

2. Materials and Method

2.1. Materials

The natural zeolite in the form of clinoptilolite was purchased in Gongyi, Henan Province, China. The physical characteristics and chemical composition of the zeolite are shown in Table 1 and Table 2, respectively. The cementitious material was Ordinary Portland Cement 42.5 produced by Gezhouba Cement Co., Ltd., Jingmen, China. The tetrabutyl titanate (TBOT) was used as the TiO2 precursor, obtained from Sinopharm Chemical Reagent Co., Ltd., Shanghai, China. Acetone was chosen as the gaseous pollutant.

2.2. Preparation of Zeolite/TiO2 Composite (ZTC)

The Zeolite/TiO2 composite (ZTC) was synthesized as follows: 20 g of natural zeolite (NZ) was washed to eliminate the mud and then activated for 6 h with a NaOH aqueous solution (200 mL, 1.5 mol/L). After alkali activation, the treated zeolite was washed with deionized water until the pH value was 7 or 8 and subsequently thermally treated at 400 °C for 2 h to remove the water and other impurities. After washing and calcination, the modified zeolite (MZ) was obtained. The TiO2 sol was synthesized by modifying the preparation described by Yang et al. and Yu et al. [27,28]. Solution A (made up of 31.96 g of TBOT and 47.94 g of absolute ethyl alcohol) and solution B (made up of 319.6 g of deionized water, 47.94 g of absolute ethyl alcohol and 2.56 g of hydrogen nitrate) were prepared respectively. Solution A was added into solution B at the speed of 1–2 drops per second while stirring. In addition, the hydrolysis reaction {Ti(O-CH4)4 + 4H2O → Ti(OH)4 + 4C4H9OH} took place at the same time. The mixed solution was then heated in a water bath at 50 °C for 12 h until complete peptisation. In the heating procedure, a white slurry appeared and gradually turned into a kind of nattier transparent blue solution: this was the TiO2 sol, and the content of TiO2 in the sol was about 2.12% wt. A certain mass of TiO2-sol and MZ were mixed together, thereafter the mixture was treated with stirring and ultrasonification for 30 min, and then kept in a negative pressure still of 0.5 MPa for 2 h. The treated mixture was dried at 105 °C for 2 h to remove the water, absolute ethyl alcohol, TBOT, and other residua. Finally, the dried mixture was calcined at 400 °C for 2 h to obtain the ZTC. A total of three groups of zeolite/TiO2 composite samples were formulated, labeled as ZTC-1 (sol/MZ mass ratio of 0.47), ZTC-2 (sol/MZ mass ratio of 2.36), and ZTC-3 (sol/MZ mass ratio of 4.72). A certain amount of the TiO2-sol was dried at 105 °C for 2 h and then calcined at 400 °C for 2 h to obtain the TiO2 powder, called as HTOP. The TiO2 content of all samples are shown in Table 3.

2.3. Preparation of Photocatalytic Cement-Based Material (PCM)

The cement matrix (Ø50 × 5 mm) was produced as follow: 22 g of cement was mixed with 9.9 g of water, and the cement paste was cast into special mould for 30 min. Before the solidification of the cement paste, 0.22 g of the ZTC was sprayed onto the surface of the paste, and all samples were cured in a standard curing chamber at 25 ± 1 °C and 60 ± 5% RH (relative humidity) for 1 day. After demoulding, the samples were dried at 105 °C, and then the PCM was ready. A total of four kinds of PCM samples were prepared, denoted as PCM-n (n = 0, 1, 2, 3). For comparison, normal photocatalytic cement-based materials (NPCM) were fabricated by incorporating HTOP, named as NPCM-n (n = 1, 2, 3). The compositions of all samples are presented in Table 4.

2.4. Physicochemical Properties Characterization

The crystalline phases of the samples were identified with an X-ray diffraction detector (Rigaku D/max2550, Tokyo, Japan) with a Cu Ka ray source operating at 40 kV and 100 mA. The diffraction angles (2θ) between 5° and 70° were continuously recorded with the interval of 0.02° at the speed of 4°min−1. The ZTC were grinded to a micron-sized powder and plated with a layer of gold film. The surface morphology and microstructure of the ZTC were observed by SEM (FEI Quanta 200F, Hillsboro, America). In addition, the micro-area element was analyzed by EDS. The specific surface area and pore size distribution of the ZTC were revealed by N2 adsorption-desorption isotherms which were measured by the instrument (Beishide 3H-2000PS2, Beijing, China). The infrared spectrum was measured by FTIR (BRUKER EQUINOX55, Karlsruhe, Germany) to verify if there is a chemical bond between TiO2 and zeolite.

2.5. Evaluation of Photocatalytic-Degradation Performance

The photocatalytic degradation efficiency was measured by a home-made gas-phase photocatalysis test device. The device consisted of a stainless-steel reactor, a gas conduit, an ultraviolet (UV)-lamp, a gas chromatograph, a vacuum pump, an H2O vaporizer, and temperature and humidity sensor, as shown in Figure 1. The reactor was a hermetically sealed stainless-steel cylinder (3.61 L). The cover of the reactor was made of quartz glass with a high light transmittance. The gas was driven to cycle in the device by a vacuum pump (flow rate of 0.4 Lmin−1). The light source was a high-pressure Hg lamp with a wavelength of 365 nm, thus belonging to the UV-light spectrum (10~400 nm). The intensity of the UV-light in the experiment was measured with a UV-A radiometer (LUTRON, UV-340-A, Taiwan). The intensity of the light in the experiment was about 1.2 mW/cm2, which was equal to the light level of central China, where the UV light intensity is about 1.0–3.0 and 1.5 mW/cm2 in summer daylight and winter daylight, respectively [29]. To reach the intensity (1.2 mW/cm2), the distance between the lamp and the reactor was adjusted to 15 cm.
Exactly 1 μL of liquid acetone was injected into the reactor and was kept for 30 min without light to guarantee complete evaporation. The initial concentration of gaseous acetone was about 3.76 μmol/L in the reactor. The temperature of the reactor was maintained at 37 °C and the relative humidity (RH) was 20% [30]. Once the irradiation of the UV-light occurred, the photocatalysis reactions started immediately. In the reaction process, the concentration of gaseous acetone was measured by the gas chromatograph every 5 min during the reaction process. When one test was finished, the just tested specimen was heated in an oven for 2 h at 70 °C to be acetone-free, and the reactor was wiped with absolute ethyl alcohol and irradiated with a UV-lamp for 30 min. The degradation rate of the acetone was calculated using Formula (1), and the reaction rate were calculated using Formula (2),
w % = C C 0
l n c c 0 = k · t
where w % was the degradation rate of acetone, C0 and C represented the initial and final concentration of acetone respectively, k was the reaction rate, and t was the reaction time.

3. Results and Discussion

3.1. Physicochemical Properties

The XRD results are shown in Figure 2. The diffraction peaks of TiO2 in form of anatase were observed in the diffractogram of HTOP. Calculated using the Scherrer equation, the particle size of HTOP was about 10 nm. It is well-known that nano-TiO2, particularly in the anatase form, exhibits a photocatalytic activity under UV irradiation. It was inferred that the ZTC based on HTOP had the potential for good photocatalytic performance. The intensity of the characteristic peaks of the MZ decreased slightly after alkali activation and calcination. It was mostly because the Si embedded in the zeolite framework was selectively dissolved and the chemical-bonding water was destroyed. The diffractogram of ZTC-2 also shows the characteristic diffraction peaks of the MZ, but the characteristic peaks intensity of ZTC-2 is weaker than the MZ. This dilution effect was more evident for the TiO2 crystal phases. In fact, the characteristic peak (2θ = 25.3°) of TiO2 was not detected in the ZTC, and it may be owing to the smaller content of TiO2. On the other hand, the absence of characteristic peaks for TiO2 indicated that TiO2 particles were well dispersed on the zeolite, which in fact prevented the growing of large TiO2 crystallites [25].
SEM images and EDS analysis are shown in Figure 3, and the microstructure of samples is revealed. Compared with NZ (Figure 3a), the surface of the MZ (Figure 3b) was rougher, and more micropores (about 6 μm) were observed on the surface, which benefited the deposition of nano-TiO2 and adsorption of pollutant. As shown in Figure 3c, Area 1 and Area 2 were randomly selected for the micro-area element analysis. In addition, the EDS results (Figure 3d) showed that the elements (including Si, O, Al, K, Ti) were detected, among which, the content of Ti was considerable. Based on the results of EDS, it was verified that TiO2 had already precipitated on the surface of zeolite. Considering the 2 microregions were selected randomly and the content of Ti in Area 1 (11.75%) was close to Area 2 (14.19%), it can be inferred that the nano-TiO2 particles were homogeneously distributed on the surface of the MZ within a certain range. Figure 3e shows the top view photograph of the surface layer of PCM-2. The orange ZTC-2 particles were immobilized on the surface layer of PCM-2, and a little dark gray cement paste was observed. One could argue that ZTC-2 was adequately exposed to the air at the macro-scale. To better understand the immobilization of ZTC-2 on the surface of PCM-2, the model of PCM-2 is also shown in Figure 3e. As shown in Figure 3f, the cement hydration product could not be observed except for TiO2 film. It was indicated that the exposed ZTC-2 was not covered by the cement hydration product, and the adverse influence of the cement ion species as well as carbonization were weakened, which thus helped enhance the photocatalytic property. This contribution was related to the separation between the zeolite and the cement.
The chemical changes during the process of the ZTC synthesis were monitored by FTIR, and the IR spectra are shown in Figure 4. For the NZ sample, peaks were observed at the range of 440~600 cm−1 and 700~800 cm−1, which was the characteristic of Si-O bond stretching vibration. The IR spectra of ZTC-2 was almost similar to the NZ with the exception of a vibrational band at 960 cm−1, which attributed to the antisymmetric Ti-O-Si stretching modes of a corner-sharing tetrahedral [31]. It was inferred that there was chemical bond between TiO2 and the zeolite. Under the force of the chemical bond, TiO2 particles were firmly fixed on the surface of the ZTC. This effect was significant for the long-term performance of the PCM.
The nitrogen adsorption–desorption isotherms of the MZ and ZTC are presented in Figure 5 and Figure 6. The isotherms were of type IV according to BDDT (Brunauer, Deming, Deming and Teller) classification. A hysteresis loop could be observed at relative pressure between 0.48 and 1, indicating that there were mesoporous structures [11,32]. As shown in Figure 5 and Figure 6, the isotherms of the MZ were different from ZTC-2, which indicated that after TiO2 was loaded onto the surface of the MZ, the specific surface area was changed. From Table 5, the results showed that ZTC-2 recorded a slight reduction of BET specific surface area and total pore volume as compared to that of the MZ, probably due to the pore blocking by the TiO2 particles. The pore size distribution curve of the MZ was different from ZTC-2, and the most probable aperture was changed from 13 nm (MZ) to 5 nm (ZTC-2). This can be explained by the fact that the nano-TiO2 particles were pressed into the pores of zeolite under negative-pressure, which led to more stacked holes. However, the BET specific surface area of ZTC-2 still maintained 319 m2g−1. This confirmed that the TiO2 particles were immobilized on the surface of the zeolite in the formation of nano-size. According to the BET analysis, it can be deduced that more active sites would be provided to participate in the reaction and that the ZTC would possess the potential for high photocatalytic efficiency.

3.2. Evaluation of the Photocatalytic Efficiency

TiO2 is a kind of UV-light induced semiconductor catalyst. Upon the irradiation of the UV-light, the electron (e) is excited from valance band to conduction band, thus leaving a hole (h+). The photo-induced electron-hole pairs can reach the surface of the TiO2 particle and start a reduction–oxidation process. The electron (e) reacts with O2 to form superoxide anions ( O 2 ), and the hole (h+) interacts with the hydroxyl (OH) adsorbed on the surface of catalyst to generate hydroxyl radicals (OH). The superoxide anions ( O 2 ) and hydroxyl radicals (OH) act as strong oxidants with the potential to decompose a wide range of organic contaminates [33,34]. Under the adequate operating conditions (residence time, UV irradiation), the final products should theoretically be carbon dioxide and water [30]. The photocatalysis mechanism of the PCM is shown in Figure 7.
In Figure 8, the results of acetone removal are displayed. In the process of reaction, little gaseous intermediates were detected by GC-FID, which was in accordance with previous study [35]. The order for acetone removal rate is as below: PCM-3 > PCM-2 > PCM-1 > NPCM-2 > NPCM-3 > NPCM-1 > PCM-3(dark) > PCM-0. The results of PCM-3(dark) and PCM-0 suggested that the cement substrate could hardly decompose acetone without UV-light irradiation. For PCM-n (n = 1, 2, 3), the trend was obvious that the degradation efficiency increased with the growing of TiO2 content. Moreover, the acetone degradation rate of PCM-3 reached up to 56% which was remarkable, but the result cannot be compared with other previous reported studies, due to different experiment conditions and standards. The PCM-n (n = 1, 2, 3) samples had a higher photocatalytic efficiency than the corresponding NPCM-n (n = 1, 2, 3) samples. This was attributed to two effects. Firstly, the abundant channels and pores, and the large specific surface areas of zeolite benefitted to the gas diffusion and adsorption, correspondingly. Secondly, the zeolite was an optimal carrier for TiO2 due to the unique uniform pores, internal pore volume, and channel size [36,37,38], and TiO2 was proved to be homogeneously dispersed on the surface of the ZTC according to the results of N2 adsorption-desorption and SEM-EDS, thus more active sites were provided. The synergistic effect led to a high photocatalytic efficiency. The acetone removal rate of PCM-1 was higher than NPCM-n (n = 1, 2, 3), indicating that the ZTC enhanced the photocatalytic efficiency of the PCM with a smaller consumption of TiO2. The middle-carrier method is effective to improve the photocatalytic performance of the PCM.
According to the previous researches [8,9,39,40,41,42], the kinetic processes of acetone degradation is described in Figure 9. The photodegradation data of Figure 8 were fitted by using the first order kinetic model, and the results are shown in Figure 10. It was found that all the reactions were approximate to the first order reaction, and this was in accordance with previous study [43]. The reaction rate constants are shown in Table 6. The reaction rate changed along with the content of the ZTC. To our best knowledge, the reaction rate (k) is proportional to the concentration of the reactant under identical conditions. However, the initial concentration of acetone and H2O for all samples were constant. The most possible reason was that more O 2 and OH were generated with the increasing content of ZTC, thus leading to higher reaction rate. It was obvious that the reaction rates of PCM-n were about 1.5 times higher than NPCM-n on average. It demonstrated that the special structure of the ZTC led to more active sites to improve the photocatalytic efficiency. As shown in Figure 11, the acetone removal rate of PCM-3 slightly decreased to 52% during the continuous test processes (5 times in total), and it was probably because some active sites were occupied by reaction products [44]. It can be inferred that the long-term photocatalytic performance of the PCM will be stable.

4. Conclusions

(1)
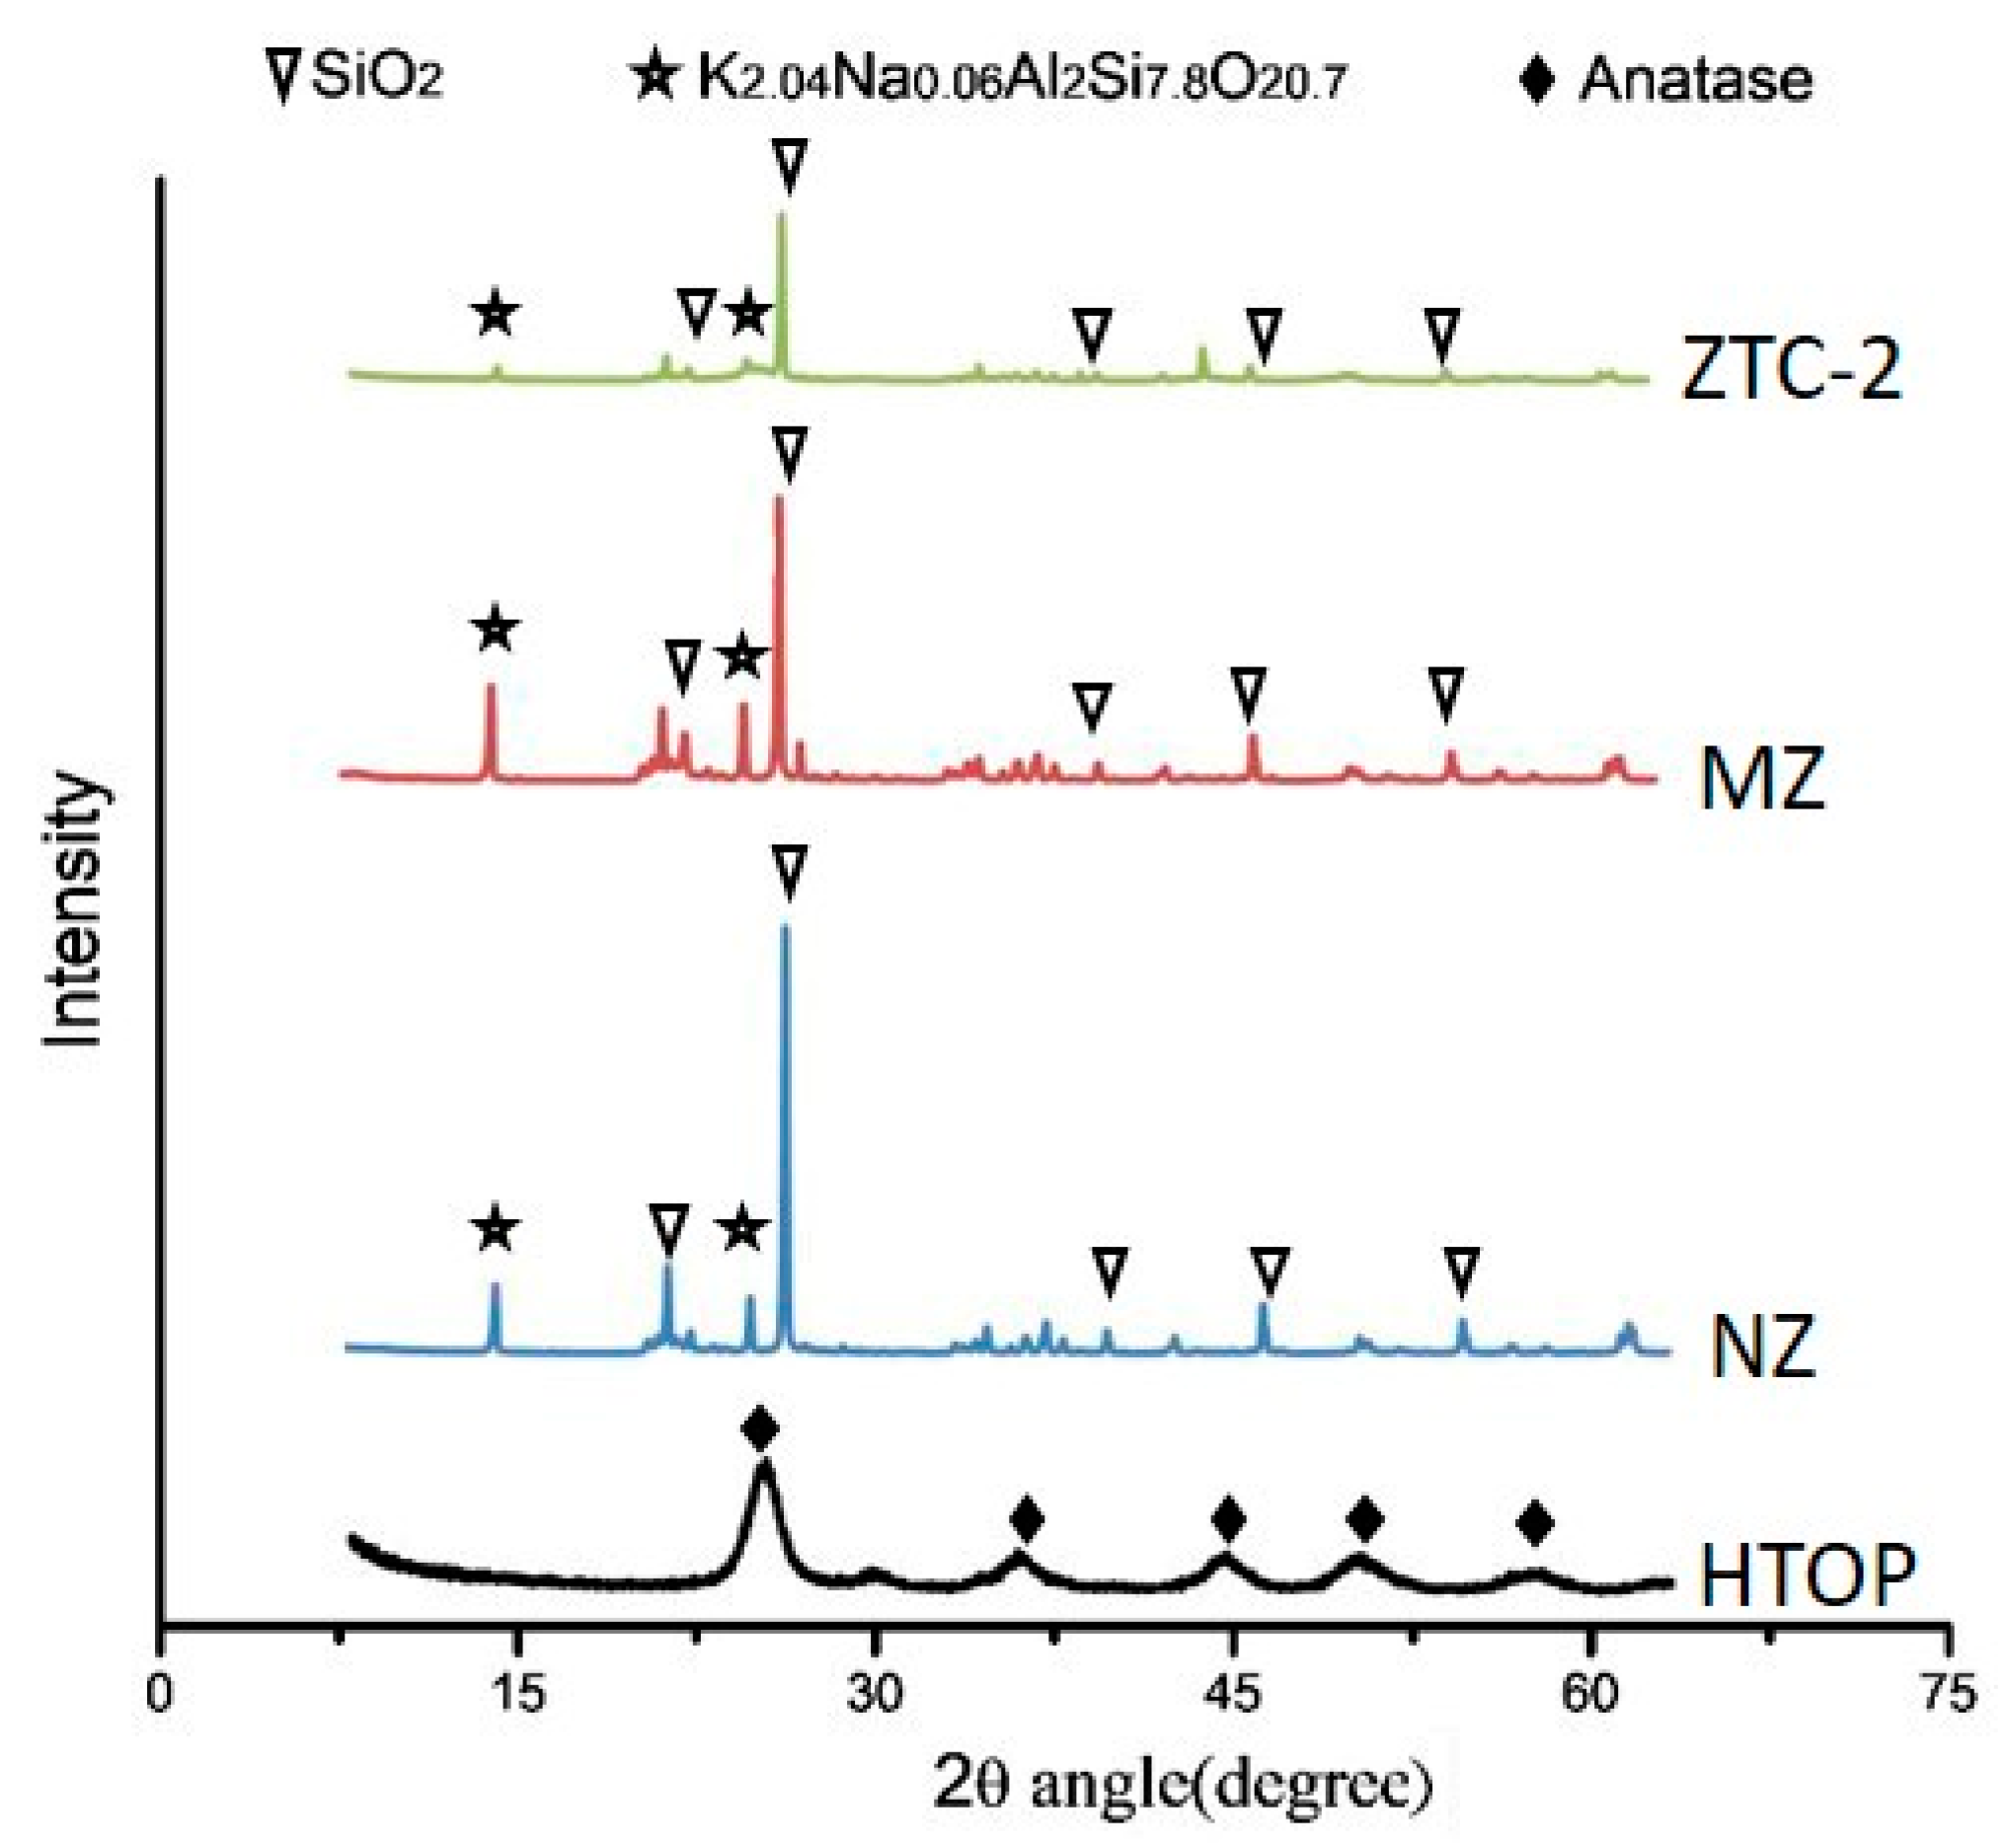
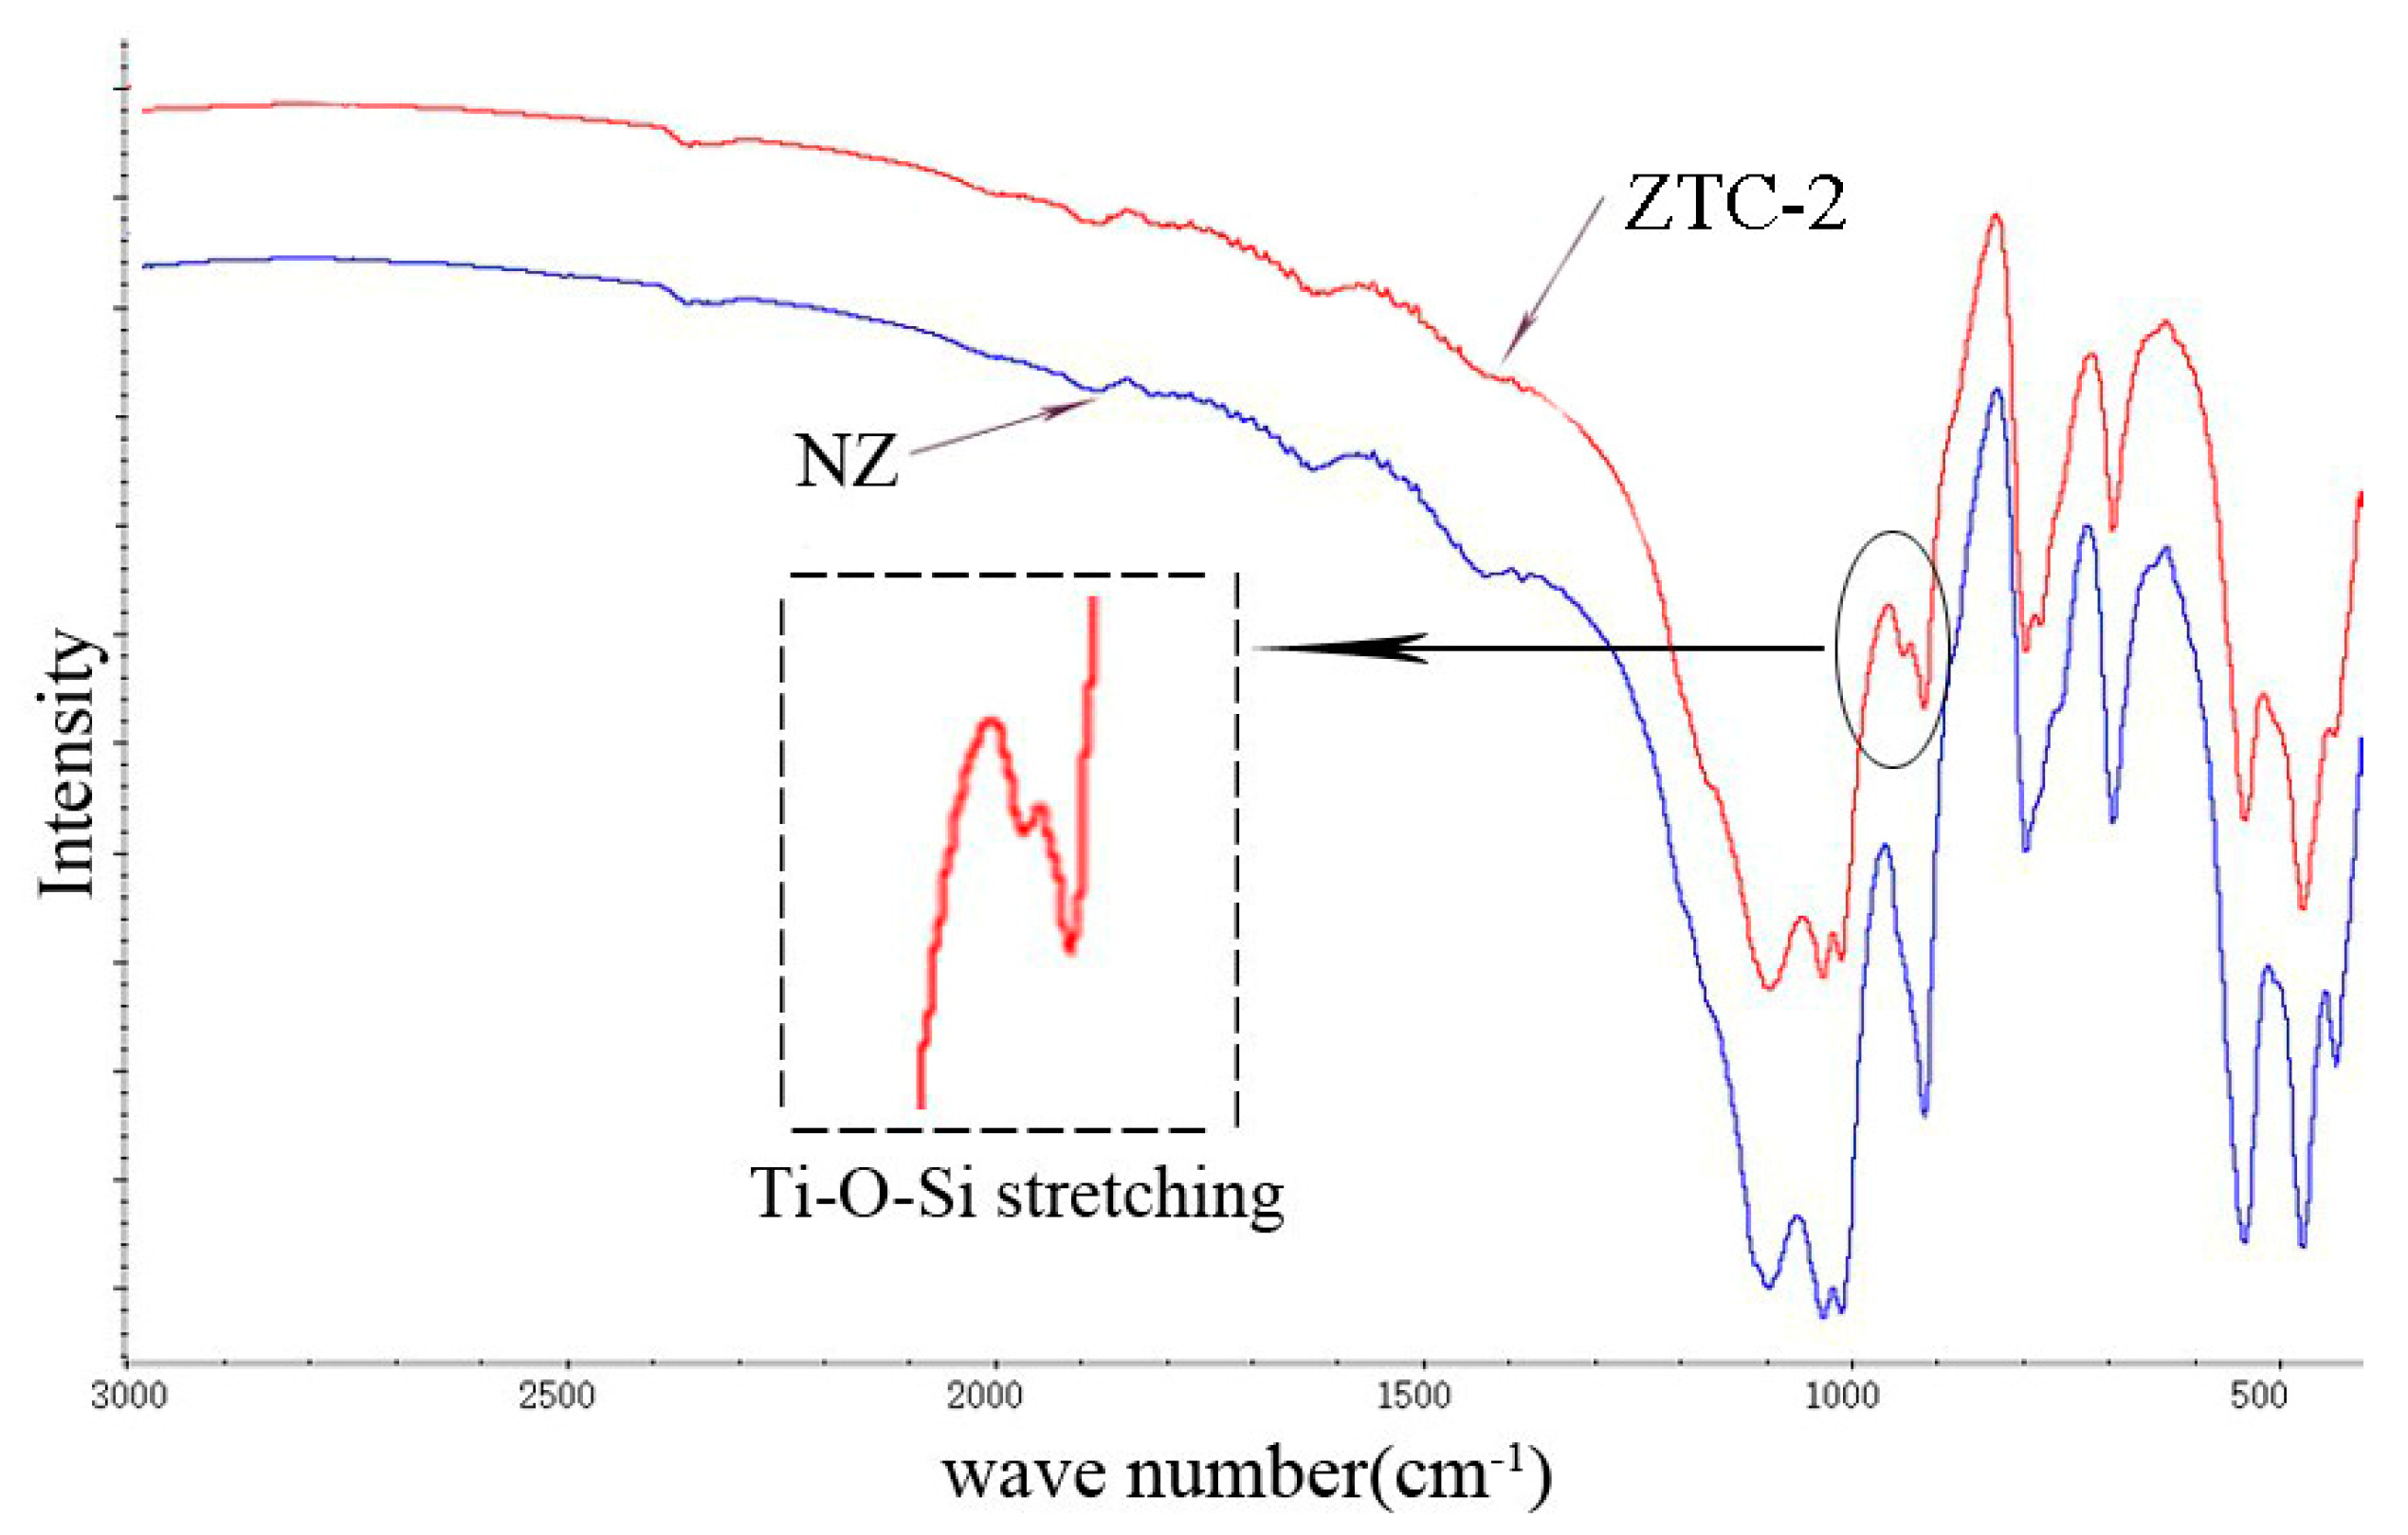
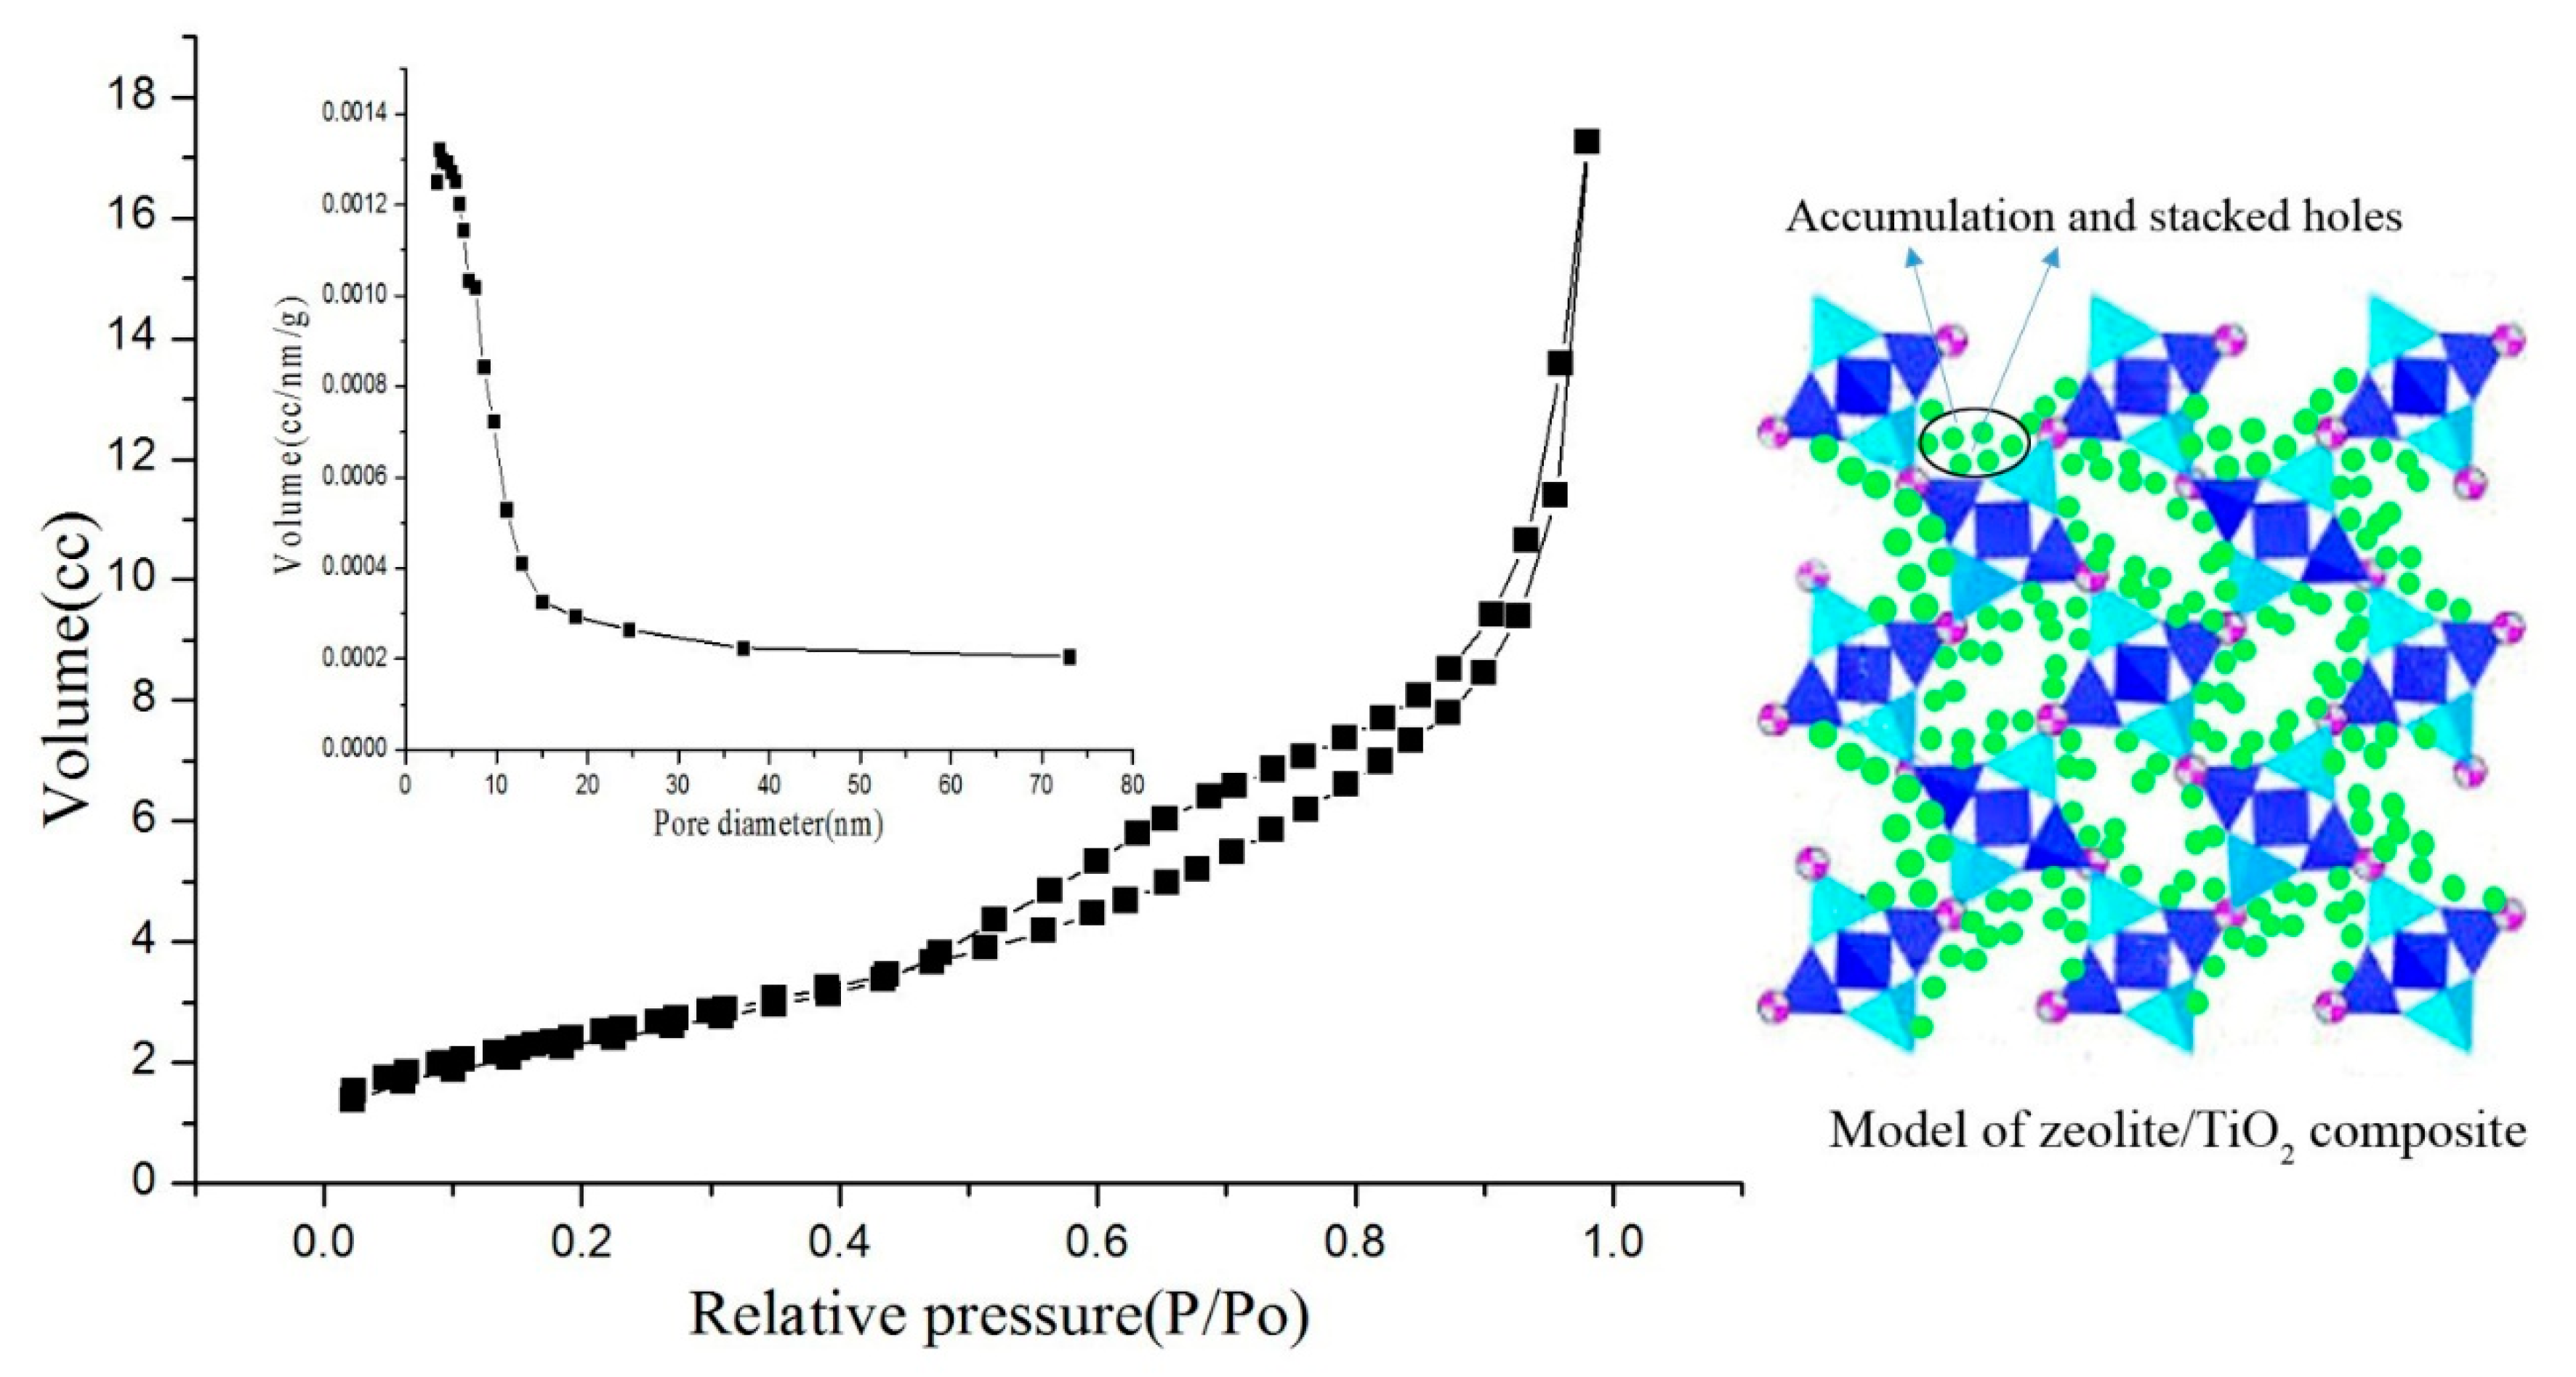
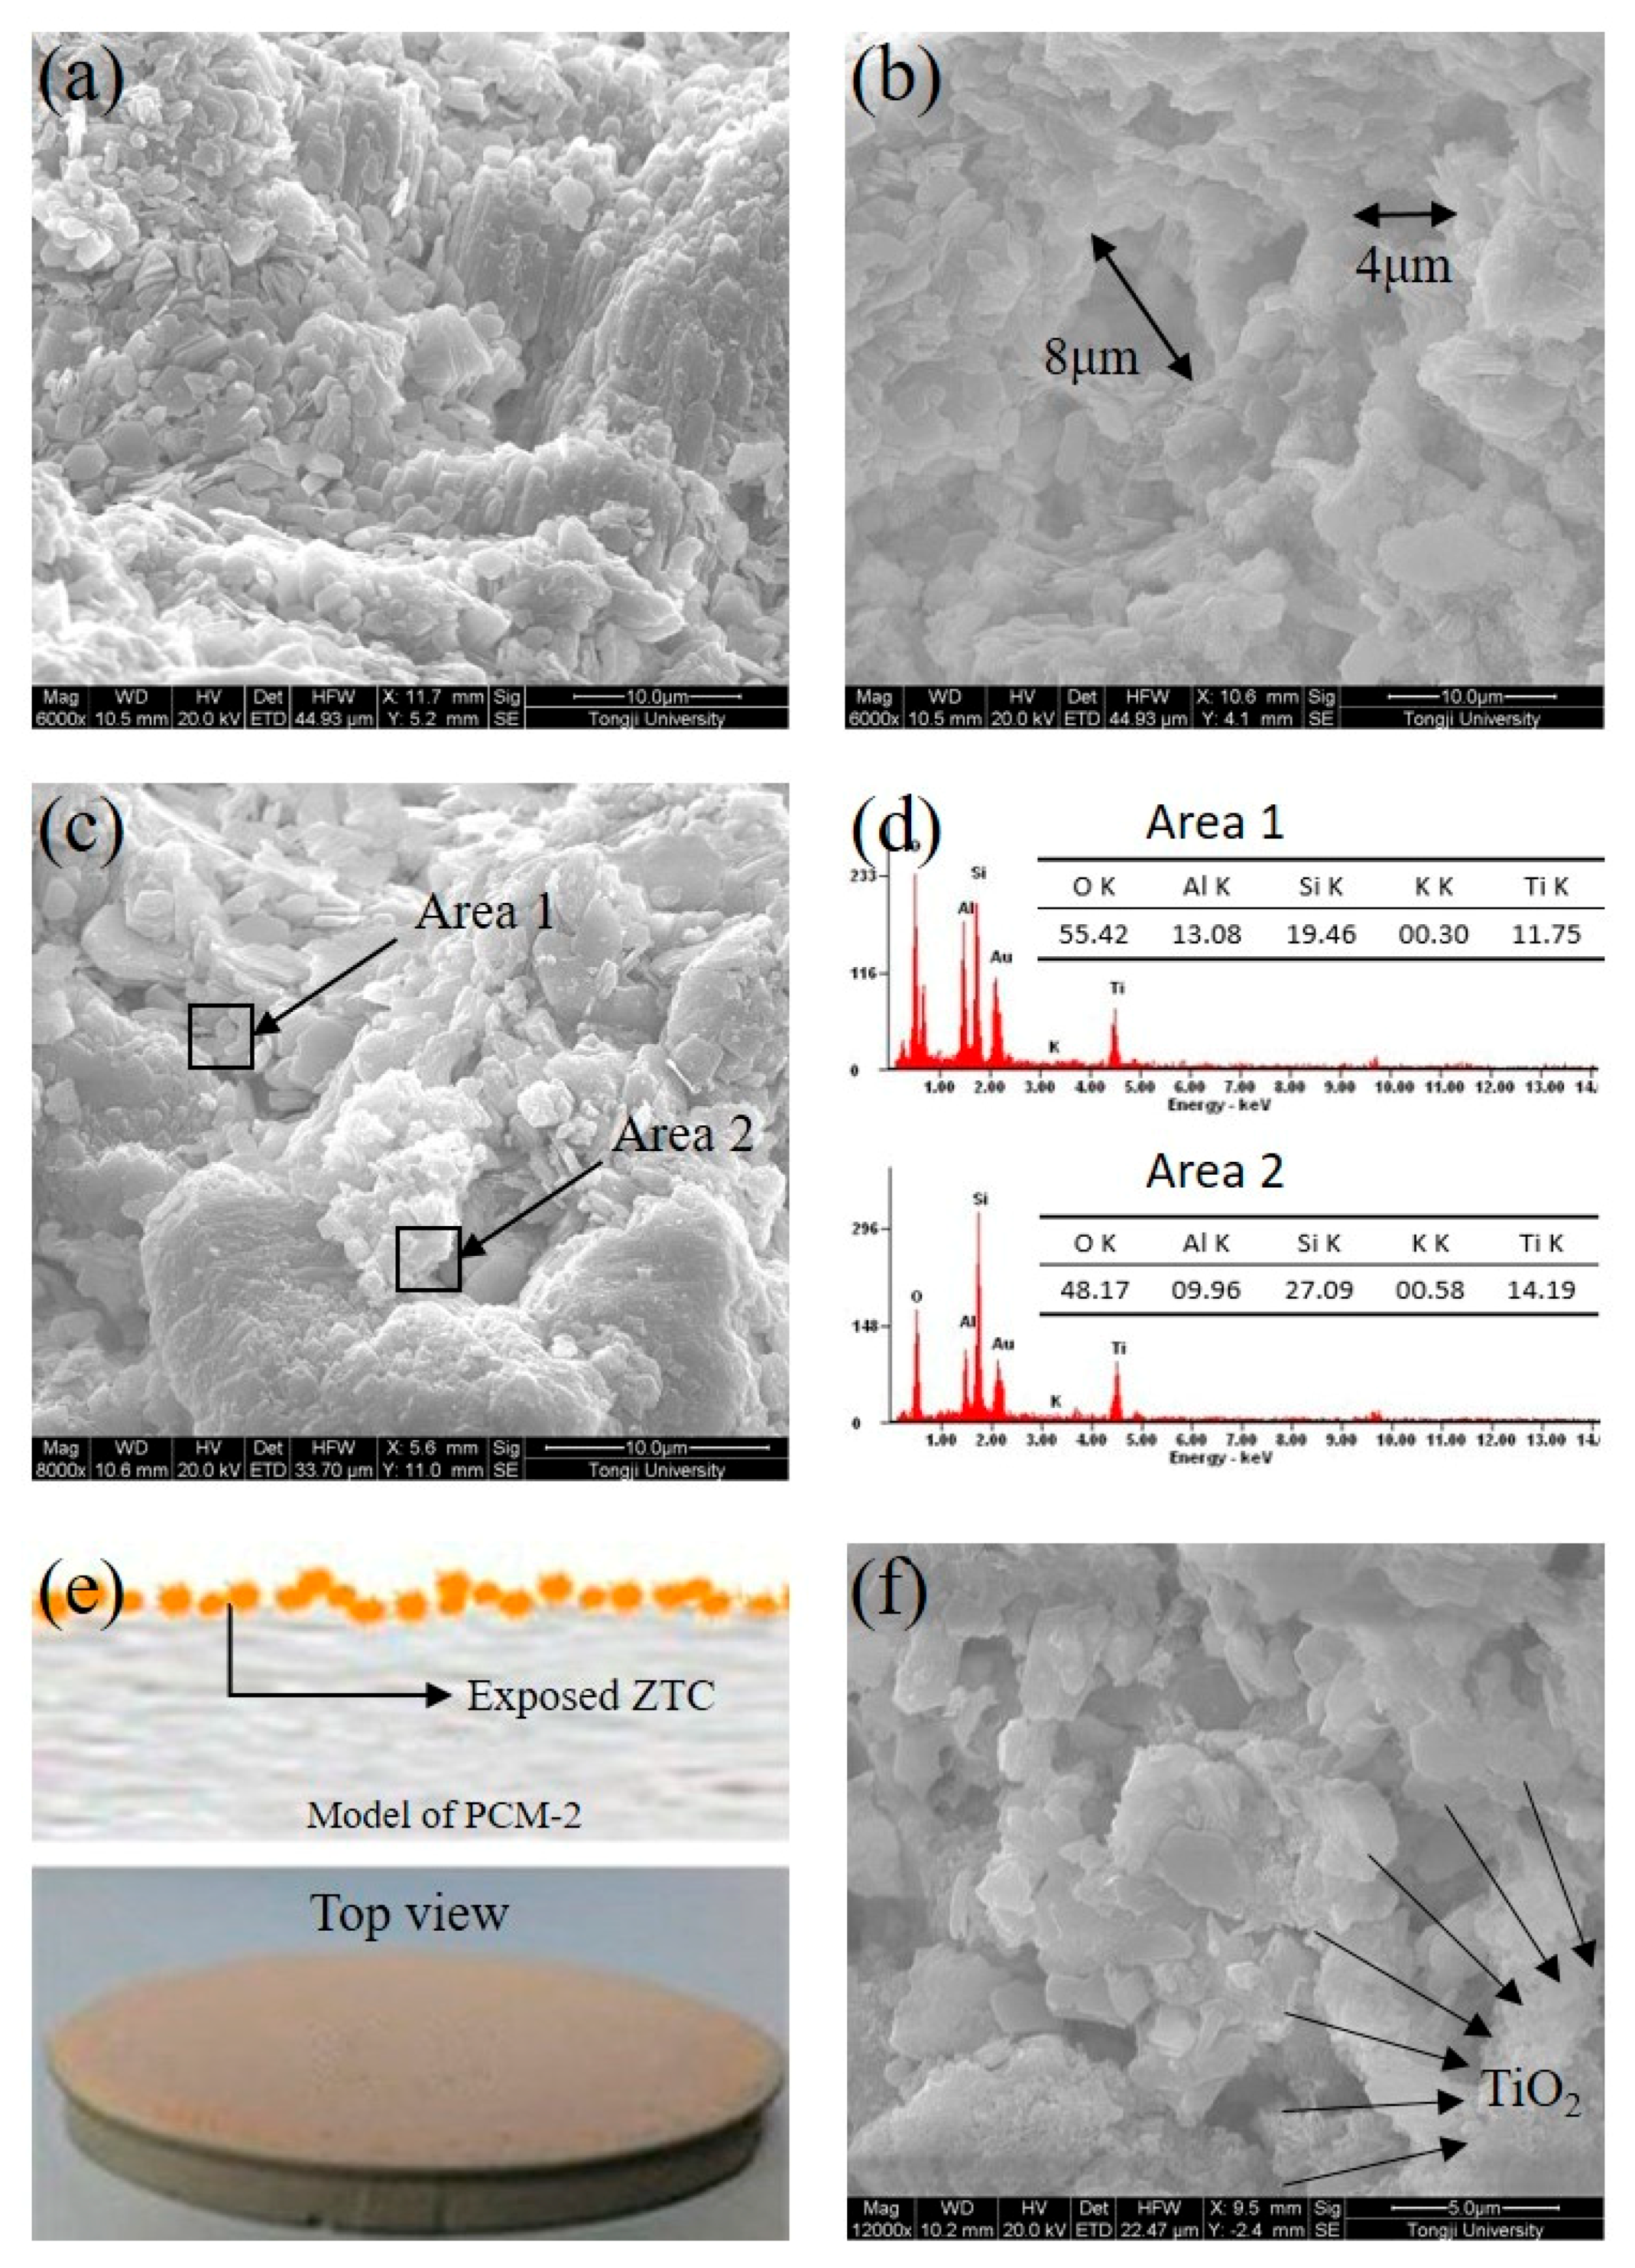
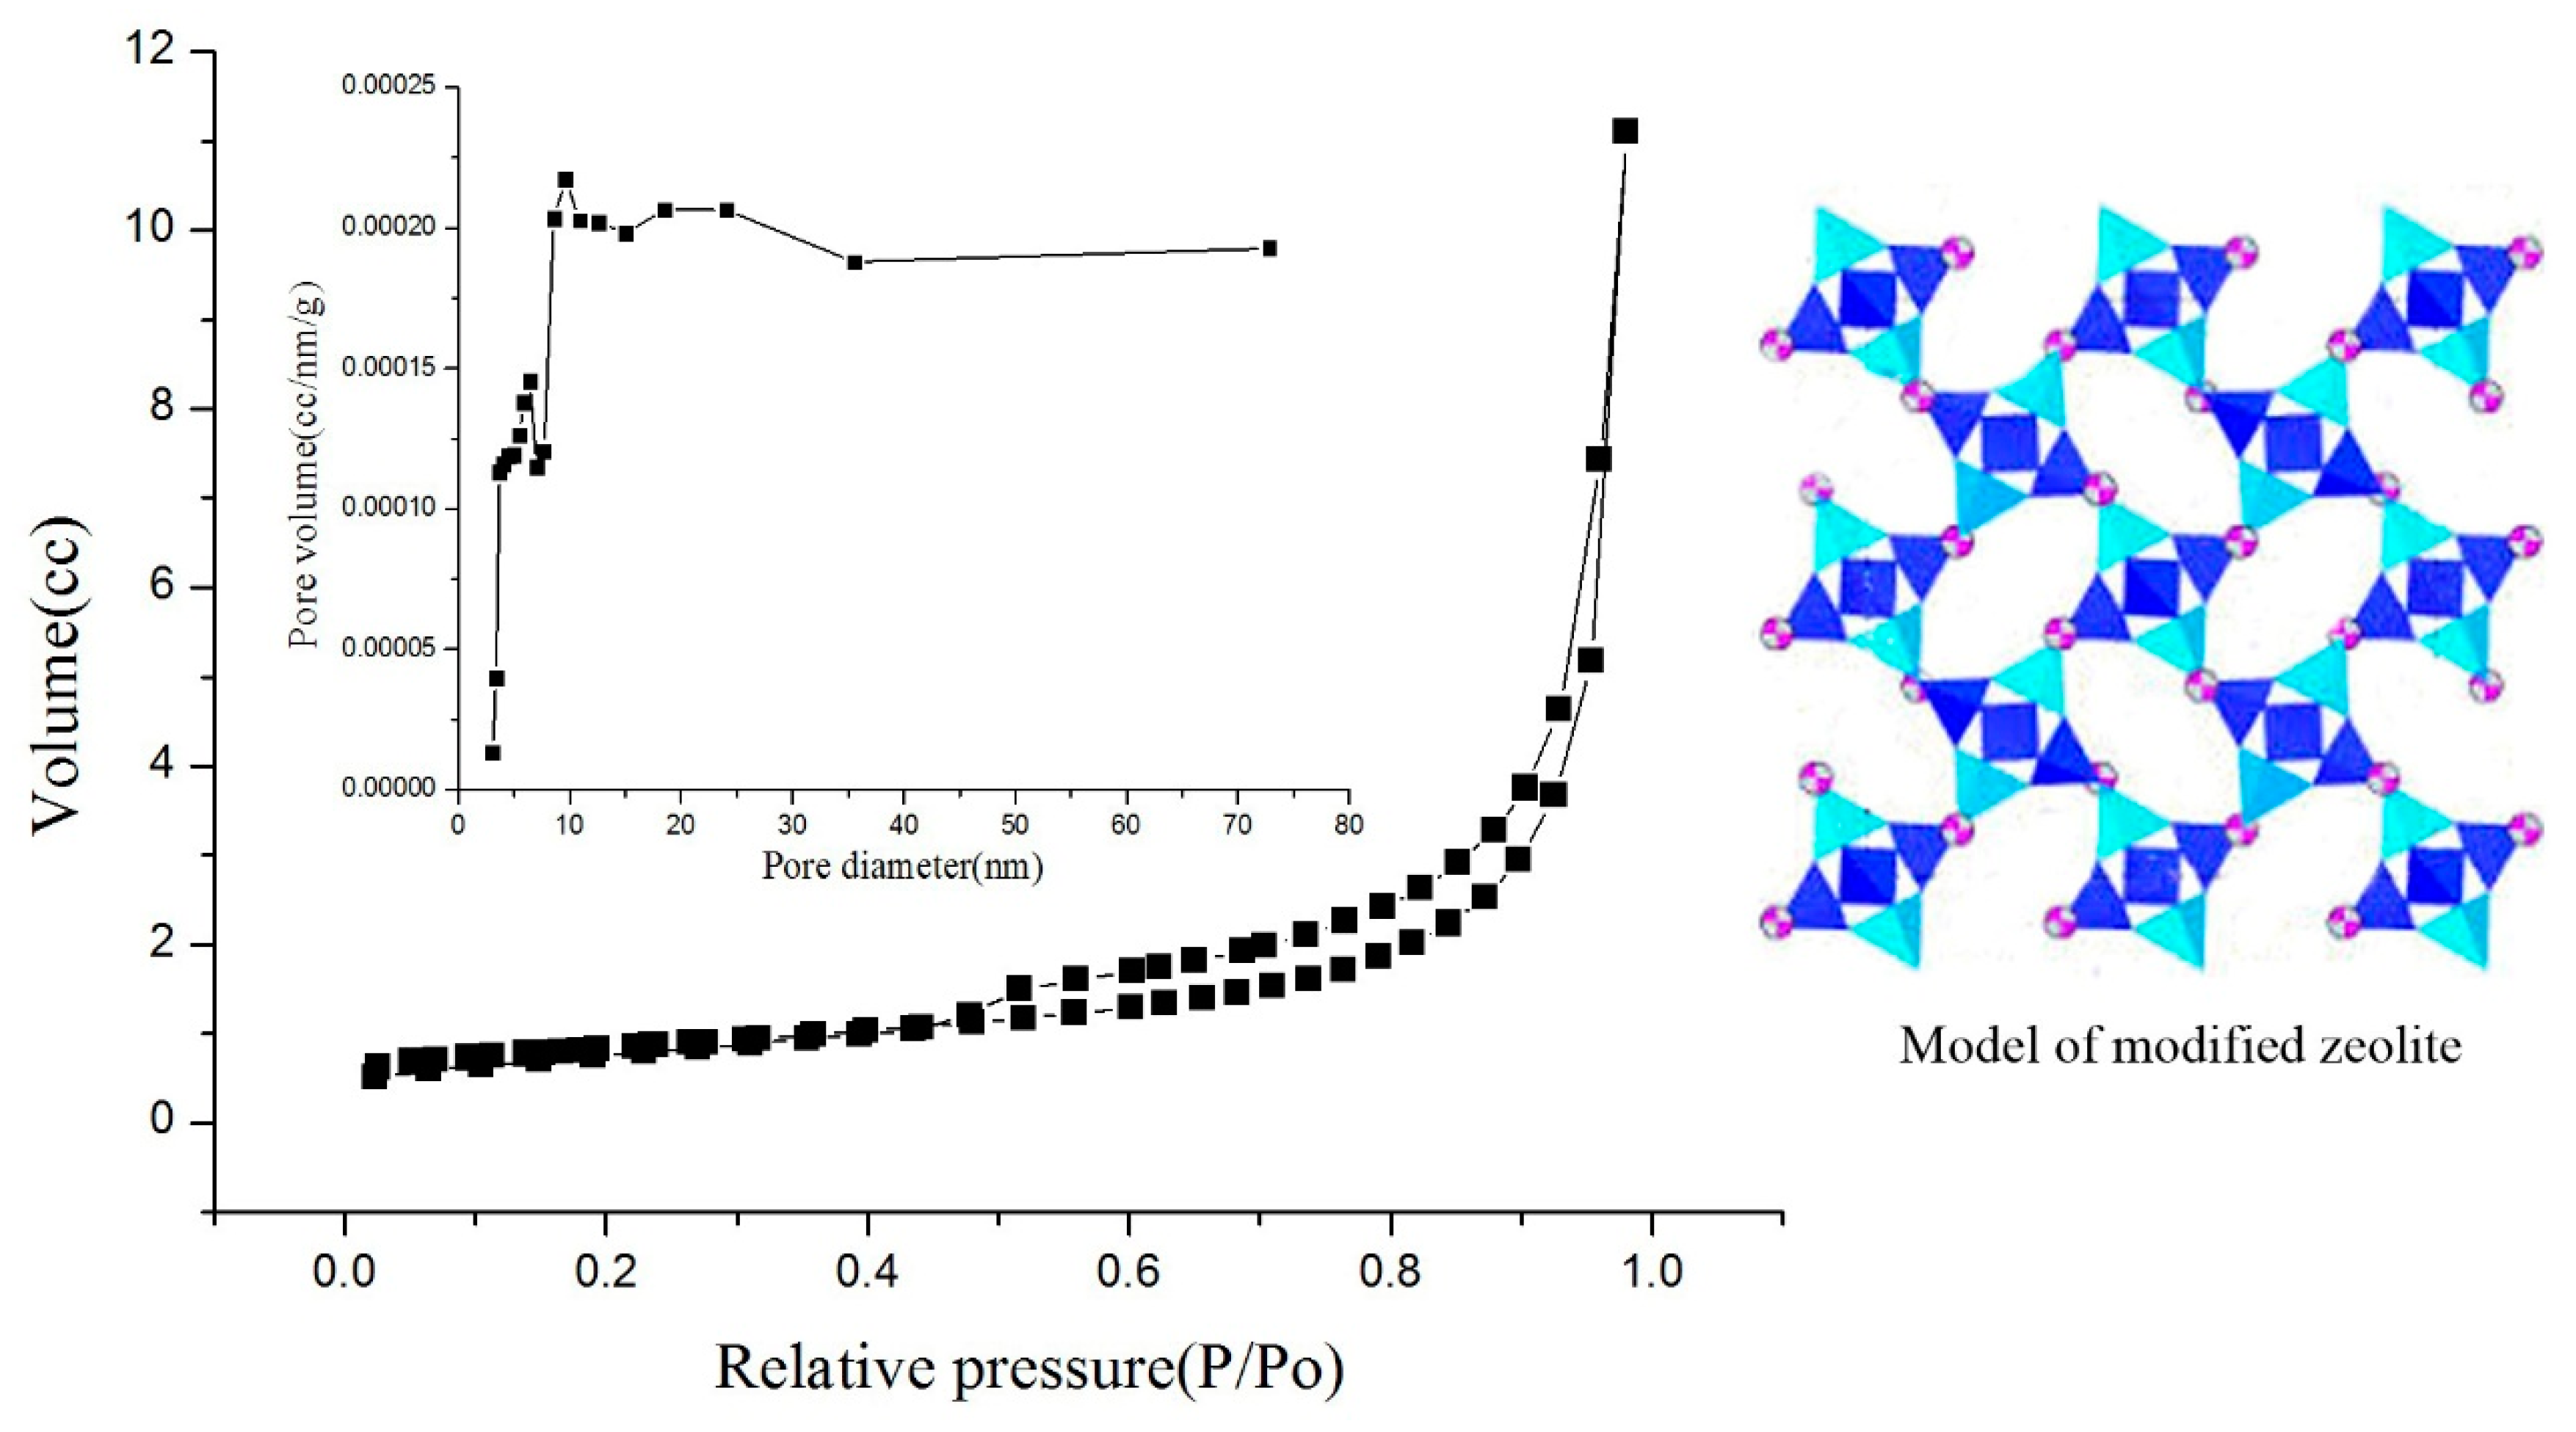
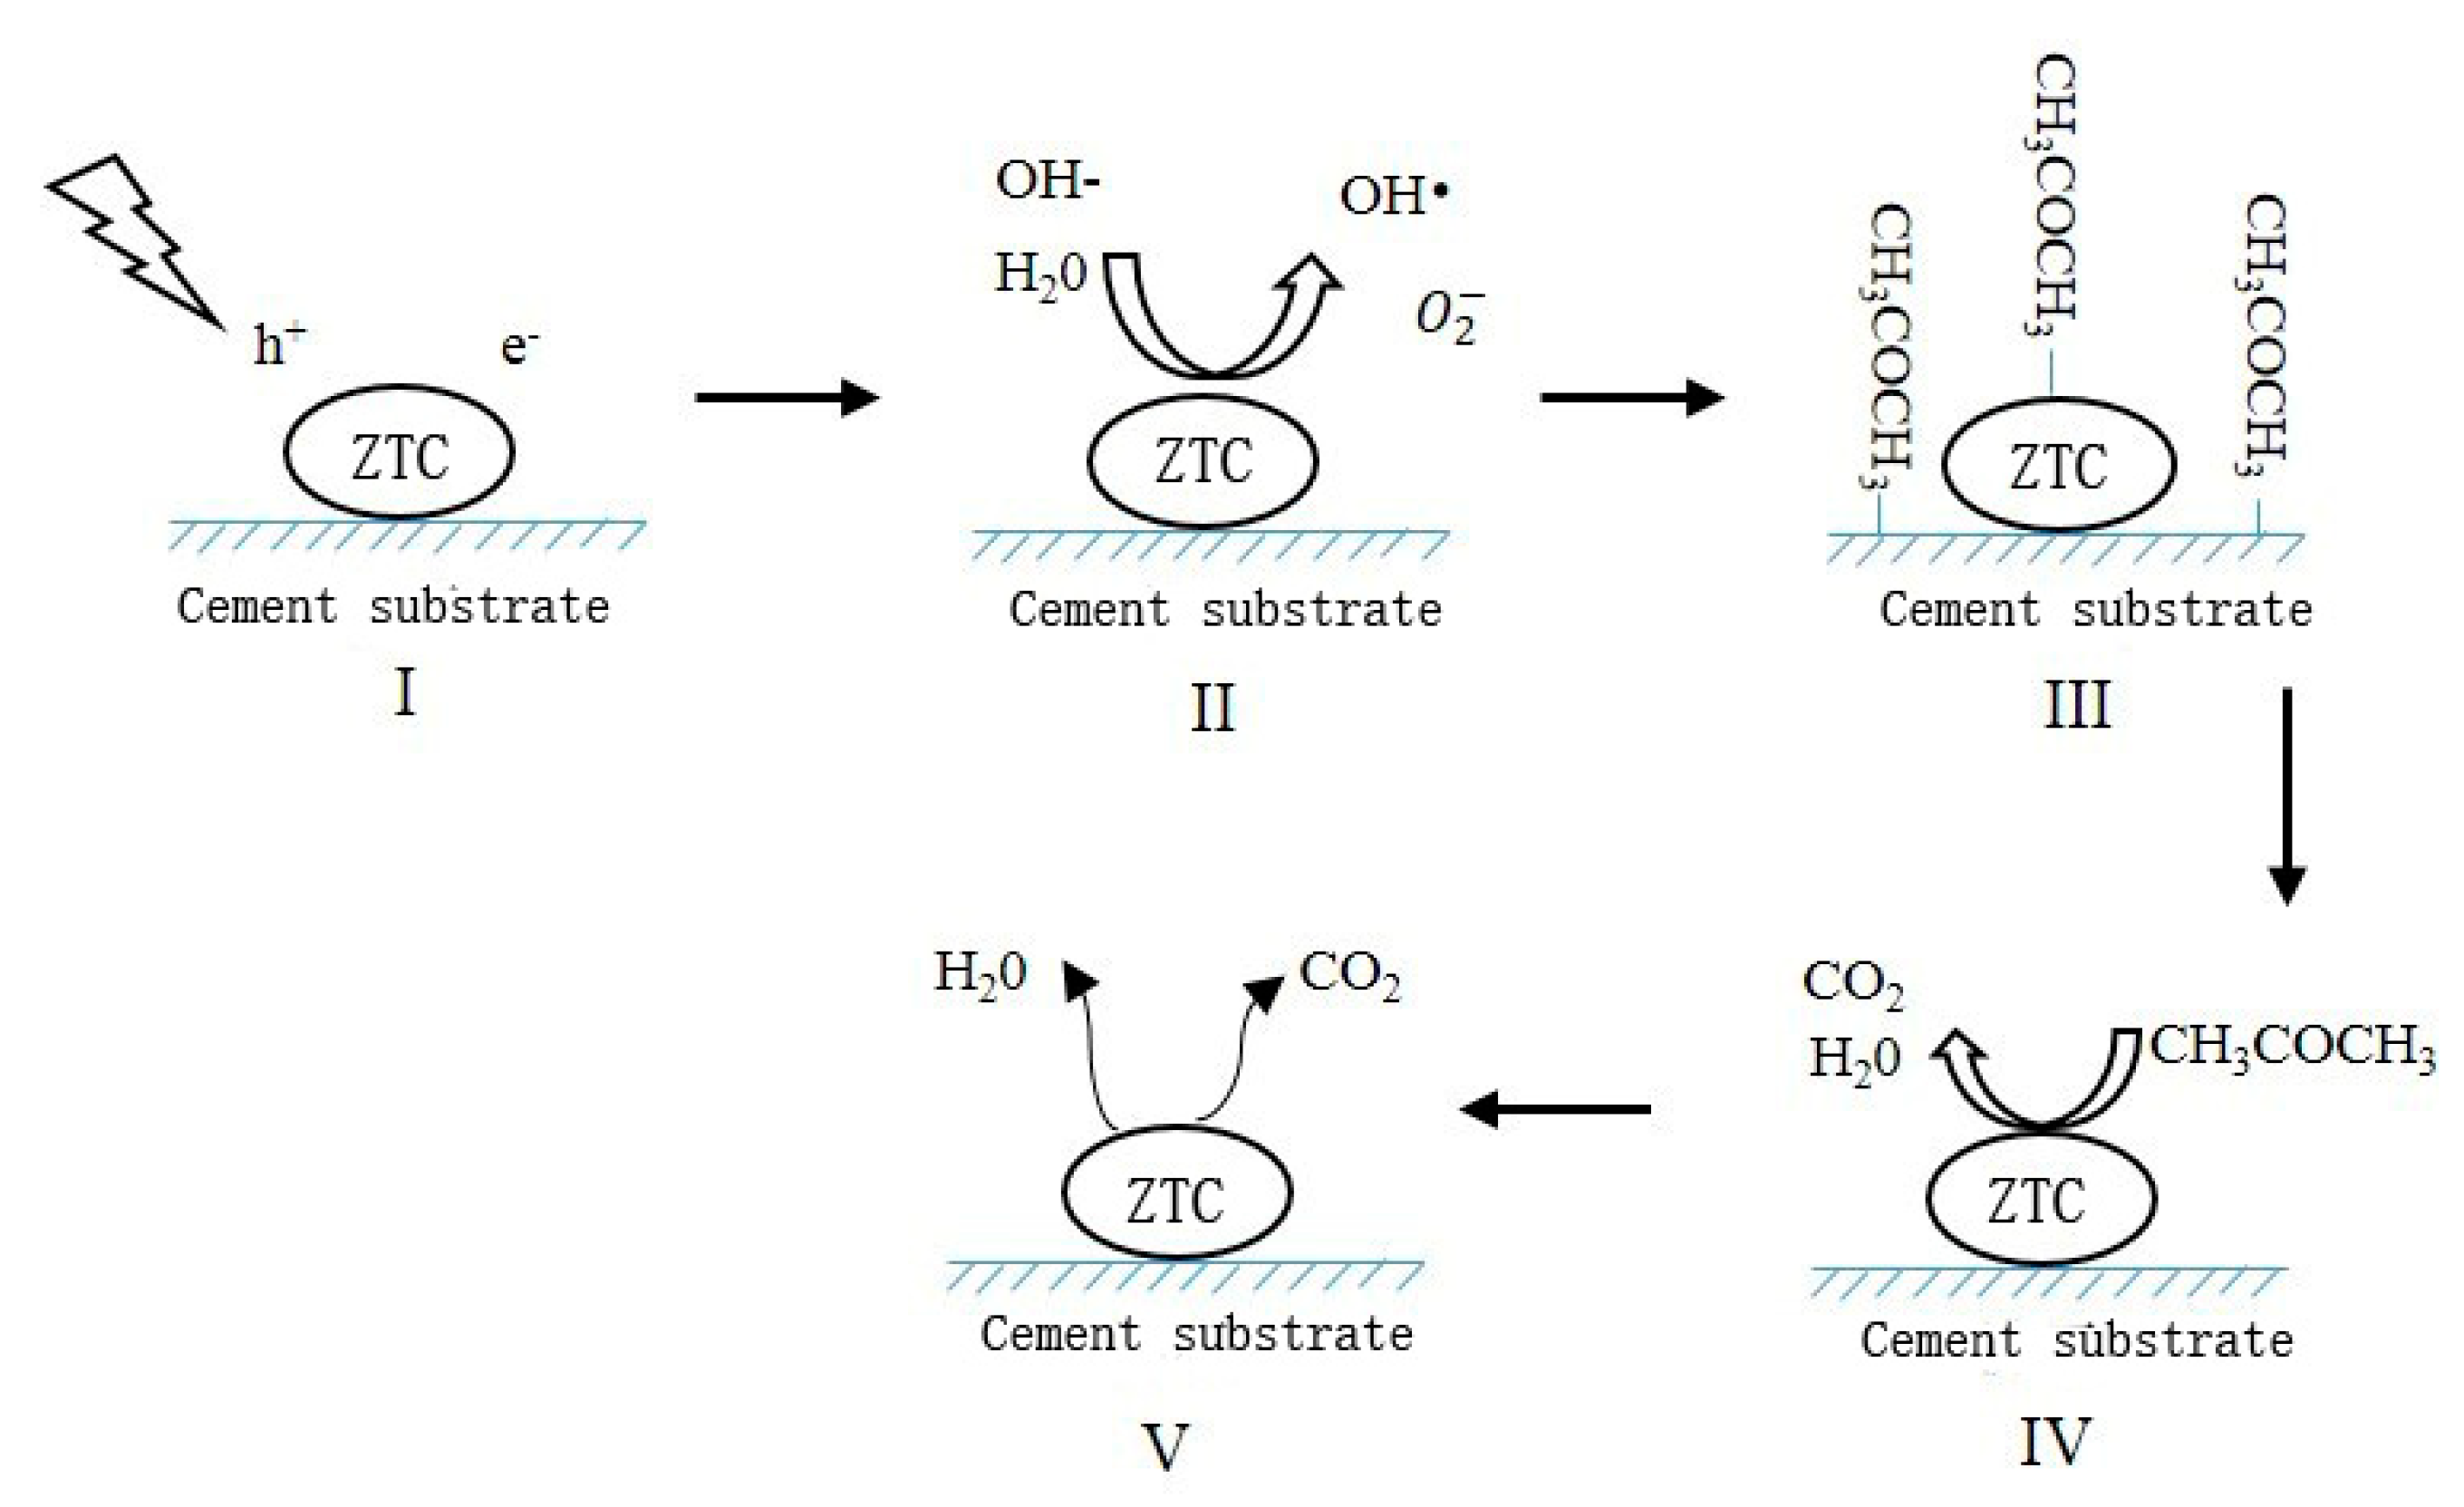
Due to the large specific surface area, natural zeolite is an optimal carrier for TiO2. After alkali corrosion and calcination, the surface of the MZ was suitable for a TiO2 precipitation. The TiO2 particles were homogeneously dispersed on the surface of the MZ in nano-scale, thereby providing a mass of active sites to participate in the photocatalytic reaction, leading to a high reaction rate.
(2)
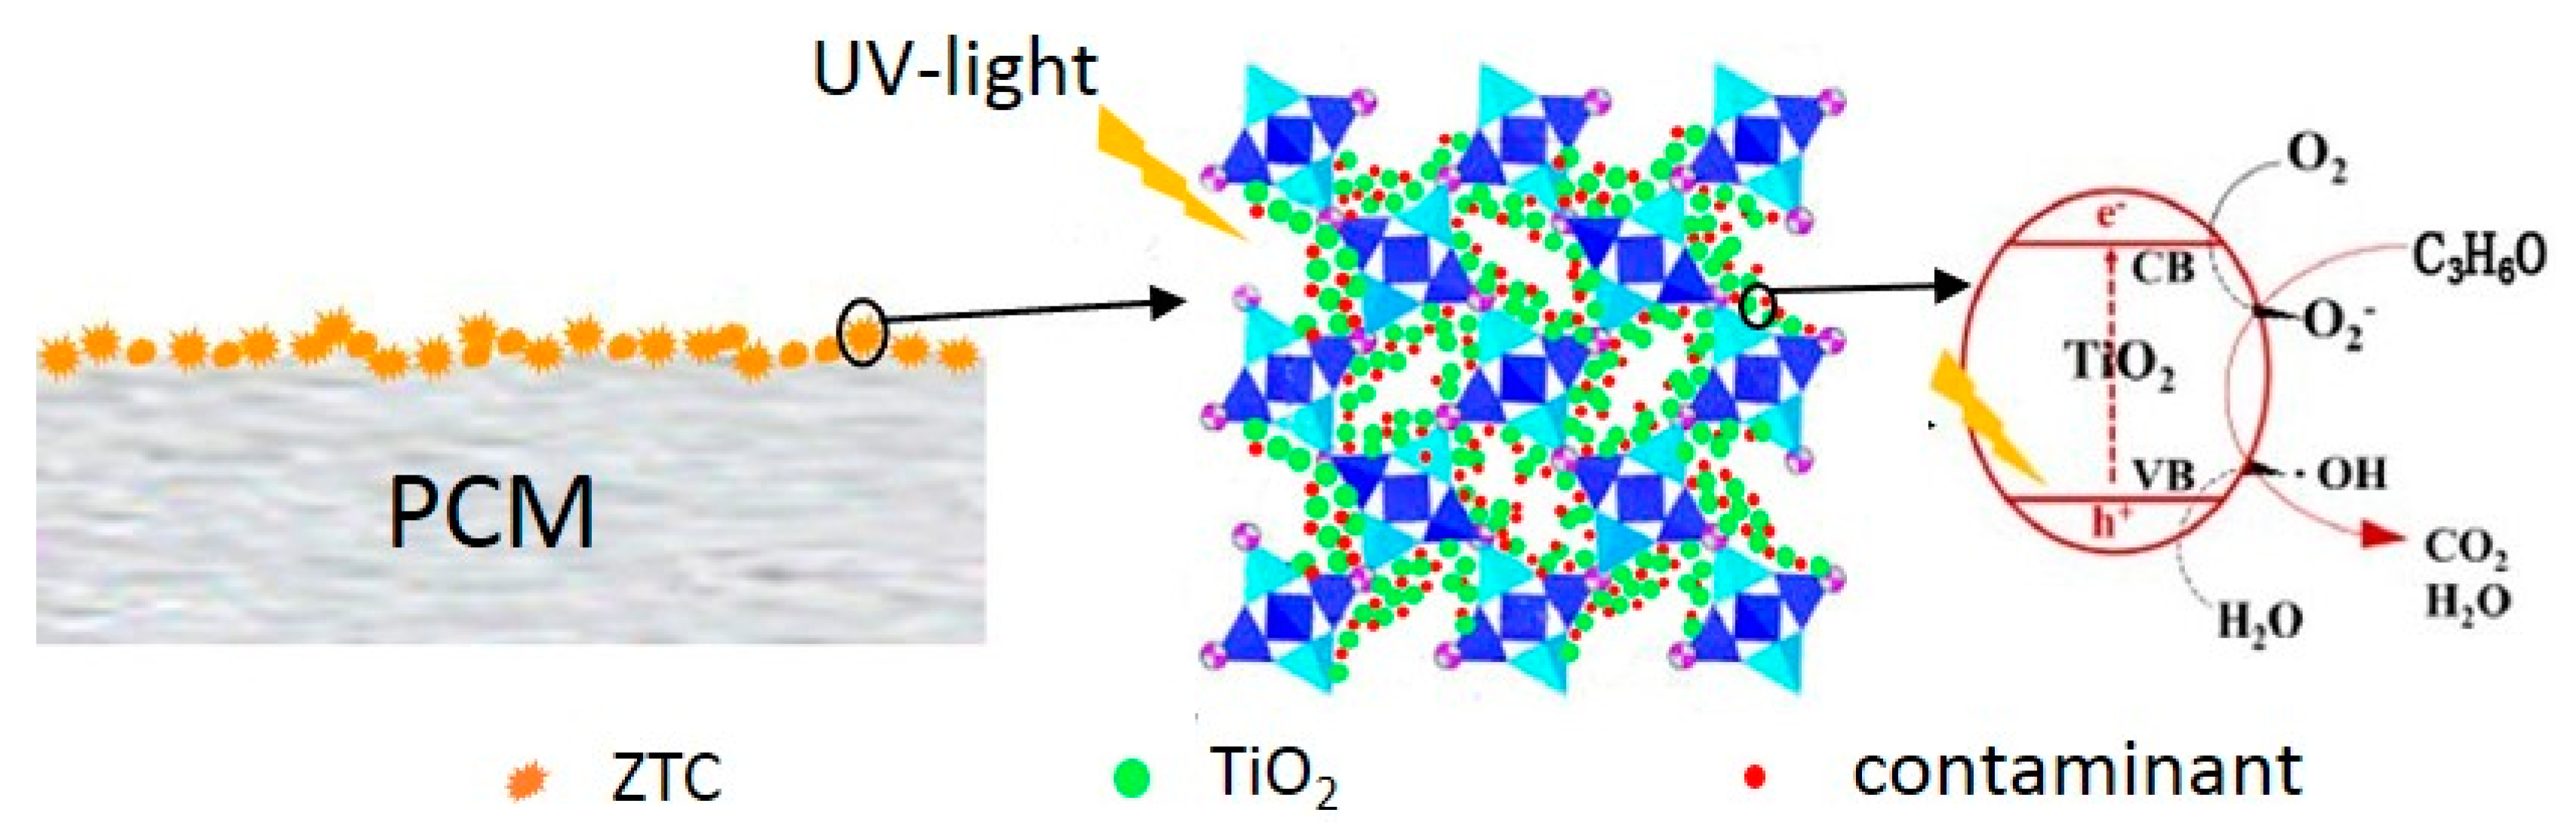
With the ZTC sprayed onto the surface of the cement matrix, the cement hydration products were not observed on TiO2 particles, indicating that the photocatalytic property of TiO2 particles would not be weakened by a cementitious system and the segregation protection of the ZTC was effective.
(3)
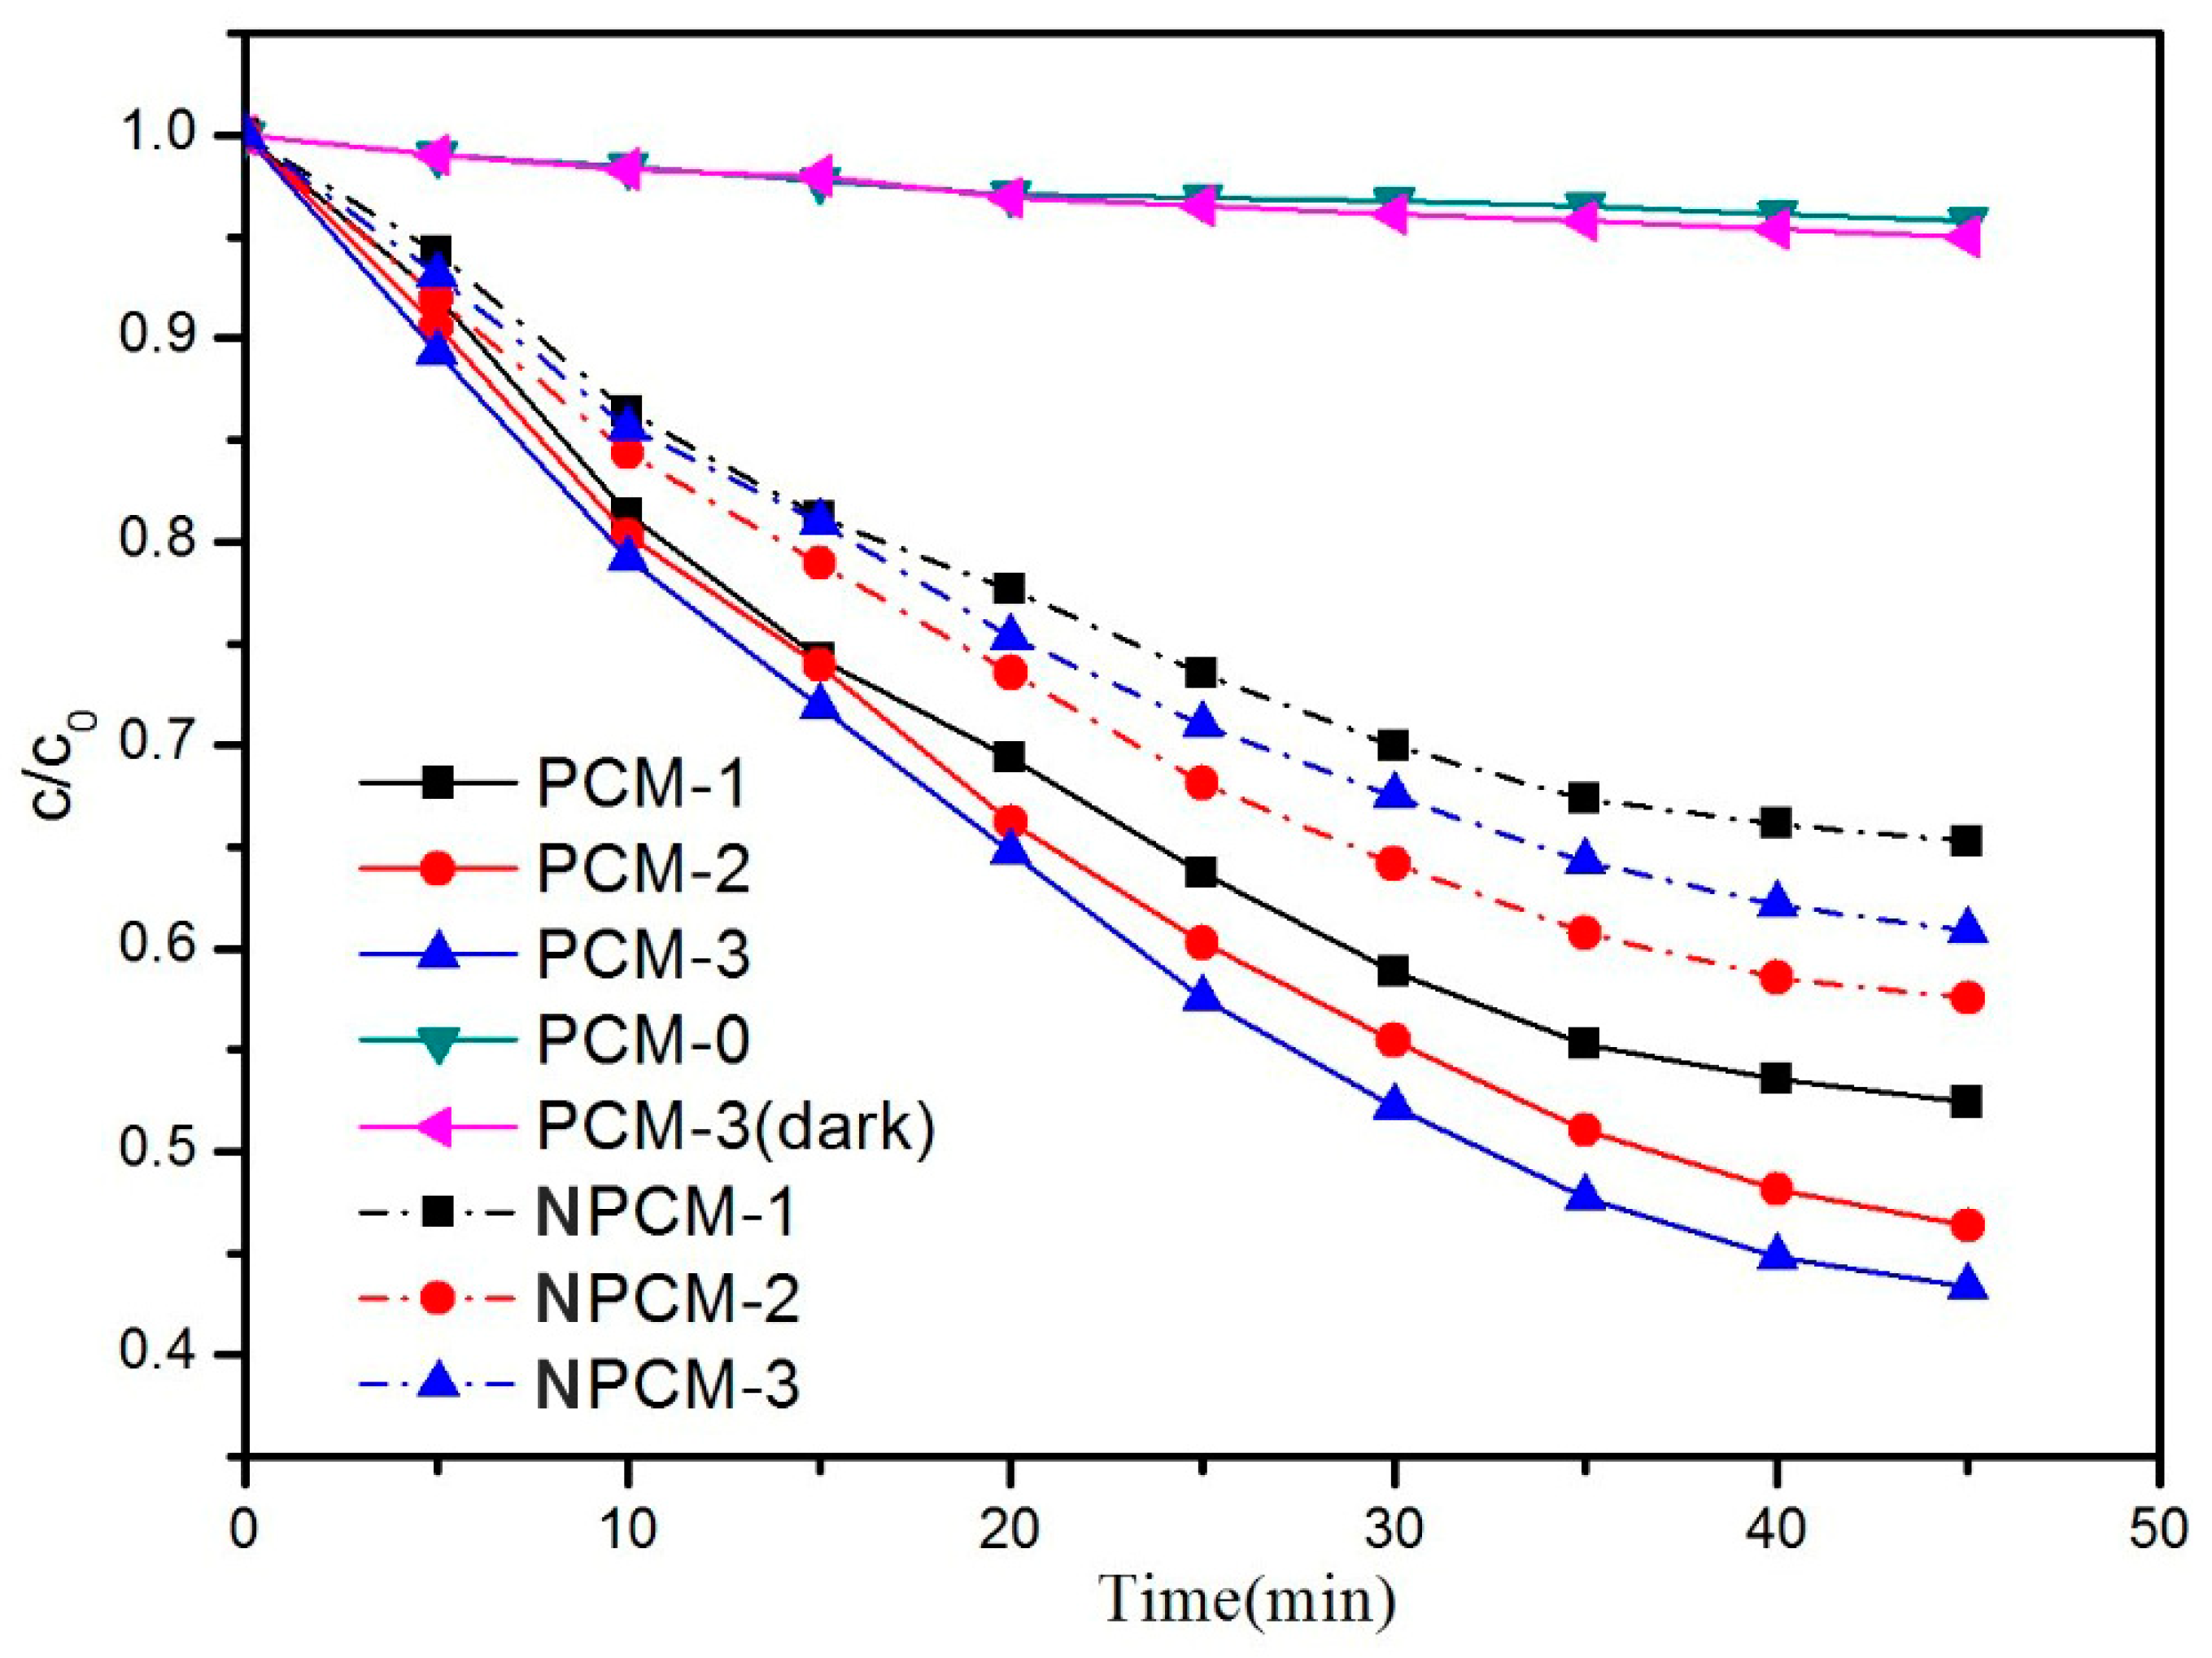
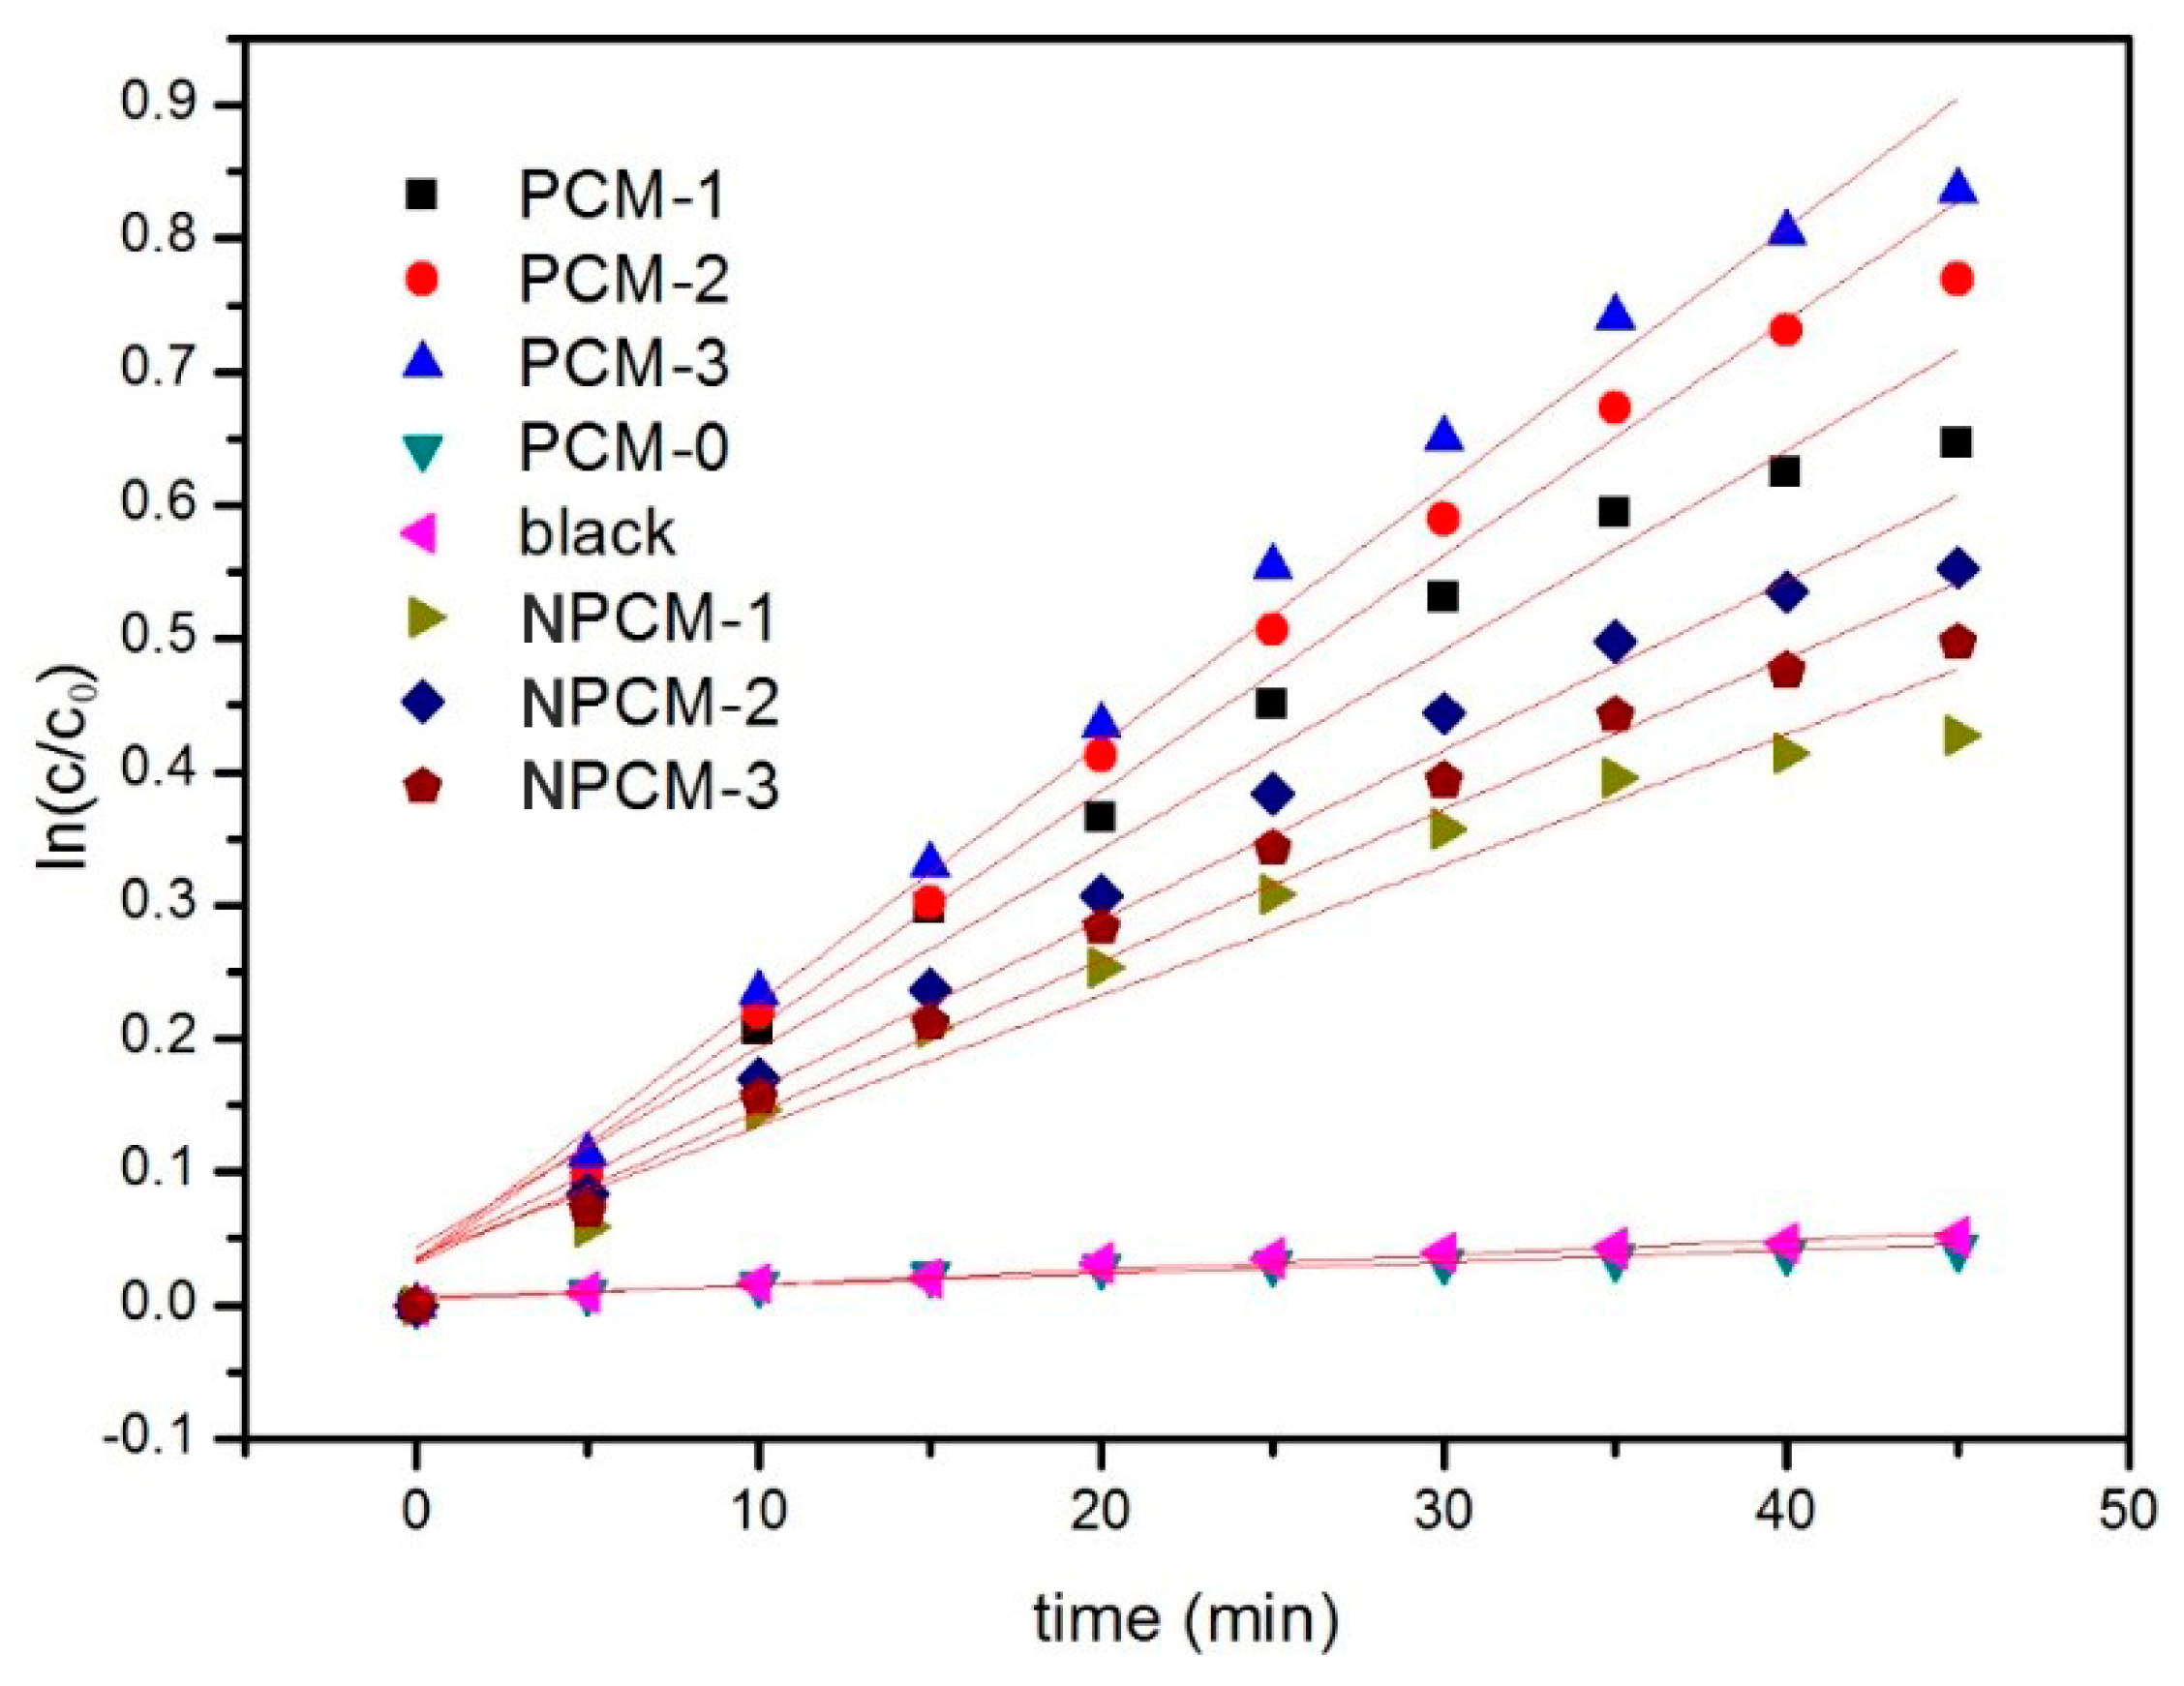
Under the same test conditions, the acetone removal rate of PCM-3 reached up to 56% and the reaction rate of PCM-3 was 1.7 times higher than NPCM-3, proving that the ZTC had a high photocatalytic performance and that the middle-carrier method applied in this work contributed to the enhancement of the photocatalytic performance of the PCM.
(4)
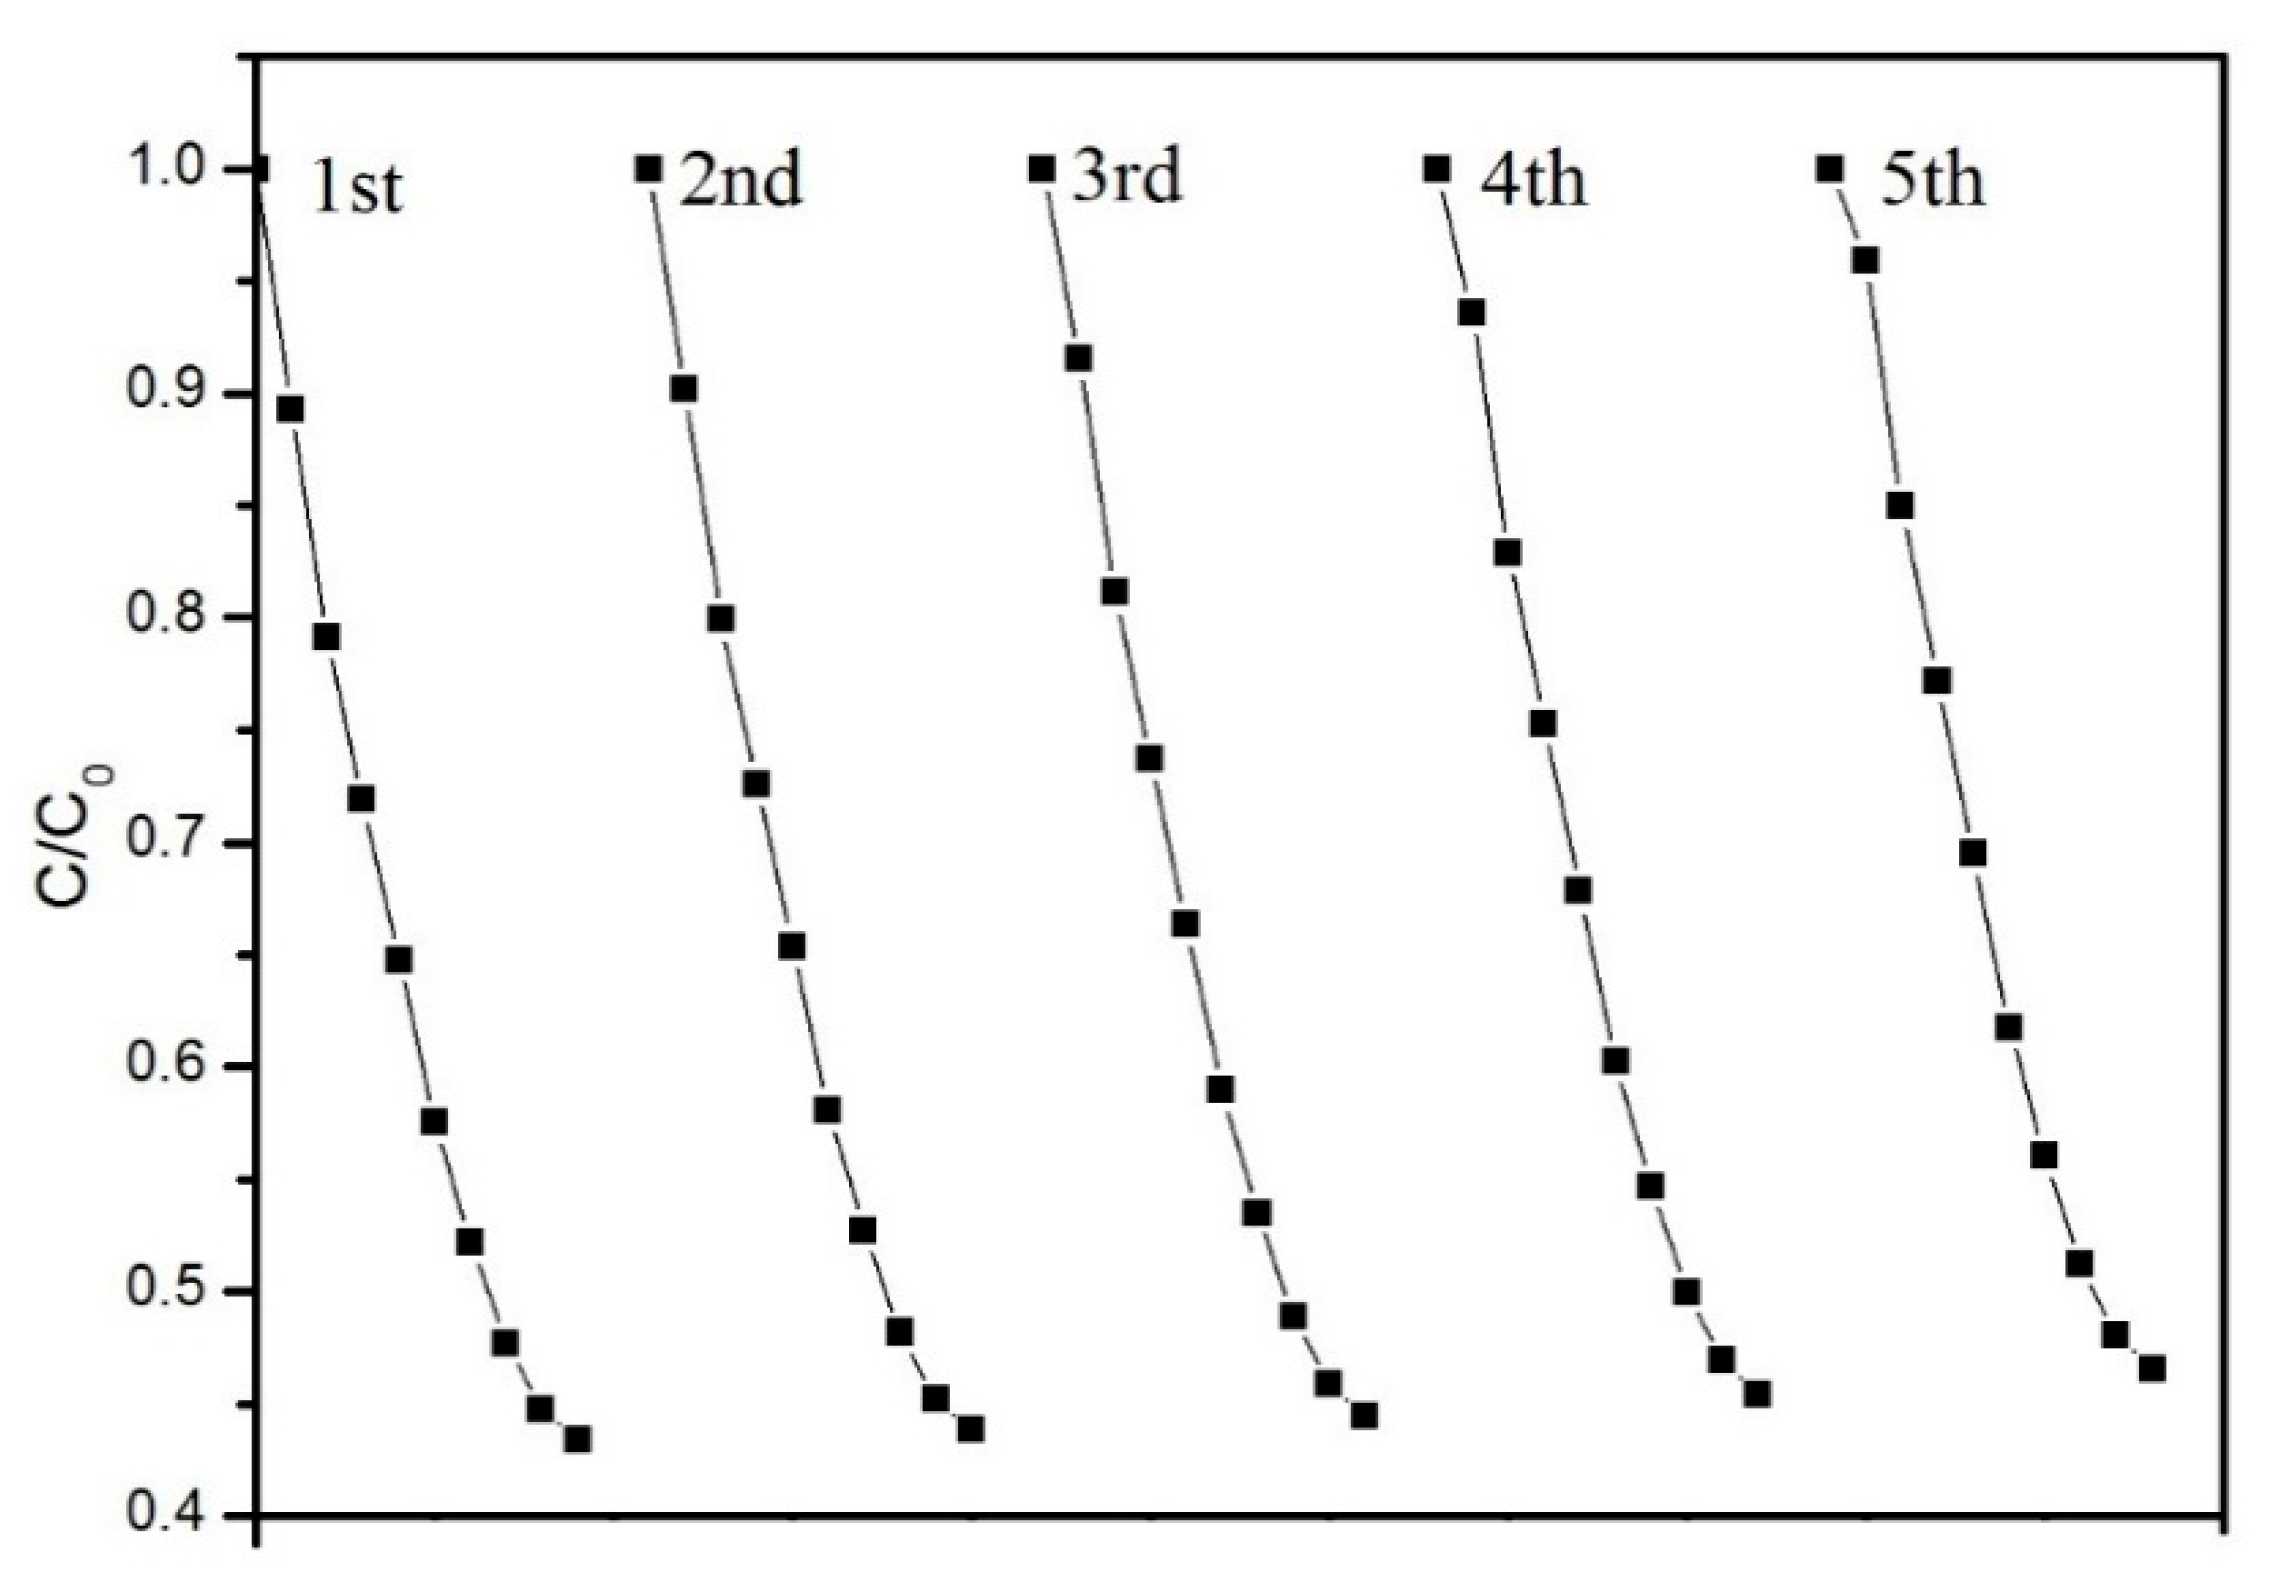
The removal efficiency of PCM-3 to the acetone was still 52% after cycling five times, thus confirming the durability and stability of the PCM.

Author Contributions

Funding acquisition, W.Y.; Investigation, G.L.; Methodology, J.Z.; Writing—original draft, G.L.

Funding

The research was funded by the Shanghai International Science and Technology Cooperation Project (12230708700), the Sichuan College of Architectural Technology Scientific Research Project (201707288), and the State Key Laboratory of High Performance Civil Engineering Materials (No. 2016CEM011).

Conflicts of Interest

The authors declare no conflict of interest.

References

  1. Demeestere, K.; Dewulf, J.; de Witte, B.; Beeldens, A.; van Langenhove, H. Heterogeneous photocatalytic removal of toluene from air on building materials enriched with TiO2. Build. Environ. 2008, 43, 406–414. [Google Scholar] [CrossRef]
  2. Jo, W.K.; Park, J.H.; Chun, H.D. Photocatalytic destruction of VOCs for in-vehicle air cleaning. J. Photochem. Photobiol. A Chem. 2002, 148, 109–119. [Google Scholar] [CrossRef]
  3. Toma, F.L.; Bertrand, G.; Klein, D.; Coddet, C. Photocatalytic removal of nitrogen oxides via titanium dioxide. Environ. Chem. Lett. 2004, 2, 117–121. [Google Scholar] [CrossRef]
  4. Hüsken, G.; Hunger, M.; Brouwers, H.J. Comparative Study on Cementitious Products Containing Titanium Dioxide as Photo-Catalyst. In Proceedings of the International RILEM Symposium on Photocatalysis, Environment and Construction Materials—TDP, Florence, Italy, 8–9 October 2007; pp. 147–154. [Google Scholar]
  5. Dalton, J.S.; Janes, P.A.; Jones, N.G.; Nicholson, J.A.; Hallam, K.R.; Allen, G.C. Photocatalytic oxidation of NOx gases using TiO2: A surface spectroscopic approach. Environ. Pollut. 2002, 120, 415–422. [Google Scholar] [CrossRef]
  6. Ao, C.H.; Lee, S.C. Enhancement effect of TiO2 immobilized on activated carbon filter for the photodegradation of pollutants at typical indoor air level. Appl. Catal. B Environ. 2003, 44, 191–205. [Google Scholar] [CrossRef]
  7. Poon, C.S.; Cheung, E. NO removal efficiency of photocatalytic paving blocks prepared with recycled materials. Constr. Build. Mater. 2007, 21, 1746–1753. [Google Scholar] [CrossRef]
  8. Zhao, J.; Yang, X.D. Photocatalytic oxidation for indoor air purification: A literature review. Build. Environ. 2003, 38, 645–654. [Google Scholar] [CrossRef]
  9. Devahasdin, S.; Fan, C., Jr.; Li, K.; Chen, D.H. TiO2 photocatalytic oxidation of nitric oxide: Transient behavior and reaction kinetics. J. Photochem. Photobiol. A Chem. 2003, 156, 161–170. [Google Scholar] [CrossRef]
  10. Zhang, Y.; Stefanakos, E.K.; Goswami, D.Y. Effect of photocatalytic surface roughness on reactors effectiveness for indoor air cleaning. Build. Environ. 2013, 61, 188–196. [Google Scholar] [CrossRef]
  11. Sugrañez, R.; Álvarez, J.I.; Cruz-Yusta, M.; Mármol, I.; Morales, J.; Vila, J.; Sánchez, L. Enhanced photocatalytic degradation of NOx gases by regulating the microstructure of mortar cement modified with titanium dioxide. Build. Environ. 2013, 69, 55–63. [Google Scholar] [CrossRef]
  12. Horgnies, M.; Dubois-Brugger, I.; Gartner, E.M. NOx de-pollution by hardened concrete and the influence of activated charcoal additions. Cem. Concr. Res. 2012, 42, 1348–1355. [Google Scholar] [CrossRef]
  13. Chen, J.; Poon, C.-S. Photocatalytic activity of titanium dioxide modified concrete materials—Influence of utilizing recycled glass cullets as aggregates. J. Environ. Manag. 2009, 90, 3436–3442. [Google Scholar] [CrossRef]
  14. Wang, F.; Yang, L.; Sun, G.; Guan, L.; Hu, S. The hierarchical porous structure of substrate enhanced photocatalytic activity of TiO2/cementitious materials. Constr. Build. Mater. 2014, 64, 488–495. [Google Scholar] [CrossRef]
  15. Yamazaki, S.; Tanaka, S.; Tsukamoto, H. Kinetic studies of oxidation of ethylene over a TiO2 photocatalyst. J. Photochem. Photobiol. A Chem. 1999, 121, 55–61. [Google Scholar] [CrossRef]
  16. Folli, A.; Pochard, I.; Nonat, A.; Jakobsen, U.H.; Shepherd, A.M.; Macphee, D.E. Engineering Photocatalytic Cements: Understanding TiO2 Surface Chemistry to Control and Modulate Photocatalytic Performances. J. Am. Ceram. Soc. 2010, 93, 3360–3369. [Google Scholar] [CrossRef]
  17. Lackhoff, M.; Prieto, X.; Nestle, N.; Dehn, F.; Niessner, R. Photocatalytic activity of semiconductor-modified cement-influence of semiconductor type and cement ageing. Appl. Catal. B Environ. 2003, 43, 205–216. [Google Scholar] [CrossRef]
  18. Chen, J.; Kou, S.; Poon, C. Photocatalytic cement-based materials: Comparison of nitrogen oxides and toluene removal potentials and evaluation of self-cleaning performance. Build. Environ. 2011, 46, 1827–1833. [Google Scholar] [CrossRef]
  19. Neppolian, B.; Kanel, S.R.; Choi, H.C.; Shankar, M.V.; Arabindoo, B.; Murugesan, V. Photocatalytic degradation of reactive yellow 17 dye in aqueous solution in the presence of TiO2 with cement binder. Int. J. Photoenergy 2003, 5, 45–49. [Google Scholar] [CrossRef]
  20. Vallée, F.; Ruot, B.; Bonafous, L.; Guillot, L.; Pimpinelli, N.; Cassar, L.; Strini, A.; Mapelli, E.; Schiavi, L.; Gobin, C.; et al. Innovative Self-Cleaning and De-Polluting Facade Surfaces. Presented at the CIB World Building Congress 2004, Toronto, ON, Canada, 2–7 May 2004. [Google Scholar]
  21. Lee, B.Y.; Jayapalan, A.R.; Bergin, M.H.; Kurtis, K.E. Photocatalytic cement exposed to nitrogen oxides: Effect of oxidation and binding. Cem. Concr. Res. 2014, 60, 30–36. [Google Scholar] [CrossRef]
  22. Shen, S.; Burton, M.; Jobson, B.; Haselbach, L. Pervious concrete with titanium dioxide as a photocatalyst compound for a greener urban road environment. Constr. Build. Mater. 2012, 35, 874–883. [Google Scholar] [CrossRef]
  23. Najafabadi, A.T.; Taghipour, F. Physicochemical impact of zeolites as the support for photocatalytic hydrogen production using solar-activated TiO2-based nanoparticles. Energy Convers. Manag. 2014, 82, 106–113. [Google Scholar] [CrossRef]
  24. Reddy, E.P.; Davydov, L.; Smirniotis, P. TiO2-loaded zeolites and mesoporous materials in the sonophotocatalytic decomposition of aqueous organic pollutants: The role of the support. Appl. Catal. B-Environ. 2003, 42, 1–11. [Google Scholar] [CrossRef]
  25. Jansson, I.; Suárez, S.; Garcia-Garcia, F.J.; Sánchez, B. Zeolite-TiO2 hybrid composites for pollutant degradation in gas phase. Appl. Catal. B Environ. 2015, 178, 100–107. [Google Scholar] [CrossRef]
  26. Sun, Q.; Hu, X.; Zheng, S.; Sun, Z.; Liu, S.; Li, H. Influence of calcination temperature on the structural, adsorption and photocatalytic properties of TiO2 nanoparticles supported on natural zeolite. Powder Technol. 2015, 274, 88–97. [Google Scholar] [CrossRef]
  27. Yang, L.; Gao, Y.; Wang, F.; Liu, P.; Hu, S. Enhanced photocatalytic performance of cementitious material with TiO2@Ag modified fly ash micro-aggregates. Cuihua Xuebao/Chin. J. Catal. 2017, 38, 357–364. [Google Scholar] [CrossRef]
  28. Yu, J.; Zhang, L.; Cheng, B.; Su, Y. Hydrothermal preparation and photocatalytic activity of hierarchically sponge-like macro-/mesoporous Titania. J. Phys. Chem. C 2007, 111, 10582–10589. [Google Scholar] [CrossRef]
  29. Mao, Y.; Jiang, A.; Shen, C.; Yan, T. Seasonal choice of factors defining the ultraviolet radiation intensity levels. Sci. Meteorol. Sin. 2010, 30, 516–521. [Google Scholar]
  30. Ku, Y.; Tseng, K.Y.; Wang, W.Y. Decomposition of gaseous acetone in an annular photoreactor coated with TiO2 thin film. Water Air Soil Pollut. 2005, 168, 313–323. [Google Scholar] [CrossRef]
  31. De Man, A.J.M.; Sauer, J. Coordination, Structure, and Vibrational Spectra of Titanium in Silicates and Zeolites in Comparison with Related Molecules. An ab Initio Study. J. Phys. Chem. 1996, 100, 551–559. [Google Scholar] [CrossRef]
  32. Yao, J.Z.; Li, C.L.; Lu, L.N.; Bing, L.W. A facile and low-cost synthesis of granulated blast furnace slag-based cementitious material coupled with Fe2O3 catalyst for treatment of dye wastewater. Appl. Catal. B Environ. 2013, 138–139, 9–16. [Google Scholar]
  33. Blake, D. Bibliography of Work on Photocatalytic Removal of Hazardous Compounds from Water and Air. Sol. Energy 2001, 30, 845–856. [Google Scholar]
  34. Jenny, S.; Matsuoka, M.; Takeuchi, M.; Zhang, J.; Horiuchi, Y.; Anpo, M.; Bahnemann, D. Understanding TiO2 photocatalysis: Mechanisms and materials. Chem. Rev. 2014, 114, 9919–9986. [Google Scholar]
  35. Vincent, G.; Marquaire, P.M.; Zahraa, O. Abatement of volatile organic compounds using an annular photocatalytic reactor: Study of gaseous acetone. J. Photochem. Photobiol. A Chem. 2008, 197, 177–189. [Google Scholar] [CrossRef]
  36. Corma, A.; Garcia, H. Zeolite-based photocatalysts. Chem. Commun. 2004, 35, 1443–1459. [Google Scholar] [CrossRef]
  37. Hashimoto, S. Zeolite photochemistry: Impact of zeolites on photochemistry and feedback from photochemistry to zeolite science. J. Photochem. Photobiol. C Photochem. Rev. 2003, 4, 19–49. [Google Scholar] [CrossRef]
  38. Matsuoka, M.; Anpo, M. Local structures, excited states, and photocatalytic reactivities of highly dispersed catalysts constructed within zeolites. J. Photochem. Photobiol. C Photochem. Rev. 2003, 3, 225–252. [Google Scholar] [CrossRef]
  39. Chen, F.; Pehkonen, S.O.; Ray, M.B. Kinetics and mechanisms of UV-photodegradation of chlorinated organics in the gas phase. Water Res. 2002, 36, 4203–4214. [Google Scholar]
  40. Ji, H.W.; Ray, M.B. Application of ultraviolet photooxidation to remove organic pollutants in the gas phase. Sep. Purif. Technol. 2000, 19, 11–20. [Google Scholar]
  41. Sakamoto, K.; Tonegawa, Y.; Ishitani, O. Destruction of Indoor Air Pollutants in TiO2-Wall Coated Cylindrical Flow Reactor Under 254 nm UV Irradiation. J. Adv. Oxid. Technol. 1999, 4, 35–39. [Google Scholar]
  42. Wang, H.; Wu, Z.; Zhao, W.; Guan, B. Photocatalytic oxidation of nitrogen oxides using TiO2 loading on woven glass fabric. Chemosphere 2007, 66, 185–190. [Google Scholar] [CrossRef]
  43. Coronado, J.M.; Kataoka, S.; Tejedor-Tejedor, I.; Anderson, M.A. Dynamic phenomena during the photocatalytic oxidation of ethanol and acetone over nanocrystalline TiO2: Simultaneous FTIR analysis of gas and surface species. J. Catal. 2003, 219, 219–230. [Google Scholar] [CrossRef]
  44. Cao, L.; Zi, G.; Suib, S.L.; Obee, T.N.; Hay, S.O.; Freihaut, J.D. Photocatalytic Oxidation of Toluene on Nanoscale TiO2 Catalysts: Studies of Deactivation and Regeneration. J. Catal. 2000, 196, 253–261. [Google Scholar] [CrossRef]
Figure 1. Schematic diagram of the gas-phase photocatalytic test device: (A) stainless steel reactor; (B) specimen; (C) vacuum pump; (D) gas chromatograph and computer system; (E) sample holder; (F) reactant injection pore; (G) temperature and humidity sensor; (H) H2O vaporizer.
Materials 11 02485 g001
Figure 2. X-ray diffraction patterns of HTOP, NZ, MZ, and ZTC-2.
Materials 11 02485 g002
Figure 3. Surface morphology and EDS analysis: (a) SEM image of NZ; (b) SEM image of MZ; (c,d) SEM image of ZTC-2 with EDS; (e) photograph of the surface layer of PCM-2; (f) SEM image of exposed ZTC-2.
Materials 11 02485 g003
Figure 4. Infrared spectrum of NZ and ZTC-2.
Materials 11 02485 g004
Figure 5. N2 adsorption–desorption isotherms and pore size distribution of MZ.
Materials 11 02485 g005
Figure 6. N2 adsorption–desorption isotherms and pore size distribution of ZTC-2.
Materials 11 02485 g006
Figure 7. The photocatalysis mechanism of the PCM.
Materials 11 02485 g007
Figure 8. The degradation rate of acetone.
Materials 11 02485 g008
Figure 9. The kinetic processes of the degradation of acetone.
Materials 11 02485 g009
Figure 10. Photocatalytic reaction rates of acetone using different samples.
Materials 11 02485 g010
Figure 11. The cycling degradation rate of acetone by PCM-3.
Materials 11 02485 g011
Table 1. The physical characteristics of natural zeolite.
Density (g/cm3)Wear RatePore Size (mm)Water AbsorptionVolume Weight (T/m3)
2.55<0.03%0.125~0.4250.3%1.70
Table 2. The chemical composition of natural zeolite (wt%).
SiO2Al2O3Na2OCaOK2OMgOFe2O3FeOTiO2P2O5
60~7017.84.22.63.20.81.61.20.60.26
Table 3. The TiO2 content of ZTC-1, ZTC-2, and ZTC-3.
SpecimenTiO2-sol/MZ RatioTiO2 Content (wt%)
ZTC-10.470.99
ZTC-22.364.76
ZTC-34.729.10
Table 4. The composition of the photocatalytic cement-based material.
SpecimenWater (g)Cement (g)Photocatalyst TypePhotocatalyst (g)TiO2 (g)
PCM-09.922---
PCM-19.922ZTC-10.2200.002
PCM-29.922ZTC-20.2200.010
PCM-39.922ZTC-30.2200.020
NPCM-19.922HTOP0.0020.002
NPCM-29.922HTOP0.0100.010
NPCM-39.922HTOP0.0200.020
Table 5. Specific surface area (S), Pore volume (V) and Average pore diameter (D) for MZ and ZTC-2.
SampleS (m2g−1) aV (cm3g−1) bD (nm) c
MZ4120.3211.15
ZTC-23190.2410.87
a Calculated with the BET method. b c Obtained from BJH desorption (1.9–300 nm).
Table 6. The reaction rates and relativity.
SpecimenReaction Rates (k/min−1)Relativity (R2)
blank0.00110.9678
PCM-00.00080.9273
PCM-10.01400.9684
PCM-20.01770.9860
PCM-30.01940.9856
NPCM-10.00970.9581
NPCM-20.01200.9767
NPCM-30.01130.9766

