Article

Pressure Effect of the Vibrational and Thermodynamic Properties of Chalcopyrite-Type Compound AgGaS2: A First-Principles Investigation

1
School of Physics and Electronic Engineering, Leshan Normal University, Leshan 614004, China
2
College of Optoelectronic Technology, Chengdu University of Information Technology, Chengdu 610225, China
3
School of Physics and Optoelectronic Engineering, Yangtze University, Jingzhou 434023, China
4
Department of Physics, Dongguk University, Seoul 04620, Korea
*
Author to whom correspondence should be addressed.
Authors have contributed equally to this work.
Materials 2018, 11(12), 2370; https://doi.org/10.3390/ma11122370
Submission received: 31 October 2018 / Revised: 17 November 2018 / Accepted: 20 November 2018 / Published: 26 November 2018
(This article belongs to the Special Issue Advanced Semiconductors for Photonics and Electronics)

Abstract

:
To explore the structural, vibrational, and thermodynamic properties of the chalcopyrite-type compound AgGaS2 under pressure, we applied hydrostatic pressure to the relaxed compound based on the first principles calculation and quasi-harmonic approximation. The structural parameters, including lattice constants and bond lengths decrease monotonically with the increasing pressure. The phonon dispersion curves under various pressures reveal the structural phase transition of chalcopyrite-type compound AgGaS2 at about 4 GPa. The intrinsic mechanism of thermal conductivity for the chalcopyrite-type compound AgGaS2 has been shown with phonon anharmonicity. The frequencies of the optical phonons at the center point Γ of the first Brillouin zone were calculated with the longitudinal optical–transverse optical (LO–TO) splitting mode. The dependence of the frequencies of the optical phonons on the pressure provides the information for the Raman spectroscopic study under high pressure. The pressure dependence of the Grüneisen parameters indicates that the instability of chalcopyrite-type compound AgGaS2 is associated with the softening of the acoustic phonon modes at around the center point Γ. The thermal conductivity for chalcopyrite-type compound AgGaS2 could be reduced by applying external pressure. The various thermodynamic properties, such as the Helmholtz free energy, entropy, and heat capacity, at different temperatures and pressures were discussed and analyzed based on the phonon properties.

1. Introduction

I-III-VI2 ternary chalcopyrite type compounds have attracted attention as extracting candidates in non-linear optic [1,2,3], novel spintronic [4], and thermoelectric [5,6,7] devices, as well as in thin film solar cells [8,9,10]. AgGaS2, as a typical member of I-III-VI2 ternary chalcopyrite-type compounds, has attracted interest from researchers [11,12,13]. The low thermal conductivity (1.4 W/m K) [14] makes chalcopyrite type compound AgGaS2 known as a potential thermoelectric material. Understanding the physical mechanism of the thermal conductivity of AgGaS2 is necessary to discuss how to reduce the thermal conductivity and promote the application in a thermoelectric device. The investigations of lattice dynamic and thermodynamic properties have great practical significance for the engineering application of materials. Holah et al. presented the lattice dynamic properties of chalcopyrite-type compound AgGaS2 in an experiment for the first time in 1974 [15]. Neumann et al. measured the heat capacity and Grüneisen parameters of the chalcopyrite-type compound AgGaS2 [16]. Besides experimental research, the lattice dynamic and thermodynamic properties of the chalcopyrite-type compound AgGaS2 have also attracted the attention of theoretical researchers for its potential application. The phonon dispersion relations were performed by Łażewski et al. using first principles within local density approximation [17]. Wei et al. investigated the anharmonicity of the acoustic phonon of AgGaS2 using first principles under the three-phonon Umklapp process [18]. Recently, Kushwaha et al. calculated the lattice dynamic properties of AgGaS2, including Raman and infrared inactive modes, using rigid-ion model [19]. Nevertheless, most of the lattice dynamic and thermodynamic investigations of AgGaS2 were carried out at 0 pressure.
It is well known that the electronic and geometrical structures will undergo changes under external pressure, which induces novel properties and have many wide applications, such as pressure-induced phase transitions [20,21], derived-spin crossover transitions [22], enhanced superconductivity [23,24], and improved optical, thermodynamic, and thermoelectric performances [25,26,27]. The pressure-inducing scheme is straightforward to improve the non-linear optical properties of AgGaS2 as calculated by Li et al. [28] It is important to note that the chalcopyrite structure tends to deform under pressure. Several experimental investigations revealed that the pressure-induced phase transition occurs from space group symmetry of I 4 ¯ 2 d to Cc at about 4.2 GPa [29,30]. However, no theoretical research has yet been carried out to access the pressure-induced phase transition based on the crystal lattice dynamics. It is worth investigating which vibrational modes and regions are related to phase transitions under pressure. On the other hand, the intrinsic mechanism of the thermal conductivity of AgGaS2 is still not clearly known. Besides, the pressure dependence of thermodynamic properties is a valuable research to clarify the influence of pressure on the chalcopyrite-type compound AgGaS2.
The purpose of our work is to investigate the dynamic stability, the vibrational and thermodynamic properties of the chalcopyrite-type compound AgGaS2 under different hydrostatic pressures by using first-principles. The dynamic stability was verified by analyzing the corresponding phonon spectrum under various pressures. The vibrational properties, including the effect of longitudinal optical–transverse optical (LO–TO) splitting, were investigated using the finite displacement method. The Grüneisen parameters and thermodynamic properties were obtained by using a quasi-harmonic approximation method.

2. Computational Scheme

The structural optimization and self-consistent calculations were performed using Vienna Ab-initio Simulation Package (VASP) code [31] within the framework of density functional theory (DFT). The Perdew–Bruke–Ernzerhof (PBE) functional for the generalized gradient approximation (GGA) was used to describe the exchange correlation potential. The projector augmented wave pseudopotentials with a 400 eV cut-off energy were employed to describe the interaction between the electrons and ions. The valence states of the atoms of Ag, Ga, and S were chosen as 4d105s1, 4s24p1, and 3s2sp4, respectively. The structure relaxation was performed until all forces acting on each atom were smaller than 10−5 eV/Å and the total energy change between 2 self-consistent steps was smaller than 10−8 eV. The first Brillouin zone of a unit cell was sampled by a 3 × 5 × 4 k-mesh scheme with Γ central for structural optimization.
We used the finite-displacement method within the framework of the force constants as implemented in PHONONPY code to determine the vibrational properties [32]. The necessary force constants of the supercell were computed in real space by using the finite displacement method with the help of the VASP code. The 2 × 2 × 2 supercell of the unit cell and a 3 × 3 × 3 k-mesh were used to calculate the force constants, which were confirmed to provide converged results. Based on our knowledge of group theory, we also analyzed the vibration modes of the center point Γ. The Grüneisen parameters and thermodynamic properties, such as the Helmholtz-free energy, entropy, and heat capacity, were calculated from the phonon density of states (DOS) as a function of the frequencies. The relevant calculation scheme was carried out in the framework of the quasi-harmonic approximation (QHA), in which the phonon frequencies are volume-dependent.

3. Results and Discussions

3.1. Structural Optimization

The chalcopyrite-type compound AgGaS2 belongs to the I 4 ¯ 2 d space group, with the Ag, Ga, and S atoms occupying the Wyckoff sites of 4a, 4b, and 8d, represented as purple, green, and yellow balls in Figure 1a, respectively. Based on the theoretically predicted structure of the chalcopyrite-type compound AgGaS2 [33], the parameter constants and atomic coordinates under different pressures were fully carried out until the total energy and force acting on atom reach convergence.
The optimized lattice constants for chalcopyrite type compound AgGaS2 under 0 pressure are a = b = 5.77 Å, and c = 10.31 Å, and these are in very good agreement with the experimental data [34]. The difference of the lattice constants between this work and other theoretical computations is almost less than 3% [35,36]. The respective bond lengths of Ag-S and Ga-S for chalcopyrite type compound AgGaS2 under 0 pressure are 2.561 and 2.315 Å, which is close to the previous prediction [37]. Figure 1b shows the dependence of the lattice constants on the pressure up to 4 GPa. We found that the lattice constants gradually decrease with the pressure increase. The variation of the lattice constants (a and c) presents anisotropic property when external pressure is applied. To display the anisotropic character more clearly, the reduced lattice constants are plotted together as the insert in Figure 1b, where a0 and c0 are the lattice constants at 0 pressure. The c/c0 drops faster than the a/a0 with pressure, which demonstrates that chalcopyrite-type compound AgGaS2 is easily compressed along the c direction; the previous experimental studies showed exactly the same conclusion [38,39]. The bond length is one of the important structural parameters. To further clarify the effect of the pressure on the structure, the hydrostatic pressure dependence on the bond length is shown in Figure 1c. It is worth noting that the bond lengths of Ag-S and Ga-S for chalcopyrite-type compound AgGaS2 decrease gradually with the increasing hydrostatic pressure in the range of the pressure studied. Moreover, the bond length of Ag-S is more sensitive than that of Ga-S with the increasing hydrostatic pressure, which is consistent with experimental prediction by single-crystal X-ray diffraction [30]. As proved later, the broken tetrahedron structure induces structural phase transition. The AgS4 tetrahedron undergoes a slightly larger geometrical deformation and could be broken more easily than the GaS4 tetrahedron under pressure.

3.2. Vibrational Properties

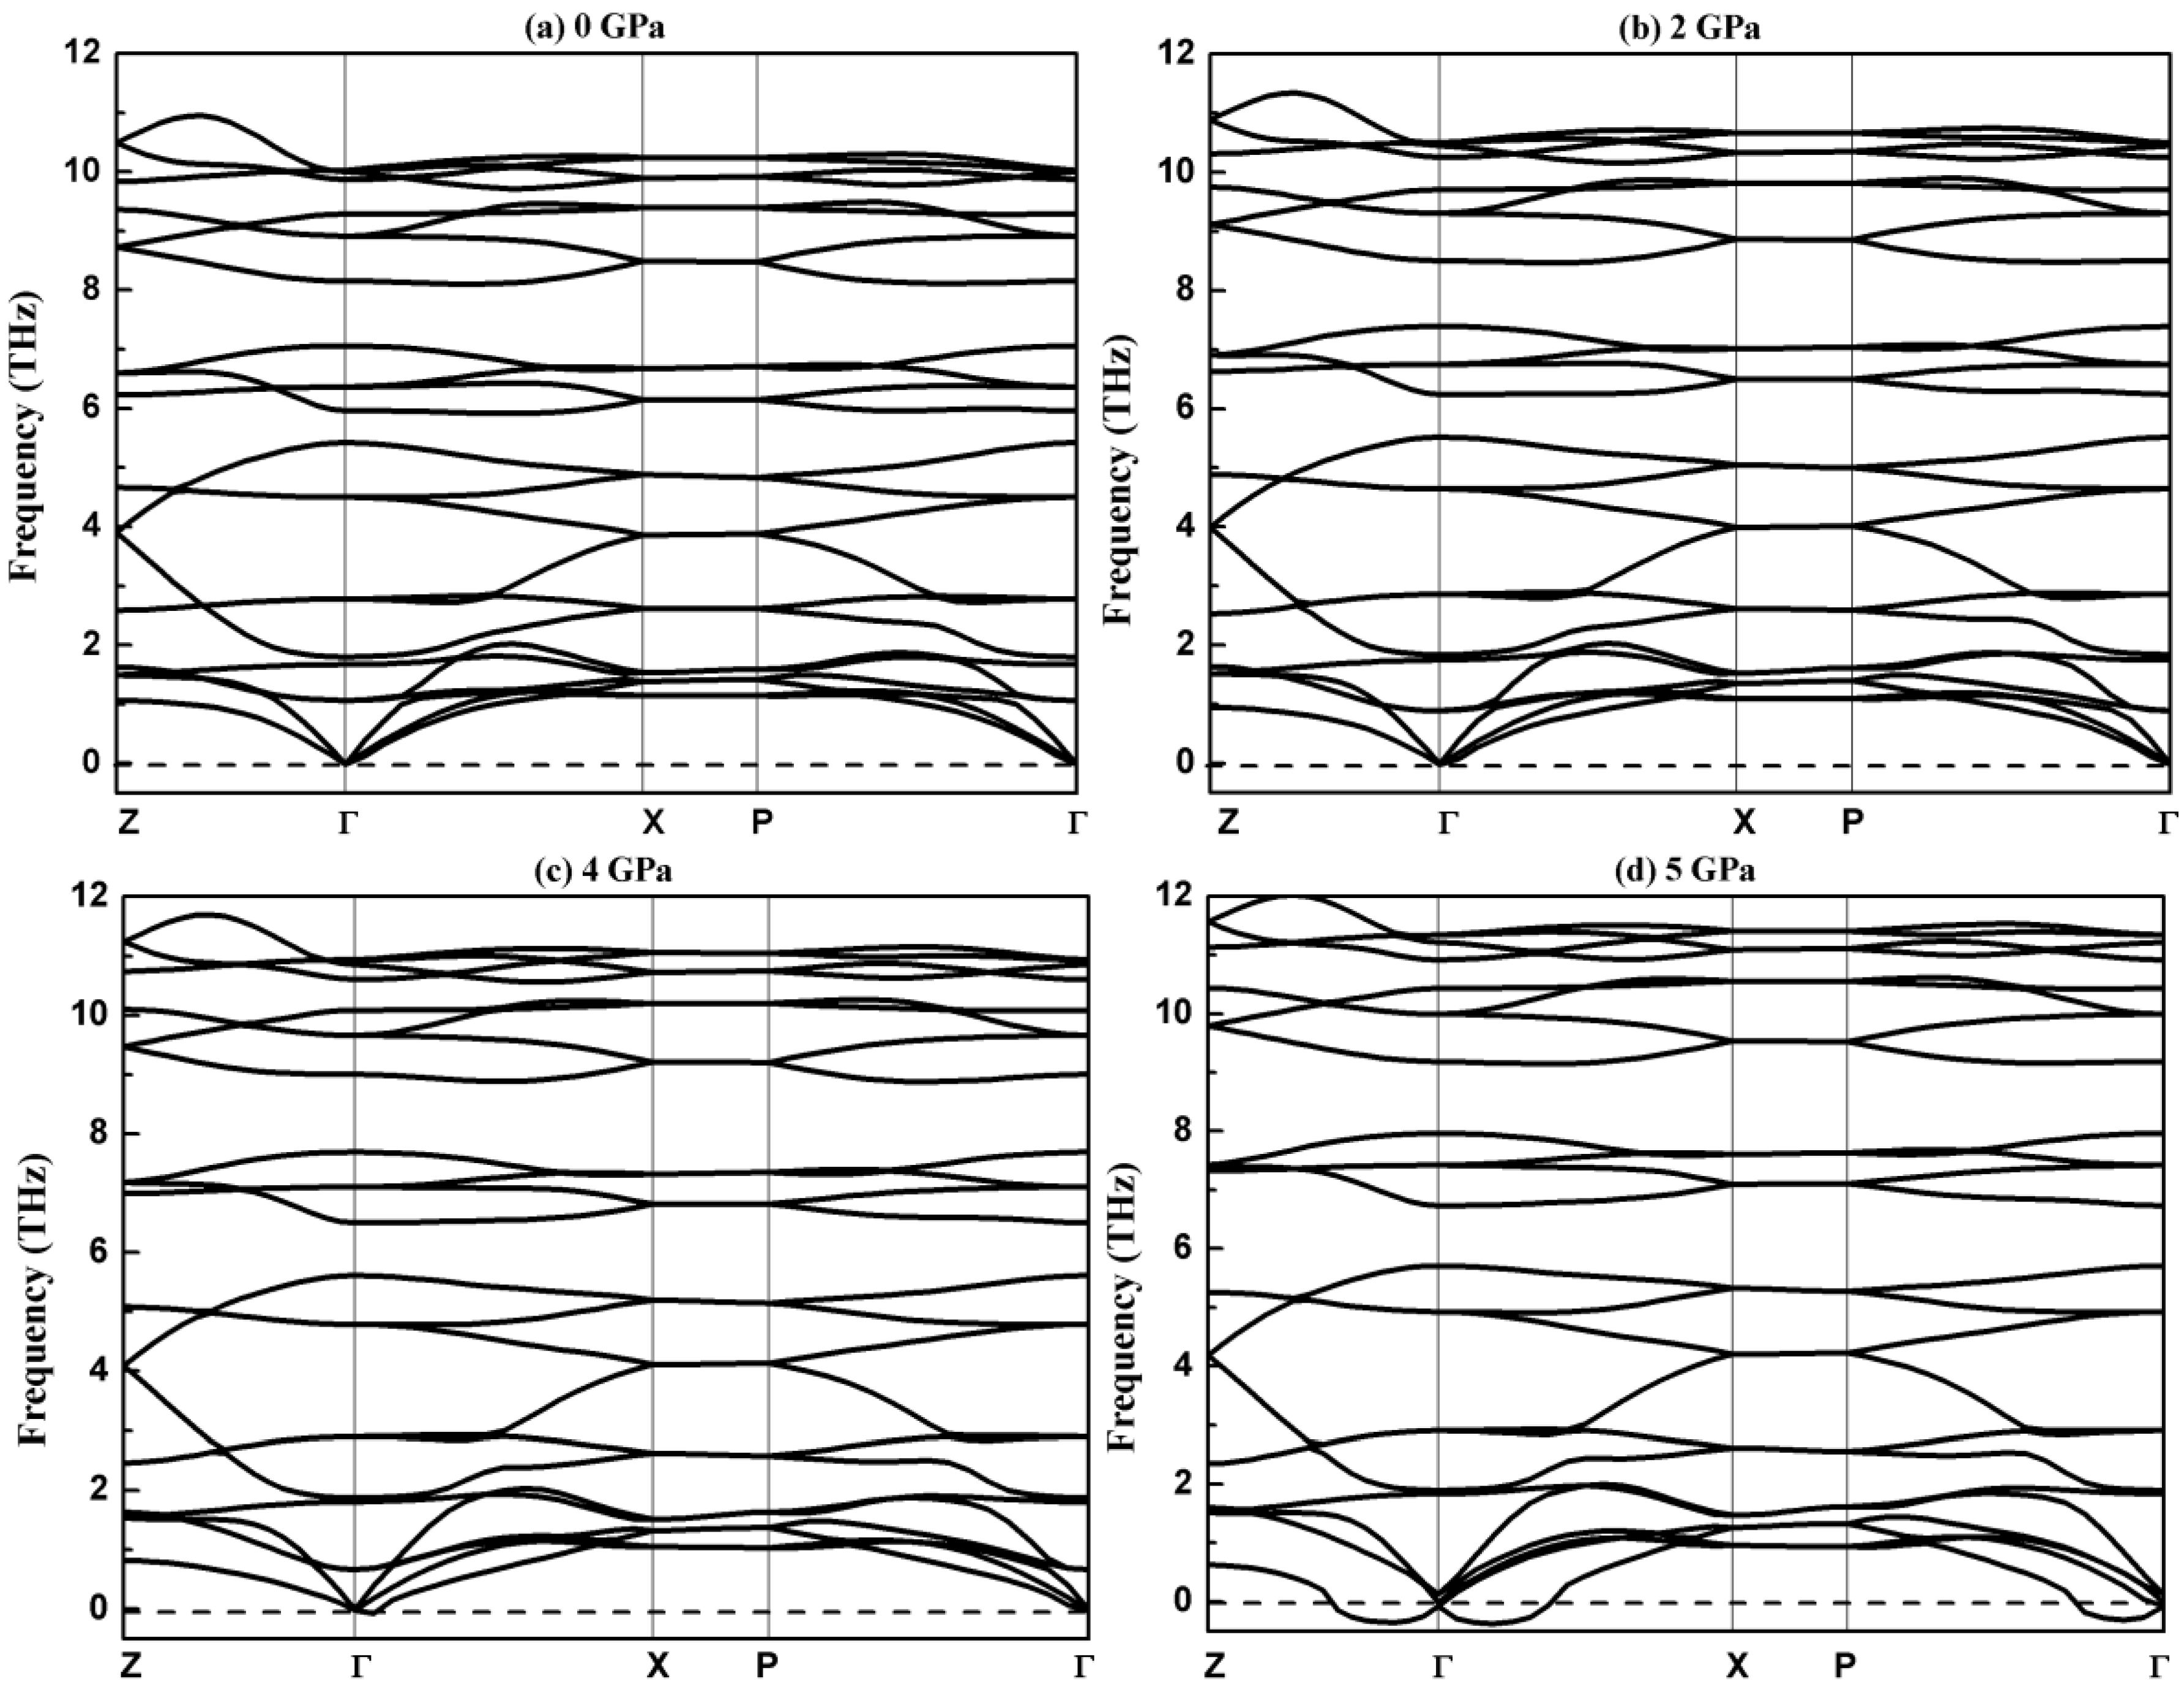
The phonon characteristics directly reflect dynamic stability and play a vital role in the physical properties of materials. We now turn to the vibrational properties of chalcopyrite-type compound AgGaS2. Figure 2 exhibits the computational phonon spectrums along the high symmetry line Z(1/2,1/2,−1/2)→Γ(0,0,0)→X(0,0,1/2)→P(1/4,1/4,1/4)→Γ(0,0,0) in the first Brillouin zone at different pressures.
Figure 2 shows there are no imaginary frequencies in the whole Brillouin zone below 4 GPa, which indicates that AgGaS2 with the I 4 ¯ 2 d structure is dynamically stable below 4 GPa. The phonon spectrum under 5 Gpa shows an obvious imaginary frequency near the center point Γ. The appearance of the imaginary frequency is a sure sign of a dynamic instability at the related pressure; the appearance of an imaginary frequency is related to the phase transition. The imaginary frequency comes from the E vibrational mode as confirmed from analysis of the vibrational mode. The single-crystal X-ray diffraction shows that the chalcopyrite type compound AgGaS2 in a tetragonal phase with space group of I 4 ¯ 2 d can change to a monoclinic phase with a space group of Cc at 4.2 GPa [30]. The purpose of this work is to reveal the pressure effect on the vibrational and thermodynamic properties of AgGaS2 in the tetragonal phase. The vibrational properties less than 4 GPa of chalcopyrite type compound AgGaS2 are discussed below.
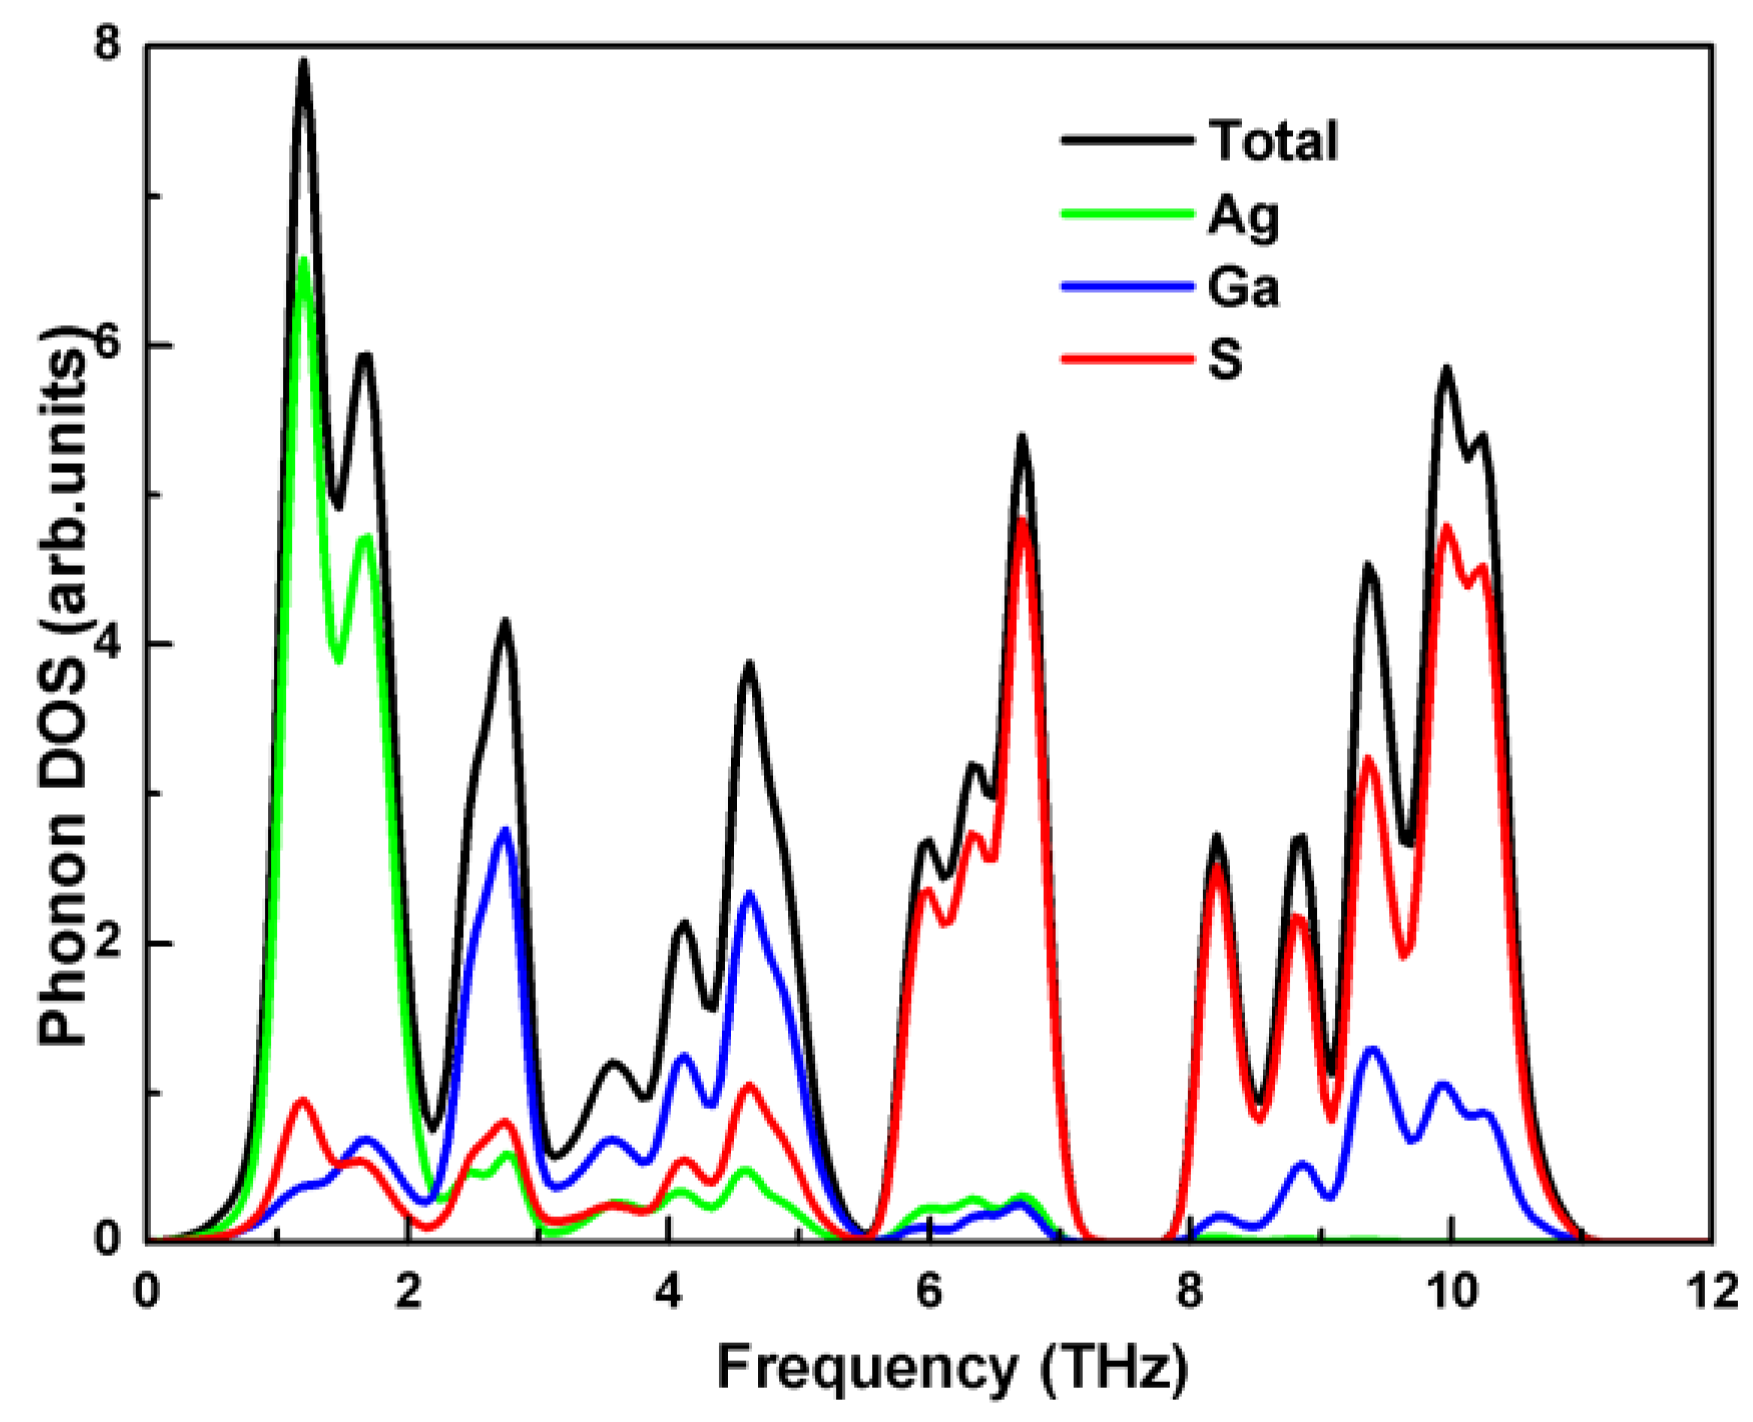
Because there are 8 atoms in the unit cell of chalcopyrite type compound AgGaS2, the phonon spectrum includes 24 branches (3 acoustic and 21 optical branches). The phonon spectrum is divided into 3 energy intervals; the 3 acoustic branches are linear in wave vector q for a small q. The contribution of optical branches to thermal conductivity is not considered with their small group velocities, seeing from the flat distribution in Figure 2. The optical branches overlap with the acoustic branches in low frequency, which benefits to the low conductivity of AgGaS2 as confirmed in other chalcopyrite type compound CuInTe2 [40]. The flat phonon branches along the X–P direction indicate the intracellular interactions are stronger than those between the cells in this direction. We note that all modes along the X–P direction are double-degenerated. As shown in Figure 2, the frequency of the phonon increases with the increase of pressure. The fundamental cause of this phenomenon is that the bond lengths of Ag-S and Ga-S become shorter with the increase of pressure. The shortening bond lengths lead to larger force constants, which benefits higher vibration frequencies. We investigated the vibrational property further to explore the contribution of the atoms to the phonon spectrum; the total and partial phonon densities of chalcopyrite type compound AgGaS2 at 0 GPa are plotted in Figure 3.
The partial phonon DOS in Figure 3 shows that the vibration of the Ag atom governs the acoustic branches. The vibration of the S atom contributes to the optical branches in the high energy region for the light mass. The main contributor to the optical branches in the frequency range from 2.2 THz to 5.5 THz is the Ga atom. Therefore, it is a scheme to reduce the thermal conductivity by inducing impurity scattering at Ag atom position.
Twenty-four dispersion curves mean there are 24 normal vibrational modes at the center of the Brillouin zone (Γ point), which can be explicated by group theory. The I 4 ¯ 2 d space group belongs to the D2d point group. Based on the group theory, the D2d point group has 4 one-fold-degenerate (A1, A2, B1, B2) and 1 two-fold-degenerate (E) irreducible representations. The Ag and Ga atoms are located at the S4 symmetric crystal positions, and the vibration modes can be described as simple motion parallel to the 3 crystal axes. The irreducible representation of the lattice vibrations for the Ag and Ga atoms are represented as:
Γ A g = Γ G a = B 1 + B 2 + 2 E .
The sulfur atom is located on the C2 symmetric position, whose vibration modes can be expressed as the following irreducible representation:
Γ s = A 1 + 2 A 2 + 1 B 1 + 2 B 2 + 3 E .
The A1 and A2 vibrational modes only involve the displacement of the sulfur atom. The B1, B2, and E vibrational modes include the displacement of all atoms. The corresponding irreducible representation of the acoustic and optical vibrational modes at center point Γ can be represented as:
Γ a c o = B 2 + E .
Γ o p t = A 1 + 2 A 2 + 3 B 1 + 3 B 2 + 6 E .
The 3 acoustic vibrational modes are neither infrared nor Raman active. For 21 optical vibrational modes, A1, B1, B2, and E are Raman active; furthermore, E and B2 are also infrared active. The A2 vibrational mode is called silent vibrational mode, since it is neither infrared nor Raman active. There are 13 Raman active vibrational modes, 9 infrared active vibrational modes and 2 silent vibrational modes at center point Γ. We took into account the long-range polarization interactions, so the infrared polar modes B2 and E were split into the longitudinal-optical (LO) and transverse-optical (TO) components. The LO–TO splitting depends on the values of the macroscopic dielectric constant and Born effective charges. As the polarization field increases the restoring force of the atomic displacement, the frequency of the LO mode increases. The splitting of the B2 vibration mode is parallel to the c axis, while the splitting of the E vibration mode is perpendicular to the c axis. The calculated frequencies of the optical phonons, including LO–TO splitting from the B2 and E modes at the center point Γ under different hydrostatic pressures, are listed in Table 1. The frequencies for the LO and TO components are separated with a slash in Table 1. The first column represents the irreducible representations of vibrational modes, abbreviated as “Irreps”.
As noted by Ohrendorf [42], the quality of a single crystal, including its impurity and lattice defects, leads to a difference of the vibrational wavenumbers in the different measurements in some cases. Based on reliable experimental data, Harran et al. estimated the values of the vibrational frequencies of AgGaS2 [42]. Recently, Kushwaha et al. [19], employed the rigid-ion model with the help of the reliable phonon mode from the literature [42] as input data, calculated the vibration modes of AgGaS2. The vibrational frequencies from the rigid-ion model are in good agreement with the experimental data, as shown in Table 1. The calculated results from the DFT frame are about 9% lower than the experimental results, which is a well-known underestimation of the phonon frequency by using the PBE functional [43,44,45]. To study the behavior of the phonon structure in greater detail, we analyzed the pressure dependence of the phonon frequency at center point Γ. We were surprised to find that the frequencies of all modes expect the lowest E mode increase with the increasing pressure; the tendency was discovered in the pressure dependence of phonon frequency of ZnGeP2 with the chalcopyrite structure by Raman scattering measurement [46]. The significant downtrend for the frequency of the lowest E mode with the increase in pressure means the soft E mode may influence the structural stability; this same phenomenon was found in the pressure-induced phase transition of SnSe crystal [47].
The phonon spectrum figures out the harmonicity of interatomic force constant. The thermal conductivity, however, is determined in the term of phonon anharmonicity, characterized by the Grüneisen parameter. The Grüneisen parameter can be described with the relative change of a phonon frequency due to the change of the cell volume. The value of the Grüneisen parameter represents the thermal expansion behavior of the materials, too. The mode of the Grüneisen parameter at the wave vector q and band index j is given in the following equation:
γ q j = d l n ω q j d l n V = V ω q j ω q j V ,
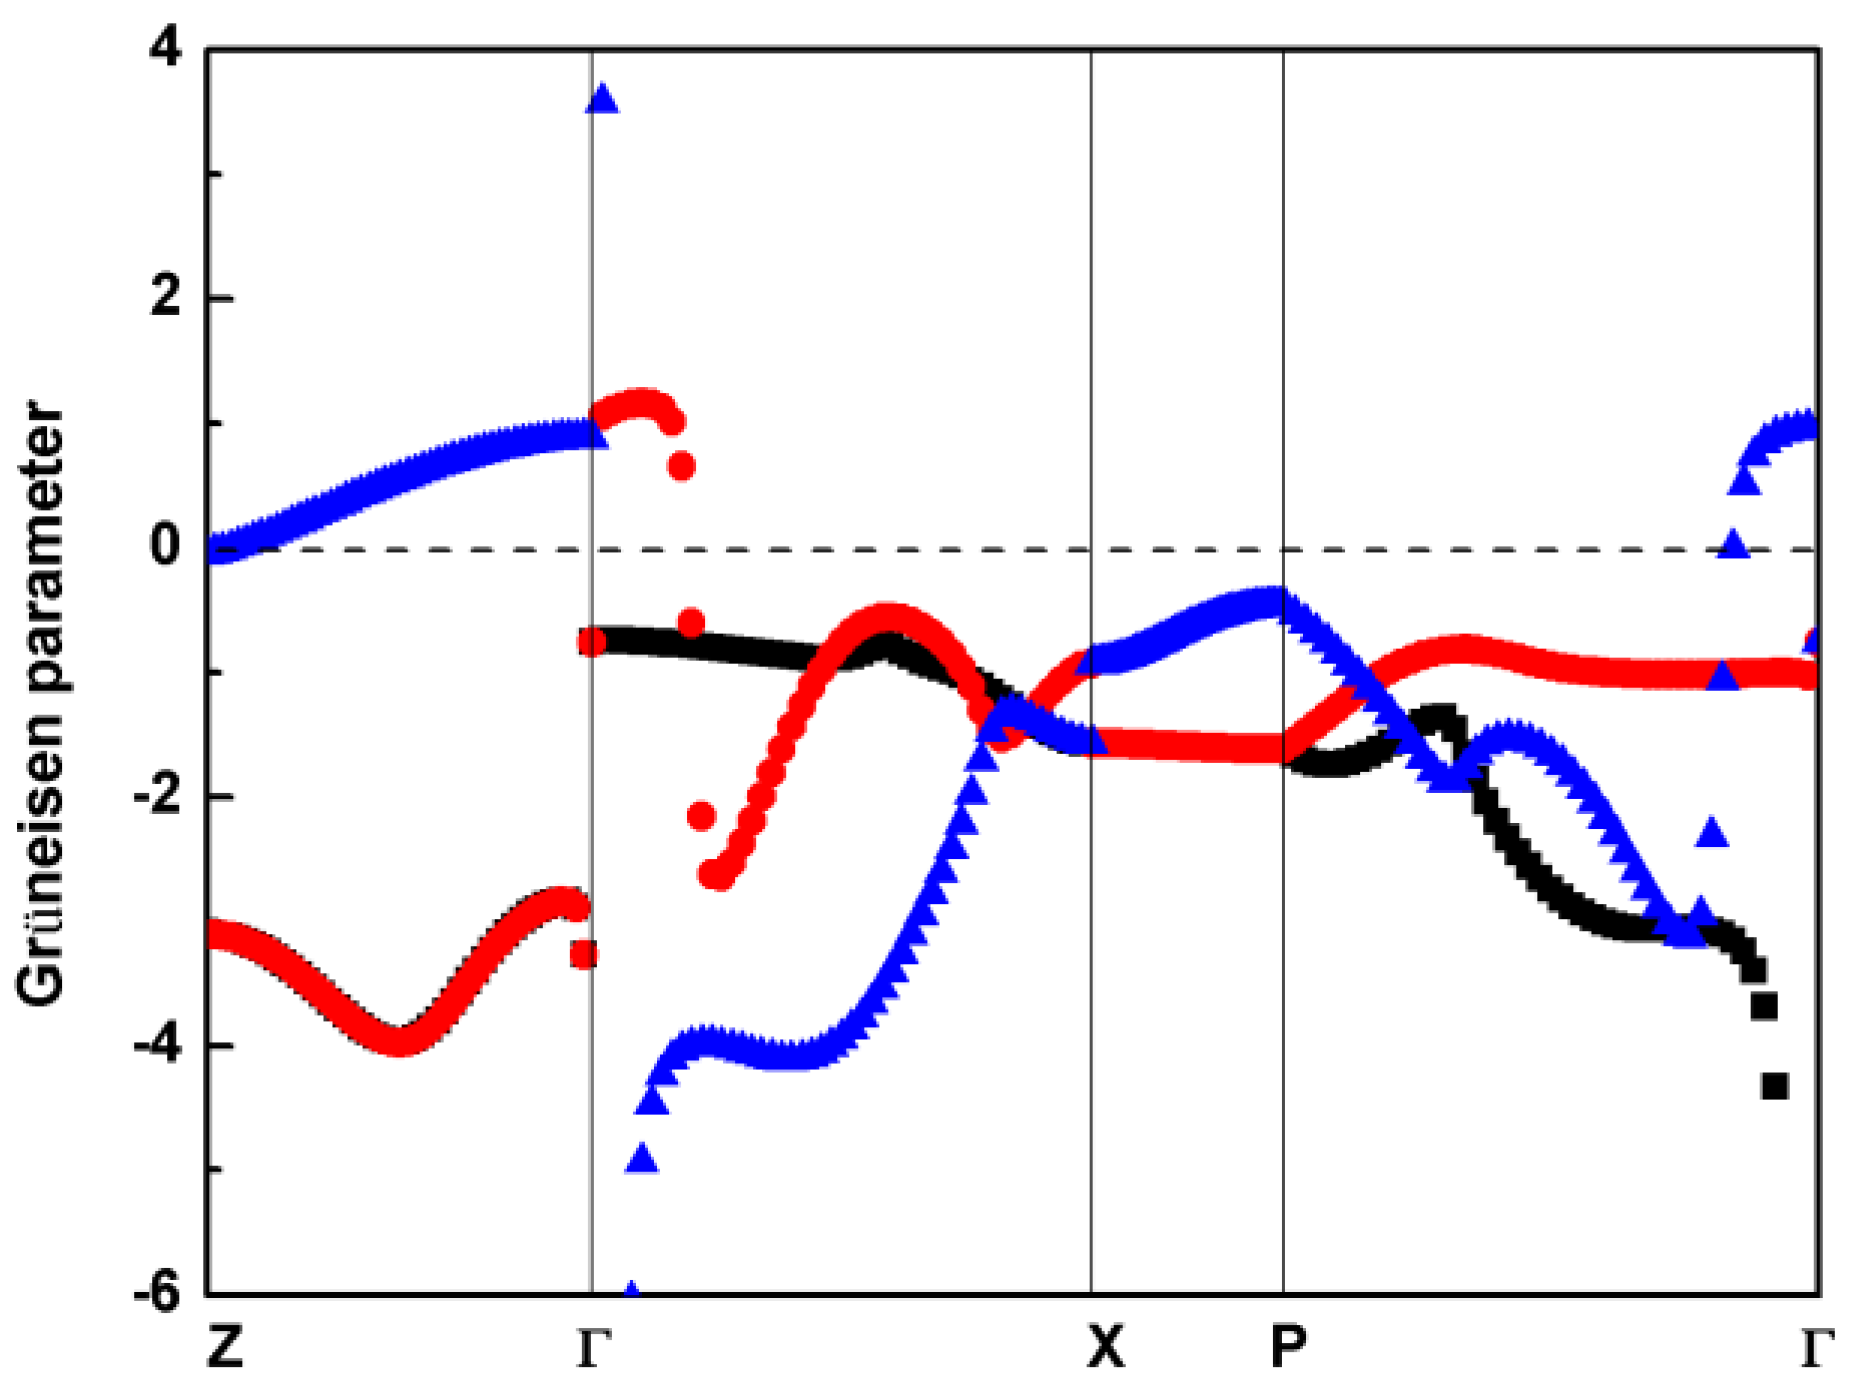
where ω q j is the frequency of the jth phonon mode at wave vector q, and V is the volume. To obtain the shift of the phonon frequency caused by the volume change, it is necessary to consider 3 phonon calculations under 3 different volumes. The 3 volumes are the equilibrium volume, a volume slightly smaller than the equilibrium volume, and a volume slightly larger than the equilibrium volume. In our work, we compressed and expanded the equilibrium volume of AgGaS2 by 0.3%. The calculated mode Grüneisen parameters of the 3 acoustic branches under 0 pressure along the high symmetry points are shown in Figure 4, in which the black and red symbols denote the transverse acoustic (TA) mode, and the longitudinal acoustic (LA) mode is represented with the blue symbol.
As shown in Figure 4, most of the mode Grüneisen parameters are negative, which is generally consistent with previous first-principles calculational results [18]. The negative Grüneisen parameters imply a negative coefficient of the thermal expansion, coming from the tetrahedral structures of Ag-S and Ga-S in the crystal structure, as proved in other tetrahedral materials [48]. We found that the Grüneisen parameters of the TA mode are degenerated along the Γ–Z direction. The significant absolute values of Grüneisen parameters uncover the strong phonon anharmonicity, and result in rather low thermal conductivity. The distribution of the mode Grüneisen parameters throughout the first Brillouin zone not only reflects the phonon anharmonicity, but also shows the existence of soft modes for the acoustic phonons. The Grüneisen parameter of the lowest E mode is −5.73, which agrees well with recent calculational work [18], suggesting the lowest E mode can lead to a structural instability at a low energy. In addition, the averaged Grüneisen parameter ( γ ¯ ) can be approximated with the root mean square average of the generalized mode Grüneisen parameter per mode, represented as γ ¯ = γ 2 [49]. The calculated averaged Grüneisen parameters for all branches along the high-symmetry path at different hydrostatic pressures are shown in Table 2.
The average of the Grüneisen parameters along the path through the center point Γ is larger than that along the X–P path, which reflects the stronger phonon anharmonicity near center point Γ. The increase of the hydrostatic pressure has little effect on the average of the Grüneisen parameters along the X–P path below 4 GPa. The average Grüneisen parameters along the other 3 paths (Z–Γ, Γ–X, N–Γ) accelerate monotonously with pressure, particularly above 3 GPa. The enhancement of phonon anharmonicity makes pressure as a direct and effective way reduce thermal conductivity of chalcopyrite type compound AgGaS2 and promotes its application in the field of thermoelectricity. The large average Grüneisen parameters (6.33, 7.86 and 5.67 along the Z-Γ, Γ-X, and P-Γ paths, respectively) at 4 GPa indicate the structural instability may be discovered within this area.

3.3. Thermodynamic Properties

Thermodynamic properties are the fundamental basis for the technical application of materials. As a further application, we calculated the thermodynamic properties based on the quasi-harmonic approximation using the phonon frequencies on a sampling mesh in the reciprocal space. Using the quasi-harmonic approximation, the energy at the wave vector q and band index j can be given as:
E q j = ω q j [ 1 2 + 1 exp ( ω q j k B T ) 1 ] ,
where, ω q j is the frequency of the jth phonon mode at wave vector q; , k B , and T are the reduced Plank constant, Boltzmann constant and absolute temperature, respectively. Based on the thermodynamic relations, the constant volume heat capacity C V , q j of the jth phonon mode at wave vector q can be represented as:
C V , q j = ( E q j T ) V .
The total constant volume heat capacity C V , contributed from all phonon vibration modes in the whole Brillouin zone is given as:
C V = q j C V , q j = q j k B ( ω q j k B T ) 2 exp ( ω q j / k B T ) [ exp ( ω q j / k B T ) 1 ] 2 .
According to thermodynamics, the Helmholtz free energy F(V,T) of a solid material can be written as the following formula:
F ( V , T ) = E 0 ( V ) + F e h ( V , T ) + F p h ( V , T ) ,
where E 0 ( V ) is the static energy at a constant volume V and T = 0, which can be obtained from the first-principle calculation. F e h ( V , T ) and F p h ( V , T ) denote the thermal free energy contribution from the electron and phonon, respectively. Compared with the thermal free energy contribution from the phonon thermal excitation, the contribution from the electron excitation can be ignored; we only considered the phonon contribution in our work. Within the quasi-harmonic approximation, F p h ( V , T ) is described as the contribution sum from all the phonon branches and wave vectors in the whole Brillouin zone:
F p h ( V , T ) = 1 2 q j ω q j + k B T q j ln [ 1 exp ( ω q j / k B T ) ] .
The entropy S is defined as the first derivative of the Helmholtz free energy versus temperature:
S = F T = 1 2 T q j ω q j coth ( ω q j / 2 k B T ) k B q j ln [ 2 sinh ( ω q j / 2 k B T ) ] .
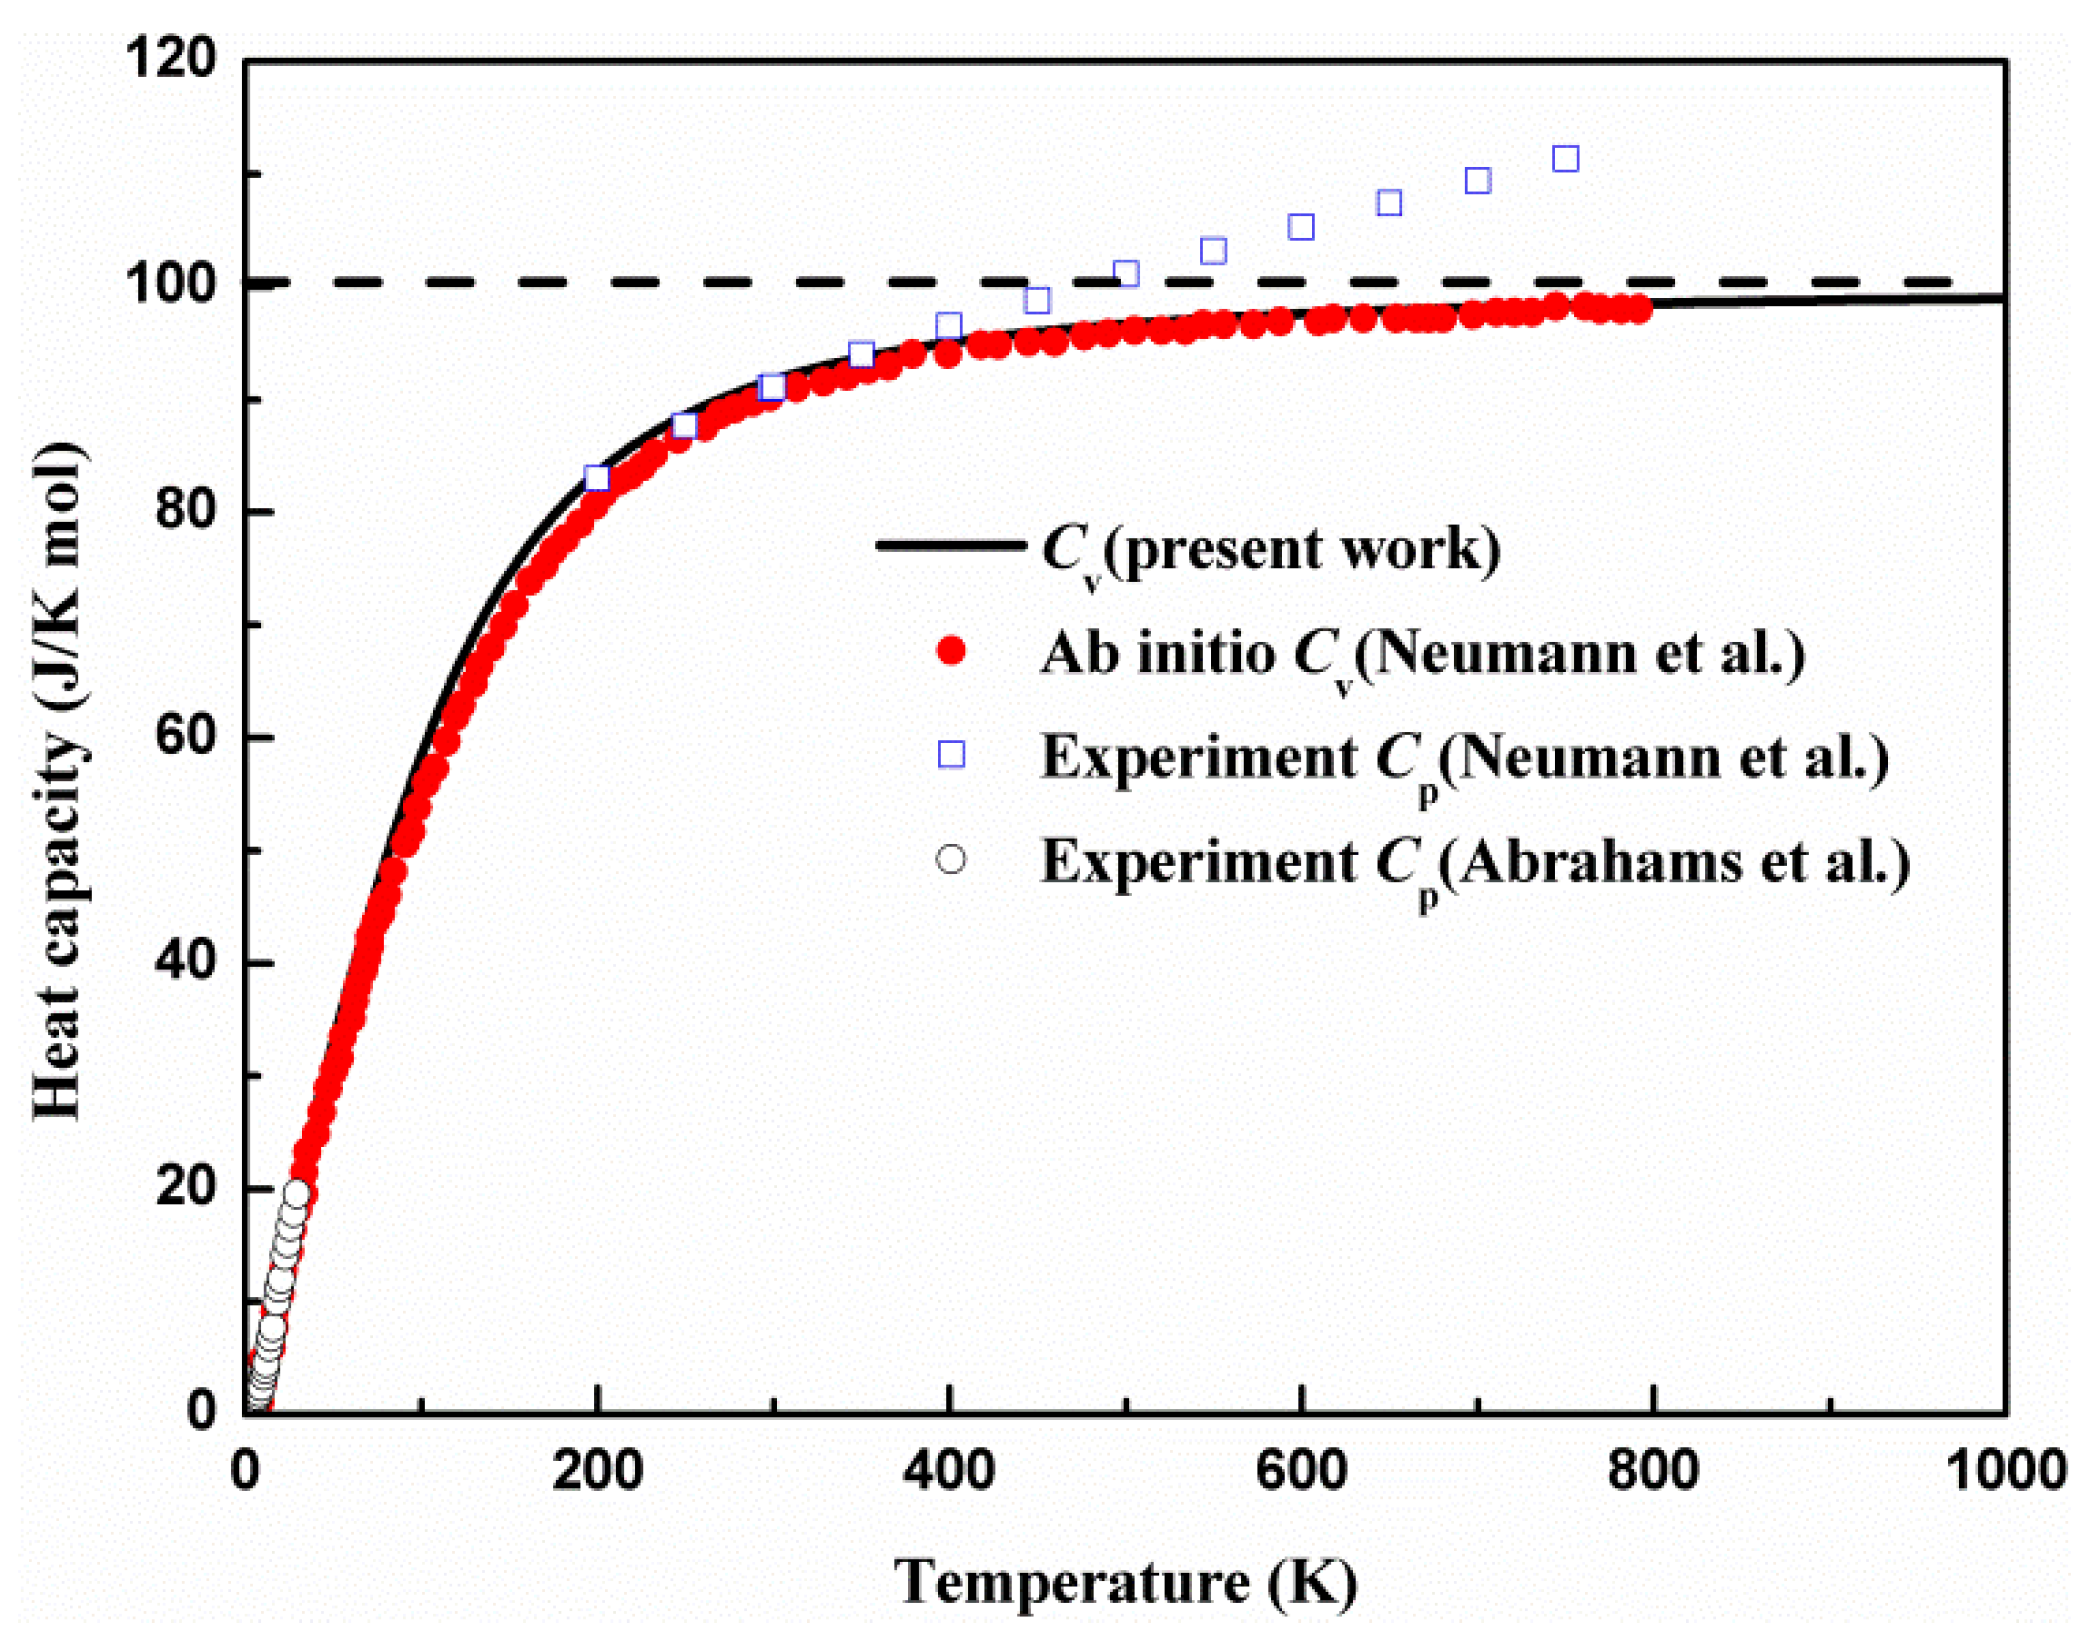
The Cv calculated with the quasi-harmonic approximation is compared with the previous first-principle computation and experimental constant pressure heat capacity Cp in Figure 5.
The calculational results are in line with previous first-principles theoretical report [50]. The calculated Cv agrees well with the measured Cp in the temperature range below 40 K [51]. As the data of the measured Cp are scarce in the temperature range from 40 to 200 K, it is difficult to compare the calculated data with measured data. We found that the discrepancy between the calculated Cv and measured Cp continuously increased with the increase of the temperature for the temperature range above 400 K [16], and this indicates the essential difference between Cv and Cp. The consistency of the calculated Cv and measured Cp at a low temperature implies the contribution from the phonon anharmonicity to the heat capacity is insignificant and can be neglected. The Cv strongly depends on temperature when temperature is below 200 K. We found that the heat capacity Cv dramatically increased cubically as a function of temperature at a low temperature (below 200 K). When the temperature is higher than 200 K, the heat capacity rapidly slows with the temperature. The heat capacity almost reaches a constant and follows the Dulong–Petit law at a high temperature (above 700 K), when the anharmonic effect is significant.
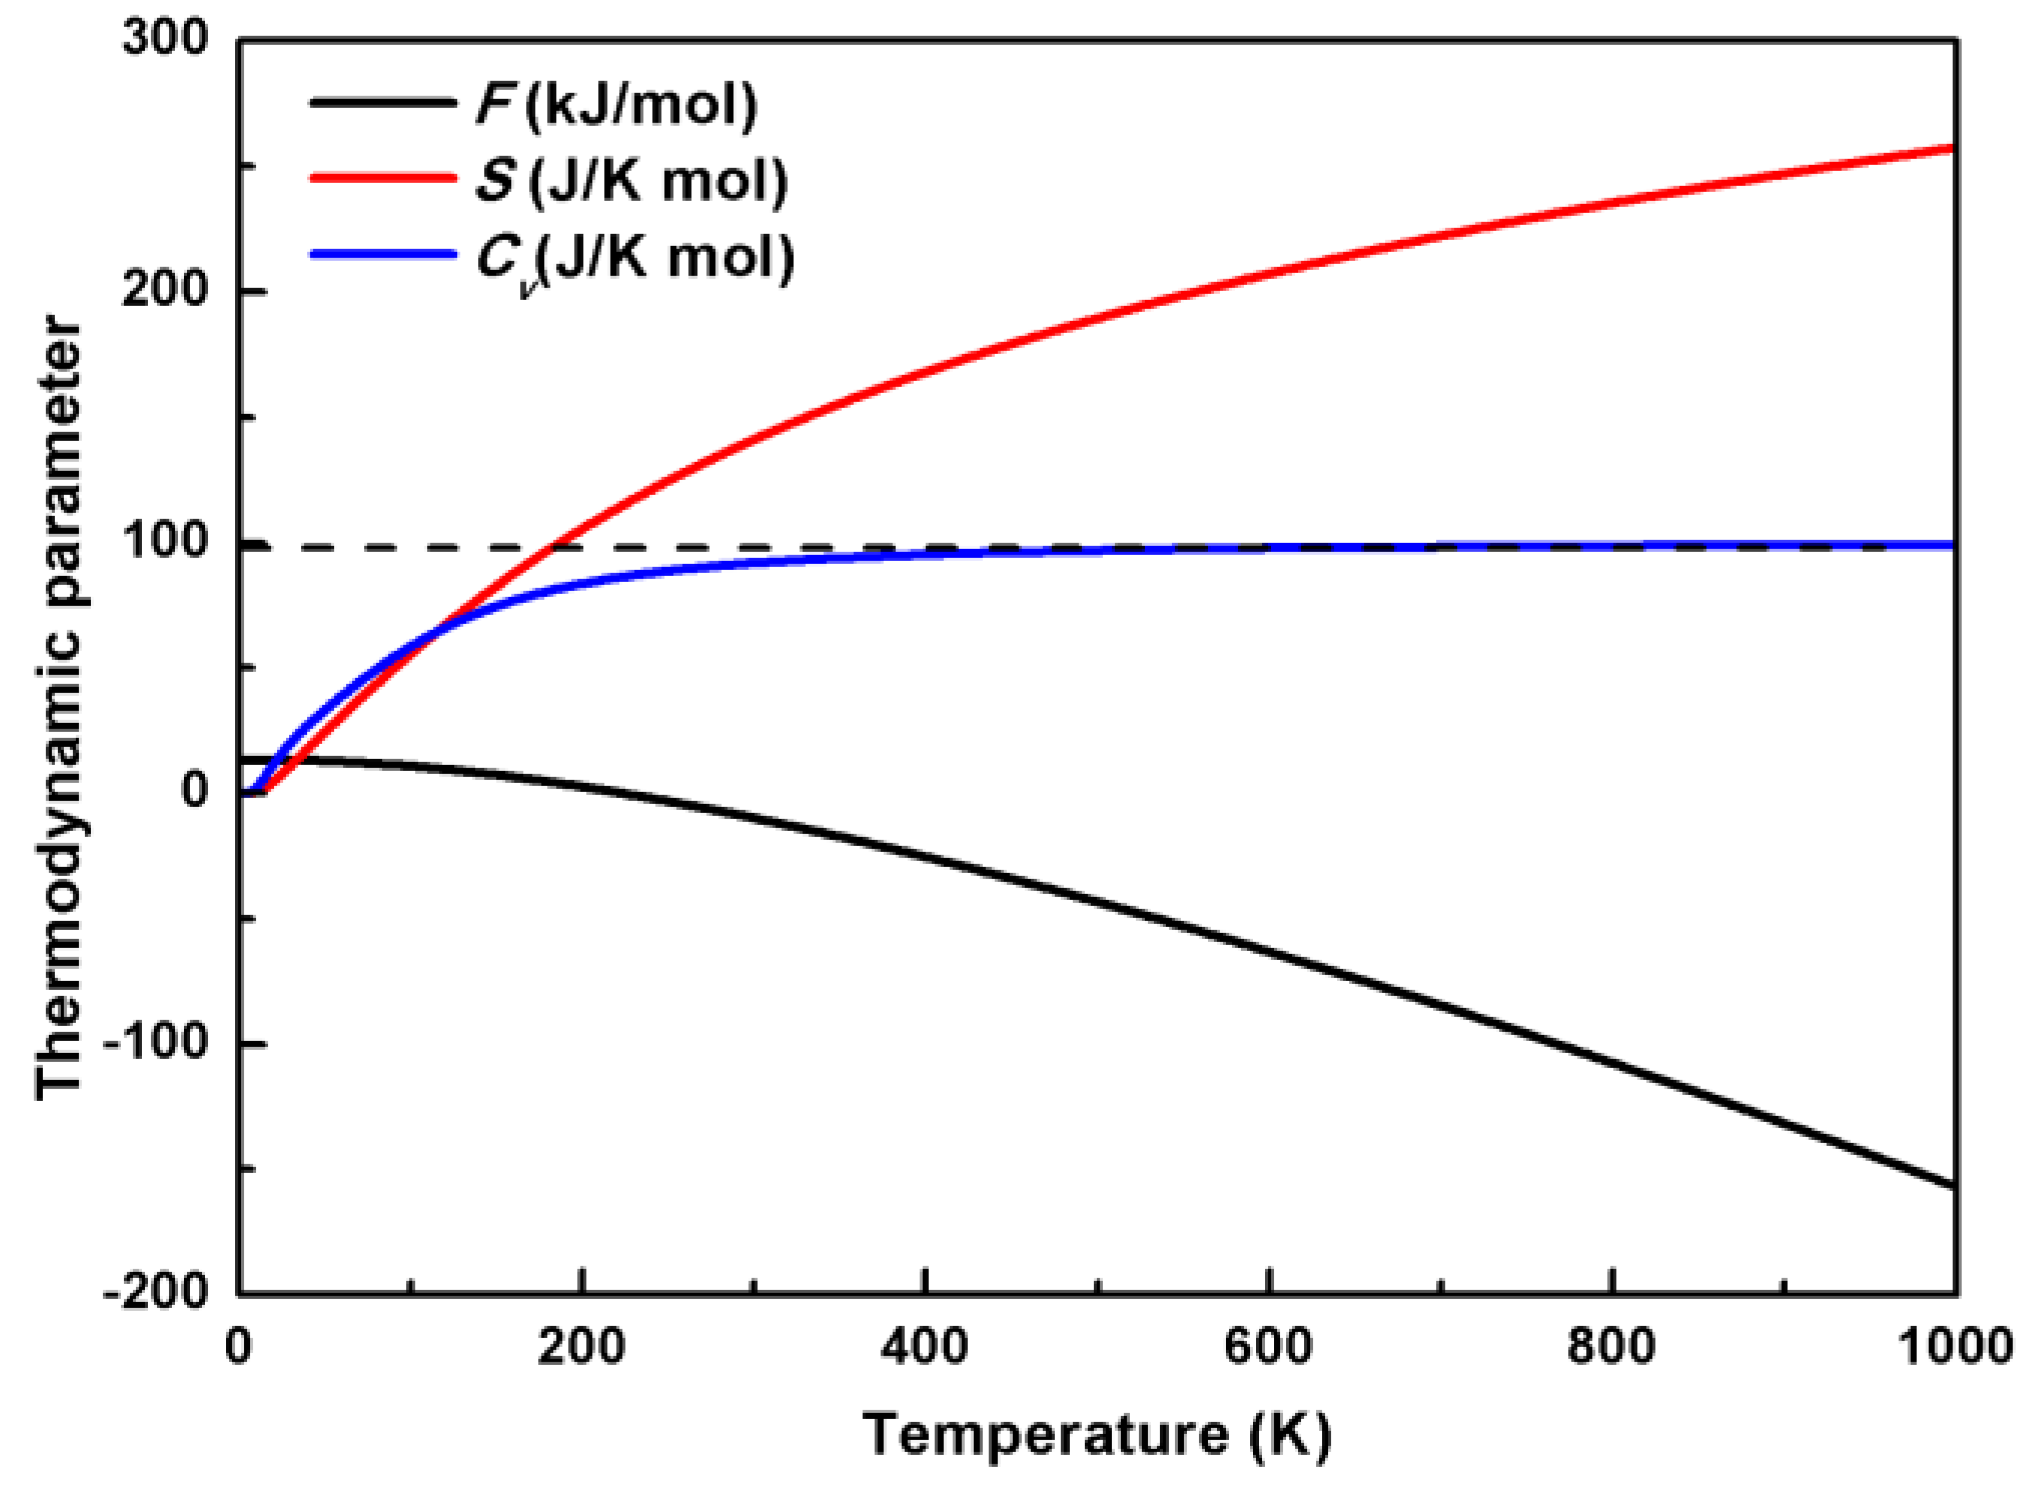
The calculated thermodynamic properties, including the Helmholtz free energy F, entropy S, and heat capacity Cv, for AgGaS2 at 0 pressure as a function of the temperature, are presented in Figure 6. Figure 6 shows that the Helmholtz free energy decreases monotonously with the increasing temperature. The entropy and heat capacity increase with the increasing temperature from 0 J/K·mol. As the temperature increases, the entropy increases smoothly, while the tendency of the heat capacity can be divided into 2 sections as mentioned above. The effect of a high temperature on the Helmholtz free energy F and entropy S is more important than that of low temperature. The profiles of the thermodynamic curves are coincident with the early calculated results using the quasi-harmonic Debye model [52]; the discrepancies between them may be caused by the different treatment methods for the phonon data. As the thermodynamic parameters were directly from the phonon data calculated by first principles, this model is more accurate than that from the Debye model.
To further clarify the pressure dependence of thermodynamic properties, the calculated Helmholtz free energy F, entropy S, and heat capacity Cv of AgGaS2 at different temperatures (from 200 K to 1000 K, with intervals of 200 K) and different pressures (from 0 GPa to 4 GPa with intervals of 1 GPa) are listed in Table 3.
Table 3 shows that the entropy and heat capacity linearly decrease approximately with the increase of the pressure at a constant temperature. The Helmholtz free energy has an opposite trend with the pressure change. The data in Table 3 also indicates that the impact of the temperature on the thermodynamic properties is more significant than that of the pressure. For example, the calculated S at 200 K are 105.39 and 102.44 J/K·mol under 0 and 4 GPa, respectively.

4. Conclusions

The structural, vibrational and thermodynamic properties of the chalcopyrite-type compound AgGaS2 under different hydrostatic pressures were investigated by using the first-principles calculation and quasi-harmonic approximation. The calculated lattice constants before applying pressure are consistent with the previous experimental and theoretical reports. The lattice constants and bond lengths were observed to decrease with increasing pressure, which leads to a higher phonon frequency of the optical branches. By using the phonon dispersion curve analysis at different pressures, we found that the chalcopyrite-type compound AgGaS2 is dynamically unstable above 4 GPa. The Grüneisen parameters at different pressures were obtained, and these indicate that AgGaS2 has negative coefficient of thermal expansion. The analysis of the vibrational modes and Grüneisen parameters reveals that structural instability is associated with the softening of the E vibrational mode at around the center point Γ. Increasing external pressure is a direct and effective method to reduce the thermal conductivity for chalcopyrite-type compound AgGaS2. The thermodynamic properties for AgGaS2, such as the Helmholtz free energy, entropy, and heat capacity, were analyzed at different temperatures and pressures. The results shown in this work provide guidelines for future single-crystal synthesis, the Raman spectroscopic study, and thermoelectric application of AgGaS2 under pressure.

Author Contributions

J.H.Y. and Q.F. contributed equally to this work. Q.F. and W.B.Z. designed the model; J.H.Y. and Q.F. performed the methodology and prepared the original draft; Q.F. and Y.Y. analyzed the data; all authors contributed to the review and editing.

Funding

This work was funded by National Natural Science Foundation of China (grant number: 11704049), Scientific Research Foundation of the Education Department of Sichuan Province (grant number: 17ZA0195, 18CZ0030), LeShan Normal University (grant number: Z16016) and Science and Technology Bureau of Leshan city (grant number: 17GZD048).

Conflicts of Interest

The authors declare no conflict of interest.

References

  1. Li, W.; Li, Y.; Xu, Y.; Lu, J.; Wang, P.; Du, J.; Leng, Y. Measurements of nonlinear refraction in the mid-infrared materials ZnGeP2 and AgGaS2. Appl. Phys. B 2017, 123. [Google Scholar] [CrossRef]
  2. Xue, D.; Betzler, K.; Hesse, H. Dielectric properties of I-III-VI2-type chalcopyrite semiconductors. Phys. Rev. B 2000, 62, 13546–13551. [Google Scholar] [CrossRef]
  3. Hörig, W.; Neumann, H.; Sobotta, H.; Schumann, B.; Kühn, G. The optical properties of CuInSe2 thin films. Thin Solid Films 1978, 48, 67–72. [Google Scholar] [CrossRef]
  4. Feng, W.; Xiao, D.; Ding, J.; Yao, Y. Three-Dimensional Topological Insulators in I-III-VI2 and II-IV-V2 Chalcopyrite Semiconductors. Phys. Rev. Lett. 2011, 106, 16402. [Google Scholar] [CrossRef] [PubMed]
  5. Xia, Z.; Wang, G.; Zhou, X.; Wen, W. Substitution defect enhancing thermoelectric properties in CuInTe2. Mater. Res. Bull. 2018, 101, 184–189. [Google Scholar] [CrossRef]
  6. Wang, K.; Qin, P.; Ge, Z.; Feng, J. Highly enhanced thermoelectric properties of p-type CuInSe2 alloys by the Vacancy Doping. Scr. Mater. 2018, 149, 88–92. [Google Scholar] [CrossRef]
  7. Yang, J.H.; Fan, Q.; Cheng, X.L. Prediction for electronic, vibrational and thermoelectric properties of chalcopyrite AgX(X = In, Ga)Te2: PBE + U approach. R. Soc. Open Sci. 2017, 4, 170750. [Google Scholar] [CrossRef] [PubMed]
  8. Hollingsworth, J.A.; Banger, K.K.; Jin, M.H.C.; Harris, J.D.; Cowen, J.E.; Bohannan, E.W.; Switzer, J.A.; Buhro, W.E.; Hepp, A.F. Single source precursors for fabrication of I–III–VI2 thin-film solar cells via spray CVD. Thin Solid Films 2003, 431–432, 63–67. [Google Scholar] [CrossRef]
  9. Termsaithong, P.; Tubtimtae, A. Boron-doped CuInTe2 semiconductor-sensitized liquid-junction solar cells. Mater. Lett. 2015, 138, 41–44. [Google Scholar] [CrossRef]
  10. Ghosh, A.; Thangavel, R.; Rajagopalan, M. Electronic and optical modeling of solar cell compound CuXY2 (X = In, Ga, Al; Y = S, Se, Te): First-principles study via Tran–Blaha-modified Becke–Johnson exchange potential approach. J. Mater. Sci. 2015, 50, 1710–1717. [Google Scholar] [CrossRef]
  11. Paderick, S.; Kessler, M.; Hurlburt, T.J.; Hughes, S.M. Synthesis and characterization of AgGaS2 nanoparticles: A study of growth and fluorescence. Chem. Commun. 2018, 54, 62–65. [Google Scholar] [CrossRef] [PubMed]
  12. Migal, E.A.; Potemkin, F.V.; Gordienko, V.M. Highly efficient optical parametric amplifier tunable from near- to mid-IR for driving extreme nonlinear optics in solids. Opt. Lett. 2017, 42, 5218–5221. [Google Scholar] [CrossRef] [PubMed]
  13. Fan, C.; Regulacio, M.D.; Ye, C.; Lim, S.H.; Zheng, Y.; Xu, Q.; Xu, A.; Han, M. Colloidal synthesis and photocatalytic properties of orthorhombic AgGaS2 nanocrystals. Chem. Commun. 2014, 50, 7128–7131. [Google Scholar] [CrossRef] [PubMed]
  14. Zawilski, K.T.; Schunemann, P.G.; Pollak, T.C.; Zelmon, D.E.; Fernelius, N.C.; Kenneth Hopkins, F. Growth and characterization of large CdSiP2 single crystals. J. Cryst. Growth 2010, 312, 1127–1132. [Google Scholar] [CrossRef]
  15. Holah, G.D.; Webb, J.S.; Montgomery, H. Lattice dynamics of AgGaS2. J. Phys. C Solid State Phys. 1974, 7, 3875. [Google Scholar] [CrossRef]
  16. Neumann, H.; Nowak, E. High temperature heat capacity and Grüneisen functions in AgGaS2. J. Less Common Met. 1989, 146, L7–L10. [Google Scholar] [CrossRef]
  17. Łażewski, J.; Parlinski, K. Lattice dynamics and elasticity of silver thiogallate (AgGaS2) from ab initio calculations. J. Chem. Phys. 2001, 114, 6734–6738. [Google Scholar] [CrossRef]
  18. Wei, L.; Wang, X.P.; Liu, B.; Zhang, Y.Y.; Lv, X.S.; Yang, Y.G.; Zhang, H.J.; Zhao, X. The role of acoustic phonon anharmonicity in determining thermal conductivity of CdSiP2 and AgGaS2: First principles calculations. AIP Adv. 2015, 5, 127236. [Google Scholar] [CrossRef]
  19. Kushwaha, A.K.; Khenata, R.; Bouhemadou, A.; Bin-Omran, S.; Haddadi, K. Lattice Dynamical Properties and Elastic Constants of the Ternary Chalcopyrite Compounds CuAlS2, CuGaS2, CuInS2, and AgGaS2. J. Electron. Mater. 2017, 46, 4109–4118. [Google Scholar] [CrossRef]
  20. Sist, M.; Zhang, J.; Brummerstedt Iversen, B. Crystal structure and phase transition of thermoelectric SnSe. Acta Cryst. B Struct. Sci. Cryst. Eng. Mater. 2016, 72, 310–316. [Google Scholar] [CrossRef] [PubMed]
  21. Li, X.; Tao, Y.; Peng, F. Pressure and temperature induced phase transition in WB4: A first principles study. J. Alloys Compd. 2016, 687, 579–585. [Google Scholar] [CrossRef]
  22. Javaid, S.; Javed Akhtar, M.; Ahmad, I.; Younas, M.; Shah, S.H.; Ahmad, I. Pressure driven spin crossover and isostructural phase transition in LaFeO3. J. Appl. Phys. 2013, 114, 243712. [Google Scholar] [CrossRef]
  23. Reddy, P.V.S.; Kanchana, V. Enhanced superconductivity in SnSb under pressure: A first principles study. J. Phys. Condens. Matter 2017, 29, 405502. [Google Scholar] [CrossRef] [PubMed]
  24. Chong, X.; Jiang, Y.; Zhou, R.; Feng, J. Pressure dependence of electronic structure and superconductivity of the MnX (X  =  N, P, As, Sb). Sci. Rep. 2016, 6. [Google Scholar] [CrossRef] [PubMed]
  25. Borinaga, M.; Iba Nez-Azpiroz, J.; Bergara, A.; Errea, I. Strong Electron-Phonon and Band Structure Effects in the Optical Properties of High Pressure Metallic Hydrogen. Phys. Rev. Lett. 2018, 120, 57402. [Google Scholar] [CrossRef] [PubMed] [Green Version]
  26. Javed, Y.; Rafiq, M.A.; Ahmed, N. Pressure-induced changes in the electronic structure and enhancement of the thermoelectric performance of SnS2: A first principles study. RSC Adv. 2017, 7, 38834–38843. [Google Scholar] [CrossRef]
  27. Hu, J.; Shi, L.; Qin, Y.; Jin, F.; Duan, Y.; Qiu, L.; Chen, L. Phase transitions, band structures, elastic and lattice dynamic properties of CdSnV2 (V = P, As, Sb) under pressure from first principles. Mater. Sci. Semicond. Proc. 2015, 35, 149–161. [Google Scholar] [CrossRef]
  28. Li, Y.; Lin, J.; Fang, Z.; Qiu, M.; Huang, X.; Ding, K.; Chen, W.; Zhang, Y. Pressure-tuning the nonlinear-optical properties of AgGaS2 crystal: A first-principle study. Opt. Mater. Express 2015, 5, 1738–1751. [Google Scholar] [CrossRef]
  29. Carlone, C.; Olego, D.; Jayaraman, A.; Cardona, M. Pressure dependence of the Raman modes and pressure-induced phase changes in CuGaS2 and AgGaS2. Phys. Rev. B 1980, 22, 3877–3885. [Google Scholar] [CrossRef]
  30. Kitahara Eba, H.; Ishizawa, N.; Marumo, F.; Noda, Y. Synchrotron X-ray study of the monoclinic high-pressure structure of AgGaS2. Phys. Rev. B 2000, 61, 3310–3316. [Google Scholar] [CrossRef]
  31. Kresse, G.; Furthmuller, J. Efficient iterative schemes for ab initio total-energy calculations using a plane-wave basis set. Phys. Rev. B Condens. Matter 1996, 54, 11169–11186. [Google Scholar] [CrossRef] [PubMed]
  32. Togo, A.; Tanaka, I. First principles phonon calculations in materials science. Scr. Mater. 2015, 108, 1–5. [Google Scholar] [CrossRef] [Green Version]
  33. Chahed, A.; Benhelal, O.; Rozale, H.; Laksari, S.; Abbouni, N. Structural and electronic properties of chalcopyrite semiconductors AgXY2 (X = In, Ga; Y = S, Se, Te) under pressure. Phys. Status Solidi 2007, 244, 629–634. [Google Scholar] [CrossRef]
  34. Abrahams, S.C.; Bernstein, J.L. Crystal structure of piezoelectric nonlinear-optic AgGaS2. J. Chem. Phys. 1973, 59, 1625–1629. [Google Scholar] [CrossRef]
  35. Xiao, H.; Tahir-Kheli, J.; Goddard, W.A. Accurate Band Gaps for Semiconductors from Density Functional Theory. J. Phys. Chem. Lett. 2011, 2, 212–217. [Google Scholar] [CrossRef] [Green Version]
  36. Ullah, S.; Din, H.U.; Murtaza, G.; Ouahrani, T.; Khenata, R.; Naeemullah; Bin Omran, S. Structural, electronic and optical properties of AgXY2(X = Al, Ga, In and Y = S, Se, Te). J. Alloys Compd. 2014, 617, 575–583. [Google Scholar] [CrossRef]
  37. Chen, S.; Gong, X.G.; Wei, S. Band-structure anomalies of the chalcopyrite semiconductors CuGaX2 versus AgGa2(X = S and Se) and their alloys. Phys. Rev. B 2007, 75, 205209. [Google Scholar] [CrossRef]
  38. Orlova, N.S.; Andreeva, O.E.; Bodnar, I.V. Pressure Effects on the Structural and Elastic Properties of AgGaS2-AgGaSe2 Crystals: An X-ray Diffraction Study. Inorg. Mater. 2001, 37, 548–555. [Google Scholar] [CrossRef]
  39. Mori, Y.; Takarabe, K.; Iwamoto, S.; Minomura, S.; Niwa, E.; Masumoto, K. High Pressure Structural Study of I–III–VI2 Chalcopyrites. Phys. Status Solidi 1996, 198, 427–431. [Google Scholar] [CrossRef]
  40. Zhou, G.; Wang, D. High thermoelectric performance from optimization of hole-doped CuInTe2. Phys. Chem. Chem. Phys. 2016, 18, 5925–5931. [Google Scholar] [CrossRef] [PubMed]
  41. Koschel, W.H.; Bettini, M. Zone-centered phonons in AIBIIIS2 chalcopyrites. Phys. Status Solidi 1975, 72, 729–737. [Google Scholar] [CrossRef]
  42. Ohrendorf, F.W.; Haeuseler, H. Lattice Dynamics of Chalcopyrite Type Compounds. Part I. Vibrational Frequencies. Cryst. Res. Technol. 1999, 34, 339–349. [Google Scholar] [CrossRef]
  43. Milman, V.; Perlov, A.; Refson, K.; Clark, S.J.; Gavartin, J.; Winkler, B. Structural, electronic and vibrational properties of tetragonal zirconia under pressure: A density functional theory study. J. Phys. Condens. Matter 2009, 21, 485404. [Google Scholar] [CrossRef] [PubMed]
  44. Sheremetyeva, N.; Cherniak, D.J.; Watson, E.B.; Meunier, V. Effect of pressure on the Raman-active modes of zircon (ZrSiO4): A first-principles study. Phys. Chem. Miner. 2017. [Google Scholar] [CrossRef]
  45. Yang, M.; Cheng, X.; Li, Y.; Ren, Y.; Liu, M.; Qi, Z. Anharmonicity of monolayer MoS2, MoSe2, and WSe2: A Raman study under high pressure and elevated temperature. Appl. Phys. Lett. 2017, 110, 93108. [Google Scholar] [CrossRef]
  46. Shirakata, S. Raman scattering and its hydrostatic pressure dependence in ZnGeP2 crystal. J. Appl. Phys. 1999, 85, 3294–3300. [Google Scholar] [CrossRef]
  47. Zhang, Y.; Hao, S.; Zhao, L.; Wolverton, C.; Zeng, Z. Pressure induced thermoelectric enhancement in SnSe crystals. J. Mater. Chem. A 2016, 4, 12073–12079. [Google Scholar] [CrossRef]
  48. Zhang, Y. First-principles Debye–Callaway approach to lattice thermal conductivity. J. Materiomics 2016, 2, 237–247. [Google Scholar] [CrossRef]
  49. Morelli, D.T.; Heremans, J.P.; Slack, G.A. Estimation of the isotope effect on the lattice thermal conductivity of group IV and group III–V semiconductors. Phys. Rev. B 2002, 66, 195304. [Google Scholar] [CrossRef]
  50. Neumann, H.; Łażewski, J.; Jochym, P.T.; Parlinski, K. Ab initio heat capacity and atomic temperature factors of chalcopyrites. Phys. Rev. B 2007, 75, 224301. [Google Scholar] [CrossRef]
  51. Abrahams, S.C.; Hsu, F.S.L. Debye temperatures and cohesive properties. J. Chem. Phys. 1975, 63, 1162–1165. [Google Scholar] [CrossRef]
  52. Sharma, S.; Verma, A.S.; Jindal, V.K. Ab initio studies of structural, electronic, optical, elastic and thermal properties of silver gallium dichalcogenides (AgGaX2: X = S, Se, Te). Mater. Res. Bull. 2014, 53, 218–233. [Google Scholar] [CrossRef]
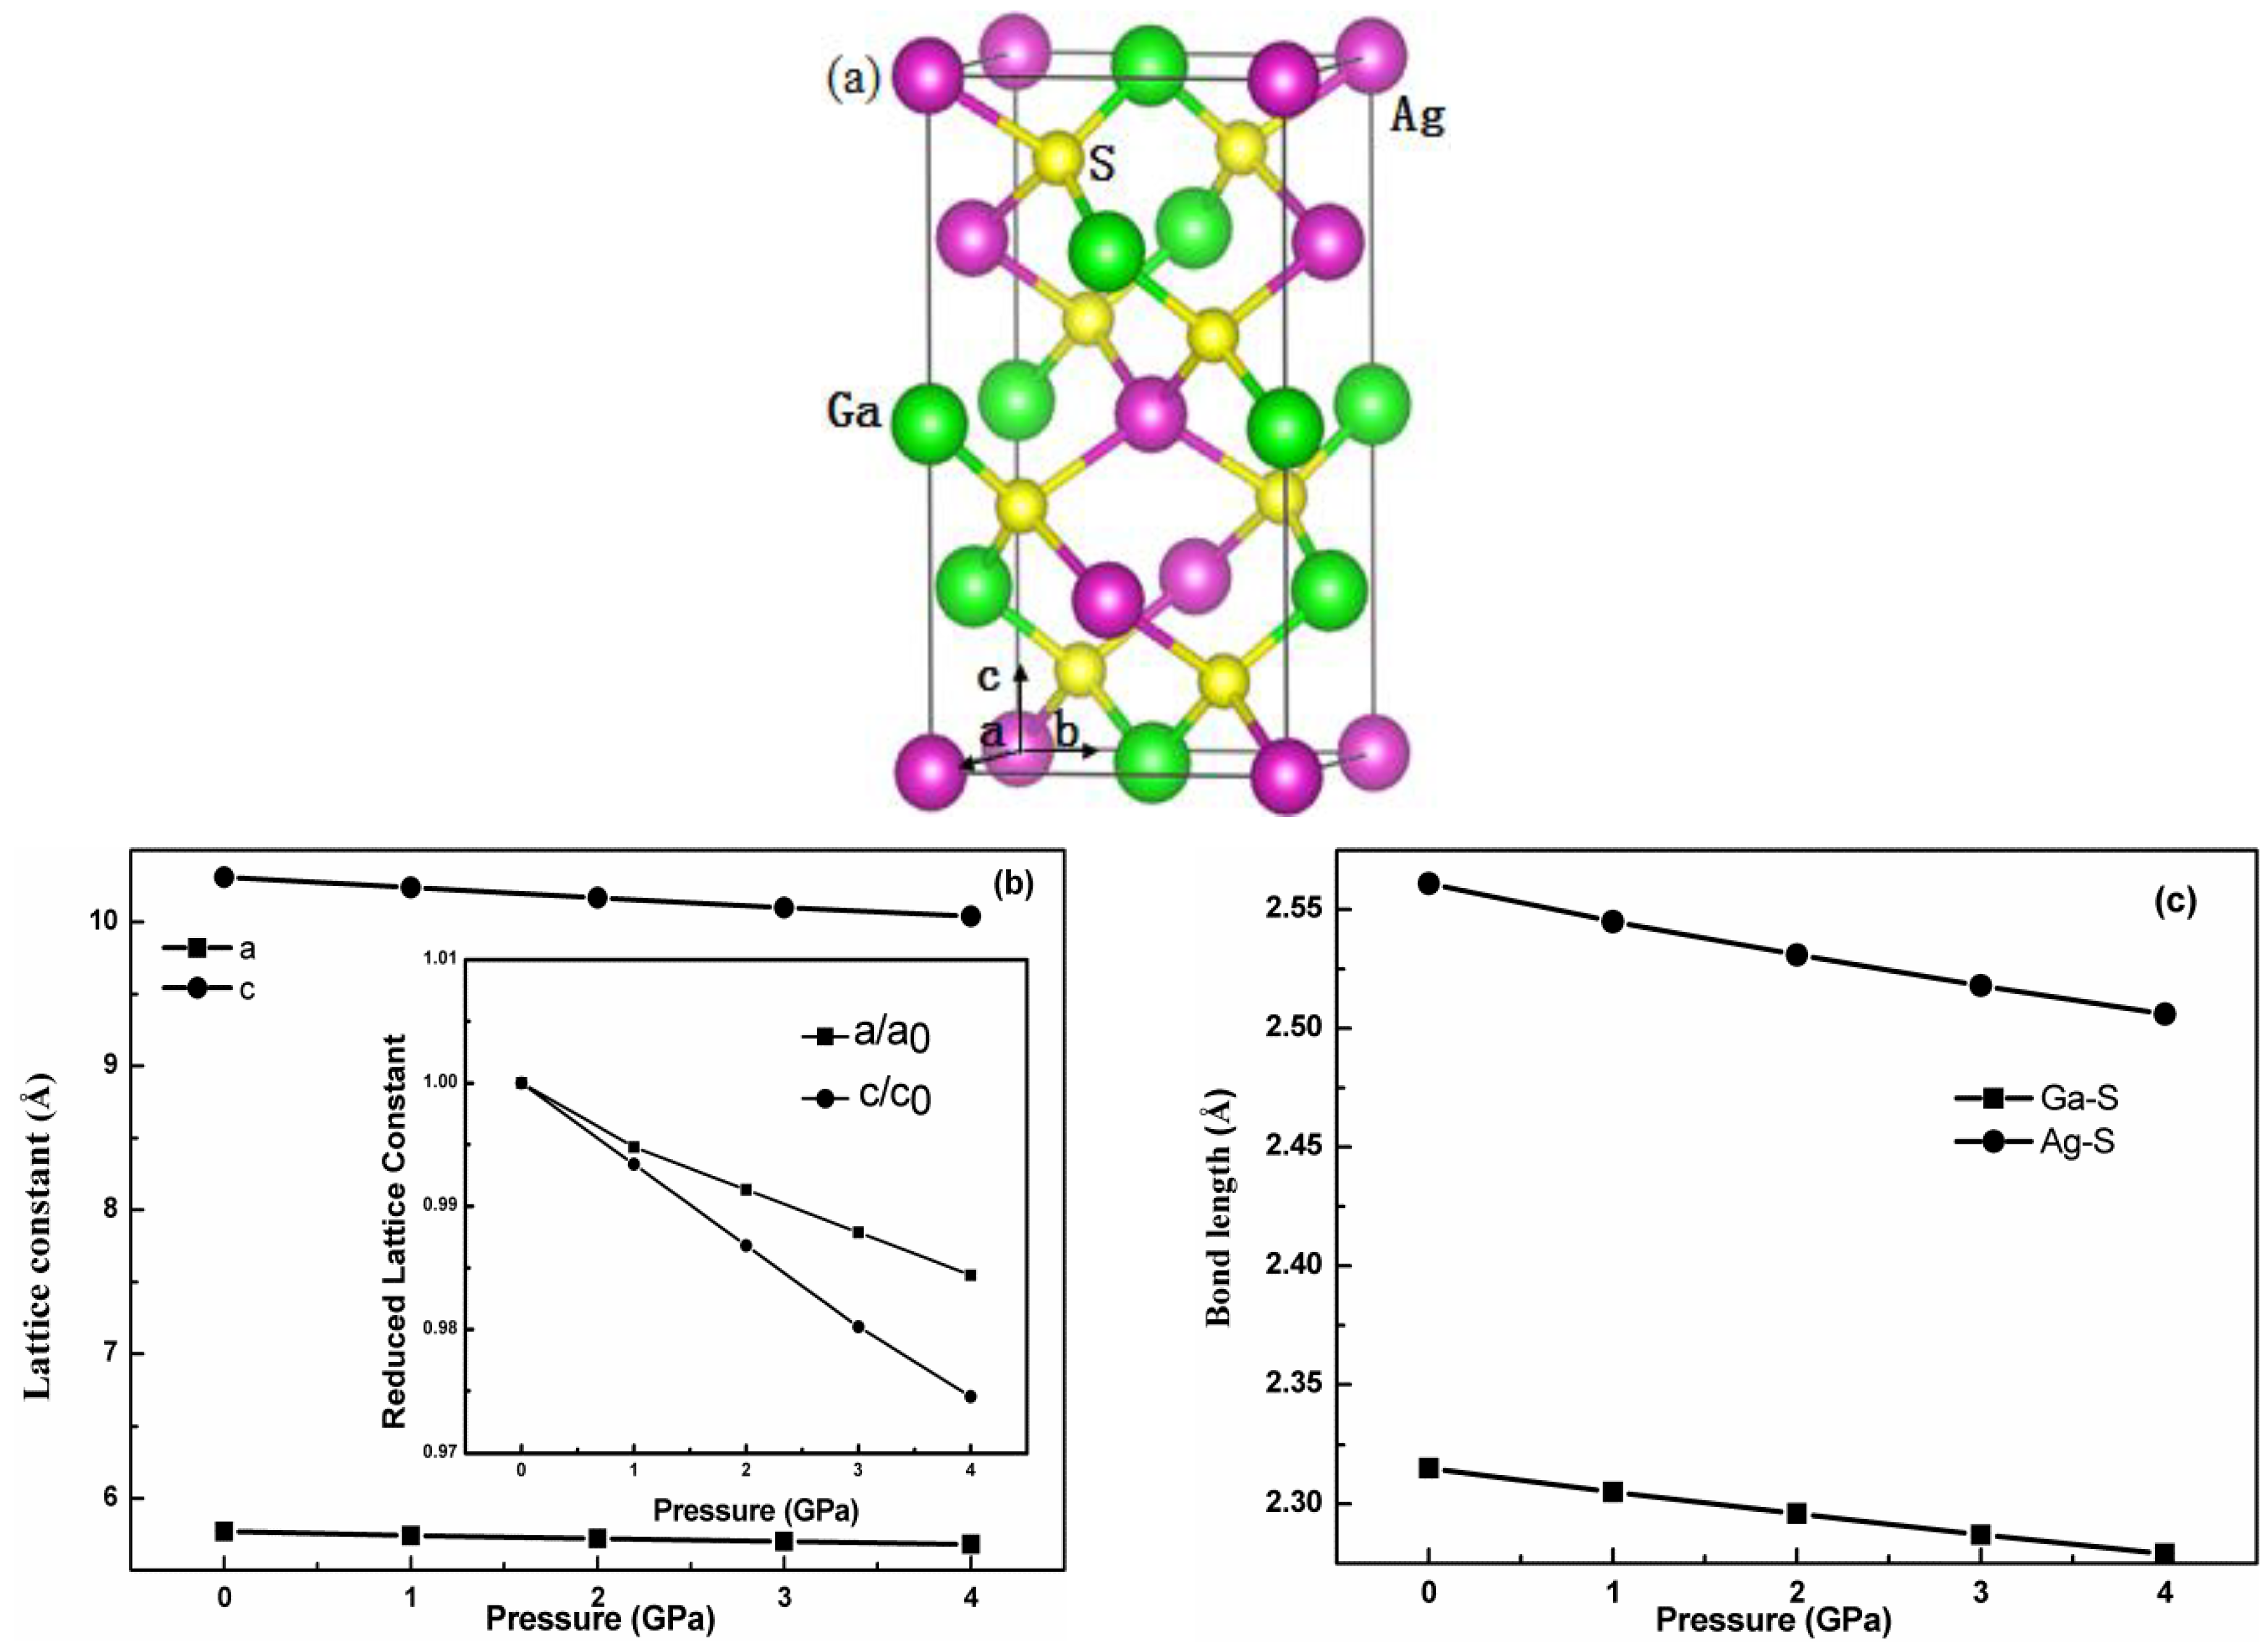
Figure 1. (a) Crystal structure, (b) calculated lattice constants, and (c) bond lengths of Ga-S and Ag-S for the chalcopyrite-type compound AgGaS2 as a function of the hydrostatic pressure.
Materials 11 02370 g001
Figure 2. Phonon spectrums along the high-symmetry directions of AgGaS2 at different hydrostatic pressures: (a) 0 Gpa; (b) 2 Gpa; (c) 4 Gpa; (d) 5 Gpa.
Materials 11 02370 g002
Figure 3. Total and partial phonon densities of the states (DOS) of AgGaS2 at 0 GPa.
Materials 11 02370 g003
Figure 4. Mode Grüneisen parameter of acoustic phonons for AgGaS2 along high symmetry points at 0 GPa.
Materials 11 02370 g004
Figure 5. Comparison of theoretical and measured heat capacity of AgGaS2 as a function of temperature. The theoretical Cv data are collected from the ab initio calculation (filled circle) [50]. The measured Cp (open circle and open square) values are taken from literature [16,51].
Materials 11 02370 g005
Figure 6. The temperature dependence of the Helmholtz free energy F, entropy S, and heat capacity Cv of AgGaS2 at 0 pressure.
Materials 11 02370 g006
Table 1. Calculated frequencies of the optical phonons (THz) at center point Γ of the Brillouin zone.
Irreps0 GPa1 GPa2 GPa3 GPa4 GPa
Reference [19]Reference [41]
A18.168.888.858.368.518.839.00
A29.8710.17 10.0710.2610.4410.60
B17.066.84 7.237.397.557.69
9.2910.1110.209.519.719.9110.09
5.425.765.705.475.525.575.61
1.671.591.621.711.751.781.81
B2 (LO/TO)10.03/10.0012.06/11.0711.94/10.9210.27/10.2310.50/10.4510.74/10.6610.94/10.85
6.37/5.967.17/6.427.14/6.366.57/6.116.75/6.246.94/6.387.11/6.50
1.80/1.801.95/1.921.921.81/1.811.84/1.841.86/1.861.88/1.88
E (LO/TO)10.96/10.6112.06/11.2211.88/11.0411.17/10.8311.37/11.0411.57/11.2511.74/11.43
9.29/8.9110.56/9.7810.47/9.759.51/9.129.71/9.309.91/9.5010.08/9.66
6.64/6.537.02/6.756.96/6.786.76/6.576.91/6.897.10/7.007.27/7.12
4.56/4.504.89/4.474.80/4.714.62/4.574.69/4.654.76/4.724.83/4.79
2.80/2.772.77/2.772.852.84/2.802.87/2.862.90/2.892.91/2.91
1.07/1.071.07/0.991.020.98/0.980.89/0.890.79/0.790.67/0.67
Table 2. The average of the Grüneisen parameters along the high-symmetry path for AgGaS2.
High-Symmetry Path0 GPa1 GPa2 GPa3 GPa4 GPa
Z-Γ1.651.761.852.216.33
Γ-X1.391.611.732.987.86
X-P1.191.181.151.181.79
P-Γ1.731.781.801.835.67
Table 3. Helmholtz free energy F (kJ/mol), entropy S (J/K·mol), and heat capacity Cv (J/K·mol) of AgGaS2 at temperature T (K) and pressure P (GPa).
TP0 GPa1 GPa2 GPa3 GPa4 GPa
200F2.602.923.243.553.78
S105.39104.57103.68102.92102.44
Cv83.5182.9482.3981.8481.35
400F−25.33−24.81−24.28−23.79−23.44
S167.98166.91165.78164.77164.07
Cv95.0594.8697.4394.4794.30
600F−63.08−62.35−61.58−60.88−60.38
S207.10205.98204.79203.72202.98
Cv97.6197.5297.4397.3497.25
800F−107.46−106.49−105.49104.57−103.92
S235.33234.18232.98231.89231.13
Cv98.5498.4998.4498.3898.34
1000F−156.81−155.61−154.36−153.23−152.43
S257.37256.22255.00253.90253.13
Cv98.9898.9598.9198.8898.85